Article

Influence of Aged Biochar Modified by Cd2+ on Soil Properties and Microbial Community

1
Guangdong Industrial Contaminated Site Remediation Technology and Equipment Engineering Research Center, School of Environmental Science and Engineering, Guangdong University of Technology, Guangzhou 510006, China
2
Department of Ecology, College of Natural Resources and Environment, South China Agricultural University, Guangzhou 510642, China
3
Key Laboratory of Vegetation Restoration and Management of Degraded Ecosystems, South China Botanical Garden, Chinese Academy of Sciences, Guangzhou 510650, China
4
Department of Agricultural Chemistry, National Taiwan University, Taipei 10617, Taiwan
*
Author to whom correspondence should be addressed.
Sustainability 2020, 12(12), 4868; https://doi.org/10.3390/su12124868
Submission received: 13 May 2020 / Revised: 9 June 2020 / Accepted: 10 June 2020 / Published: 15 June 2020
(This article belongs to the Section Environmental Sustainability and Applications)

Abstract

:
Biochar is a promising addition for cadmium-contaminated soil in-situ remediation, but its surface properties change after aging, cadmium adsorption is not well-documented, and subsequent environmental effects are still unknown. In this study, wood-derived (Eucalyptus saligna Sm.) biochar was pre-treated to simulate aging and the cadmium sorption process. We then analyzed the resulting physicochemical characteristics. We conducted comparative incubation studies on three age stages of biochar under cadmium adsorption or no cadmium adsorption and then measured soil properties and microbial communities after incubation. Biochar addition raised soil organic carbon (SOC), and aging significantly increased C/N ratios. Aged biochar promoted higher microbial abundance. Aged biochar treatments possessed different microflora with more gram-positive bacteria, significantly altering gram-positive/gram-negative bacteria ratios. Aging significantly increased the oxygen-containing functional groups (OCFGs) and surface area (SA) of biochar. Thus, aged biochar adsorbed more cadmium. Cadmium-binding biochar increased the proportion of gram-negative bacteria and decreased the proportions of gram-positive bacteria and fungi. Similar patterns in phospholipid fatty acids (PLFAs) across adsorption treatments indicated that changes in microbial communities due to the effects of cadmium were confined. The results reveal that biochar aging altered microbial community structure and function more than cadmium binding.

1. Introduction

Biochar is produced by the pyrolysis of biomass under a limited oxygen supply in a controlled environment [1]. With high surface area (SA), porosity, and abundant functional groups, biochar can effectively reduce heavy metals (e.g., cadmium) mobility and availability in soil (via adsorption, cation exchange, surface complexation, and precipitation) and has been extensively studied and applied in situ for contaminated soil remediation [2]. However, the performance of biochar in soil remediation relies on the biochar’s properties and its interactions with soil components [3,4,5,6], which progressively change with soil incorporation.
In the soil, biochar’s properties change by reason of physical processes and biochemical oxidation reactions [7], collectively known as biochar aging. In the aging progress, the breakdown of aromatic ring structures and the oxidation at the biochar’s surface can engender functional groups such as carboxyls and hydroxyls, making the biochar more reactive with soil minerals and pollutants [8]. Schimmelpfennig and Glaser [9] found that biochar with more functional groups on particle surfaces was less stable. Aged biochar provides more substrate for microbial degradation, which decreases its stability [10] due to hydrophilic functional groups and active carbon [11]. However, heavy metals (e.g., cadmium) act as ionic bond bridges for carboxyls and hydroxyls [12,13], combine with functional groups, and result in the formation of Cd-complexes on the biochar surface [14]. These reactions change the properties of biochar and, in turn, increase biochar stability [15]. Thus, both biochar aging and cadmium adsorption change surface characteristics, thereby affecting soil properties and edaphon.
Microorganisms respond sensitively to soil environmental changes and, therefore, serve as an indicator of recovery procedures of contaminated sites [16]. Previous research suggests that biochar-mediated changes in contaminated soil can modify microbial activity [17,18], increase microbial abundance [19], and even change microbial community structure [20]. Guehomyces pullulans increase and Fusarium decrease for biochar addition [21]. Meanwhile, microorganisms with different physiological and metabolic functions may lead to different decomposition capacities, for example, basidiomycetes and gram-positive bacteria decompose aromatic carbon [21,22]. The degradation of biochar likely introduces desorption of heavy metals, yet microbial community structure is indicative of pollution risk [16]. Therefore, the microbial community structure is a vital constituent of sorption–desorption monitoring in contaminated soils, especially those undergoing long-term biochar remediation. However, little is known about how microbial communities change during the biochar aging and cadmium adsorption processes.
The process of biochar aging is relatively slow for the inert nature of biochar, therefore, the changes in biochar composition are so small that it is difficult to detect for any practical experimental period [23]. Consequently, artificial aging methods have been developed to imitate the natural aging of biochar [24,25], such as chemical oxidation with hydrogen peroxide (H2O2) [26,27]. Simulated aging in the laboratory with H2O2 likely causes analogous changes to biochar that can be used as a natural aging agent [26,28]. It would also be possible to test the properties of biochar at different ages by using different concentrations of H2O2 [29]. Biochar aging in cadmium-contaminated soil involves complex interactions among the soil matrix, microbial community, and cadmium. While the physical and chemical properties of aging biochar have been extensively studied, there are still considerable gaps in understanding the consequences of aging and cadmium adsorption on community composition and the environment.
This study simulates the natural aging of biochar via H2O2 oxidation and characterizes its physicochemical changes throughout the process via Brunauer–Emmett–Teller (BET), elemental, FT-IR, Boehm titration, and cadmium adsorption analyses. Additionally, we conducted incubation experiments to detect the subsequent environmental and ecological effects. These results reveal the effects that biochar aging and cadmium adsorption have on soil properties and microbial communities, elucidating potential long-term effects of these processes.

2. Materials and Methods

2.1. Soil and Biochar

Soil was collected from the surface layer (0–20 cm) of cropland area covered by vegetables located in the Panyu district of Guangzhou, China (22° 99′ N and 113° 42′ E), which belong to subtropical humid area. The soil is categorized as a fimic anthrosol by FAO [19]. After the removal of fine roots and debris, individual samples were homogenized and filtered through a 2 mm sieve before undergoing physicochemical analyses and incubation experiments.
Slow pyrolysis biochar was produced from eucalyptus wood (Eucalyptus saligna Sm.) at 500 ℃ (maximum treatment temperature) for two hours in a vertical kiln and sieved through 2 mm mesh. Then, the biochar was oxidized at different concentrations (5% and 10%) of H2O2 (1:30, m/v) at 80 ℃ for 6 h in a hot water bath. After simulated aging, the biochar slurries were dried at 120 ℃ to off excess H2O2 and H2O. Meanwhile, fresh biochar (FBC) was treated with deionized water under the same conditions. Subsequently, both fresh and oxidized biochar were rinsed with deionized water on 0.45 mm glass filter paper (Whatman #934-AH) until the conductivity of the leachate was below 5.0 mS cm−1 and then vacuum-dried before use in the physical and chemical properties detection and subsequent experiments. Fresh biochar is hereafter designated FBC and oxidized biochar as 5% OBC and 10% OBC corresponding to H2O2 treatment concentration.

2.2. Characterization of Biochar

2.2.1. Specific Surface Area and Porosity

We used Brunauer–Emmett–Teller (BET) analyses to measure the specific surface area, pore volume, and size of the biochar via gas adsorption–desorption at 120 °C with a surface area and porosity analyzer (ASAP 2460, Micromeritics Instrument China, Shanghai). The adsorption gas is nitrogen [30].

2.2.2. Elemental Analysis

We analyzed the content of C, N, H, and O in biochar samples through a Euro Vector EA3000 combustion analyzer with argon as carrier gas [28].

2.2.3. Fourier-Transform Infrared Spectroscopy (FT-IR)

Fourier-transform infrared spectroscopy (FT-IR) was used to compare the prospective variations in functional groups of the fresh and aged biochar (Nicolet 6700, Thermo Fisher, USA). The biochar samples were pressed into tableting with spectral grade KBr and scanned from 4000 cm−1 to 400 cm−1 wavenumbers at a resolution of 4 cm−1 [30].

2.2.4. Boehm Titration

Oxygen-containing functional groups (OCFGs) were quantified using the Boehm titration method [31]. Biochar (0.1 g) was mixed sequentially with 20 mL of 0.05 M NaOH, 0.05 M Na2CO3 and 0.05 M NaHCO3 for 24 h each in 50 mL tubes. In order to neutralize redundant base or acid, back titrations were performed using 0.1 M HCl or NaOH, respectively. Acidic functional groups were quantified on account of that NaOH neutralizes carboxyls, lactons, and phenols. Na2CO3 neutralizes carboxyls and lactons only, and NaHCO3 neutralizes carboxyls only [30].

2.3. Batch Adsorption Experiment

CdCl2·2.5 H2O was dissolved in 0.01 mg L−1 KCl solution to prepare 100 mg L−1 Cd2+ solution [13]. 10 g of FBC, 5% OBC and 10% OBC were mixed with 1000 mL of the cadmium ion solution respectively, and pH was adjusted to 6.0 via 0.1M HCl or KOH solutions. Mixtures were then stirred on a reciprocating shaker at 120 rpm for 24 h at 25 ℃. After agitation, we filtered the suspensions immediately through 0.45 μm nylon membrane filters and measured the Cd2+ concentrations via atomic absorption spectroscopy with a multi-element lamp on the PerkinElmer Analyst 700 (PE700, USA). The wavelength was set at 228.8 nm resonance line. The adsorption experiments included blank and calibration controls. Samples were separated by a suction filter, and the residual solid was collected directly then vacuum-dried. These samples are hereafter designated FBC-Cd, 5% OBC-Cd, and 10% OBC-Cd.

2.4. Short-Term Incubation Experiment

All six types of biochar produced from oxidation and Cd adsorbing treatments were added to soil samples for the incubation experiment. Biochar was added at a ratio of 3 g per 100 g dry soil, corresponding to a standard field application rate of 82 t ha−1 (assuming soil bulk density of 1.30 g cm−3 and cultivation depth of 20 cm). Soil and biochar samples were homogeneously mixed with a stainless-steel spatula. Separate treatments without biochar were prepared as controls. All treatments (packed in 250 mL glass bottles) were autoclaved at 121 °C for 2 h and then inoculated with 10 mL of 5 × 10⁻¹ microbial suspension. Microbial suspensions were previously extracted from fresh soil collected from field sampling after filtering (5 μm). Before the incubation, soil water content was adjusted to 60% of field capacity and preserve ed throughout the experiment using repeated weighing. Field capacity moisture content was determined gravimetrically. The experiments were repeated three times, and values were averaged across replicates. After 30 days at 25 ℃ in incubation, we isolated biochar from the soil-biochar mixture with tweezers, and the soil was air-dried for subsequent analysis of soil characteristics.

2.5. Soil Characteristics

We measured soil pH, soil organic carbon (SOC), total nitrogen (TN), ammonium nitrogen (NH4-N), nitrate nitrogen (NO3-N), and available phosphorus (AP) after incubation. Soil pH was measured in distilled water (1:2.5 w/v) with a pH meter equipped with a glass electrode. SOC was measured by the potassium dichromate volumetric method. TN was determined by Kjeldahl digestion–distillation method [32]. NH4-N was determined by KCl extraction-indophenol blue colorimetry. NO3-N was measured using Phenol disulfonic acid colorimetry. AP was determined using the molybdenum blue colorimetric method after extraction with sodium bicarbonate [33].

2.6. Soil Microbial Community

We used PLFA (phospholipid fatty acid) profiles to detect microbial community structure of soil. After incubation, soil samples were refrigerant desiccated, and PLFAs were extracted with a single-phase extractant (chloroform: methanol: citric acid volumetric ratios is 1:2:0.8, pH 4.0). Neutral and glycolipids were eluted with chloroform and acetone on solid phase extraction cartridges (SPE-Si, Supelco, Poole, UK), and phospholipids were rinsed with methanol. Phospholipids were converted to fatty acid methyl esters by mild alkaline methyl acetate after fatty acid methyl ester (19:0) was added as the internal standard. The dried samples were redissolved in n-hexane and analyzed by gas chromatography (N6890, Agilent Technologies, Santa Clara, CA, USA) with MIDI peak identification system (MIDI Inc., Newark, DE, USA, version 4.5). The nonadecanoic (19:0) peak was used as rating value. The concentration of PLFAs was expressed in nmol g−1 dry soil, and the abundance of PLFAs was represented by mole percentage in each sample.

2.7. Statistical Analysis

We tested for differences among treatments using one-way and multi-factor analysis of variance followed by post-hoc least-significant difference (LSD) tests. The means of the treatments were compared by Duncan’s multiple range test. Principal component analysis (PCA) was used to analyze microbial PLFA data to reveal the major variates and covariates for individual PLFAs and microbial species using varimax rotation. Redundancy analysis (RDA) was performed to determine the main environmental factors affecting microbial communities. ANOVAs were performed using SPSS software packages (SPSS Inc., Chicago, USA, version 18.0) with significant differences as p < 0.05 or as in the particular cases. PCA and RDA analyses were performed in R (version 3.5.1 “Feather Spray”) with Vegan package (version 2.5–2).

3. Results and Discussion

3.1. Changes in Biochar Characteristics during Aging

3.1.1. Physical and Chemical Property Changes

Biochar surface area (SA) and porosity have been found to increase with biochar aging due to the removal of volatile organic compounds [34,35,36] or reduce as a result of the destruction of physical structures [37,38]. In our study, the pore volume and size showed no significant changes, while SA increased with aging from 333.72 to 347.46 m2 g−1 (Table 1). Our results are within the range found in previous studies. E.g., with respect to the fresh biochar, SA of aged biochar increased by 98–114.3% [36]. After aging, the SA of biochar increased from 407.7 to 413.3 m2 g−1 [35].
With progressive aging, we observed a decrease in C concentration and an increase in O concentration. The magnitude of the discrepancy increased with age (i.e., more aging led to greater decreases or increases, and O/C ratios increased correspondingly (Table 1)). The oxygen content likely increased due to oxygen chemisorption during the aging process, reflecting OCFGs development [7].
FT-IR scans showed changes in the intensity and pattern of absorbance peaks in biochar. Four peaks emerged for all three biochar treatments (Figure 1a): (1) A clear stretching signal for aromatic C=C at 1479 cm−1 and aromatic C-H at 875 cm−1 indicating a benzene ring as a principal part [29], (2) broad band peaks at 3430 cm−1 indicating O-H functional groups [39], (3) a peak at 1084 cm−1 corresponding to C-O stretching vibration and O-H bending modes of alcoholic, phenolic, and carboxylic groups [40], and (4) a stretching signal at 1600 cm−1 suggesting the presence of carboxylic or ketone (C=O) and phenol groups [29]. Compared with FBC, 5%OBC and 10%OBC generally had a stronger peak in corresponding regions consistent with increased aging. An IR absorbance peak emerged at 1590 cm−1 in aged biochar representing carboxylic groups [8].
Functional groups were quantified via Boehm titration analysis (Table 2). We observed the number of acidic functional groups in 5%OBC and 10%OBC to be 62.5% and 192.2% more than FBC, respectively. The acidic components included carboxylic, lactonic and phenolic groups, which increased at a rate of 50.0%, 27.3%, 76.9%, respectively, for 5%OBC, and 128.6%, 90.9%, 243.6%, respectively, for 10%OBC, when compared to FBC. Especially the carboxylic and phenolic groups of 10%OBC increased more than two times that of FBC, consistent with the C=O and O-H peaks in the FT-IR scans (Figure 1a). Biochar is highly aromatic, with aging leading to the release of the aromatic rings and forming functional groups at the breaking points. The 13C NMR spectroscopy demonstrated an increase in the relative abundance of O-alkyl C and alkyl C at the expense of aromatic-C in aged biochar [29]. Gradient variations of aged biochar from our incubations were consistent with findings on chemical oxidation [41] and field aging [42].

3.1.2. Cadmium Adsorption of Aged Biochar

The cadmium adsorption levels were 1.3 and 1.64 times larger for 5%OBC and 10%OBC, respectively, than FBC. After 24 h, the maximum adsorption capacity was 26.91 mg g−1 for 5%OBC and 35.01 mg g−1 for 10%OBC, which were higher than that for FBC (21.27 mg g−1) (Figure 2). Aged biochar had stronger sorption capacity likely due to increased surface area (from 333.72 to 347.46 m2 g−1) (Table 1) and higher OCFGs (Table 2), further evidenced by FT-IR analyses, which indicated that the mechanism of Cd immobilization was through complexation (Figure 1a). Aged biochar with higher OCFGs was more effective in cadmium adsorption than fresh biochar, corroborating previous studies [30]. Generally, aged biochar had more binding sites, and owned stronger adsorption capacity for heavy metals, aged biochar showed a higher adsorption capacity of 84.8–99.7% than that for fresh ones (63.0–99.7%) [43].

3.2. Changes in Soil Properties by Aged Biochar

After incubation with different amounts of treated biochar, we detected changes in pH, soil organic carbon (SOC), total nitrogen (TN), ammonium nitrogen (NH4-N), nitrate nitrogen (NO3-N), and available phosphorus (AP) (Table 3). Biochar enhanced SOC and significantly increased soil pH (p < 0.001). Since biochar can adsorb and fix exchangeable nitrogen (ammonium and nitrate) in soil [44,45,46] and act as a competitor versus provider of nutrients [47], its addition decreased ammonium (p < 0.01) and nitrate (p < 0.05) significantly. Reductions in available nutrients may also be attributed to sorption. Two peaks at 3622 and 3702 cm−1 (Figure 1b) which represent N-H stretches [48] emerged after incubation, suggesting exchangeable nitrogen adsorption by biochar. Biochar addition also led to significant decreases in AP (p < 0.001), which may be the result of precipitation [49,50].
Biochar aging did not significantly change most soil properties except C/N. Multi-way ANOVAs indicated that biochar aging significantly increased C/N ratio (p = 0.027). OCFGs are hydrophilic and active, which are easy to be decomposed and released [11]. At increased aging stages, labile carbon increases and releases a range of biochar-derived organic materials [29], resulting in an increase of SOC (Table 3). Despite aged biochar leading to greater N mineralization rates, via increasing the density of functional groups on its surface [51] and the stimulation of N2O emission [52], biochar aging seemingly decreased TN (Table 3). Because of the increase of SOC and decrease of TN, C/N ratios increased significantly along with advanced aging. As a carbon-rich mixture, biochar addition significantly increases SOC content. Due to the active feature of OCFGs, they have a great impact on soil nutrients, especially nitrogen content. Aging promotes the intensity of the process, which has been confirmed by many research results [53].

3.3. Interactions of Aged Biochar and Soil Microbiota

3.3.1. Changes in the Microbial Community

Soil properties were altered by aging biochar (Table 3) and, in turn, affected the composition and structure of soil microbial communities [21,54]. Multi-way ANOVAs revealed that biochar additions significantly increased the total microbial PLFAs (p < 0.05). Total PLFAs concentrations increased by 32.8%, 54.1%, 129.3% for FBC, 5%OBC and 10%OBC, respectively, compared to controls (Table 4). These results suggest that specific characteristics of aged biochar increase microbial abundance. The generation of OCFGs on aged biochar changed the proportion of labile and stable carbon components of biochar, which is manifested by the increase in easily decomposed components, such as carboxyl carbon [55]. Increased labile carbon in aged biochar provided more a abundant carbon source for microorganisms [56], thus enhanced soil microbial activity.
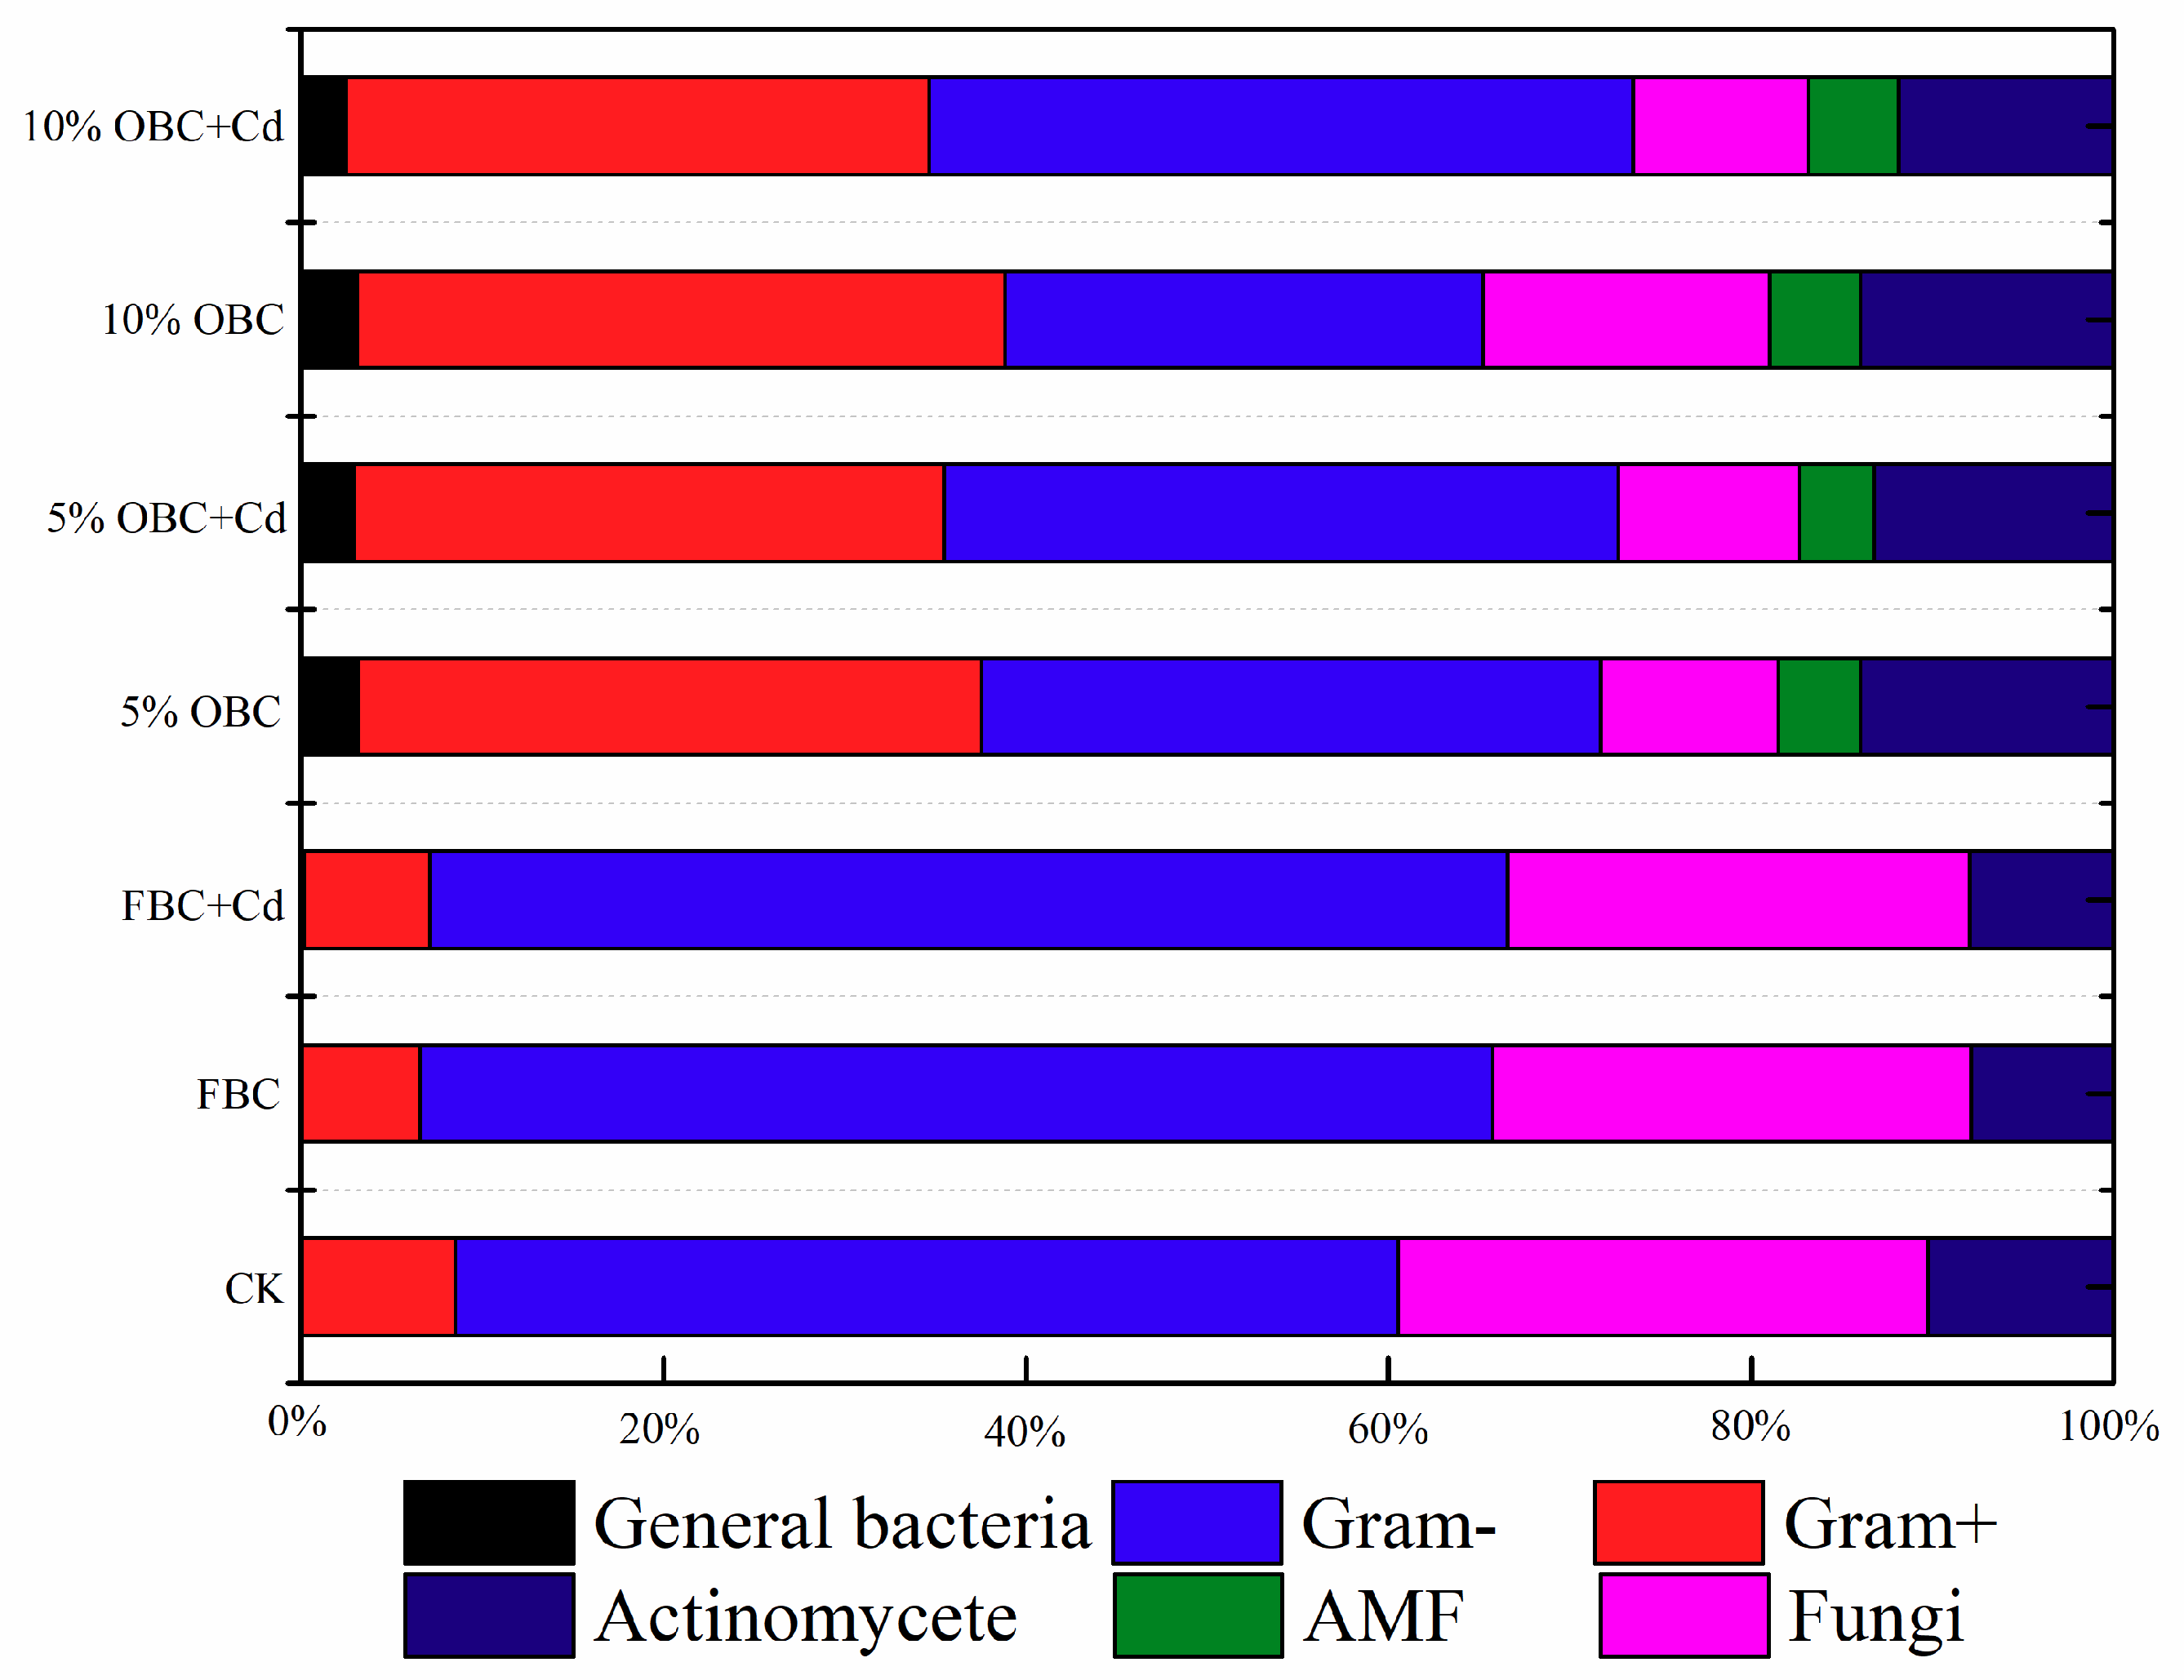
Biochar aging not only enhanced the amount of microbial biomass but also influenced the microbial community structure (Figure 3 and Table 4). Compared with control and FBC, 5%OBC and 10%OBC treatments developed different microflora, with increased aging significantly enhancing the content and proportion of gram-positive bacteria (p < 0.001) and actinomycetes (p < 0.05). Meanwhile, the proportion of gram-negative bacteria and fungi decreased with increased aging of the biochar (Figure 4). High levels of organic compounds and mineral elements in aged biochar may be harmful to the fungi [18] and gram-negative bacterial [57]. OCFGs, leading to an increase in labile organic carbon, which is beneficial to the growth and reproduction of gram-positive bacterial [21,22]. E.g., G+/G− ratios increased significantly with biochar aging (p < 0.001), corroborating previous work [16,58]. Gram-positive bacteria are known for their important role in the decomposition of aromatic carbons [21,22,59]. Higher G+/G− ratios may lead to a positive carbon depletion [16,60]. Biochar aging shifted the microbial structure to include groups more capable of aromatic mining.
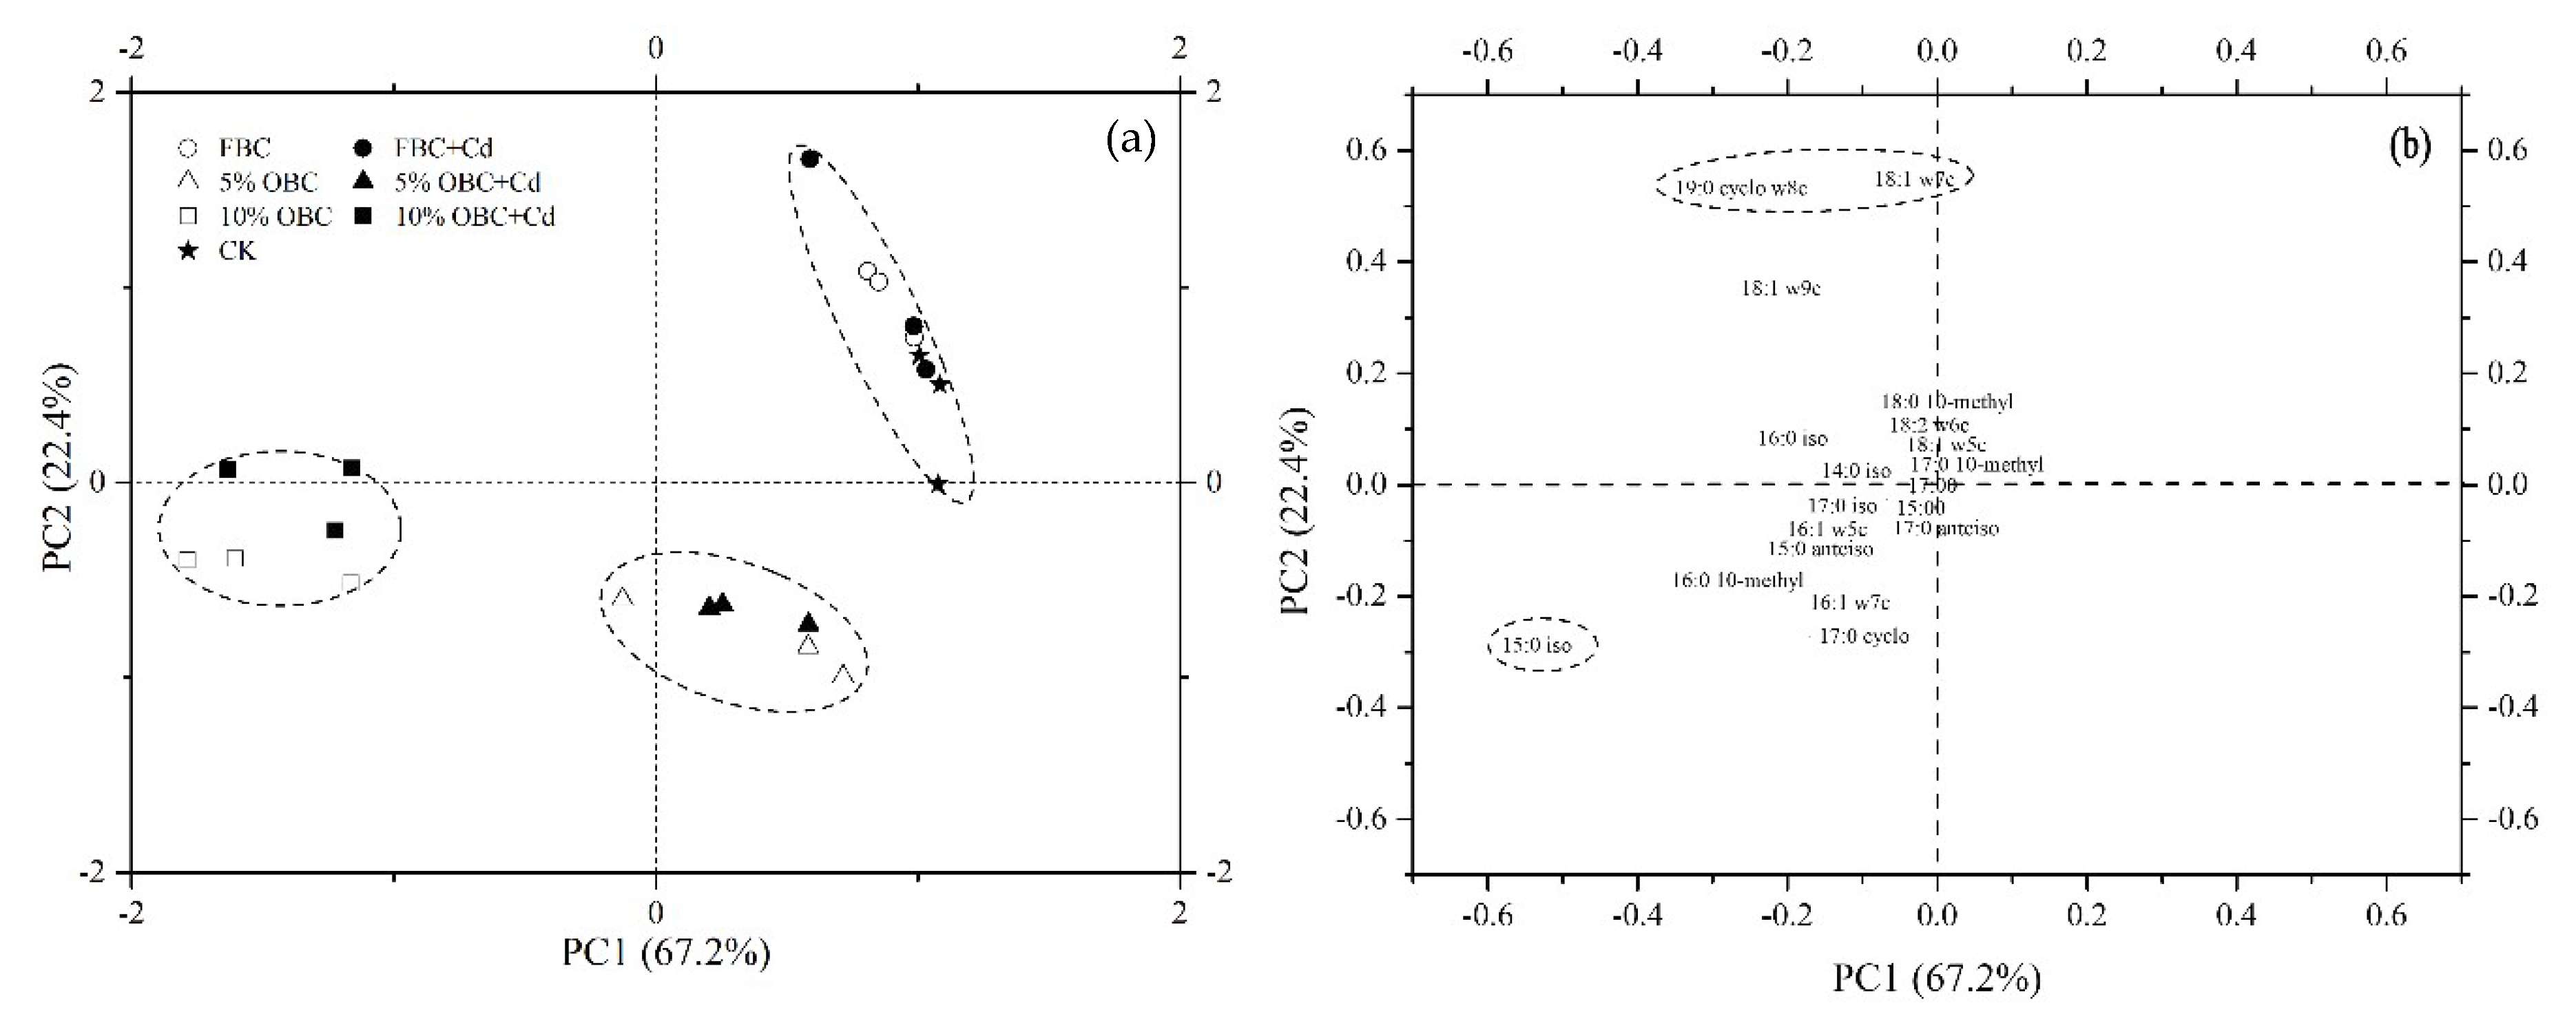
Principle Component Analysis (PCA) on the relative abundances of PLFAs showed differences in the microbial community among treatments (Figure 4). Principal components PC1 and PC2 explained 89.6% of the variation in FAME profiles (Figure 4a). PC1, which accounted for 67.2% of the variation in the PLFA data, separated the 10%OBC from other treatments. PC2 separated the aging of treatments (10%OBC versus 5%OBC) from the FBC and CK. PCA loadings revealed the most prominent microbial groups in each treatment (Figure 4b). A gram-positive bacterial biomarker (15:0 iso) was the maximum single determinant of the variability within PC1, whereas PC2 was driven by two gram-negative bacterial biomarkers (18:1 ω7c, 19:0 cyclo ω8c). PLFA 18:1ω7c indicates substrate limitation [61,62]. We observed generally higher abundances of this biomarker in the FBC and CK treatments suggesting low bioavailability of carbon.

3.3.2. Relationship between Microbiota and Soil Properties

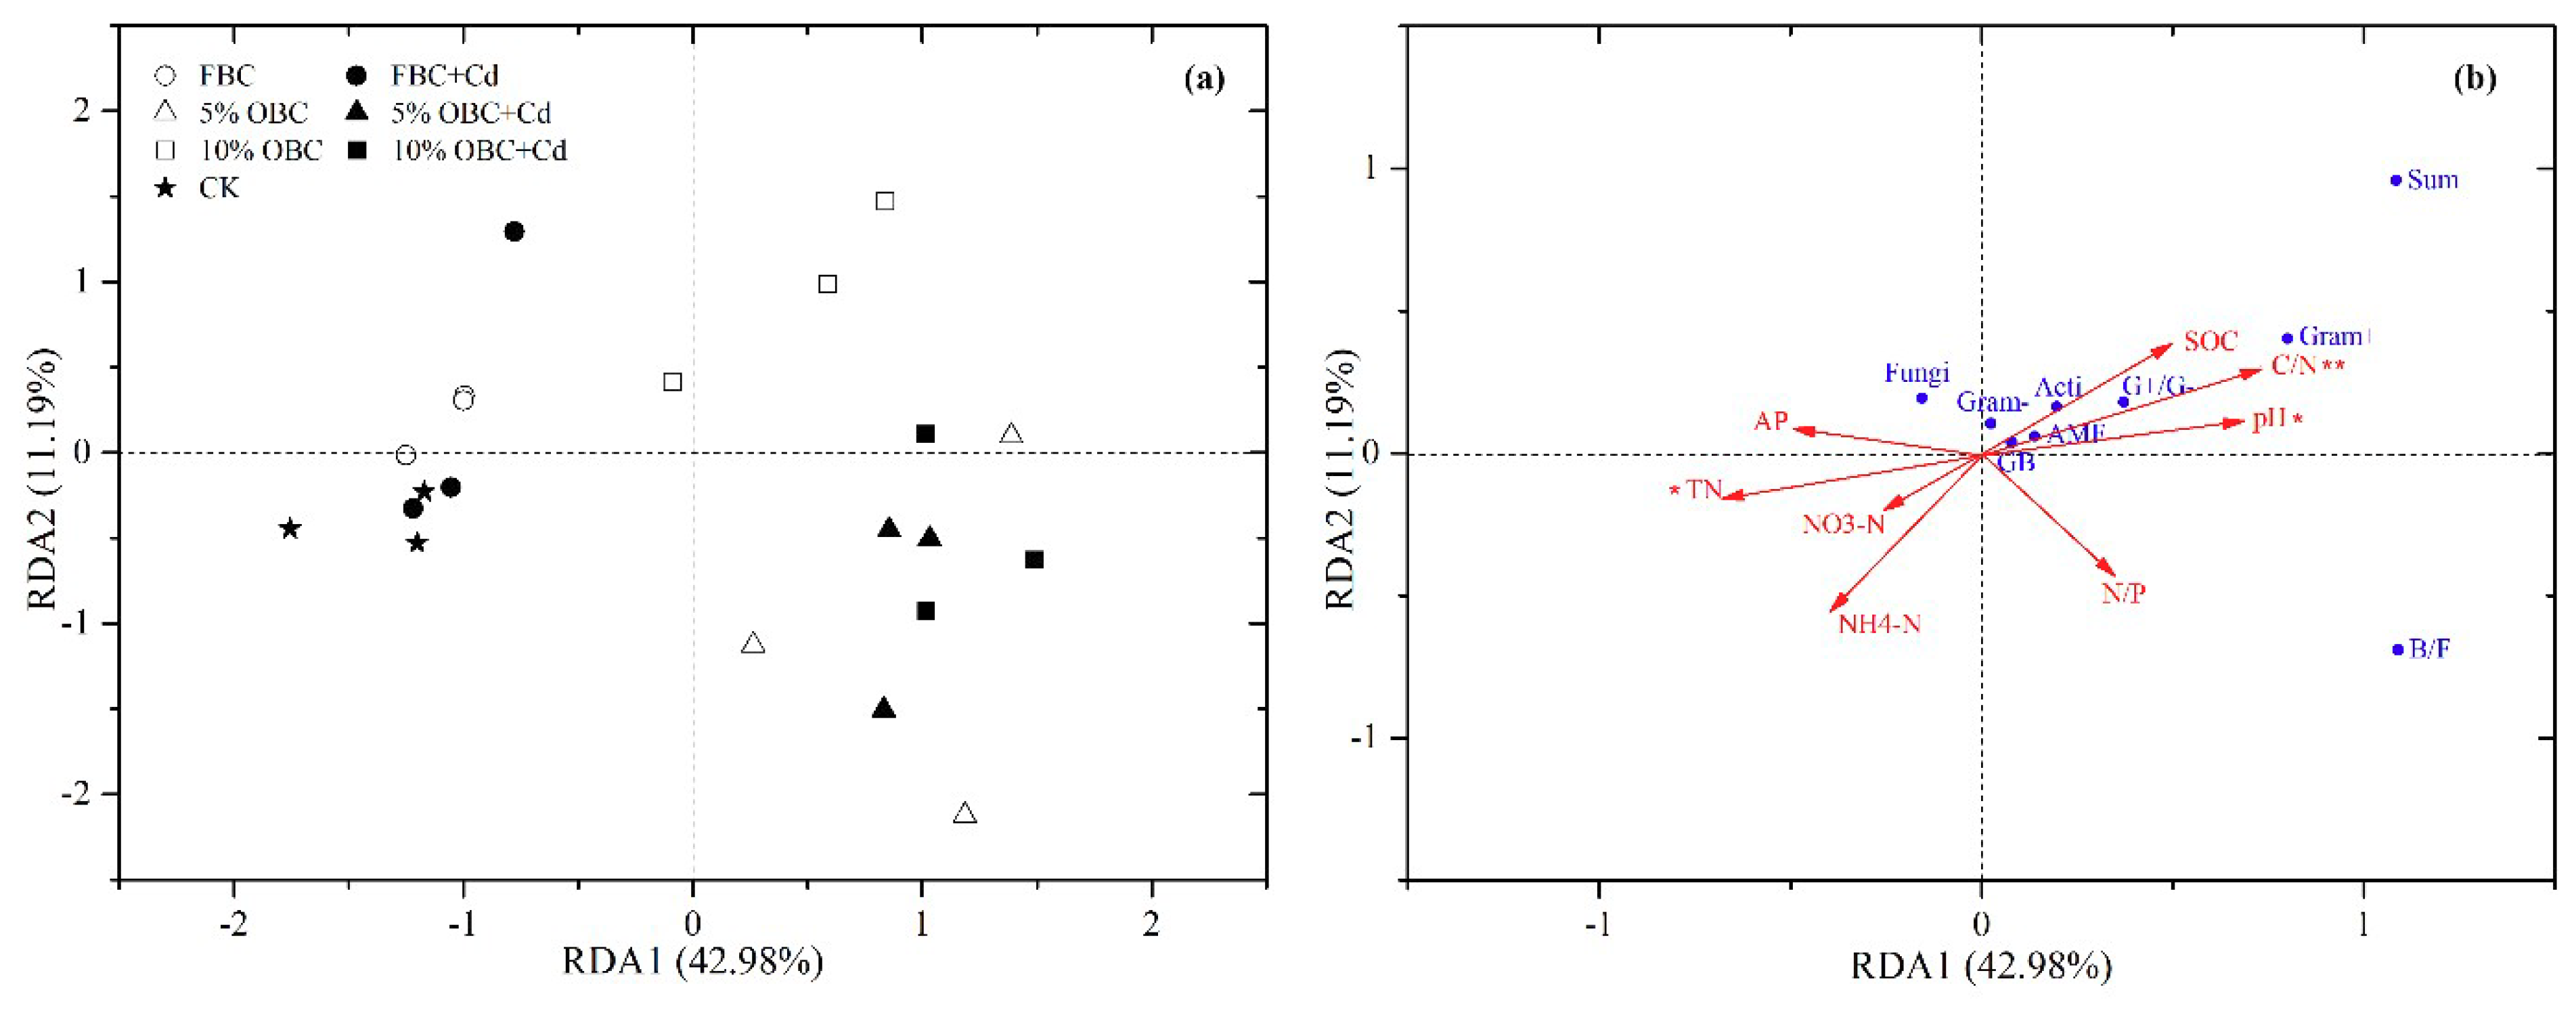
The redundancy analysis (RDA, Figure 5) with soil chemical properties as independent variables (42.98%) and PLFAs profiles as dependent variables (11.19 %) explained the variation in the microbial community structure. Significant correlations existed between the microbial community and soil physicochemical parameters. The C/N ratio (F = 6.62, p = 0.009) played major role in community structure explained 38.4% of the variation, then pH (10.8%, F = 5.59, p = 0.034) and TN (7.3%, F = 5.90, p = 0.031) followed. These observations agree with previous work, where C/N ratios and SOC were significant to the shifts in soil microbial community composition [63,64].

3.4. Influence of Cadmium Adsorption on Soil Properties and Microbiota

Cadmium adsorption by biochar also affected soil properties and microbial communities. Multi-way ANOVAs revealed cadmium adsorption significantly increased ammonium nitrogen in soil (p = 0.025). Competitive adsorption between cadmium ions and ammonium [65] led to cadmium-bound biochar to have a lowered capacity for ammonium retention. The SOC contents of soil containing cadmium adsorption biochar were lower than that containing non-adsorption biochar, indicating that cadmium decreases the release of organic compounds. Additionally, cadmium adsorption and biochar aging had interactive effects on NO3-N (p = 0.042).
Although total PLFAs content exhibited no significant differences between cadmium adsorption and non-adsorption biochar treatments, the results of multi-way ANOVAs showed cadmium adsorption influenced overall microbial community structure (p < 0.01). Cadmium adsorption increased the proportion of gram-negative bacteria and decreased the proportion of general bacteria, gram-positive bacteria, and fungi, as well as G+/G− ratios (Table 4).
Cadmium may act as an exogenous mineral and be actively changing the properties of biochar [66], which, in turn, influences the microbial community. However, the specific underlying mechanisms remain yet unclear. There were interactive effects on the proportion of general bacteria, gram-negative bacteria and fungi between biochar aging and cadmium adsorption (Table 5). PCA analyses showed that cadmium adsorption and non-adsorption treatments grouped together, indicating that they have similar PLFA profiles (Figure 4a). This would suggest that cadmium adsorption may have limited influence on PLFAs.

4. Conclusions

Aging altered the physical and chemical properties of biochar, and thus affected the soil microorganisms, not only increased microbial biomass but also shifted the microbial community structure, causing the aged biochar to be degraded by microorganisms. Therefore, there is a potential risk of desorption of adsorbed cadmium. Although the biochar containing cadmium improves the stability theoretically, our research found that changes in the microbial community due to cadmium adsorption were limited compared to the effects demonstrated by biochar aging. Consequently, in the practical application of biochar in the restoration of cadmium contaminated cropland, the risk of cadmium desorption due to aging cannot be ignored. Further work on biochar structural modifications after cadmium adsorption and the mechanisms of how cadmium binding affects microbial communities is necessary to assess the risk of cadmium desorption during the biochar aging.

Author Contributions

K.L. and Q.L. conceived the idea; K.L. and G.Y. designed and conducted the experiment; K.L. and Q.X. analyzed the results and prepared the manuscript; Q.L., Z.-Y.H., J.Y. and L.Z. reviewed and edited the manuscript. All authors have read and agreed to the published version of the manuscript.

Funding

This work was financially supported by the National Key Research and Development Program of China (2018YFC1802803, 2018YFC1800304, 2017YFD0801302), the National Natural Science Foundation of China (21677041, 41371317), the Science and Technology Project of Guangdong Province (2017B020216002), the Science and Technology Project of Guangzhou city (2016201604030017). The Project was Funded by Key Laboratory of Vegetation Restoration and Management of Degraded Ecosystems, Chinese Academy of Sciences.

Acknowledgments

We would like to thank Larry Bowman at Yale University for his assistance with English language and grammatical editing.

Conflicts of Interest

The authors declare no conflict of interest.

References

  1. International BI, Standardized Product Definition and Product Testing Guidelines for Biochar That is Used in Soil. IBI Biochar Standards. 2012. Available online: http://www.biochar-international.org/characterizationstandard (accessed on 12 May 2020).
  2. O’Connor, D.; Peng, T.; Zhang, J.; Tsang, D.C.W.; Alessi, D.S.; Shen, Z.; Bolan, N.S.; Hou, D. Biochar application for the remediation of heavy metal polluted land: A review carof in situ field trials. Sci. Total Environ. 2018, 619, 815–826. [Google Scholar] [CrossRef] [PubMed]
  3. Joseph, S.D.; Camps-Arbestain, M.; Lin, Y.; Munroe, P.; Chia, C.H.; Hook, J.; van Zwieten, L.; Kimber, S.; Cowie, A.; Singh, B.P.; et al. An investigation into the reactions of biochar in soil. Aust. J. Soil Res. 2010, 48, 501. [Google Scholar] [CrossRef]
  4. Ronsse, F.; van Hecke, S.; Dickinson, D.; Prins, W. Production and characterization of slow pyrolysis biochar: Influence of feedstock type and pyrolysis conditions. GCB Bioenergy 2013, 5, 104–115. [Google Scholar] [CrossRef]
  5. Suliman, W.; Harsh, J.B.; Abu-Lail, N.I.; Fortuna, A.-M.; Dallmeyer, I.; Garcia-Perez, M. Influence of feedstock source and pyrolysis temperature on biochar bulk and surface properties. Biomass Bioenerg. 2016, 84, 37–48. [Google Scholar] [CrossRef]
  6. Sun, Y.; Gao, B.; Yao, Y.; Fang, J.; Zhang, M.; Zhou, Y.; Chen, H.; Yang, L. Effects of feedstock type, production method, and pyrolysis temperature on biochar and hydrochar properties. Chem. Eng. J. 2014, 240, 574–588. [Google Scholar] [CrossRef]
  7. La Rosa, J.M.; de Rosado, M.; Paneque, M.; Miller, A.Z.; Knicker, H. Effects of aging under field conditions on biochar structure and composition: Implications for biochar stability in soils. Sci. Total Environ. 2018, 613, 969–976. [Google Scholar] [CrossRef] [Green Version]
  8. Rechberger, M.V.; Kloss, S.; Wang, S.-L.; Lehmann, J.; Rennhofer, H.; Ottner, F.; Wriessnig, K.; Daudin, G.; Lichtenegger, H.; Soja, G.; et al. Enhanced Cu and Cd sorption after soil aging of woodchip-derived biochar: What were the driving factors? Chemosphere 2019, 216, 463–471. [Google Scholar] [CrossRef]
  9. Schimmelpfennig, S.; Glaser, B. One Step Forward toward Characterization: Some Important Material Properties to Distinguish Biochars. J. Environ. Qual. 2012, 41, 1001–1013. [Google Scholar] [CrossRef] [Green Version]
  10. Zimmermann, M.; Bird, M.I.; Wurster, C.; Saiz, G.; Goodrick, I.; Barta, J.; Capek, P.; Santruckova, H.; Smernik, R. Rapid degradation of pyrogenic carbon. Glob. Chang. Biol. 2012, 18, 3306–3316. [Google Scholar] [CrossRef]
  11. Meier, I.C.; Leuschner, C. Variation of soil and biomass carbon pools in beech forests across a precipitation gradient. Glob. Chang. Biol. 2010, 16, 1035–1045. [Google Scholar] [CrossRef]
  12. Qian, L.; Chen, M.; Chen, B. Competitive adsorption of cadmium and aluminum onto fresh and oxidized biochars during aging processes. J. Soils Sediments 2015, 15, 1130–1138. [Google Scholar] [CrossRef]
  13. Bogusz, A.; Oleszczuk, P.; Dobrowolski, R. Application of laboratory prepared and commercially available biochars to adsorption of cadmium, copper and zinc ions from water. Bioresour. Technol. 2015, 196, 540–549. [Google Scholar] [CrossRef]
  14. Fan, Q.; Sun, J.; Chu, L.; Cui, L.; Quan, G.; Yan, J.; Hussain, Q.; Iqbal, M. Effects of chemical oxidation on surface oxygen-containing functional groups and adsorption behavior of biochar. Chemosphere 2018, 207, 33–40. [Google Scholar] [CrossRef] [PubMed]
  15. Qiu, Z.; Chen, J.; Tang, J.; Zhang, Q. A study of cadmium remediation and mechanisms: Improvements in the stability of walnut shell-derived biochar. Sci. Total Environ. 2018, 636, 80–84. [Google Scholar] [CrossRef]
  16. Xu, Y.; Seshadri, B.; Sarkar, B.; Wang, H.; Rumpel, C.; Sparks, D.; Farrell, M.; Hall, T.; Yang, X.; Bolan, N. Biochar modulates heavy metal toxicity and improves microbial carbon use efficiency in soil. Sci. Total Environ. 2018, 621, 148–159. [Google Scholar] [CrossRef]
  17. Yao, Q.; Liu, J.; Yu, Z.; Li, Y.; Jin, J.; Liu, X.; Wang, G. Changes of bacterial community compositions after three years of biochar application in a black soil of northeast China. Appl. Soil Ecol. 2017, 113, 11–21. [Google Scholar] [CrossRef]
  18. Lehmann, J.; Rillig, M.C.; Thies, J.; Masiello, C.A.; Hockaday, W.C.; Crowley, D. Biochar effects on soil biota—A review. Soil Biol. Biochem. 2011, 43, 1812–1836. [Google Scholar] [CrossRef]
  19. Lu, H.; Li, Z.; Fu, S.; Méndez, A.; Gascó, G.; Paz-Ferreiro, J. Effect of Biochar in Cadmium Availability and Soil Biological Activity in an Anthrosol Following Acid Rain Deposition and Aging. Water Air Soil Pollut. 2015, 226, 164. [Google Scholar] [CrossRef]
  20. Song, D.; Tang, J.; Xi, X.; Zhang, S.; Liang, G.; Zhou, W.; Wang, X. Responses of soil nutrients and microbial activities to additions of maize straw biochar and chemical fertilization in a calcareous soil. Eur. J. Soil Biol. 2018, 84, 1–10. [Google Scholar] [CrossRef]
  21. Farrell, M.; Kuhn, T.K.; Macdonald, L.M.; Maddern, T.M.; Murphy, D.V.; Hall, P.A.; Singh, B.P.; Baumann, K.; Krull, E.S.; Baldock, J.A. Microbial utilisation of biochar-derived carbon. Sci. Total Environ. 2013, 465, 288–297. [Google Scholar] [CrossRef] [PubMed]
  22. Santos, F.; Torn, M.S.; Bird, J.A. Biological degradation of pyrogenic organic matter in temperate forest soils. Soil Biol. Biochem. 2012, 51, 115–124. [Google Scholar] [CrossRef]
  23. Kuzyakov, Y.; Bogomolova, I.; Glaser, B. Biochar stability in soil Decomposition during eight years and transformation as assessed by compound-specific 14C analysis. Soil Biol. Biochem. 2014, 70, 229–236. [Google Scholar] [CrossRef]
  24. Frišták, V.; Friesl-Hanl, W.; Wawra, A.; Pipíška, M.; Soja, G. Effect of biochar artificial ageing on Cd and Cu sorption characteristics. J. Geochem. Explor. 2015, 159, 178–184. [Google Scholar] [CrossRef]
  25. Jin, J.; Sun, K.; Wang, Z.; Han, L.; Du, P.; Wang, X.; Xing, B. Effects of chemical oxidation on phenanthrene sorption by grass-and manure-derived biochars. Sci. Total Environ. 2017, 598, 789–796. [Google Scholar] [CrossRef]
  26. Cross, A.; Sohi, S.P. A method for screening the relative long-term stability of biochar. GCB Bioenergy 2013, 5, 215–220. [Google Scholar] [CrossRef]
  27. Huff, M.D.; Lee, J.W. Biochar-surface oxygenation with hydrogen peroxide. J. Environ. Manag. 2016, 165, 17–21. [Google Scholar] [CrossRef]
  28. Lawrinenko, M.; Laird, D.A.; Johnson, R.L.; Jing, D. Accelerated aging of biochars: Impact on anion exchange capacity. Carbon 2016, 103, 217–227. [Google Scholar] [CrossRef] [Green Version]
  29. Mia, S.; Dijkstra, F.A.; Singh, B. Chapter One—Long-term aging of biochar: A molecular understanding with agricultural and environmental implications. In Advances in Agronomy; Sparks, D.L., Ed.; Academic Press: Cambridge, MA, USA, 2017; pp. 1–51. [Google Scholar]
  30. Zhang, H.; Yue, X.; Li, F.; Xiao, R.; Zhang, Y.; Gu, D. Preparation of rice straw-derived biochar for efficient cadmium removal by modification of oxygen-containing functional groups. Sci. Total Environ. 2018, 631, 795–802. [Google Scholar] [CrossRef]
  31. Boehm, H.P. Surface oxides on carbon and their analysis: A critical assessment. Carbon 2002, 40, 145–149. [Google Scholar] [CrossRef]
  32. Yang, X.; Han, Y.; Li, B.; Yan, H.; Yang, W. Spatiotemporal heterogeneity of soil nitrogen mineralization in a Picea stand and its relation to soil physicochemical factors. Acta Ecol. Sin. 2015, 35, 20–27. [Google Scholar] [CrossRef]
  33. Duan, L.; Li, Z.; Xie, H.; Li, Z.; Zhang, L.; Zhou, Q. Large-scale spatial variability of eight soil chemical properties within paddy fields. Catena 2020, 188, 104350. [Google Scholar] [CrossRef]
  34. Dong, X.; Li, G.; Lin, Q.; Zhao, X. Quantity and quality changes of biochar aged for 5 years in soil under field conditions. Catena 2017, 159, 136–143. [Google Scholar] [CrossRef]
  35. Shi, K.; Xie, Y.; Qiu, Y. Natural oxidation of a temperature series of biochars: Opposite effect on the sorption of aromatic cationic herbicides. Ecotox. Environ. Safe 2015, 114, 102–108. [Google Scholar] [CrossRef] [PubMed]
  36. Trigo, C.; Spokas, K.A.; Cox, L.; Koskinen, W.C. Influence of soil biochar aging on sorption of the herbicides MCPA, nicosulfuron, terbuthylazine, indaziflam, and fluoroethyldiaminotriazine. J. Agric. Food Chem. 2014, 62, 10855–10860. [Google Scholar] [CrossRef] [Green Version]
  37. Liu, Z.; Demisie, W.; Zhang, M. Simulated degradation of biochar and its potential environmental implications. Environ. Pollut. 2013, 179, 146–152. [Google Scholar] [CrossRef] [PubMed]
  38. Xu, Y.; Lou, Z.; Yi, P.; Chen, J.; Ma, X.; Wang, Y.; Li, M.; Chen, W.; Liu, Q.; Zhou, J.; et al. Improving abiotic reducing ability of hydrothermal biochar by low temperature oxidation under air. Bioresour. Technol. 2014, 172, 212–218. [Google Scholar] [CrossRef]
  39. Dutta, B.; Raghavan, V.G.S.; Orsat, V.; Ngadi, M. Surface characterisation and classification of microwave pyrolysed maple wood biochar. Biosyst. Eng. 2015, 131, 49–64. [Google Scholar] [CrossRef]
  40. Pradhan, B.K.; Sandle, N.K. Effect of different oxidizing agent treatments on the surface properties of activated carbons. Carbon 1999, 37, 1323–1332. [Google Scholar] [CrossRef]
  41. Mia, S.; Dijkstra, F.A.; Singh, B. Aging Induced Changes in Biochar’s Functionality and Adsorption Behavior for Phosphate and Ammonium. Environ. Sci. Technol. 2017, 51, 8359–8367. [Google Scholar] [CrossRef]
  42. Hagemann, N.; Joseph, S.; Schmidt, H.-P.; Kammann, C.I.; Harter, J.; Borch, T.; Young, R.B.; Varga, K.; Taherymoosavi, S.; Elliott, K.W.; et al. Organic coating on biochar explains its nutrient retention and stimulation of soil fertility. Nat. Commun. 2017, 8, 1089. [Google Scholar] [CrossRef]
  43. Houben, D.; Evrard, L.; Sonnet, P. Mobility, bioavailability and pH-dependent leaching of cadmium, zinc and lead in a contaminated soil amended with biochar. Chemosphere 2013, 92, 1450–1457. [Google Scholar] [CrossRef] [PubMed]
  44. Dempster, D.N.; Jones, D.L.; Murphy, D.V. Clay and biochar amendments decreased inorganic but not dissolved organic nitrogen leaching in soil. Soil Res. 2012, 50, 216–221. [Google Scholar] [CrossRef]
  45. Gao, L.; Wang, R.; Shen, G.; Zhang, J.; Meng, G.; Zhang, J. Effects of biochar on nutrients and the microbial community structure of tobacco-planting soils. J. Soil Sci. Plant. Nutr. 2017, 17, 884–896. [Google Scholar] [CrossRef] [Green Version]
  46. Zhang, M.K.; Bayou, W.D.; Tang, H.J. Effects of biochar’s application on active organic carbon fractions in soil. J. Soil Water Conserv. 2012, 26, 127–137. [Google Scholar]
  47. Joseph, S.; Kammann, C.I.; Shepherd, J.G.; Conte, P.; Schmidt, H.-P.; Hagemann, N.; Rich, A.M.; Marjo, C.E.; Allen, J.; Munroe, P.; et al. Microstructural and associated chemical changes during the composting of a high temperature biochar: Mechanisms for nitrate, phosphate and other nutrient retention and release. Sci. Total Environ. 2018, 618, 1210–1223. [Google Scholar] [CrossRef] [PubMed] [Green Version]
  48. Kumar, A.; Joseph, S.; Tsechansky, L.; Privat, K.; Schreiter, I.J.; Schüth, C.; Graber, E.R. Biochar aging in contaminated soil promotes Zn immobilization due to changes in biochar surface structural and chemical properties. Sci. Total Environ. 2018, 626, 953–961. [Google Scholar] [CrossRef]
  49. Abrishamkesh, S.; Gorji, M.; Asadi, H.; Bagheri-Marandi, G.H.; Pourbabaee, A.A. Effects of rice husk biochar application on the properties of alkaline soil and lentil growth. Plant Soil Environ. 2015, 61, 475–482. [Google Scholar] [CrossRef] [Green Version]
  50. Chintala, R.; Schumacher, T.E.; McDonald, L.M.; Clay, D.E.; Malo, D.D.; Papiernik, S.K.; Clay, S.A.; Julson, J.L. Phosphorus Sorption and Availability from Biochars and Soil/Biochar Mixtures. Clean-Soil Air Water 2014, 42, 626–634. [Google Scholar] [CrossRef]
  51. Duan, P.; Zhang, X.; Zhang, Q.; Wu, Z.; Xiong, Z. Field-aged biochar stimulated N2O production from greenhouse vegetable production soils by nitrification and denitrification. Sci. Total Environ. 2018, 642, 1303–1310. [Google Scholar] [CrossRef]
  52. Hartley, W.; Riby, P.; Waterson, J. Effects of three different biochars on aggregate stability, organic carbon mobility and micronutrient bioavailability. J. Environ. Manag. 2016, 181, 770–778. [Google Scholar] [CrossRef] [Green Version]
  53. Liu, Q.; Zhang, Y.; Liu, B.; Amonette, J.E.; Lin, Z.; Liu, G.; Ambus, P.; Xie, Z. How does biochar influence soil N cycle? A meta-analysis. Plant. Soil 2018, 426, 211–225. [Google Scholar] [CrossRef]
  54. Gul, S.; Whalen, J.K.; Thomas, B.W.; Sachdeva, V.; Deng, H. Physico-chemical properties and microbial responses in biochar-amended soils: Mechanisms and future directions. Agric. Ecosyst. Environ. 2015, 206, 46–59. [Google Scholar] [CrossRef]
  55. Alarcón-Gutiérrez, E.; Floch, C.; Ziarelli, F.; Albrecht, R.; Le Petit, J.; Augur, C.; Criquet, S. Characterization of a Mediterranean litter by 13C CPMAS NMR: Relationships between litter depth, enzyme activities and temperature. Eur. J. Soil Sci. 2008, 59, 486–495. [Google Scholar] [CrossRef]
  56. Kuzyakov, Y.; Subbotina, I.; Chen, H.; Bogomolova, I.; Xu, X. Black carbon decomposition and incorporation into soil microbial biomass estimated by 14C labeling. Soil Biol. Biochem. 2009, 41, 210–219. [Google Scholar] [CrossRef]
  57. Feng, Y.; Motta, A.C.; Reeves, D.W.; Burmester, C.H.; van Santen, E.; Osborne, J.A. Soil microbial communities under conventional-till and no-till continuous cotton systems. Soil Biol. Biochem. 2003, 35, 1693–1703. [Google Scholar] [CrossRef]
  58. Zhang, L.; Jing, Y.; Xiang, Y.; Zhang, R.; Lu, H. Responses of soil microbial community structure changes and activities to biochar addition: A meta-analysis. Sci. Total Environ. 2018, 643, 926–935. [Google Scholar] [CrossRef]
  59. Kramer, C.; Gleixner, G. Soil organic matter in soil depth profiles: Distinct carbon preferences of microbial groups during carbon transformation. Soil Biol. Biochem. 2008, 40, 425–433. [Google Scholar] [CrossRef]
  60. Sheng, Y.; Zhan, Y.; Zhu, L. Reduced carbon sequestration potential of biochar in acidic soil. Sci. Total Environ. 2016, 572, 129–137. [Google Scholar] [CrossRef]
  61. Butler, J.L.; Williams, M.A.; Bottomley, P.J.; Myrold, D.D. Microbial community dynamics associated with rhizosphere carbon flow. Appl. Environ. Microb. 2003, 69, 6793–6800. [Google Scholar] [CrossRef] [Green Version]
  62. McMahon, S.K.; Williams, M.A.; Bottomley, P.J.; Myrold, D.D. Dynamics of microbial communities during decomposition of carbon-13 labeled ryegrass fractions in soil. Soil Sci. Soc. Am. J. 2005, 69, 1238–1247. [Google Scholar] [CrossRef] [Green Version]
  63. Xu, H.-J.; Wang, X.-H.; Li, H.; Yao, H.-Y.; Su, J.-Q.; Zhu, Y.-G. Biochar impacts soil microbial community composition and nitrogen cycling in an acidic soil planted with rape. Environ. Sci. Technol. 2014, 48, 9391–9399. [Google Scholar] [CrossRef]
  64. Zheng, J.; Chen, J.; Pan, G.; Liu, X.; Zhang, X.; Li, L.; Bian, R.; Cheng, K.; Jinwei, Z. Biochar decreased microbial metabolic quotient and shifted community composition four years after a single incorporation in a slightly acid rice paddy from southwest China. Sci. Total Environ. 2016, 571, 206–217. [Google Scholar] [CrossRef] [PubMed]
  65. Cui, X.; Hao, H.; Zhang, C.; He, Z.; Yang, X. Capacity and mechanisms of ammonium and cadmium sorption on different wetland-plant derived biochars. Sci. Total Environ. 2016, 539, 566–575. [Google Scholar] [CrossRef] [PubMed]
  66. Yang, Y.; Sun, K.; Han, L.; Jin, J.; Sun, H.; Yang, Y.; Xing, B. Effect of minerals on the stability of biochar. Chemosphere 2018, 204, 310–317. [Google Scholar] [CrossRef] [PubMed]
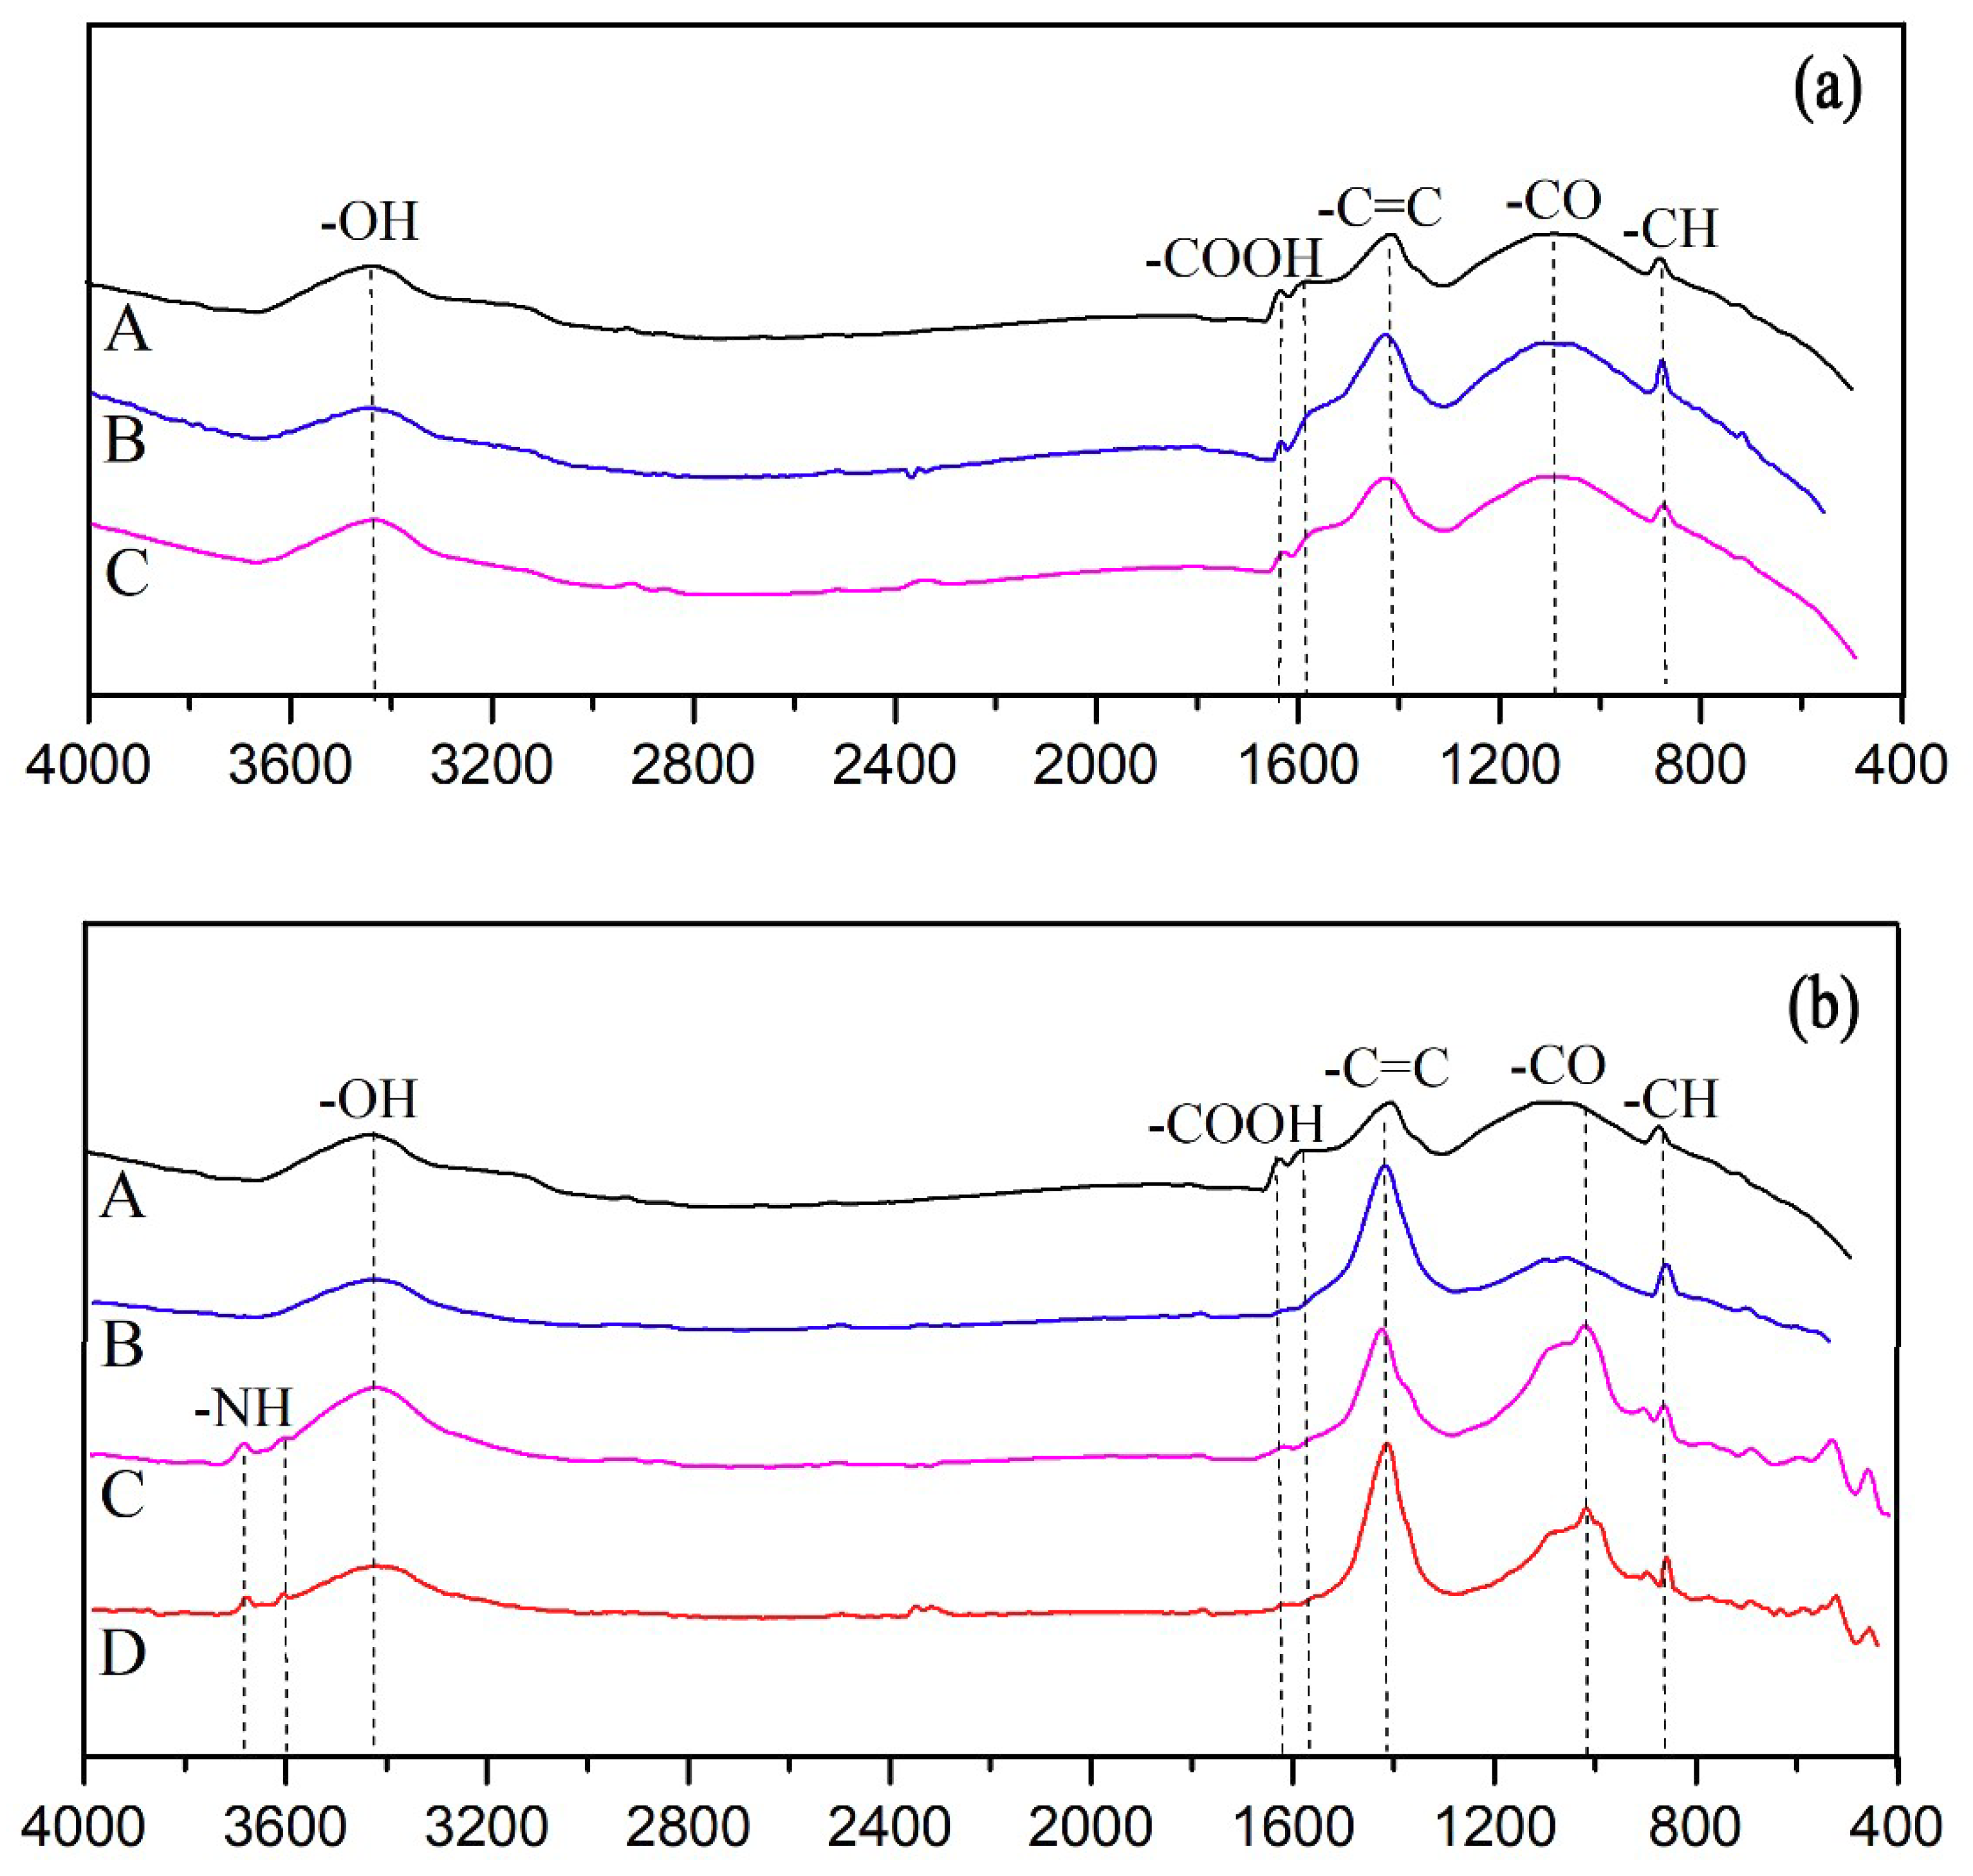
Figure 1. Fourier-transform infrared spectroscopy (FT-IR) spectra. (a) FT-IR spectra of fresh and aged biochar (FBC, 5% OBC and 10% OBC) and (b) FT-IR spectra of four stages of aged biochar: (A) 10% OBC, (B) 10% OBC binding cadmium, (C) 10% OBC after incubation, (D) 10% OBC binding cadmium after incubation.
Sustainability 12 04868 g001
Figure 2. Batch adsorption experiments of fresh and aged biochar on cadmium, for FBC, 5% OBC, and 10% OBC.
Sustainability 12 04868 g002
Figure 3. Proportion of fatty acids representing six microbial species (%). Gram+, gram-positive bacteria; Gram-, gram-negative bacteria; F, fungi; A, actinomycetes; AMF, arbuscular mycorrhiza fungi; CK, control soil without biochar; FBC, soil applied with fresh biochar; FBC + Cd, soil applied with FBC + Cd; 5% OBC, soil applied with 5% OBC; 5% OBC + Cd, soil applied with 5% OBC + Cd; 10% OBC, soil applied with 10% OBC; 10% OBC + Cd, soil applied with 10% OBC+Cd.
Sustainability 12 04868 g003
Figure 4. Principal component analysis (PCA) of PLFAs showing score plot (a) and loading plot (b) for the individual PLFAs of soil. Treatments are as given in Figure 2.
Sustainability 12 04868 g004
Figure 5. (a) Redundancy analysis (RDA) of microbial community compositions and soil property variables for individual samples from aged biochar soils with or without cadmium adsorption. (b) Arrows represent properties with significant correlations with microbial community composition. * p < 0.05 and ** p < 0.01, significant correlations.
Sustainability 12 04868 g005
Table 1. Physicochemical properties of fresh and aged biochar, for FBC, 5% OBC, and 10% OBC.
C (%)H (%)O (%)N (%)Surface Area
(m2 g−1)
Pore Volume
(cm3 g−1)
Average Pore Width
(Å)
FBC82.10.979.20.17333.720.13819.96
5% OBC81.31.0810.50.18336.760.14120.16
10% OBC78.41.2912.70.14347.460.14619.63
Biochar samples were analyzed in duplicate, the data were not tested for statistical significance.
Table 2. Boehm titration results (mmol g−1) for three levels of biochar aging oxidation treatment in H2O2 solution.
CarboxylicLactonicPhenolicTotal Acidic
FBC0.14 ± 0.03 a0.11 ± 0.04 a0.39 ± 0.17 a0.64 ± 0.15 a
5% OBC0.21 ± 0.18 a0.14 ± 0.07 a0.69 ± 0.10 b1.04 ± 0.67 a
10% OBC0.32 ± 0.10 b0.21 ± 0.05 b1.34 ± 0.15 c1.98 ± 0.61 b
Table 3. Soil properties of differently aged biochar and treatments.
pHSOC (g/kg)TN (g/kg)NH4-N (mg/kg)NO3-N (mg/kg)AP (mg/kg)C/N
CK5.60 ± 0.10 a 11.39 ± 1.90 a2.71 ± 0.60 a7.27 ± 0.53 a19.52 ± 2.08 a49.64 ± 9.11 a4.48 ± 1.92 a
FBC6.47 ± 0.06 b14.12 ± 2.26 ab2.42 ± 0.40 a6.13 ± 0.18 bc15.72 ± 0.90 b31.34 ± 1.90 b5.86 ± 0.71 ab
FBC + Cd6.42 ± 0.02 b13.07 ± 2.37 ab2.32 ± 0.28 a6.32 ± 0.35 bc12.77 ± 1.69 c33.83 ± 2.24 b5.67 ± 1.14 ab
5% OBC6.53 ± 0.10 b14.41 ± 2.29 ab2.08 ± 0.06 a6.10 ± 0.27 bc15.05 ± 1.38 bc32.31 ± 2.94 b6.91 ± 0.94 b
5% OBC + Cd6.46 ± 0.10 b13.20 ± 0.63 ab2.29 ± 0.05 a6.46 ± 0.25 c16.86 ± 0.96 b29.50 ± 5.20 b5.76 ± 0.34 ab
10% OBC6.48 ± 0.16 b15.08 ± 0.46 b2.01 ± 0.13 a5.89 ± 0.17 b15.48 ± 1.08 b35.67 ± 0.97 b7.52 ± 0.53 bc
10% OBC + Cd6.44 ± 0.04 b14.35 ± 2.08 ab1.85 ± 0.22 a6.41 ± 0.31 bc14.82 ± 0.98 bc33.58 ± 3.48 b7.89 ± 1.84 c
Note: SOC, soil organic carbon; TN, total nitrogen; NH4-N, ammonium nitrogen; NO3-N, nitrate nitrogen; AP, available phosphorus; C/N, SOC/TN ratio. Data are mean ± SE.
Table 4. Comparison of general bacteria, G+ bacteria, G–bacteria, fungi, AMF and actinomycetes obtained through respective PLFA profiles (nmol g−1 dry soil). Means ± SD (n = 3) of total PLFA, PLFA diversity, ratios of Gram-positive and Gram-negative bacteria, and ratios of bacteria and fungi. Mean values followed by different letters indicated significance (p < 0.05) among treatments.
General bacteria G+ bacteriaG–bacteriaFungiAMFActinomycetesTotalG+/G−B/F
CKND0.30 ± 0.04 a1.86 ± 0.59 a1.00 ± 0.08 aND0.35 ± 0.04 a3.51 ± 0.56 a0.17 ± 0.04 a2.18 ± 0.72 a
FBCND0.31 ± 0.03 a2.76 ± 0.29 a1.22 ± 0.03 aND0.37 ± 0.09 a4.66 ± 0.42 a0.11 ± 0.004a2.50 ± 0.21 a
FBC + Cd0.01 ± 0.002a0.32 ± 0.007a2.86 ± 0.86 a1.23 ± 0.36 aND0.38 ± 0.12 a4.80 ± 1.36 a0.12 ± 0.03 a2.62 ± 0.16 a
5% OBC0.17 ± 0.03 b1.81 ± 0.30 b1.92 ± 0.98 a0.52 ± 0.16 b0.24 ± 0.05 a0.74 ± 0.17 b5.41 ± 1.67 a1.05 ± 0.33 b7.49 ± 1.38 b
5% OBC +Cd0.16 ± 0.01 b1.84 ± 0.30 b2.09 ± 0.15 a0.57 ± 0.08 b0.23 ± 0.02 a0.75 ± 0.12 b5.64 ± 0.65 a0.88 ± 0.10 b7.27 ± 0.34 b
10% OBC0.25 ± 0.06 c2.86 ± 0.77 c2.14 ± 0.69 a1.27 ± 0.37 a0.40 ± 0.11 b1.13 ± 0.33 c8.05 ± 2.32 b1.36 ± 0.12 c4.13 ± 0.11 c
10% OBC +Cd0.15 ± 0.02 b2.05 ± 0.24 b2.47 ± 0.37 a0.61 ± 0.07 b0.31 ± 0.03 c0.76 ± 0.13 b6.36 ± 0.57 b0.84 ± 0.16 b7.64 ± 0.81 b
Note: G+ bacteria, gram-positive bacteria; G–bacteria, gram-negative bacteria; AMF, arbuscular mycorrhiza fungi; G+/G−, gram-positive bacteria/gram-negative bacteria ratio; B/F, (gram-negative bacteria + gram-positive bacteria + general bacterial)/fungi.
Table 5. Results of multiple ANOVA analyses testing the effects of biochar aging, cadmium adsorption, and their interactions on relative ratios of six microbial species.
AgingCadmiumAging × Cadmium
DfFPDfFPDfFP
General bacteria3 363.930.0001 12.040.0052 9.060.005
Gram+3369.470.00018.810.01323.360.073
Gram-3108.56 0.000 1 21.82 0.001 2 6.91 0.011
Fungi3 205.34 0.000 1 18.06 0.001 2 11.05 0.002
AMF3 616.18 0.000 1 3.87 0.075 2 3.71 0.059
Actinomycetes3 34.66 0.000 1 4.52 0.057 2 1.55 0.255
Note: Gram+, gram-positive bacteria; Gram-, gram-negative bacteria; AMF, arbuscular mycorrhiza fungi.