Article

Comparing the Impacts of Location Attributes on Residents’ Preferences and Residential Values in Compact Cities: A Case Study of Hong Kong

1
School of Architecture, Harbin Institute of Technology, HIT Campus of University Town of Shenzhen, Shenzhen 518055, China
2
Department of Architecture, Tongji University, Shanghai 200082, China
3
School of Architecture, Southeast University, Nanjing 211189, China
4
Department of Civil and Environmental Engineering, Stanford University, Stanford, CA 94305-2004, USA
5
Department of Architecture and Civil Engineering, City University of Hong Kong, Tat Chee Avenue, Kowloon, Hong Kong
*
Authors to whom correspondence should be addressed.
Sustainability 2020, 12(12), 4867; https://doi.org/10.3390/su12124867
Submission received: 30 April 2020 / Revised: 9 June 2020 / Accepted: 12 June 2020 / Published: 15 June 2020
(This article belongs to the Section Sustainable Urban and Rural Development)

Abstract

:
In recent years, environmentally-friendly, sustainable, and compact development has become increasingly popular with governments. An extensive body of literature has focused on the influence on housing prices from an economic perspective. Although residential urban planning from the perspective of individual needs must be considered, little attention has been paid to residents’ demands in high-density and compact urban areas. In this study, we selected Hong Kong as the case and adopted a reliability interval method to rank residential attitude metrics, which indicated residents’ neighborhood needs in densely populated cities. The influences of location attributes on residents’ demands and residential value were compared. A hedonic price model was used to estimate the impacts of the attributes on housing prices. The results showed that both access to metro stations and median household income had important influences on residents’ preferences and housing prices. However, access to the central business district contributed largely to housing prices but not to residents’ attitudes. These findings support urban planners and policy makers during sustainable residential planning and policy formation by understanding residents’ needs in compact urban areas, help them to optimize the match between housing attributes and residents’ expectations, and balance the relationship between residents’ needs and economic interest.

1. Introduction

Sustainable development is defined as “development that meets the needs of the present generation without compromising the ability of future generations to meet their own needs” [1]. Sustainable development should build a dynamic balance between social wellbeing, economic opportunity, and environmental quality [2]. Due to rapid urbanization, more cities are experiencing urban problems, including traffic congestion, environmental pollution, and urban sprawl. Sustainable development is becoming increasingly important. Many cities in Asian countries have an enormous population and urban land shortage [3]. The low-density urban development based on the automobile, which has been widely adopted in European and North America, is not appropriate for these cities. Therefore, compact development is popular amongst urban planners and policy makers [4,5,6]. The characteristics of compact development are high density, mixed land use, and transit-oriented development (TOD) [5,7,8]. It aims to protect the environment and create sustainable communities. Compact cities efficiently use land resources and land wastage is reduced, protecting the natural habitat environment and wild landscapes. Compact urbanization can promote public transit development and reduce the use of cars.
The principle of sustainable development is meeting the current demands of people and providing a good living environment for future generations [9]. Residents’ demands are generally defined as individuals’ subjective requirements of their residential environment in relation to their needs, expectations, and preferences [10]. In recent decades, residential development has focused on economic interest and ignored residents’ needs in a neighborhood [11,12]. Governments and developers have constructed many real estate projects. However, the construction of utility services and public infrastructure cannot keep pace with the development of real estate. This has led to overdeveloped urban land. Public participation is increasingly important when selecting environmental elements and public services, so as to increase the livability of neighborhoods and improve the quality of the urban environment [12]. Therefore, to ensure the success of compact development, urban planners and policy makers should consider residents’ requirements regarding the living environment and provide attractive neighborhoods. They should balance residents’ demands and economic interest in residential urban planning in order to promote sustainable development.
Architects, planners, and economists have paid more attention to the influences of housing characteristics and environmental elements on housing prices [13,14,15]. Past surveys seldom examined residential movement from an individual needs perspective. However, housing prices cannot be the sole benchmark of residents’ satisfaction. Property economic conditions play significant roles in the increase in property prices [16,17]. Housing values are also significantly influenced by government town planning policies, land supply, and the tax system [18,19]. Extensive literature has focused on residential mobility and housing prices in low density and automobile commuting cities [12,20,21], but authors experienced limitations in capturing residents’ demands in high-density and compact cities like Hong Kong.
From a demand-side perspective, we developed the reliability interval method (RIM) to establish the residential attitude metrics (RAM), which indicate residents’ needs in a neighborhood in compact cities. RIM is a fuzzy evaluation method that measures the weight of each attribute according to respondents’ attitudes. Then, a hedonic price model was adopted to evaluate the influence of attributes on residential values. By comparing the impacts of location attributes on residents’ preferences and housing prices, we investigated the differences in residential development from an individual needs perspective and an economic interest perspective. The RAM provides reference criteria for urban planners and policy makers to implement sustainable compact city strategies. The findings provide more knowledge about and insights into residents’ preferences for their living environment in compact urban areas. The results can help urban planners and policy makers determine what actions will be most effective for improving the quality of the living environment, providing the foundation for drafting sustainable residential urban design, housing policy, and related strategies. The findings will help urban planners and policy makers to balance residents’ demands and economic interest in the developments of large and dense urban settlements.
The remainder of this paper is structured as follows: the recent literature focused on residents’ preference and housing value is reviewed in Section 2. Section 3 introduces the characteristics of the study area in Hong Kong. Section 4 outlines the establishment of the RAM in compact cities and the evaluation of the impact of location attributes on housing prices. Section 5 provides the results. Section 6 discusses the comparison of the impacts of location attributes on residents’ attitudes and residential values. Our results are also compared with those of previous studies. Finally, Section 7 presents the conclusions, and highlights the research limitations and future research avenues.

2. Literature Review

2.1. Evaluation Methods on Residential Preference and Residential Value

2.1.1. Evaluation Methods on Residential Preference

Multi-criteria decision analysis (MCDA) can help decision-makers solve decision or planning problems involving multiple criteria [22]. MCDA methods can be used to explicitly assess the importance of location attributes according to residents’ demands of their neighborhood. Some integer assessment methods, such as best–worst scaling (BWS), principal components analysis (PCA), and the analytic hierarchy process (AHP), have been adopted to assess the weighting of neighborhood attributes in residential development [23,24,25].
BWS has been adopted by some scholars because it is easy to understand and answer by respondents [25] and ensures that each best–worst pair appears in the scenario [26]. However, BWS is not appropriate for evaluating many attributes, since a large number of tasks should be considered. PCA is suitable for removing redundant data and transforming a set of correlated attributes into uncorrelated factors [27]. However, the results may not be accurate, since the integer assessment assigned by respondents is sometimes casual [28]. The AHP asks each participant to make a pairwise comparison to determine the relative priorities of different attributes on a ratio scale [29,30]. However, some scholars highlighted that respondents are easily confused when making pairwise comparisons with a large number of attributes, and it is not easy to keep the consistency ratio (CR) at 0.1 or below [31,32]. Therefore, integer assessment methods have some limitations.
An evaluation approach, the reliability interval method (RIM), has been introduced to evaluate the perceptions of building professionals on sustainable development [33] and performance of cost estimators [34]. It has then been developed into fuzzy-RIM for a fire safety ranking evaluation framework based on experts’ attitudes [35]. RIM allows respondents to provide a fuzzy evaluation of each attribute, which can prevent arbitrariness and confusion [34]. It is more appropriate for assessing participants’ attitudes on a large number of attributes than integer assessment methods. Therefore, we developed the RIM to assess the relative importance of influential attributes according to residents’ preferences and establish residential attitudes metrics so as to direct the development of residential areas.

2.1.2. Residential Value Evaluation Methods

Many approaches have been developed to account for housing prices, such as descriptive analysis, qualitative analysis, a repeat sales model, a hedonic price model, and ratable values [36]. Various studies used the repeat sales model and hedonic price model to analyze empirical data and evaluate the influences on housing prices [37,38].
The repeat sales model was first introduced by Bailey in 1963 [39]. By assuming some characteristics constant, the repeat sales model is useful for estimating the impact of new investment on houses [40]. However, some changes in asset composition and quality characteristics, such as house structure and neighborhood characters, are hard to measure [41]. This model only analyzes houses that have been sold two or more times. Sometimes empirical data are difficult to collect [37].
The hedonic price model was first employed by Griliches in the study of fixed assets in 1961 [42]. It has become a primary approach used to account for prices of heterogeneous goods, such as real estate rent and land and property values [12,43]. The hedonic price model confirms that property values are influenced by many characteristics, such as plot size, environmental and landscape amenities, proximity to public transportation, and other facilities [44]. It has also been widely used in Asian cities like Hong Kong, Beijing, and Seoul [45,46]. The hedonic price model does not need the houses to have been sold more than once, and the data are easy to collect. Therefore, we selected the hedonic price model as more appropriate than the repeat sales model in this study.

2.2. Residential Location Choice and Residential Value
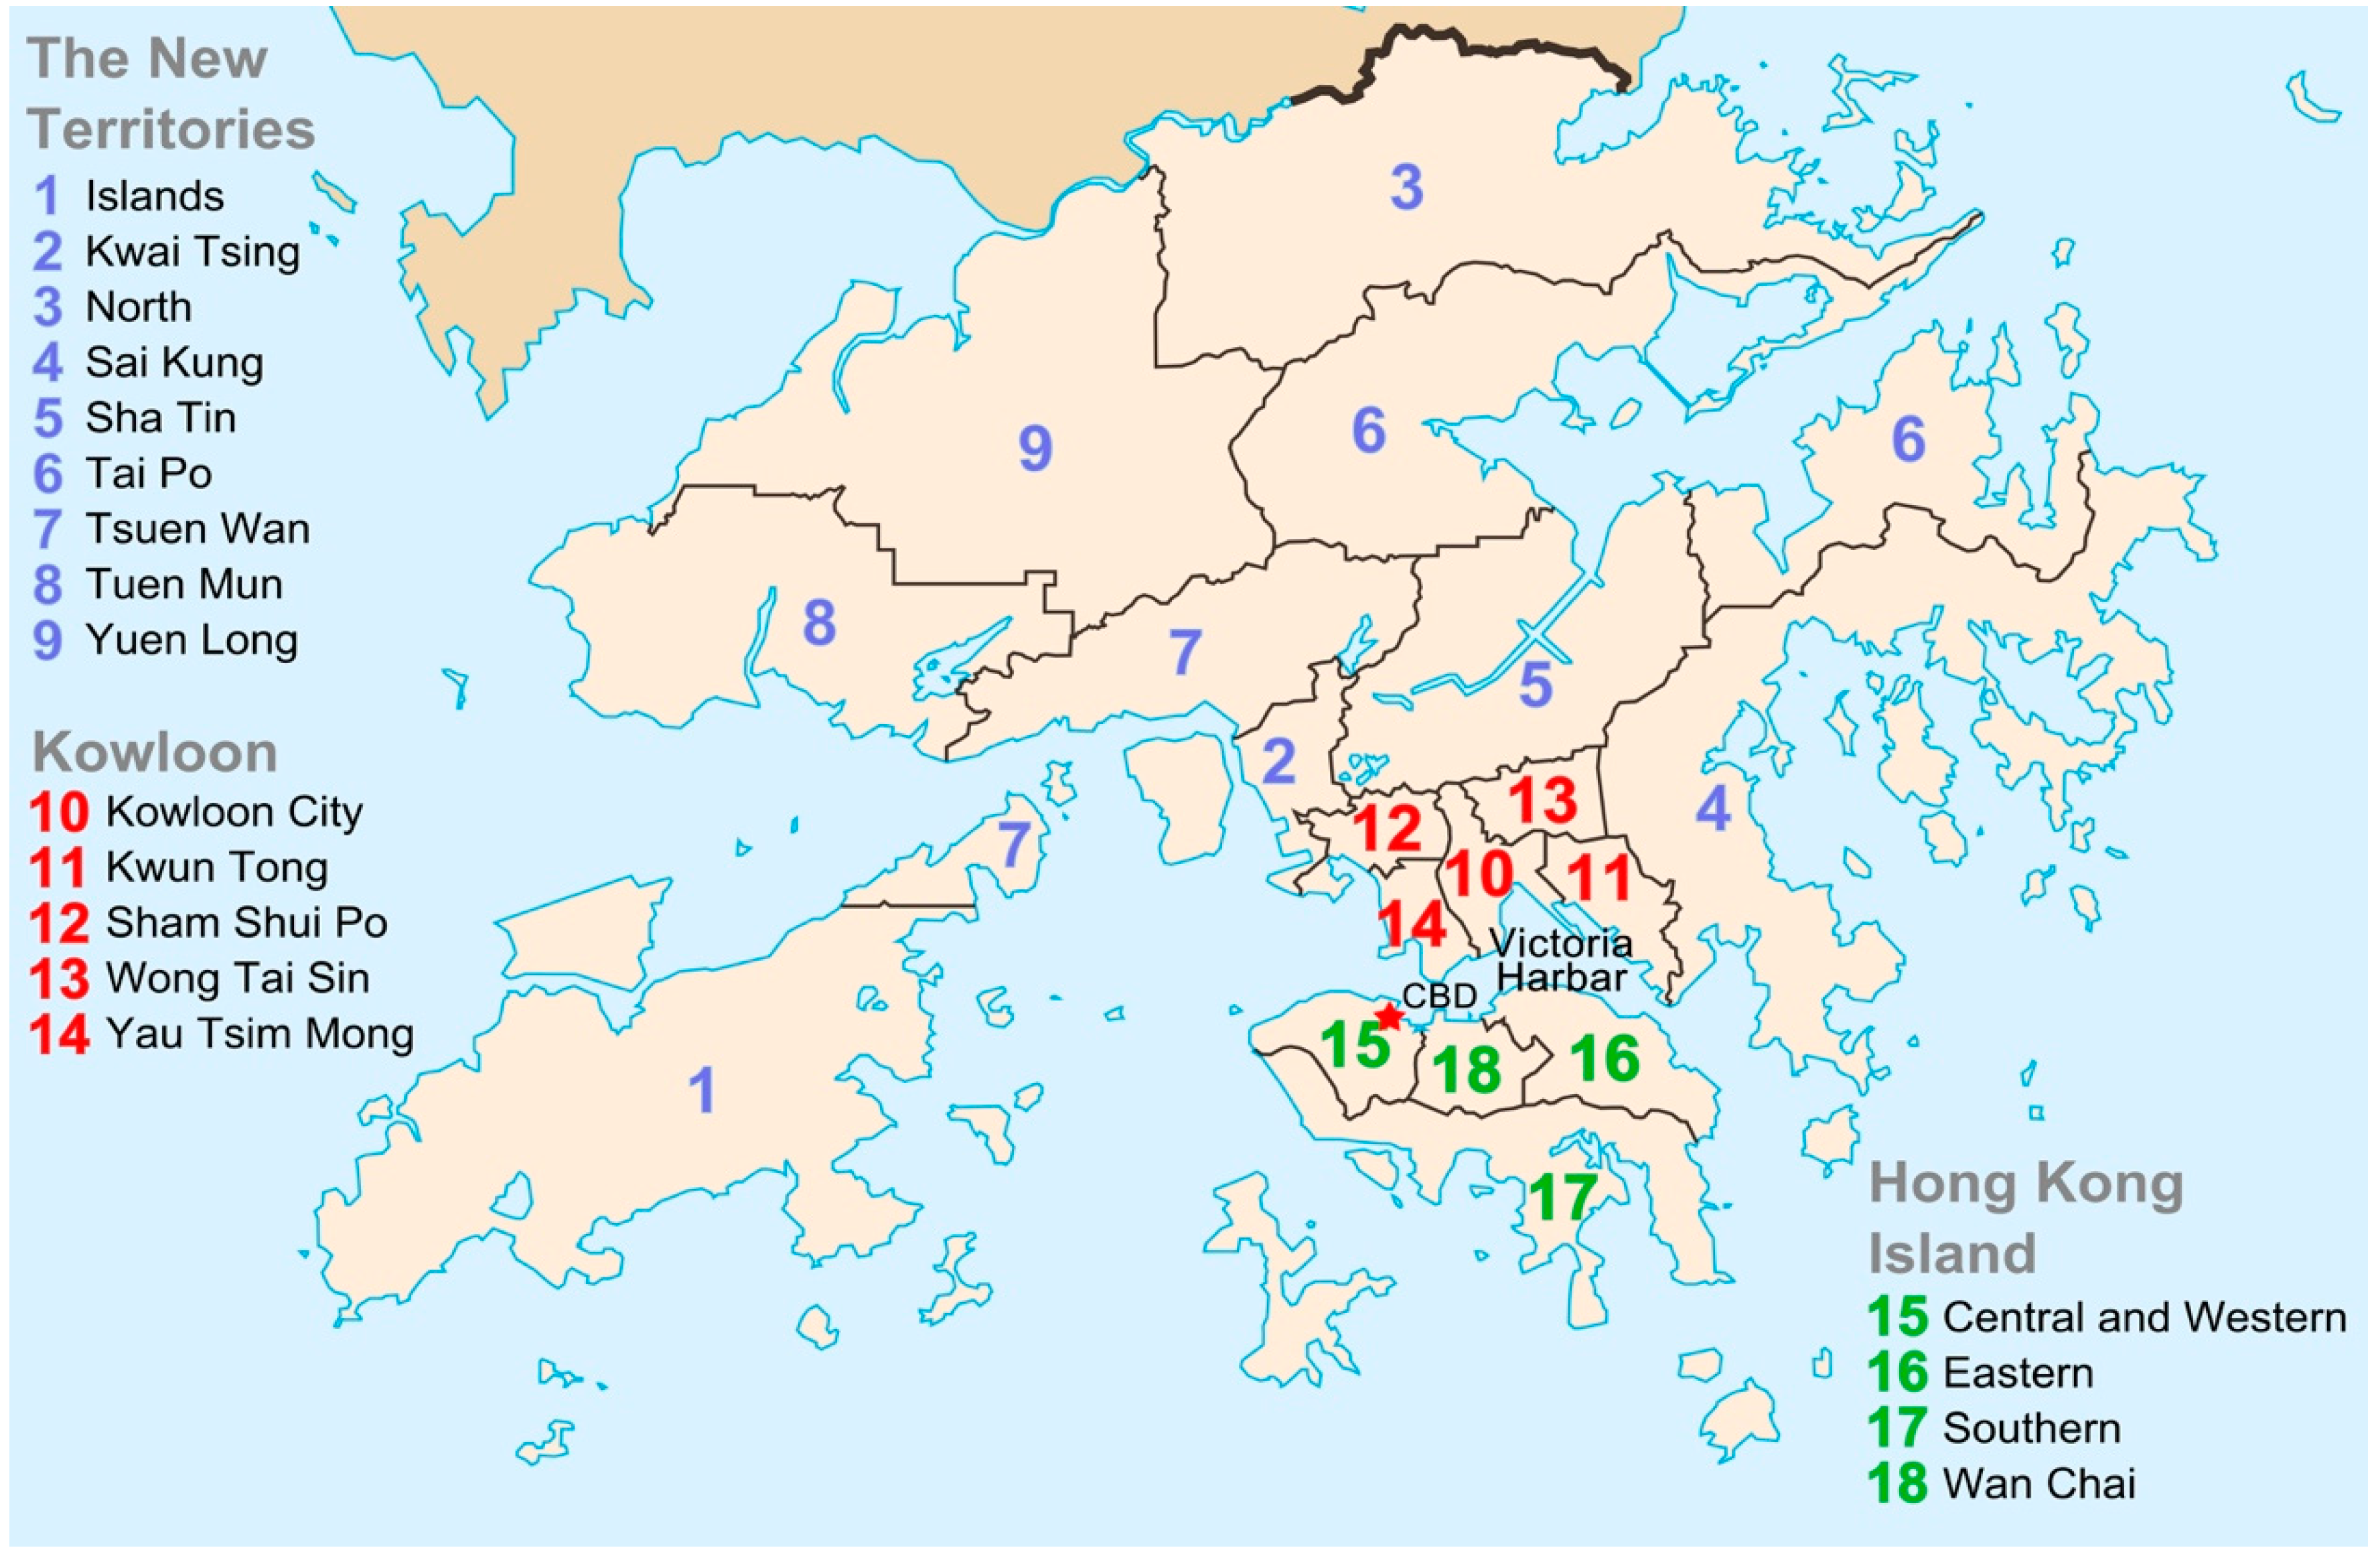
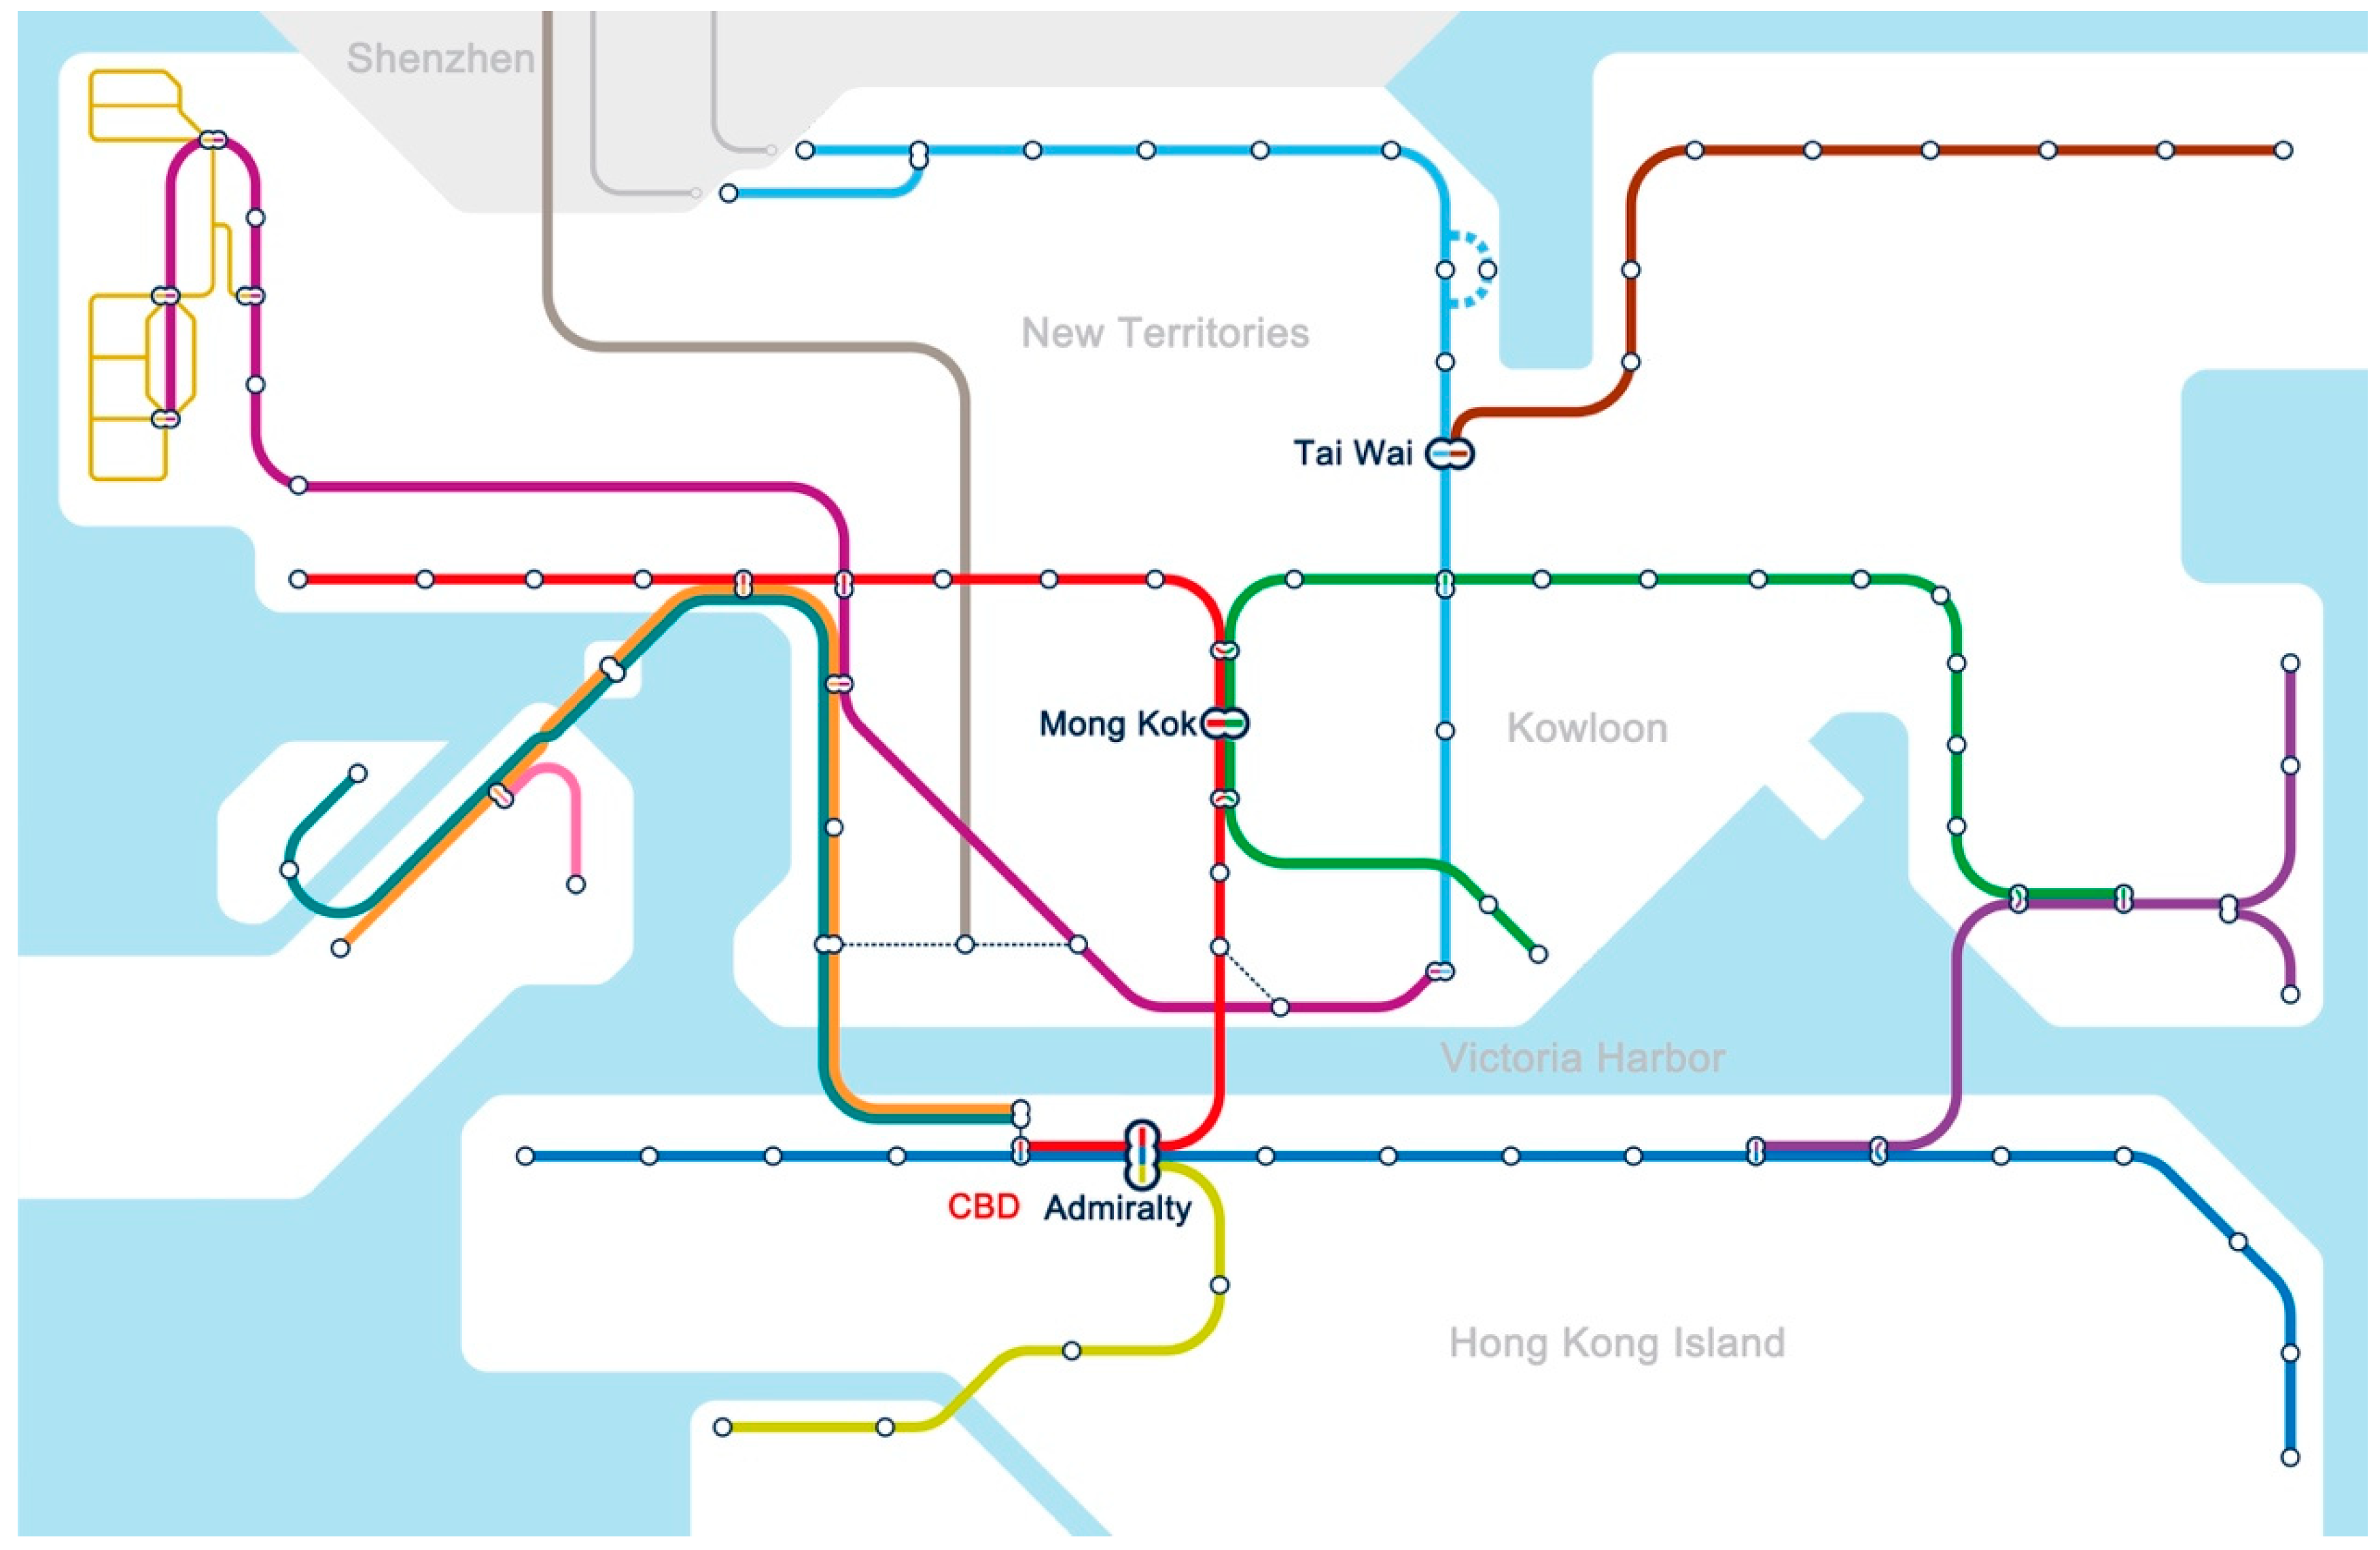
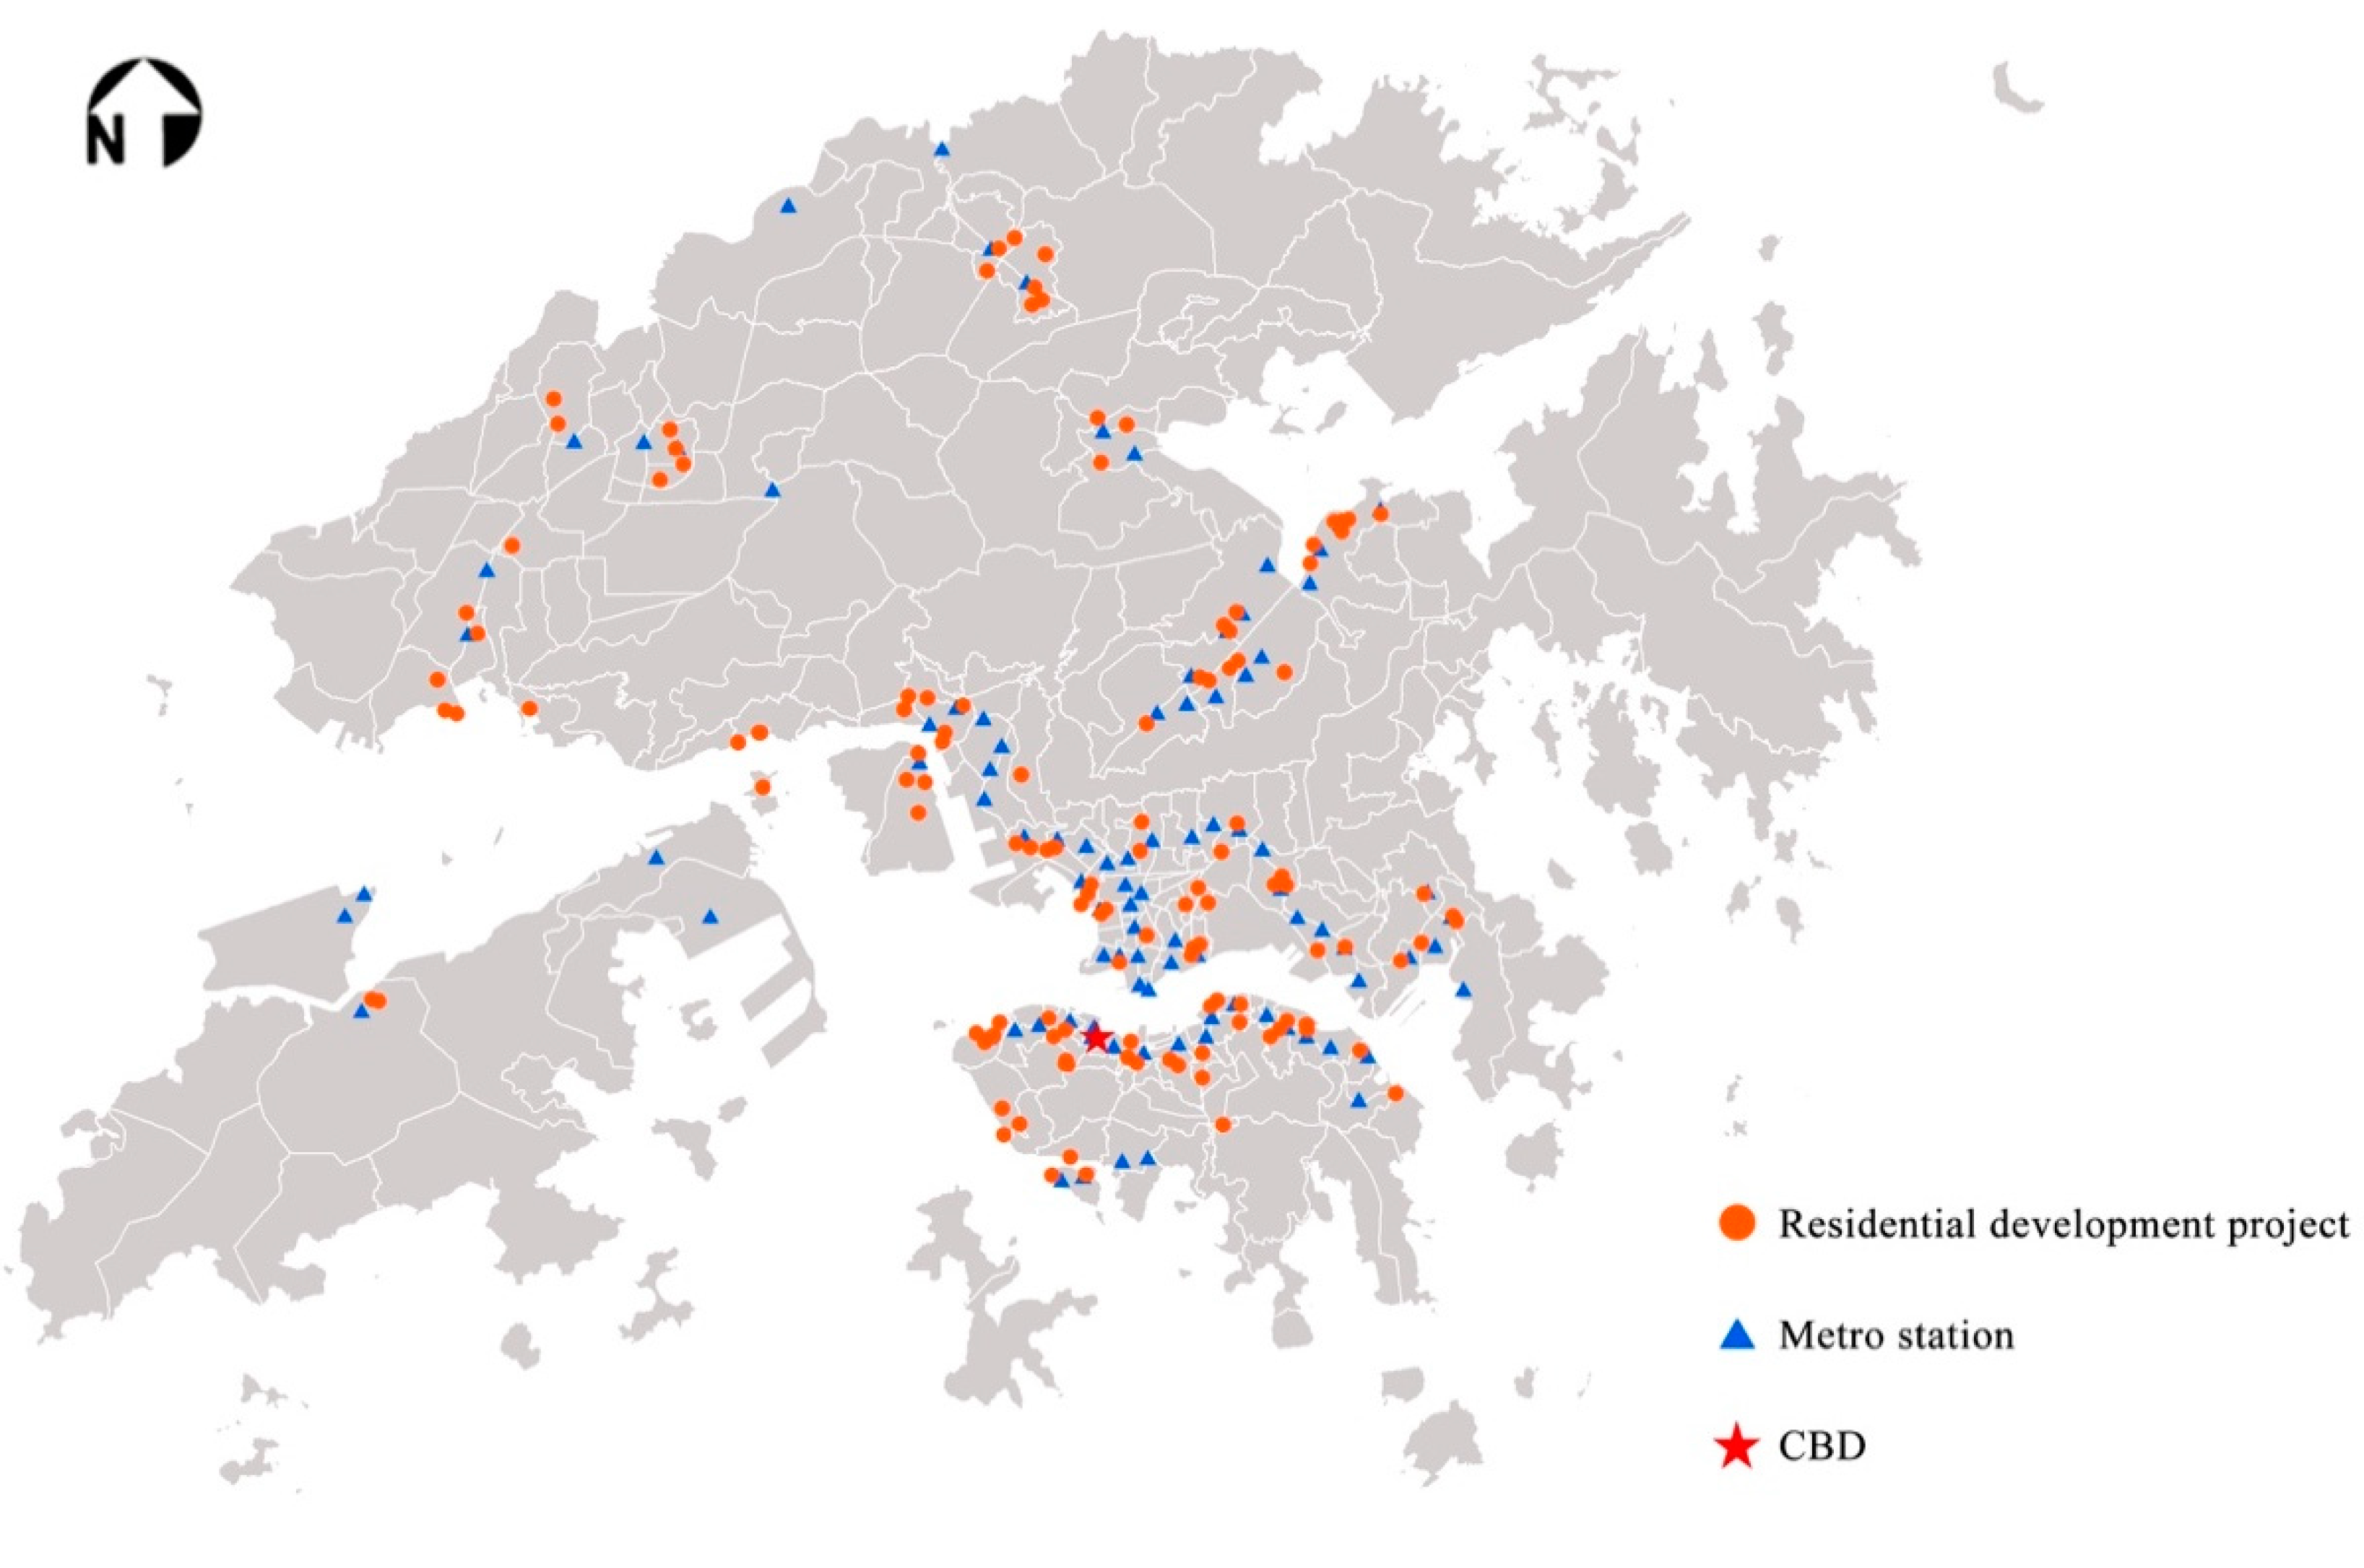
Architects and planners have paid more attention to simulating residents’ location selection and behavior [14,15,20]. Studies indicated that some attributes influenced residential location choice and housing prices, like household characteristics, public facilities, accessibility factors, and environmental elements [47]. Other studies demonstrated there were close relationships across residential location, work location, and other service utilities [13,48]. Residents move to new places that can provide the best combination of influential attributes [49].
From the perspective of housing attributes, housing status and dwelling quality are the first few factors that residents consider in residential location choice [50], as they are related to the quality of living conditions. For public facilities, shopping centers, sport facilities, and parks are convenient for people’s lives [50]. From the perspective of accessibility, access to the central business district (CBD) has an important influence on housing prices [14]. The distance to a bus stop and the quality of public transportation may affect residents’ satisfaction [12]. The number of transit stops also influences residential mobility and changes residents’ travel behavior [50]. Vicinity to lakes, wetlands, and nationally significant landscapes positively affect housing values. Several disamenities, including road noise, railway noise, and industries, have negative effects [43].
Citizens prefer to travel by vehicle and live in single-family houses or semi-detached dwellings in Western countries [51]. However, many Asian cities are faced with problems of large populations and scarce land. They adopt TOD and build high-density multi-family buildings [52]. For example, a typical housing block in Hong Kong is a multi-floor building with 20–40 (and sometimes more than 70) floors, each composed of a number of dwelling units [53]. Many empirical studies focused on low-density cities with automobile-oriented development; studies of residents’ preferences for neighborhoods in compact cities with rapid transit-oriented development are lacking [43,53]. Extensive literature analyzed the impacts of location attributes and environmental elements on housing prices [12,54]. We still do not know what kind of living environment in compact urban areas is most supportive for residents’ satisfaction in meeting their needs or if any differences exist between the influences of location attributes on residents’ preferences and residential values. How do urban planners sustainably design residential development? Therefore, we aimed to develop residential attitudes metrics to evaluate residents’ demands of neighborhoods in compact cities. The impacts of location attributes on residents’ preferences and housing prices were also compared.

3. Case Study Area

Hong Kong is a famous compact city, with an area of 1106.7 km2 and a population density of 6880 persons/km2 in 2018 [55]. In view of the large population and land scarcity, urban planners and policy makers have adopted public-transit-oriented and compact development in Hong Kong to promote its sustainability [4,5]. Hong Kong has strict planning and policy strategies for the development of new urban land, aiming to reduce the damage to the ecological environment [56]. Country Parks, Special Areas, and the Mai Po Ramsar Site cover about 41.7% of the land area of Hong Kong. Total urban or built-up land only occupies around 25% of the land area [57]. These policies can protect wild landscapes and habitats and promote sustainable development. The Hong Kong Government has adopted mass transit railway (MTR) (metro system in Hong Kong) as the backbone of the public transport system. The public transport usage rate in Hong Kong is amongst the highest in the world [58]. The Land Transport Authority of Singapore conducted a study in 2014 that indicated that Hong Kong had the highest public transport usage rate among 27 major cities. MTR can reduce the use of automobiles and air pollution. Hong Kong has also developed high density buildings and mixed land use to reduce the waste of resources [59].
Hong Kong is composed of three major areas: Hong Kong Island, Kowloon, and New Territories. For district councils, Hong Kong is geographically divided into 18 political districts (Figure 1) [60]. The CBD of Hong Kong, named “Central”, is located on Hong Kong Island north of Victoria Harbor. MTR provides comfortable, safe, efficient, and environmentally-friendly transportation. In 2019, the MTR in Hong Kong consisted of 10 lines (Figure 2) [58], providing the main public transportation in Hong Kong and significantly influencing economic and social development.

4. Methodology

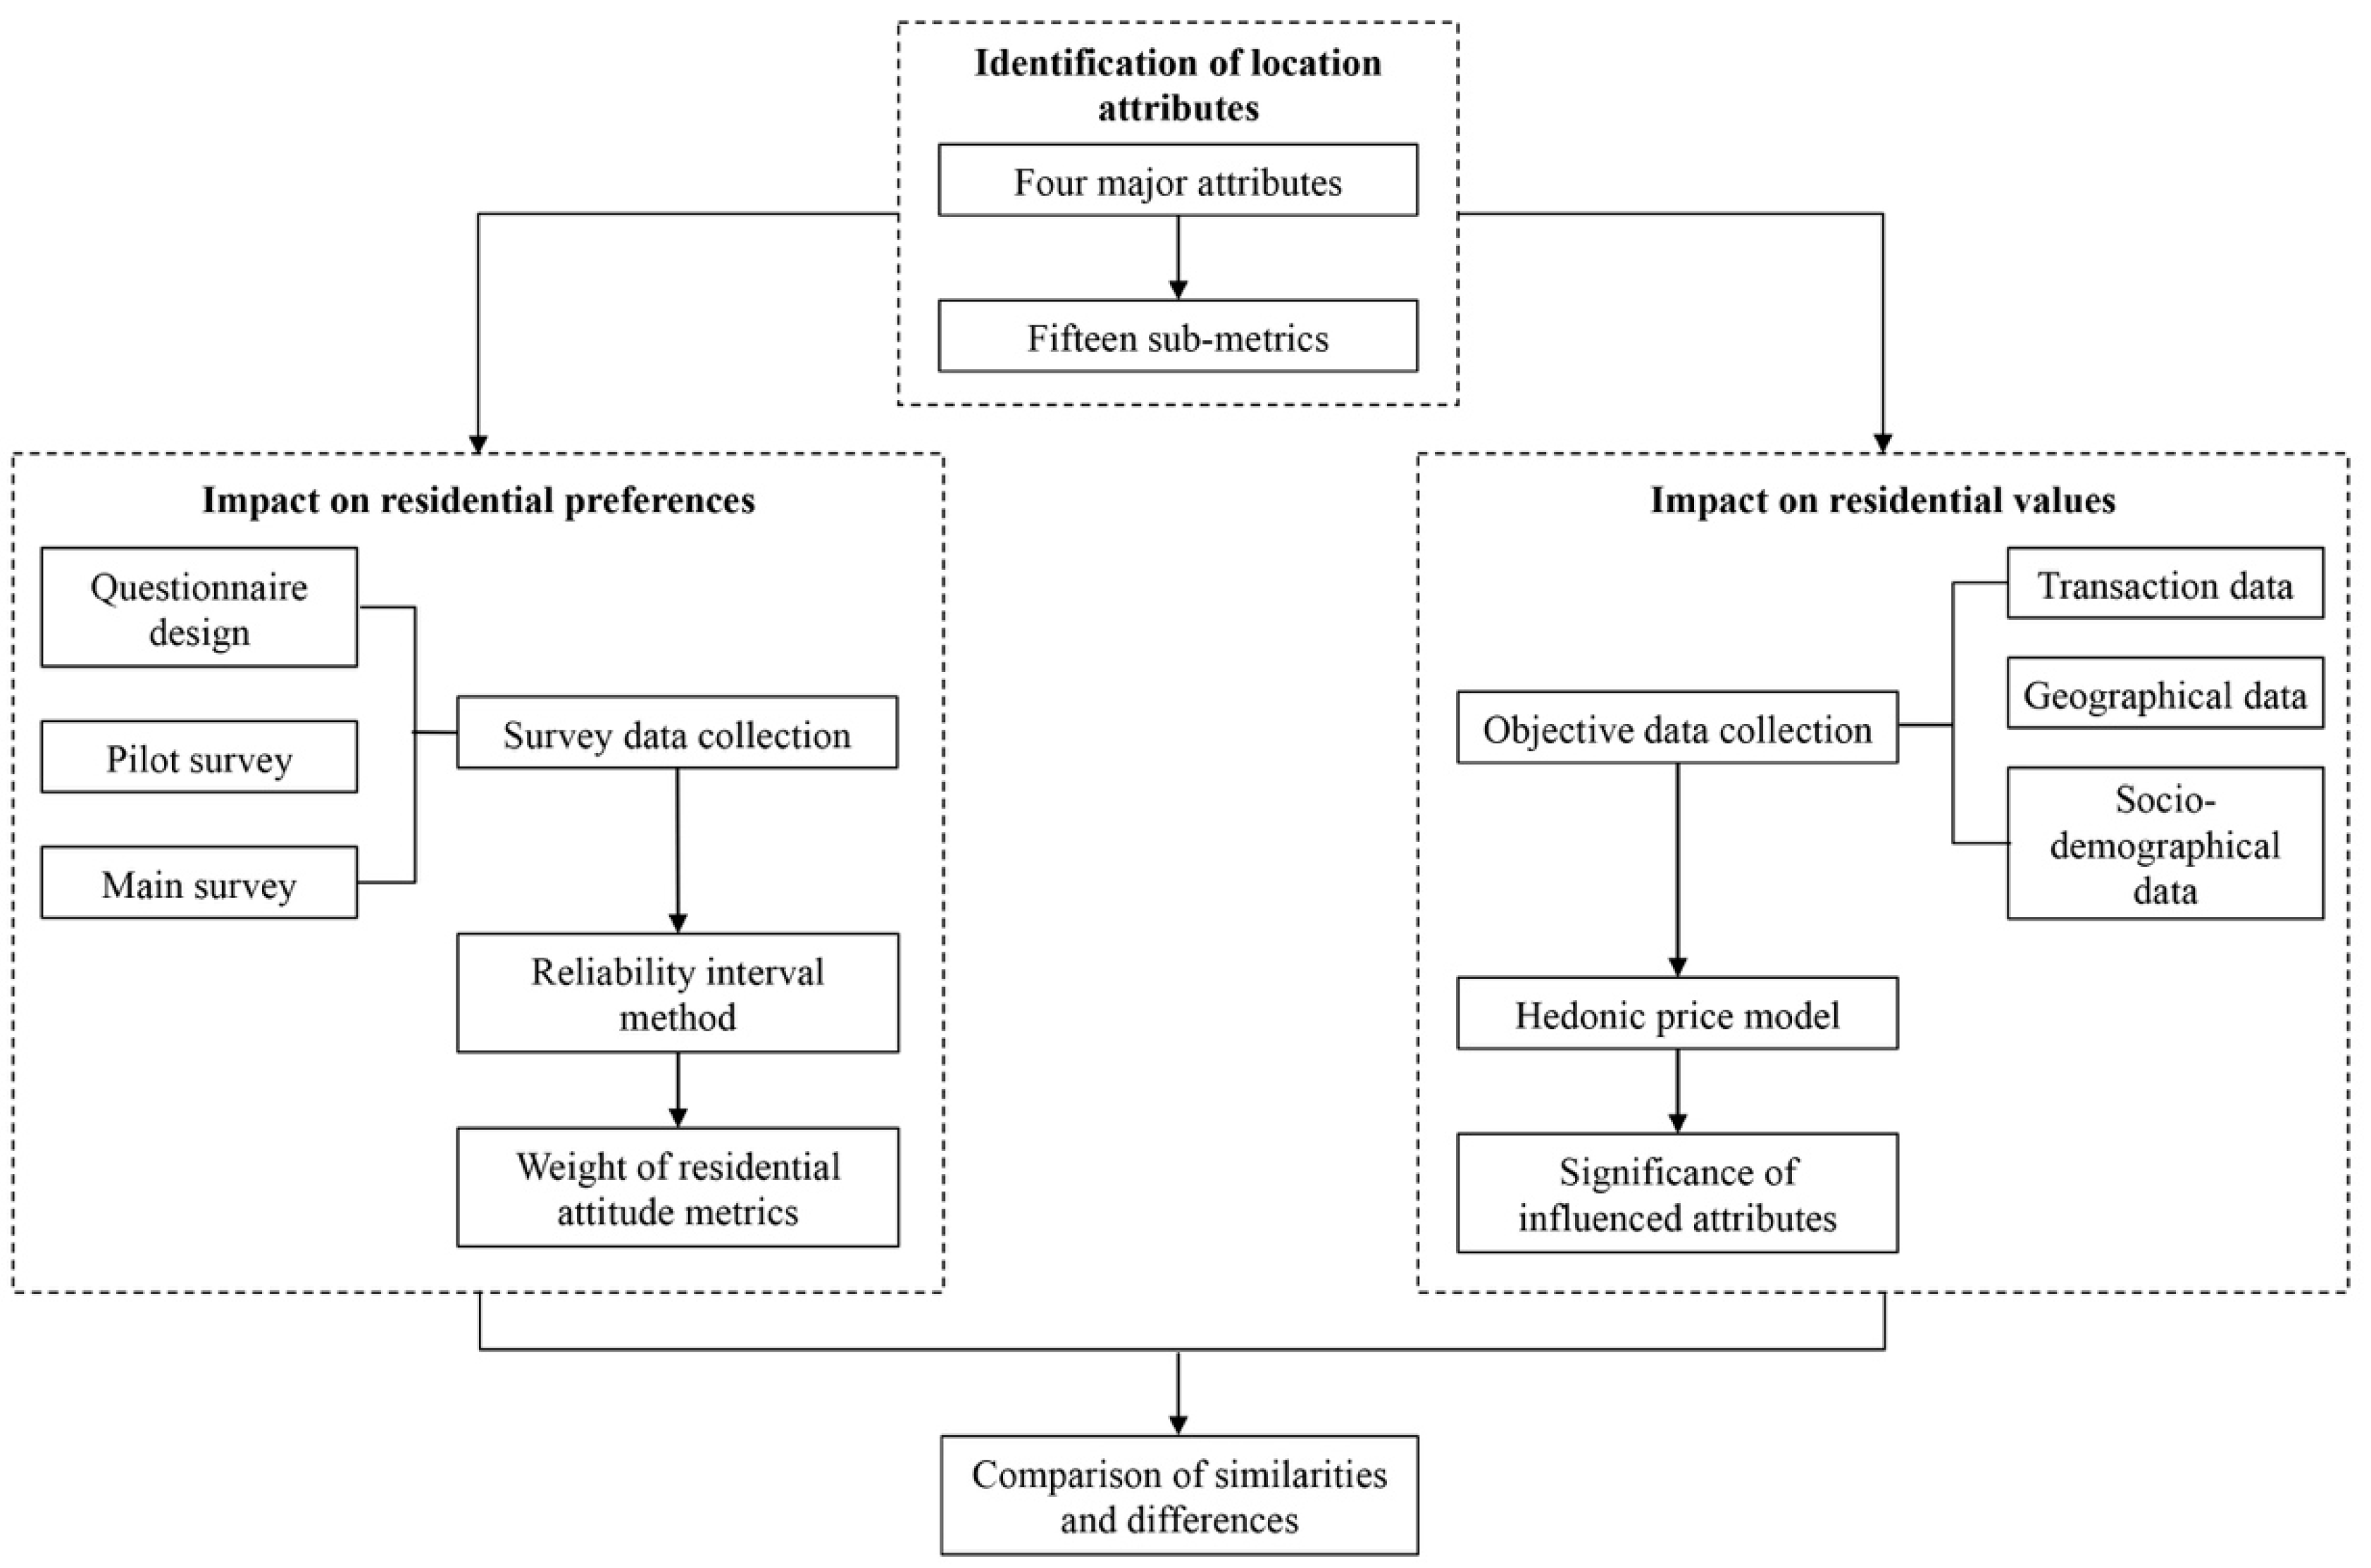
4.1. Overview of the Research Process

To fulfill the research questions, we developed a systematic framework to establish the residential attitude metrics that reflect residents’ prioritized location attributes within compact urbanization, and compared the significance of attributes in residents’ demands and residential value. Figure 3 depicts the study process. Based on the review of previous studies, four location attributes that influence residents’ demands and residential value in compact cities were identified, divided into 15 sub-criteria attributes. Then, the impacts of the location attributes on residents’ preferences and housing values were investigated. For residents’ needs in terms of location attributes, a questionnaire survey was administered to collect the data about residents’ preferences. The survey consisted of three stages: questionnaire design, pilot survey, and main survey. Then, the survey data were analyzed by using RIM to estimate the weighting of the residential attitude metrics. For residential value, transaction data, geographical data, and socio-demographic data were collected. The hedonic price model was adopted to evaluate the significance of influential attributes on housing prices. Finally, the impacts of location attributes on residents’ needs and residential values were compared, and similarities and differences were identified.

4.2. Location Attributes Identification

The residential attitude metrics attributes can be classified into four major categories: accessibility, public facilities, environment, and socio-demographic attributes [63]. Combined with the characteristics of Hong Kong, the 15 attributes identified as influential factors for residents’ decision-making are shown in Table 1.

4.2.1. Accessibility (A)

Accessibility is a significant attribute considered by residents in Hong Kong. In this research, it comprises four sub-metrics: the accessibility index (AI) is an important factor, because travelling to work (or study) requires a large proportion of time in a person’s daily life [13,63]. Different from the car-dominated cities, the access to a metro station (METRO) and access to a bus stop (BUS) importantly influence residential location choice in Hong Kong [53]. Access to CBD (CBD) significantly affects the housing prices, which has been proven in many previous studies [63,64].

4.2.2. Public Facilities (P)

Public facilities may also affect residents’ willingness to purchase a new house. In this study, six sub-metrics were included in this category. Some empirical studies indicated that access to shopping centers (SC) importantly influenced residents’ satisfaction, whereas others reported the opposite result [14,65]. Distance to a primary school (PS), and particularly distance to priority primary schools (PPS) are considered by households with children [64,66]. Distance to parks or recreational facilities (PARK) was estimated, since residents need parks for recreation and to communicate with other neighbors [25]. Distance to sports facilities (SPORT) as well as distance to cultural facilities (CUL) are also factors considered in the residential location decision [25].

4.2.3. Environment (E)

Environment was also evaluated in this study. Distance to natural environments affects residents’ feelings and the perceived quality of the living environment [53]. In Hong Kong, distance to the seashore (SEA), distance to the mountain (MOUN), and distance to the cemetery (CEME) may play an important part in residential location selection [53,64,65].

4.2.4. Socio-Demographic (S)

Socio-demographic factors included population density (PD) and median household income (MHI). They reflect the social characteristics of a neighborhood. Some studies showed population density and median household income have important influences on housing prices [13,63].

4.3. Residents’ Demand on Neighborhoods

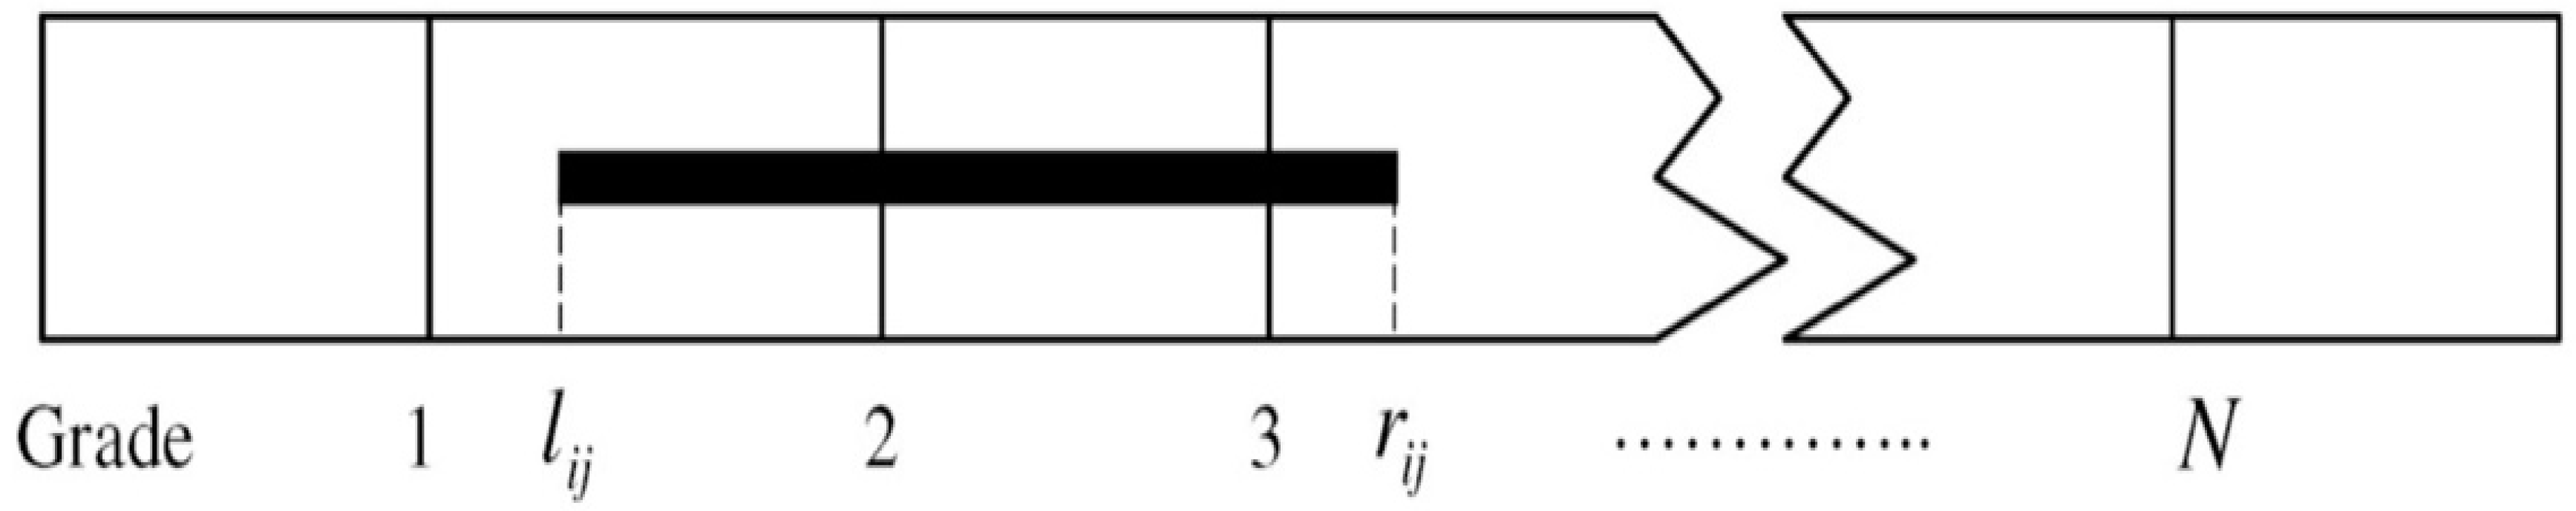
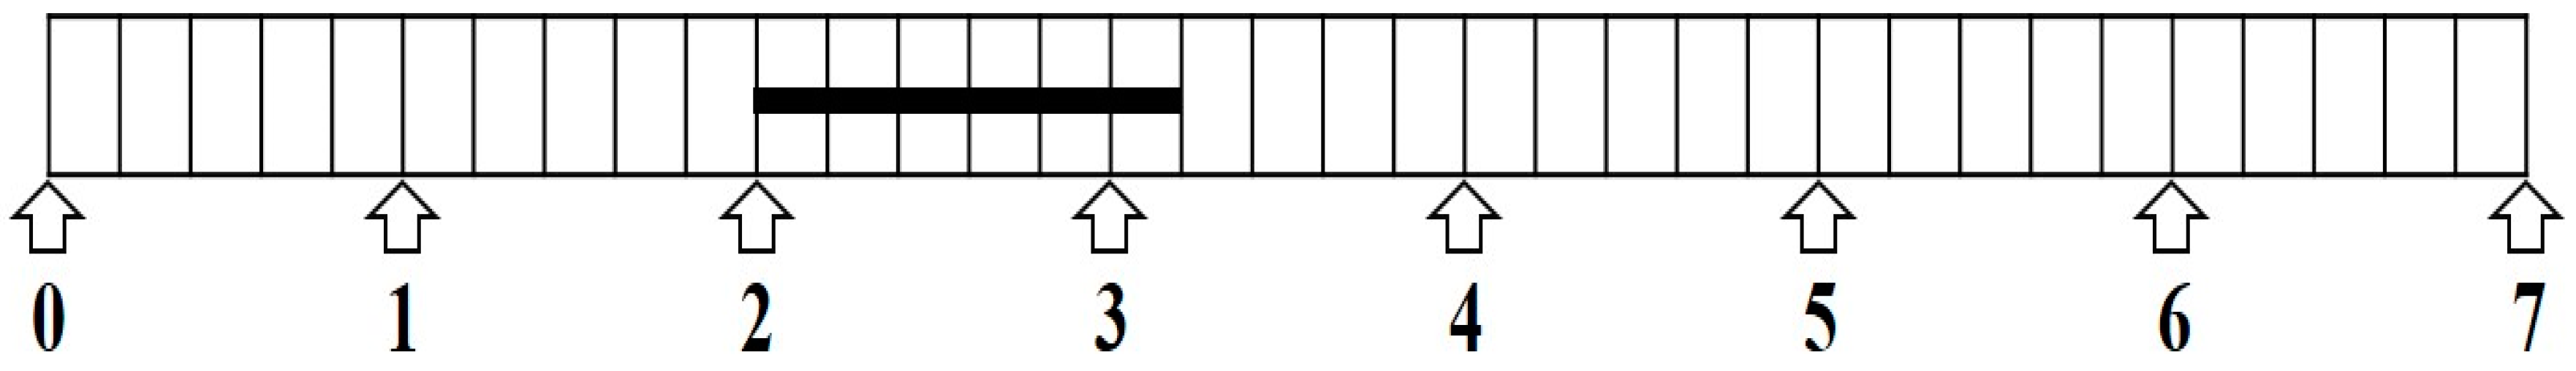
4.3.1. Reliability Interval Method

Previous MCDA methods used fixed integers or pair-wise comparison to assess the importance of each variable. However, respondents sometimes cannot directly provide an integer assessment for some attributes and confuse the pair-wise comparison with many attributes. Therefore, RIM was developed to measure the fuzzy range of weight for each attribute based on the respondent’s point of view [34]. This method is simpler and more practical than other MCDA approaches (like AHP), especially for estimating a large number of attributes [33,34].
In this research, we applied fuzzy-RIM to assess the residents’ subjective requirements of their living environment in compact cities. Respondents were required to assign a fuzzy grade (1 to 7) to each attribute (Figure 4). Mathematically, the interval grade for the jth attribute [aj, bj] is shown as:
[ a j , b j ] = 1 M i = 1 M [ l i j , r i j ] , 0 l i j r i j N , i = 1 , 2 , , M , j = 1 , 2 , J ,
where J is the number of attributes, M is the number of respondents, N is the number of grades, [aj, bj] is the jth attribute belonging to the interval grade given by all respondents, aj is the minimum grade for the jth attribute given by all respondents, bj is the maximum grade for the jth attribute given by all respondents, [lij, rij] is the jth attribute belonging to the interval grade given by the ith respondent, lij is the minimum grade for the jth attribute given by the ith respondent, and rij is the maximum grade for the jth attribute given by the ith respondent.
The grade eigenvalue of the jth attribute ζj is:
ζ j = 1 2 ( a j + b j ) = 1 M i = 1 M l i j + r i j 2 .
Then, we obtain the normalized weight of the jth attribute ηj:
η j = ζ j i = 1 J ζ i .
With the fuzzy assessment of weights, RIM provides the parameters of reliability, center variance (CV), and interval variance (IV) to verify the results of statistical analysis. For the definition of reliability, the following parameters are introduced:
δ ζ j = { x | | x ζ j | 0.5 } ,
I j = { i | [ l i j , r i j ] δ ζ j ϕ } .
Then |Ij|/M is called the reliability of the jth attribute into the ƞj grade, where |Ij| is the number of set Ij. |Ij|/M evaluates the proportion of respondents’ fuzzy ranges that fall within the average grade.
Center variance (CVj) and interval variance (IVj) for the jth attribute’s weight are defined in Equations (6) and (7), respectively. The CV and IV can provide additional information to verify the ranking of factors.
C V j = 1 M i = 1 M [ ζ j l i j + r i j 2 ] 2
I V j = 1 M i = 1 M [ max { | ζ j l i j | , | ζ j r i j | } ] 2

4.3.2. Survey Data Collection

We developed a questionnaire survey to collect the survey data of residents’ preferences regarding location attributes.

Questionnaire Design

Residents were regarded as the survey population in this study. To evaluate the weighting of the metrics based on residents’ attitudes, the questionnaire contained two parts: residents’ basic information and preferences. The first part had six close-ended questions regarding sex, age, education, occupation, median monthly domestic household income, and district. The second part aimed to assess the relative importance of the 15 attributes according to residents’ attitudes. Respondents were asked to draw a line to indicate the scores of 15 questions, as shown in Figure 5. The criteria of the scores are given in Table 2.

Pilot Survey

The pilot survey was used to ensure respondents understood the questions and to maximize the response rate and minimize the error rate on answers [67]. According to the Hong Kong Census, participants in this survey were categorized into four groups: 15–24, 25–44, 45–64, and ≥65 years old [68]. The initial questionnaire was tested on a small sample of participants covering four age groups of the target population. We invited 30 respondents to complete the test questionnaire for one week. They answered the questions face-to-face. All 30 responses were collected and 28 answers were useful.

Main Survey

The final questionnaire was produced according to the responses from the pre-testing survey. The respondents were randomly selected at three interchanges in the three major districts, including Tai Wai Station in the New Territories, Mong Kok Station in Kowloon, and Admiralty Station in Hong Kong Island (Figure 6). These three interchanges gathered citizens from many areas in Hong Kong. 165 respondents from four groups of residents in Hong Kong were invited to respond in writing. The main survey was conducted during one month from September to October, 2017. People were not offered monetary incentives. Finally, 161 questionnaires of 165 were completed; 156 were available for later analysis. The refusal rate was 5.45%.

4.4. Influence on Residential Value

4.4.1. Hedonic Price Model

The hedonic price model is commonly used to show the relationship between residential property values and housing characteristics [19]. It assumes that people value the characteristics of a good or the services it provides rather than the good itself [38]. The differences in the quantity of each characteristic lead to the discrepancies in property values. A multiple linear regression model is used to calculate the proportion of total value accounted for by each of a property’s individual features. A simplified equation of hedonic price model can be expressed as follows:
P i = β 0 + β 1 X 1 + β 2 X 2 + + β n X n + ε ,
where Pi is the recent sales or rental price of the ith observation, β is the regression coefficient, and Xn includes the nth explanatory variables, such as plot size, household, income, age, living environment, proximity to public transport facilities, and other facilities.
The semi-log form of the hedonic price model has been commonly used to relate the housing price and each constituent variable in recent literature [19,53,54]. The estimated semi-log hedonic price model allows an easy interpretation of coefficients [43]. The estimated model becomes:
ln P i = β 0 + β 1 ln X 1 + β 2 ln X 2 + β 3 X 3 + + β n 1 ln X n 1 + β n X n + ε ,
where lnXn−1 refers to three large parameters (AI, PD, and MHI), which are normalized to have the beta in the same magnitude.

4.4.2. Objective Data Collection

In this study, the impact of location attributes on residential values in Hong Kong was evaluated. According to the Centaline database, the data of 116 residential real estates in Hong Kong were collected. Figure 7 shows the location of the 116 observations. The data resource for each variable is listed in Table 3. The transaction data for 2017 were obtained from the Centaline database, which provides the residential project’s name, median unit price, address, constructed date, number of units, etc. The database was provided by the Hong Kong Land Registry and market sales.
The accessibility index is calculated with the total number of employment in each area and the network distance between each two areas. The data of the former were obtained from the Hong Kong Population Census, whereas the latter were obtained from Google Maps (Google LLC, Mountain View, CA, USA). The locations of the metro stations, bus stops, and CBD were processed in Open Street Map (OSM) to ArcGIS (Esri, Redlands, CA, USA). Then, the network distance of each observation to the nearest metro station, bus stop, and CBD was calculated using Google Maps or ArcGIS. The addresses of shopping malls, primary schools, parks or recreation facilities, sports facilities, and cultural facilities were obtained from GeoInfo Map. After converting and storing the coordinates in ArcGIS, the network distance from properties to these facilities was identified by Google Maps. Notably, priority primary schools were published by the Hong Kong Professional Education Press. The distance to the seashore, mountains, and cemetery were calculated by OSM and ArcGIS. Population density and median household income were obtained from the Hong Kong Population Census.

5. Results

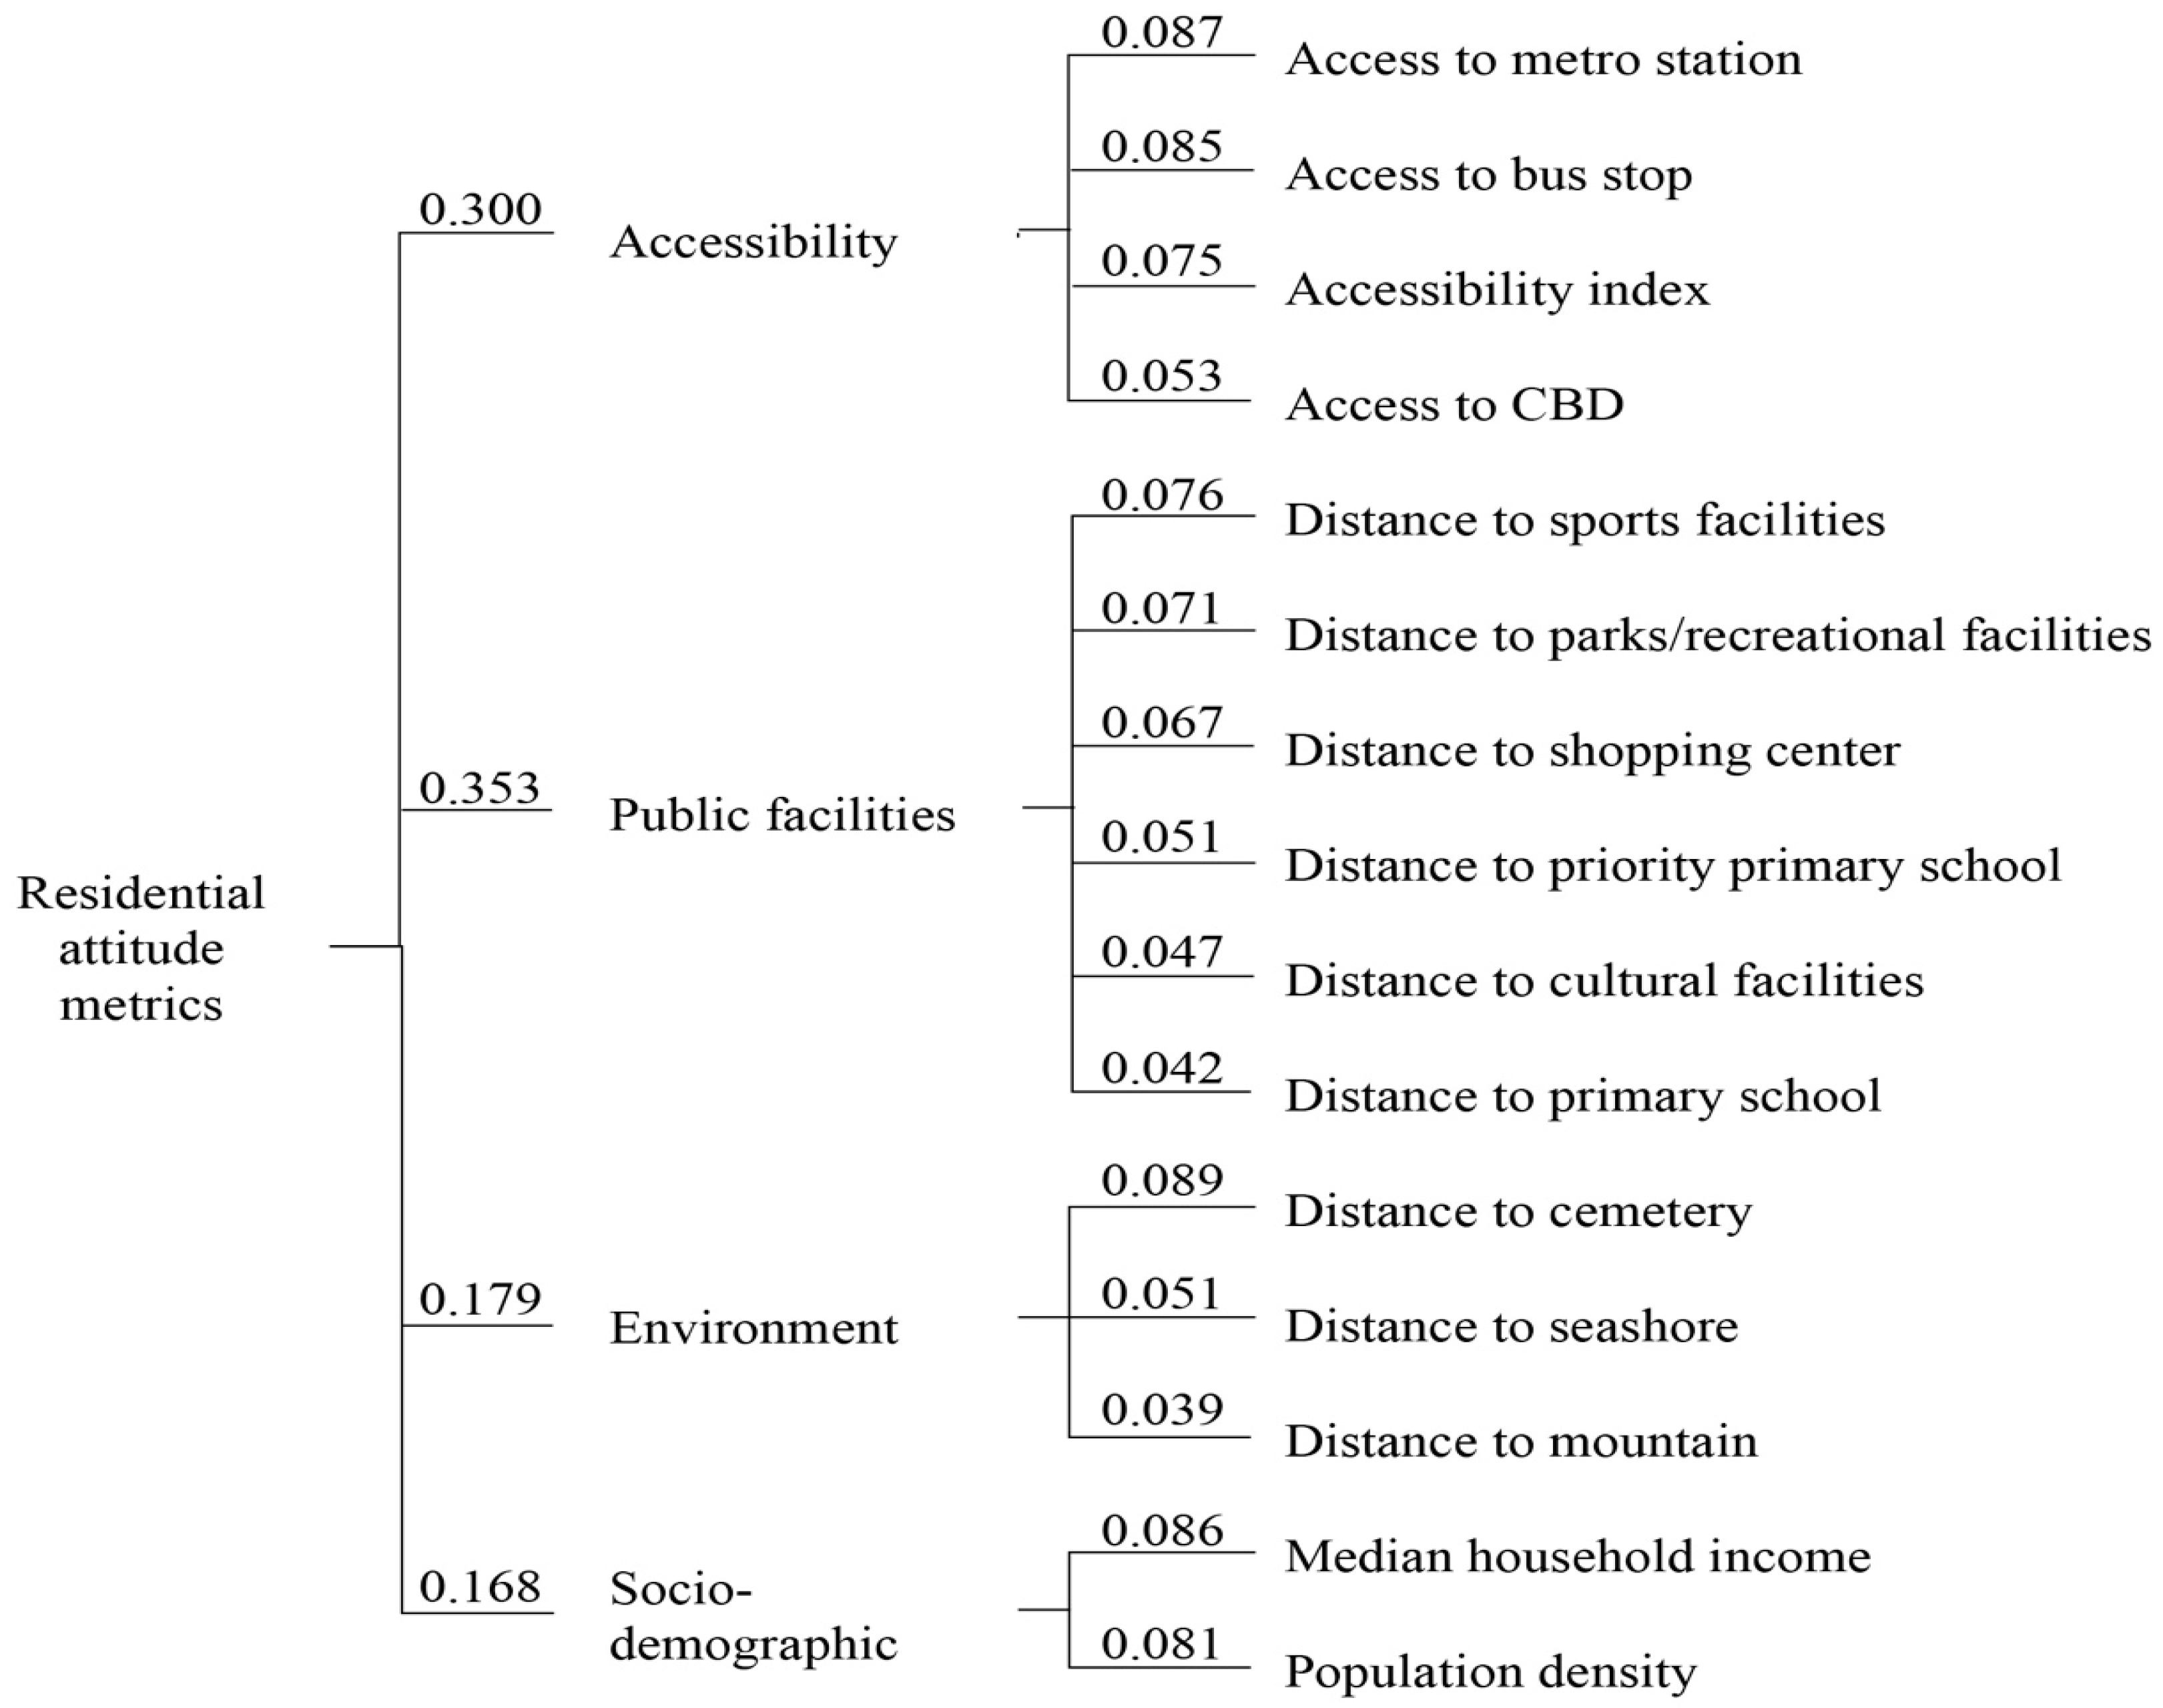
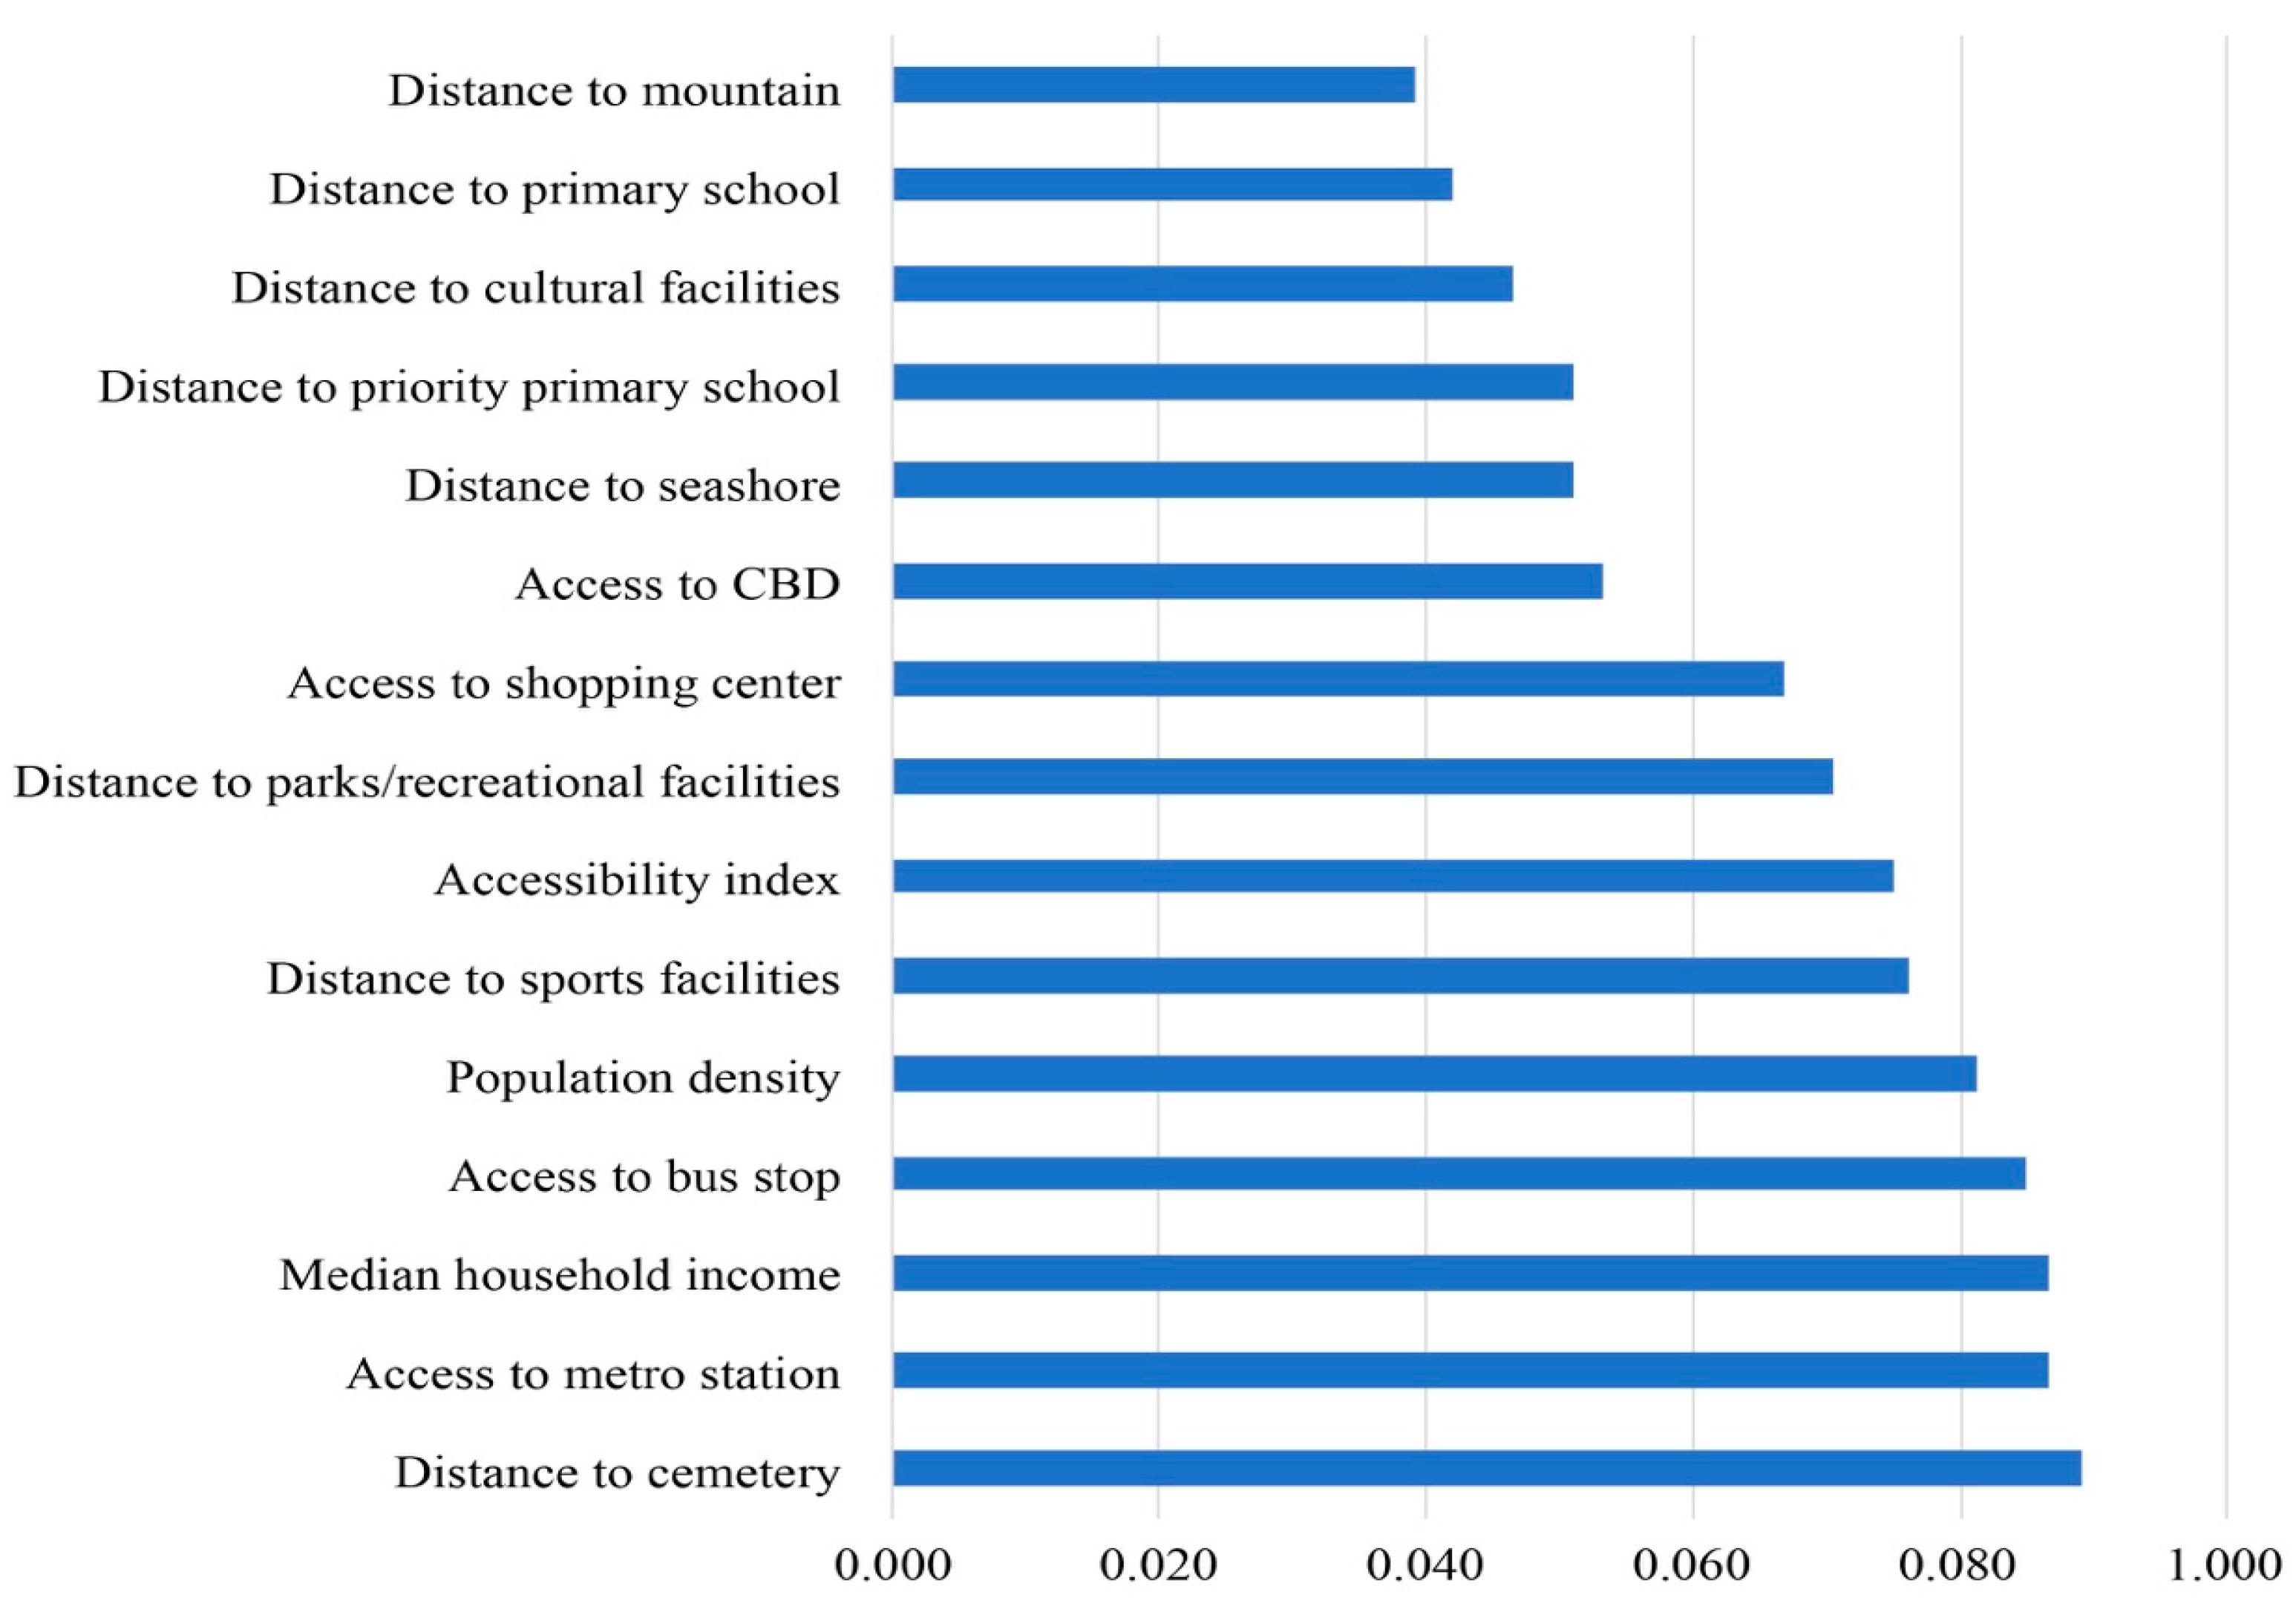
5.1. Result of Reliability Interval Method

The surveys of 68 men and 88 women living in Hong Kong were available for this study. The proportion of the four age groups in this survey was close to the proportion in Hong Kong (Table 4). Of the participants, 12% had only primary education or below and 49% had college or a higher level of education. Of the respondents, 18% did not work, since some of them were students or elderly or retired. Of the participants, 16% worked as professionals. The proportion of participants with a median monthly household income from HK$20,001 per month to HK$40,000 per month was 54%. A large number of respondents lived in Eastern and Yuen Long districts, at 17% and 10%, respectively (Appendix A).
The RIM analysis results are shown in Table 5, which presents the relative importance of each attribute and the variance of the results. Figure 8 presents the residential attitude metrics in Hong Kong. The weighting of the accessibility attribute was 0.300. The weightings of the three sub-metrics under the accessibility attribute, access to metro station, access to bus stop, and accessibility index, were larger than 0.075. The public facilities attribute had the most sub-metrics, and the total weighting (equals 0.353) was larger than other three major attributes. The weightings of all sub-metrics within public facilities attributes were less than 0.076. The environmental attribute contributed 17.9% of the four major attributes. The sub-metric distance to the cemetery had the largest weighting in the residential attitude metrics. The socio-demographic attribute had the fewest sub-metrics and lowest weighting (0.168) among four major attributes. The weightings of two sub-metrics under the socio-demographic attribute were more than 0.081.
Figure 9 shows the weightings of the 15 sub-metrics based on the residents’ preferences. The weightings of five sub-metrics—distance to the cemetery, access to a metro station, median household income, access to a bus stop, and population density—were above 0.080. This indicated that they had the most important influences on residents’ attitudes.

5.2. Result of Hedonic Price Model

The descriptive statistics of the dependent variable and 15 independent variables in the analysis of hedonic price model are presented in Table 6.
According to the correlation test, lnAI, PARK, CUL, and lnPD were removed from the analysis. Table 7 shows the regression results of the hedonic price model. For the estimation of the accessibility variables, both access to metro stations and access to the CBD had negative and significant influences on housing prices. The average sales price of residential properties increased by 3.3% if the distance to a metro station decreased by one meter. The sales prices of residential properties increased with increasing proximity to the CBD. However, both public facilities and environment variables did not significantly influence the residential values. For socio-demographic variables, the median household income was statistically significant.

6. Discussion

6.1. Comparision of the Impacts of Location Attributes on Residents’ Demand and Residential Value

Sustainability is a challenge of meeting human needs and maintaining a balance between social, economic, and environmental development. We established the residential attitude metrics to present residents’ demands from their neighborhoods in compact cities. A questionnaire survey was constructed to collect data about residents’ preferences in terms of location attributes. The survey data were analyzed by RIM to measure the weight of each attribute in the residential attitude metrics. The hedonic price model was adopted to evaluate the impact of location attributes on housing prices. Then, the influences of location attributes on residents’ needs and residential values were compared. The findings can be used by planners and designers to prioritize significant elements in directing the development of residential areas. These findings can help urban planners and policy makers to balance residents’ demands and the economic interests of residential urban planning in compact cities for supporting sustainable development. Five attributes in the residential attitude metrics had the highest weightings: distance to the cemetery, access to a metro station, median household income, access to a bus station, and population density. Only three attributes significantly influenced housing prices: median household income, access to the CBD, and access to a metro station. The findings indicated that residents’ preferences for location attributes were different from the influences of these attributes on housing prices.
Comparing the influences of these attributes on residents’ needs and residential values, both access to metro station and median household income have important impacts. MTR is the most popular transportation mode in Hong Kong. Passenger trips through MTR accounted for about 42% of the total passenger travel by public transport services in 2017 [69]. The public chose MTR as the initial travel mode, including for traveling to work, study, or shopping [65]. The highly efficient MTR network with comprehensive coverage has facilitated citizens’ daily commute and addressed passenger demand. About 77% of commercial and office gross floor area and 45% of houses are located within 500 m of a metro station [70]. Residents first consider median household income when they decide to purchase a new house, as it determines the affordable value of residential properties [49,63]. Access to a metro station and median household income have close relationships with residents’ demand and economic interest.
Other attributes had different levels of effects on residents’ demand and residential value. Some attributes were found to be important for residents’ requirements. People in some Asian countries, particular in Hong Kong, attach great importance to the Fengshui of houses [71]. They do not like to live near cemeteries because they think it is unlucky. Since public transport is closely related to citizens’ daily lives in compact cities, residents prefer to live in houses close to bus stops. In Hong Kong, 45% of public passenger trips are completed using buses each day [69]. Different types of people like to live in residential areas with different densities [63]. Public facilities in a neighborhood influence residents’ willingness to purchase a new house. Abundant public facilities can protect residents’ physical and mental health. Residents need parks and sports facilities to relax, train, and communicate with their neighbors. These attributes importantly influence residents’ attitudes, but do not significantly impact housing prices.
Access to the CBD significantly influenced housing prices, but was not important in terms of residents’ demand. The CBD in Hong Kong is regarded as a metropolitan business core with an agglomeration of business activities [72]. It is also the political and cultural center. The CBD is aggregated with buildings of government offices, international financial business buildings, shopping malls, and museums. It is also one of the most expensive areas in the city. Thus, proximity to the CBD was proven to have an important influence on housing prices [14,63,64]. Although people work in many districts in Hong Kong, only 4% of citizens work in the CBD. Residents do not regularly travel to the CBD. Therefore, they do not have a strong willingness to live close to the CBD.
The findings showed that housing prices cannot reflect residents’ needs as they are controlled by government policies on town planning, land supply, and the tax system [18,19]. To produce benefits and profits, developers have constructed public facilities and other service utilities in areas with high value. However, this exacerbates social inequity. Not all residents can afford high prices. For sustainable development, urban planners and policy makers should not only consider the profit of residential real estates, but also meet the current demands of residents in compact cities. Therefore, we established the residential attitude metrics, which can help urban planners and policy makers to prioritize aspects with high weights when they plan a new residential area. The metrics provide the foundation for evaluating whether residential land use planning and policies balance the residents’ needs and economic interests in compact cities.
Urban planners and policy makers should pay more attention to residents’ needs during residential planning and planning of policies for supporting sustainability. Residents’ demands from their living environment focus on public facilities, the convenience of travel, and the social attributes of the neighborhood in compact cities. First, some public facilities that residents dislike should be located far from residential properties, such as cemeteries and waste treatment plants. Planners and policy makers should provide sufficient public infrastructure and facilities, such as gyms, basketball courts, and parks. The planning department should promote rapid railway investment and bus system construction in compact cities. They need to provide walkable and public-transit-oriented development to create sustainable neighborhoods. Urban planners and architects may provide a wide variety of housing types (like single-family detached homes, multiple dwellings, and high-rise apartments) to meet the needs of different residents.

6.2. Comparison with Evidence from Previous Studies

Previous empirical studies of Hong Kong commonly focused on the influences of housing attributes on residential values. Few studies have estimated residents’ needs in compact urban areas. However, housing prices are significantly influenced by government policies and real estate developers. Residential value cannot fully reflect residents’ subjective requirements of a neighborhood. Therefore, we evaluated residents’ preferences for location attributes in compact cities, and compared the influences of location attributes on residents’ satisfaction and housing prices. In Hong Kong, distance to the cemetery, access to a metro station, median household income, access to a bus, and population density are the first factors considered by residents in their residential movements. Housing prices are significantly influenced by variables including median household income, access to the CBD, and access to a metro station.
Regarding the housing prices results, where the accessibility of the CBD and MTR stations were examined, the influences were mostly consistent with those of previous studies [53,64,73]. For public facilities variables, the number of secondary schools near the apartments was found to have a positive impact on residential property values [64], whereas our estimates showed that the accessibility of primary schools was non-significant for sales prices. For environmental attributes, we found that the distance to the nearest seashore does not have a significant effect on residential values, which also agrees with previous studies [53,73]. The distance to the nearest mountain was previously found to have a significantly negative influence on housing prices, whereas the result in this study was the opposite. Notably, all observations were obtained from the same district in previous empirical studies, whereas our study area covered all political districts in Hong Kong. As for social-demographic attributes like median household income, which was important for housing prices in our study, previous studies rarely examined these attributes.
For the result of residents’ demands on their living environment in compact urban areas, which was the main focus in this study, the evidence from previous studies was limited. Previous studies paid more attention to the attitudes of different types of residents towards compact cities. The characteristics of residents that prefer to move to compact urban areas were investigated. The results of empirical studies indicated that residents with greater awareness of the environmental and social consequences of development patterns were willing to live in a compact and mixed-use neighborhood [74]. Residents’ age, household structure, neighbors, and apartment significantly influenced their attitudes toward compact city living [75]. However, residents’ preferences for location attributes and needs for the neighborhood in compact cities have rarely been studied. Regarding the results of residents’ preferences for compact neighborhoods, accessibility and proximity to public facilities had consistent effects in previous studies [5]. However, we examined more attributes, including environmental and socio-demographic attributes. We evaluated the compact urban residents’ demands on their living environment and preference for location attributes. The results enrich the understanding of residents’ demands and expectations in compact cities.
The findings of this study complement the lack of research on residents’ living environment needs in compact cities. The evaluation of residents’ preferences for neighborhoods in Hong Kong may enhance the scope for generalizing the findings to other compact cities or regions. The findings may help urban planners and policy makers to understand some attributes, such as distance to the cemetery and access to metro station, that significantly influence residents’ satisfaction. Urban planners and policy makers should prioritize these attributes in the decision-making during residential planning and housing policy formulation. They can help other cities or regions with similar patterns of urbanization to meet residents’ needs in their living environment and promote sustainable development.

7. Conclusions

Compact cities adopt high-density and mixed land use and transit-oriented development. Good residential land use planning can meet residents’ needs, decrease travel costs, and promote sustainable development. Recent literature has mainly focused on simulating residential movements and investigating the influences of housing attributes on residential values. However, few studies evaluated residents’ preferences in compact urban areas. More importantly, the impacts of location attributes on residents’ demands and economic interest have rarely been compared. Therefore, we developed the RIM to evaluate residents’ preferences for neighborhoods in compact cities. The residential attitude metrics were developed to support sustainable residential land use planning and policies. In the residential attitude metrics, public facilities are first considered by residents. Distance to the cemetery, access to a metro station, median household income, access to a bus stop, and population density are the most significant attributes at the second level. Notably, access to the CBD, median household income, and access to a metro station significantly influence housing prices. The comparison showed that proximity to the CBD had the most important impact on residential value, but this factor was not significant for residents.
These findings provide more information about and insights into urban planning and policy making to draft sustainable residential urban planning and housing policies and the related strategies in compact cities. For sustainable development, urban planners and policy makers should pay more attention to residents’ needs during the development of large and dense urban settlements. They should balance residents’ demands and economic interests during residential land use planning and policies. The residential attitude metrics can help them prioritize aspects with high weights when establishing a new housing policy, and determine what actions should be taken to improve the quality of the living environment. RIM can be a useful method for evaluating citizens’ attitudes toward other types of land use, providing a win-win strategy for residents and local government to sustainably increase and maintain residents’ quality of life.
This study is not without its limitations. The sample size in this survey was 165. Although it covered the residents living in each district in Hong Kong, the current sample size cannot represent the overall population. Thus this research can only be referred to as proof of concept. A much larger sample size will be needed in future work. The conclusion will be more convincing. The questionnaire survey was conducted within three metro stations in Hong Kong. More residents will be invited to participate in the survey in the future, which should help improve the accuracy of the findings. In the future, the metrics will be evaluated according to the preferences of different groups (e.g., categorized by age, income, education). In addition, the residential attitude metrics should be further extended to other compact cities or regions.

Author Contributions

Conceptualization, Y.B.; data curation, Y.B.; formal analysis, Y.B.; funding acquisition, J.S.; investigation, Y.B., J.S., and S.M.L.; methodology, Y.B., S.W., and S.M.L.; project administration, J.T.Y.L.; resources, Y.B.; software, Y.B. and S.M.L.; supervision, J.S. and S.M.L.; validation, Y.B.; visualization, Y.B.; writing—original draft, Y.B.; writing—review and editing, Y.B., S.W., W.W., and J.T.Y.L. All authors have read and agreed to the published version of the manuscript.

Funding

The APC was funded by Harbin Institute of Technology, Shenzhen.

Acknowledgments

Thanks to Bai’s technical support.

Conflicts of Interest

The authors declare no conflict of interest. The funders had no role in the design of the study; in the collection, analyses, or interpretation of data; in the writing of the manuscript, or in the decision to publish the results.

Appendix A

Information of respondents.
Table A1. Information of respondents.
NameTypeNumberProportionProportion in Hong Kong
GenderMale6844%46%
Female8856%54%
Age15–241610%12%
15–245032%34%
45–646139%36%
65+2919%18%
EducationPrimary and below1912%34%
Secondary/sixth form6139%39%
post-secondary7649%27%
OccupationManagers and administrators138%10%
Professionals2516%7%
Associate professionals1610%20%
Clerical support workers1812%14%
Service and sales workers2214%17%
Craft and related workers85%6%
Plant and machine operators and assemblers128%4%
Elementary occupations149%21%
Skilled agricultural and fishery workers; and occupations not classifiable2818%0%
Median monthly domestic household incomeHK$ 0–600000%15%
HK$ 6001–10,00032%11%
HK$ 10,001–20,0003422%39%
HK$ 20,001–30,0004026%15%
HK$ 30,001–40,0004529%7%
HK$ 40,001–60,0002315%7%
HK$ 60,000+117%6%
DistrictCentral and Western53%3%
Wan Chai117%2%
Eastern2717%8%
Southern138%4%
Yau Tsim Mong43%5%
Sham Shui Po43%6%
Kowloon City32%6%
Wong Tai Sin106%6%
Kwun Tong138%9%
Kwai Tsing149%7%
Tsuen Wan138%4%
Tuen Mun43%7%
Yuen Long1610%8%
North53%4%
Tai Po74%4%
Sha Tin32%9%
Sai Kung32%6%
Island11%2%

References

  1. Brundtland, G.H. Our common future—Call for action. Environ. Conserv. 1987, 14, 291–294. [Google Scholar] [CrossRef]
  2. Mohammed, I.; Alshuwaikhat, H.; Adenle, Y. An approach to assess the effectiveness of smart growth in achieving sustainable development. Sustainability 2016, 8, 397. [Google Scholar] [CrossRef] [Green Version]
  3. Liang, S. Research on China’s urban development strategy based on arable land preservation. J. Urban Plan. Dev. 2010, 137, 329–336. [Google Scholar] [CrossRef]
  4. Cervero, R.; Murakami, J. Rail and property development in Hong Kong: Experiences and extensions. Urban Stud. 2009, 46, 2019–2043. [Google Scholar] [CrossRef]
  5. Liao, F.H.; Farber, S.; Ewing, R. Compact development and preference heterogeneity in residential location choice behaviour: A latent class analysis. Urban Stud. 2015, 52, 314–337. [Google Scholar] [CrossRef]
  6. Bai, Y.; Song, J.; Wu, S.; Lo, S.M.; Bai, G. Exploring the Mechanism of Residential Attractiveness in Compact Urban Areas—A Case Study of Hong Kong. In Proceedings of the 2020 The fifth International Conference on Building Materials and Construction (ICBMC 2020), Tokyo, Japan, 26–29 February 2020. [Google Scholar]
  7. Lee, J.; Kurisu, K.; An, K.; Hanaki, K. Development of the compact city index and its application to Japanese cities. Urban Stud. 2015, 52, 1054–1070. [Google Scholar] [CrossRef]
  8. Wu, S.-S.; Zhuang, Y.; Chen, J.; Wang, W.; Bai, Y.; Lo, S.-M. Rethinking bus-to-metro accessibility in new town development: Case studies in Shanghai. Cities 2019, 94, 211–224. [Google Scholar] [CrossRef]
  9. Shaker, R.R. The spatial distribution of development in Europe and its underlying sustainability correlations. Appl. Geogr. 2015, 63, 304–314. [Google Scholar] [CrossRef]
  10. Phillips, D.R.; Siu, O.-L.; Yeh, A.G.; Cheng, K.H. Factors influencing older persons’ residential satisfaction in big and densely populated cities in Asia: A case study in Hong Kong. Ageing Int. 2004, 29, 46–70. [Google Scholar] [CrossRef]
  11. Johnson, J.; Maxwell, B. The role of the Conservation Reserve Program in controlling rural residential development. J. Rural Stud. 2001, 17, 323–332. [Google Scholar] [CrossRef]
  12. Ardeshiri, A.; Ardeshiri, M.; Radfar, M.; Shormasty, O.H. The values and benefits of environmental elements on housing rents. Habitat Int. 2016, 55, 67–78. [Google Scholar] [CrossRef] [Green Version]
  13. Paleti, R.; Bhat, C.; Pendyala, R. Integrated model of residential location, work location, vehicle ownership, and commute tour characteristics. Trans. Res. Rec. J. Trans. Res. Board 2013, 2382, 162–172. [Google Scholar] [CrossRef] [Green Version]
  14. Kim, J.H.; Pagliara, F.; Preston, J. The intention to move and residential location choice behaviour. Urban Stud. 2005, 42, 1621–1636. [Google Scholar] [CrossRef]
  15. Wong, G.K. A conceptual model of the household’s housing Decision–Making process: The economic perspective. Rev. Urban Reg. Dev. Stud. 2002, 14, 217–234. [Google Scholar] [CrossRef]
  16. Tse, R.Y. Housing return and the determinants of the capitalization rate: With reference to Hong Kong. J. Prop. Res. 1996, 13, 115–129. [Google Scholar] [CrossRef]
  17. Hui, S.K.; Cheung, A.; Pang, J. A hierarchical Bayesian approach for residential property valuation: Application to Hong Kong housing market. Int. Real Estate Rev. 2010, 13, 1–29. [Google Scholar]
  18. Hannah, L.; Kim, K.-H.; Mills, E.S. Land use controls and housing prices in Korea. Urban Stud. 1993, 30, 147–156. [Google Scholar] [CrossRef]
  19. Fung, Y.; Lee, W. Development of price models for architectural and environmental quality for residential developments in Hong Kong. Habitat Int. 2014, 44, 186–193. [Google Scholar] [CrossRef]
  20. Cervero, R.; Wu, K.-L. Polycentrism, commuting, and residential location in the San Francisco Bay area. Environ. Plan. A 1997, 29, 865–886. [Google Scholar] [CrossRef]
  21. Mok, D. Do two-earner households base their choice of residential location on both incomes? Urban Stud. 2007, 44, 723–750. [Google Scholar] [CrossRef]
  22. Yang, F.; Zeng, G.; Du, C.; Tang, L.; Zhou, J.; Li, Z. Spatial analyzing system for urban land-use management based on GIS and multi-criteria assessment modeling. Prog. Nat. Sci. 2008, 18, 1279–1284. [Google Scholar] [CrossRef]
  23. Bonaiuto, M.; Fornara, F.; Bonnes, M. Indexes of perceived residential environment quality and neighbourhood attachment in urban environments: A confirmation study on the city of Rome. Landsc. Urban Plan. 2003, 65, 41–52. [Google Scholar] [CrossRef]
  24. Humpel, N.; Owen, N.; Iverson, D.; Leslie, E.; Bauman, A. Perceived environment attributes, residential location, and walking for particular purposes. Am. J. Prev. Med. 2004, 26, 119–125. [Google Scholar] [CrossRef] [PubMed]
  25. Balbontin, C.; de Dios Ortúzar, J.; Swait, J.D. Importance of Dwelling, Neighbourhood Attributes in Residential Location Modelling: Best Worst Scaling vs. Discrete Choice. Proc.-Social Behav. Sci. 2014, 160, 92–101. [Google Scholar] [CrossRef] [Green Version]
  26. Flynn, T.N.; Louviere, J.J.; Peters, T.J.; Coast, J. Best–worst scaling: What it can do for health care research and how to do it. J. Health Econ. 2007, 26, 171–189. [Google Scholar] [CrossRef]
  27. Li, X.; Yeh, A. Principal component analysis of stacked multi-temporal images for the monitoring of rapid urban expansion in the Pearl River Delta. Int. J. Remote Sens. 1998, 19, 1501–1518. [Google Scholar] [CrossRef]
  28. Miranda, A.A.; Le Borgne, Y.-A.; Bontempi, G. New routes from minimal approximation error to principal components. Neural Process. Lett. 2008, 27, 197–207. [Google Scholar] [CrossRef] [Green Version]
  29. Mosadeghi, R.; Warnken, J.; Tomlinson, R.; Mirfenderesk, H. Comparison of Fuzzy-AHP and AHP in a spatial multi-criteria decision making model for urban land-use planning. Comput. Environ. Urban Syst. 2015, 49, 54–65. [Google Scholar] [CrossRef] [Green Version]
  30. Bai, Y.; Kim, Y. Which Variables are Influential to Evaluate Rapid-Transit Systems in China’s Cities? KIEAE J. 2017, 17, 33–38. [Google Scholar] [CrossRef]
  31. Benítez, J.; Delgado-Galván, X.; Izquierdo, J.; Pérez-García, R.J.A.M. Computation, Improving consistency in AHP decision-making processes. Appl. Math. Comput. 2012, 219, 2432–2441. [Google Scholar]
  32. Ergu, D.; Kou, G.; Peng, Y.; Yang, X. Simulation experiments for improving the consistency ratio of reciprocal matrices. Int. J. Comput. Commun. Control 2014, 9, 408–418. [Google Scholar] [CrossRef]
  33. Lo, S.; Zhao, C.; Cheng, W.Y. Perceptions of building professionals on sustainable development: A comparative study between Hong Kong and Shenyang. Energy Build. 2006, 38, 1327–1334. [Google Scholar] [CrossRef]
  34. Yiu, C.; Ho, H.; Lo, S.; Hu, B. Performance evaluation for cost estimators by reliability interval method. J. Constr. Eng. Manag. 2005, 131, 108–116. [Google Scholar] [CrossRef]
  35. Lo, S.; Hu, B.; Liu, M.; Yuen, K. On the use of reliability interval method and grey relational model for fire safety ranking of existing buildings. Fire Technol. 2005, 41, 255–270. [Google Scholar] [CrossRef]
  36. Vessali, K.V. Land use impacts of rapid transit: A review of the empirical literature. Berkeley Plan. J. 1996, 11. [Google Scholar] [CrossRef] [Green Version]
  37. McMillen, D.P.; McDonald, J. Reaction of house prices to a new rapid transit line: Chicago’s midway line, 1983–1999. Real Estate Econ. 2004, 32, 463–486. [Google Scholar] [CrossRef]
  38. Tian, L. Impacts of transport projects on residential property values in China: Evidence from two projects in Guangzhou. J. Prop. Res. 2006, 23, 347–365. [Google Scholar] [CrossRef]
  39. Bailey, M.J.; Muth, R.F.; Nourse, H.O. A regression method for real estate price index construction. J. Am. Stat. Assoc. 1963, 58, 933–942. [Google Scholar] [CrossRef]
  40. Kim, K.; Lahr, M.L. The impact of H udson-B ergen L ight R ail on residential property appreciation. Pap. Reg. Sci. 2014, 93, S79–S97. [Google Scholar] [CrossRef] [Green Version]
  41. Hill, R.C.; Knight, J.R.; Sirmans, C. Estimating capital asset price indexes. Rev. Econ. Stat. 1997, 79, 226–233. [Google Scholar] [CrossRef]
  42. Griliches, Z. Hedonic Price Indexes for Automobiles: An Econometric of Quality Change. In The Price Statistics of the Federal Government; NBER: Cambridge, MA, USA, 1961; pp. 173–196. [Google Scholar]
  43. Schläpfer, F.; Waltert, F.; Segura, L.; Kienast, F. Valuation of landscape amenities: A hedonic pricing analysis of housing rents in urban, suburban and periurban Switzerland. Landsc. Urban Plan. 2015, 141, 24–40. [Google Scholar] [CrossRef]
  44. Cervero, R. Effects of light and commuter rail transit on land prices: Experiences in San Diego County. J. Trans. Res. Forum 2010, 43, 121–138. [Google Scholar] [CrossRef]
  45. Bae, C.-H.C.; Jun, M.-J.; Park, H. The impact of Seoul’s subway Line 5 on residential property values. Trans. Policy 2003, 10, 85–94. [Google Scholar] [CrossRef]
  46. Zheng, S.; Kahn, M.E. Land and residential property markets in a booming economy: New evidence from Beijing. J. Urban Econ. 2008, 63, 743–757. [Google Scholar] [CrossRef]
  47. Qin, Z.; Yu, Y.; Liu, D. The Effect of HOPSCA on Residential Property Values: Exploratory Findings from Wuhan, China. Sustainability 2019, 11, 471. [Google Scholar] [CrossRef] [Green Version]
  48. Næss, P. Accessibility, activity participation and location of activities: Exploring the links between residential location and travel behaviour. Urban Stud. 2006, 43, 627–652. [Google Scholar] [CrossRef]
  49. Earnhart, D. Combining revealed and stated preference methods to value environmental amenities at residential locations. Land Econ. 2001, 77, 12–29. [Google Scholar] [CrossRef] [Green Version]
  50. Smith, B.; Olaru, D. Lifecycle stages and residential location choice in the presence of latent preference heterogeneity. Environ. Plan. A 2013, 45, 2495–2514. [Google Scholar] [CrossRef]
  51. Vergeer, P.; Van Den Berg, L.; Roelofs, J.; Ouborg, N. Single-family versus multi-family introductions. Plant Biol. 2005, 7, 509–515. [Google Scholar] [CrossRef]
  52. Kim, S.-S.; Yang, I.-H.; Yeo, M.-S.; Kim, K.-W. Development of a housing performance evaluation model for multi-family residential buildings in Korea. Build. Environ. 2005, 40, 1103–1116. [Google Scholar] [CrossRef]
  53. Jim, C.Y.; Chen, W.Y. Value of scenic views: Hedonic assessment of private housing in Hong Kong. Landsc. Urban Plan. 2009, 91, 226–234. [Google Scholar] [CrossRef]
  54. Tapsuwan, S.; Polyakov, M.J.S.; Resources, N. Correctly specifying environmental assets in spatial hedonic pricing models. Soc. Nat. Resour. 2016, 29, 233–249. [Google Scholar] [CrossRef]
  55. Hong Kong in Figures. Available online: https://www.statistics.gov.hk/pub/B10100062019AN19B0100.pdf (accessed on 25 September 2019).
  56. Hong Kong Planning Standards and Guildlines. Available online: https://www.pland.gov.hk/pland_en/tech_doc/hkpsg/full/pdf/ch1.pdf (accessed on 25 September 2019).
  57. Land Utilization in Hong Kong 2018. Available online: https://www.pland.gov.hk/pland_en/info_serv/statistic/landu.html (accessed on 25 September 2019).
  58. Public Transport Strategy Study. Available online: https://www.td.gov.hk/filemanager/en/publication/ptss_final_report_eng.pdf (accessed on 25 September 2019).
  59. Lui, L.; Kim, Y. Use and perception of podium gardens in residential neighborhoods in Hong Kong. Sustainability 2017, 9, 57. [Google Scholar] [CrossRef] [Green Version]
  60. Lai, L.W.-C.; Fong, K. Town Planning Practice: Context, Procedures and Statistics for Hong Kong; Hong Kong University Press: Hong Kong, China, 2000; Volume 1. [Google Scholar]
  61. Map of Districts in Hong Kong. Available online: http://www.legco.gov.hk/yr10-11/chinese/panels/ca/papers/cacb2-2175-ec.pdf (accessed on 29 April 2020).
  62. MTR System Map. Available online: http://www.mtr.com.hk/archive/en/services/routemap.pdf (accessed on 29 April 2020).
  63. Inoa, I.A.; Picard, N.; De Palma, A. Effect of an accessibility measure in a model for choice of residential location, workplace, and type of employment. Math. Popul. Stud. 2015, 22, 4–36. [Google Scholar] [CrossRef]
  64. Hui, E.C.; Chau, C.; Pun, L.; Law, M. Measuring the neighboring and environmental effects on residential property value: Using spatial weighting matrix. Build. Environ. 2007, 42, 2333–2343. [Google Scholar] [CrossRef]
  65. Tse, R.Y.; Love, P.E. Measuring residential property values in Hong Kong. Prop. Manag. 2000, 18, 366–374. [Google Scholar] [CrossRef] [Green Version]
  66. Li, H.; Wei, Y.D.; Yu, Z.; Tian, G. Amenity, accessibility and housing values in metropolitan USA: A study of Salt Lake County, Utah. Cities 2016, 59, 113–125. [Google Scholar] [CrossRef]
  67. Boynton, P.M. Hands-on guide to questionnaire research: Administering, analysing, and reporting your questionnaire. BMJ Br. Med. J. 2004, 328, 1372. [Google Scholar] [CrossRef] [Green Version]
  68. Population. Available online: http://www.census2017.gov.hk/en/index.html/ (accessed on 13 November 2018).
  69. 2018 Annual Transport Digest. Available online: https://www.td.gov.hk/mini_site/atd/2018/en/section5_2.html (accessed on 25 September 2019).
  70. Hong Kong 2030+: Planning and Urban Design for a Liveable High-Density City. Available online: https://www.hk2030plus.hk/document/Planning%20and%20Urban%20Design%20for%20a%20Liveable%20High-Density%20City_Eng.pdf (accessed on 25 September 2019).
  71. Madeddu, M.; Zhang, X. Harmonious spaces: The influence of Feng Shui on urban form and design. J. Urban Des. 2017, 22, 709–725. [Google Scholar] [CrossRef]
  72. Hong Kong 2030+: Towards a Planning Vision and Strategy Transcending 2030. Available online: https://www.hk2030plus.hk/document/Conceptual%20Spatial%20Framework_Eng.pdf (accessed on 25 September 2019).
  73. Jim, C.Y.; Chen, W.Y. External effects of neighbourhood parks and landscape elements on high-rise residential value. Land Use Policy 2010, 27, 662–670. [Google Scholar] [CrossRef]
  74. Yang, Y.; o’Neill, K. Understanding factors affecting people’s attitudes toward living in compact and mixed-use environments: A case study of a New Urbanist project in Eugene, Oregon, USA. J. Urban. Int. Res. Placemaking Urban Sustain. 2014, 7, 1–22. [Google Scholar] [CrossRef]
  75. Howley, P. Attitudes towards compact city living: Towards a greater understanding of residential behaviour. Land Use Policy 2009, 26, 792–798. [Google Scholar] [CrossRef]
Figure 1. Map of districts in Hong Kong [61].
Sustainability 12 04867 g001
Figure 2. Map of mass transit railway (MTR) in Hong Kong [62].
Sustainability 12 04867 g002
Figure 3. Flowchart of the research process.
Sustainability 12 04867 g003
Figure 4. Interval value graded by the ith respondent for the jth attribute [35].
Sustainability 12 04867 g004
Figure 5. Example of scoring by respondents.
Sustainability 12 04867 g005
Figure 6. Survey stations in Hong Kong [62].
Sustainability 12 04867 g006
Figure 7. Selected residential development projects in Hong Kong.
Sustainability 12 04867 g007
Figure 8. Residential attitude metrics in Hong Kong.
Sustainability 12 04867 g008
Figure 9. The weights of the 15 sub-metrics.
Sustainability 12 04867 g009
Table 1. Metrics identified in this research. CBD: central business district.
AttributeSub-MetricsNameDescription
AccessibilityAccessibility indexAIAccessibility of residence zone i to all employment zone j
Access to metro stationMETRONetwork distance to the nearest metro station
Access to bus stopBUSNetwork distance to the nearest bus stop
Access to CBDCBDNetwork distance to the CBD
Public facilitiesDistance to shopping centerSCNetwork distance to the nearest shopping center
Distance to primary schoolPSNetwork distance to the nearest primary school
Distance to priority primary schoolPPSNetwork distance to the nearest top 50 primary schools
Distance to parks/recreational facilitiesPARKNetwork distance to the nearest parks/recreational facilities
Distance to sports facilitiesSPORTNetwork distance to the nearest sports facilities
Distance to cultural facilitiesCULNetwork distance to the nearest cultural facilities
EnvironmentDistance to seashoreSEANetwork distance to the nearest seashore
Distance to mountainMOUNNetwork distance to the nearest mountain
Distance to cemeteryCEMENetwork distance to the cemetery
Socio-demographicPopulation densityPDPopulation density in residential zone i
Median household incomeMHIMonthly median household income in residential zone i
Table 2. The 1–7 point scale.
Intensity of ImportanceDefinition
0No importance
1Little importance
3Moderate importance
5Strong importance
7Very strong importance
2, 4, 6Immediate values between preceding scale values
Table 3. Data resource of variables.
Data NameData ResourceUnit
Residential valueCentaline databaseHK$/m2
Accessibility indexHong Kong Population Census; Google Mapspersons per km
Access to metro stationGoogle Maps; Open Street Mapkm
Access to bus stopGoogle Maps; Open Street Mapkm
Access to CBDGoogle Maps; Open Street Mapkm
Distance to shopping centerGoogle Maps; Open Street Mapkm
Distance to primary schoolGeoInfo Map; Google Mapskm
Distance to priority primary schoolGeoInfo Map; Google Maps; Evaluation of competitiveness of secondary school/primary school/kindergarten education in Hong Kongkm
Distance to parks/recreational facilitiesGeoInfo Map; Google Mapskm
Distance to sport facilitiesGeoInfo Map; Google Mapskm
Distance to cultural facilitiesGeoInfo Map; Google Mapskm
Distance to seashoreOpen Street Mapkm
Distance to mountainOpen Street Mapkm
Distance to cemeteryOpen Street Mapkm
Population densityHong Kong Population Censuspersons per km2
Median household incomeHong Kong Population CensusHK$/month
Table 4. The proportion and population of the four age groups in this survey.
Age (Years)Sample Size in This SurveyProportion in This SurveyTotal Population in Hong KongProportion in Hong Kong
15–241610%785,98112%
25–445032%2,229,56634%
45–646139%2,328,43036%
65+2919%1,163,15318%
Total156100%6,507,130100%
Table 5. The results of reliability interval method. CV: center variance; IV: interval variance.
AttributesSub-MetricsInterval GradeGrade EigenvalueWeightReliabilityCVIV
AccessibilityAI[3.8, 4.8]4.30.0750.383.285.04
METRO[4.4, 5.5]5.00.0870.462.333.86
BUS[4.3, 5.4]4.90.0850.442.434.03
CBD[2.5, 3.6]3.00.0530.482.253.80
Public facilitiesSC[3.3, 4.3]3.80.0670.413.054.82
PS[1.9, 2.9]2.40.0420.402.814.48
PPS[2.4, 3.4]2.90.0510.353.545.44
PARK[3.5, 4.5]4.00.0710.363.395.26
SPORT[3.8, 4.9]4.30.0760.333.034.77
CUL[2.1, 3.2]2.70.0470.393.044.82
EnvironmentSEA[2.4, 3.4]2.90.0510.443.174.94
MOUN[1.7, 2.8]2.20.0390.372.794.46
CEME[4.6, 5.6]5.10.0890.322.414.07
Socio-demographicPD[4.1, 5.2]4.70.0810.462.103.60
MHI[4.4, 5.5]4.90.0860.501.843.25
Table 6. Descriptive statistics of variables.
AttributeVariableMinimumMaximumMeanStandard Deviation
ValueVALUE5584.2015,768.309722.52932466.9615
AccessibilityAI100.94383.09234.362870.57186
METRO0.088.301.24331.65959
BUS0.000.170.04940.03584
CBD1.3036.7015.819810.18707
Public facilitiesSC0.108.300.40410.82951
PS0.072.700.55930.38075
PPS0.2212.703.35943.47421
PARK0.118.200.82650.92839
SPORT0.066.001.06531.20858
CUL0.0610.301.26301.78701
EnvironmentSEA0.015.471.27851.44220
MOUN0.064.631.38601.00115
CEME0.186.992.50231.81233
Socio-demographicPD101.00175,338.0027,995.336240,579.41621
MHI4778.00162,341.0038,802.974125,357.32130
Table 7. The results of the hedonic price model.
VariableCoefficientStandard ErrortSig.
Accessibility
METRO−0.0330.012−2.8840.005
BUS−0.3840.36−1.0670.288
SC0.0330.0181.8320.070
CBD−0.0160.002−10.1660.000
Public facilities
PS0.0080.0340.2390.811
PPS−0.0060.005−1.1510.252
SPORT0.0040.0150.2660.791
Environment
SEA0.0030.0110.2690.788
MOUN0.0090.0130.6530.515
CEME0.0040.0080.5170.606
Socio-demographic
lnMHI0.0680.0262.6240.010
(Constant)11,438.381588.98919.420.000
Summary Statistics
Number of observations = 116
F Statistic (prob.) = 30.648 (0.000)
R2 = 0.764

