Policy Innovation and Governance for Irrigation Sustainability in the Arid, Saline San Joaquin River Basin

Abstract
1. Introduction—Irrigation Development on the West Side of the San Joaquin Valley
2. Water Supply Issues Impacting Irrigation Sustainability
- Reduction in the chronic lowering of groundwater levels that could lead to significant and unreasonable depletion of long-term groundwater supply if continued long-term;
- Reduction in significant and unreasonable losses of available groundwater storage;
- Interventions to eliminate significant and unreasonable impacts to the water quality of the groundwater resource through seawater intrusion;
- Other actions designed to prevent degraded groundwater quality;
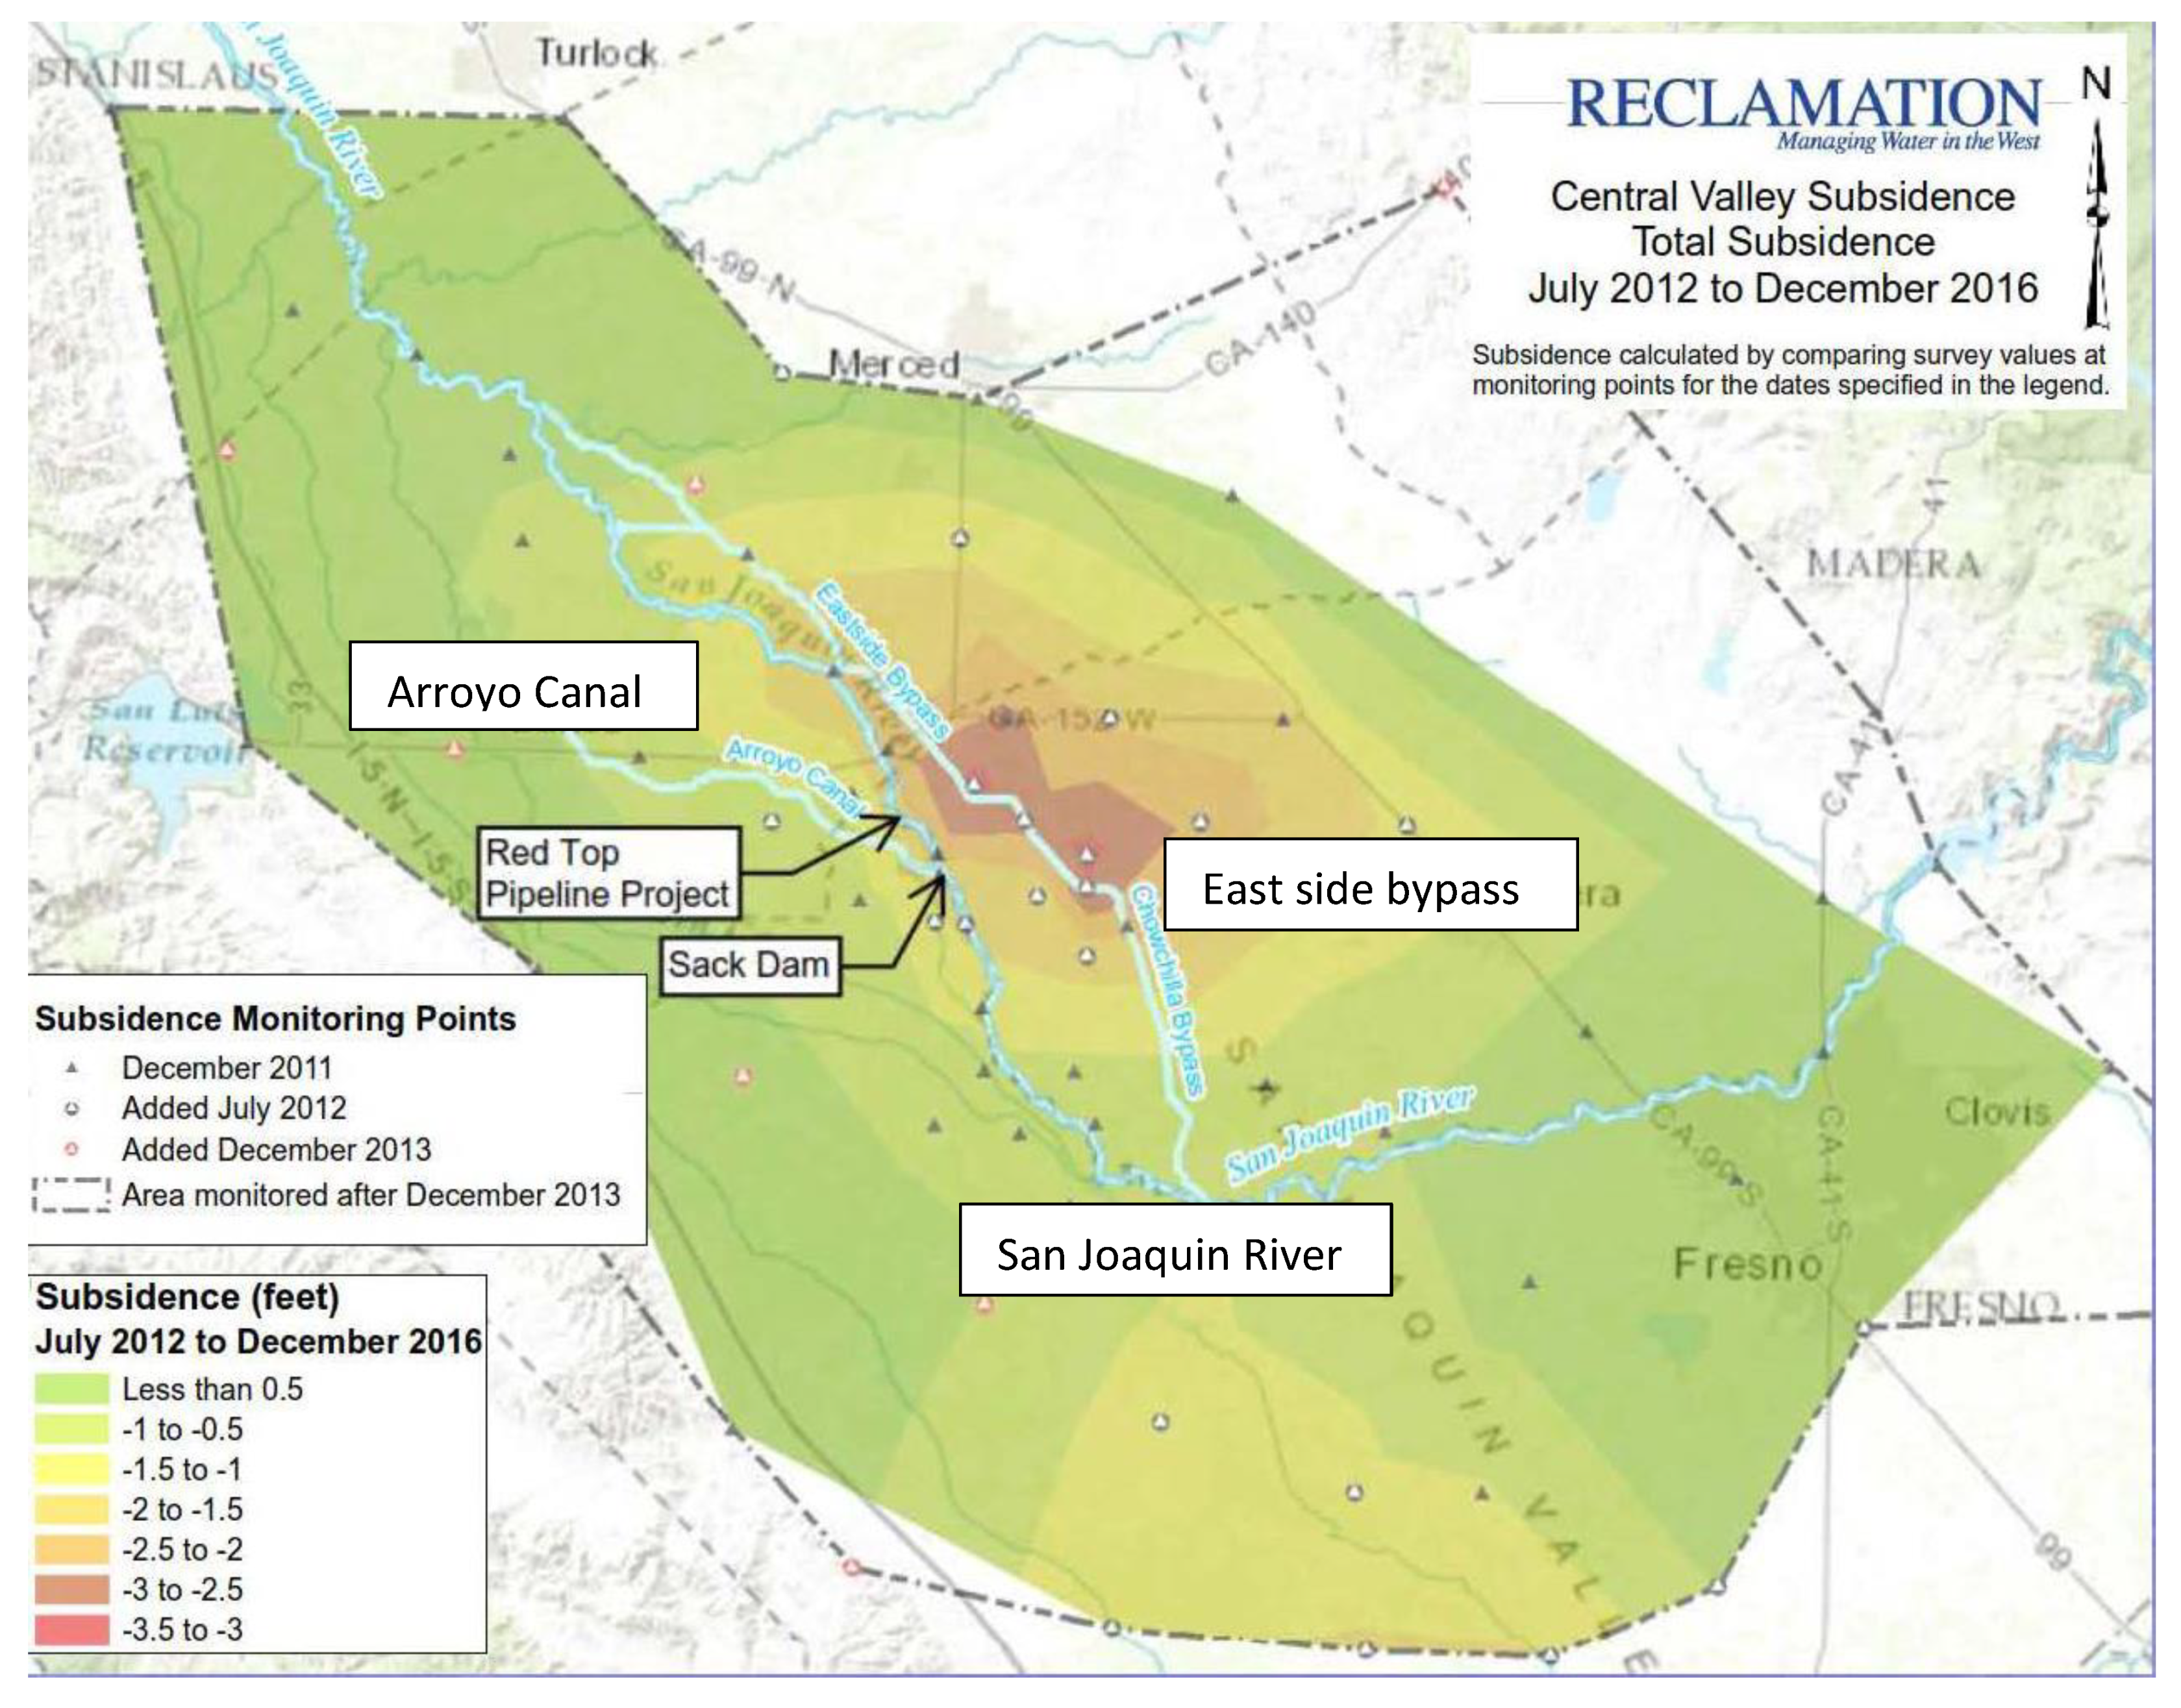
- Targeted interventions to recognize and prevent future irreversible land subsidence;
- Actions to avoid depletions of interconnected surface waters that could have significant and unreasonable adverse impacts on existing and future surface water beneficial use (Cal. Water Code §10721(w)).
- (a)
- Recharging groundwater basins and temporary wetland areas on fields in areas where surplus water supply is available;
- (b)
- Reducing water demand through crop substitution and increasing water use efficiency through infrastructure and irrigation technology investments;
- (c)
- Converting agricultural landscapes to wildlife habitat that could improve potential recovery of many endangered species in the SJV [12];
- (d)
- Fallowing, retiring, or converting land to municipal or industrial use such as renewable energy in wind or photovoltaic power. On land where agricultural productivity and potential wildlife habitat potential is low, renewable energy options may be cost-effective [13]. Reducing the land area devoted to agriculture may also improve air quality and eliminate groundwater nitrate levels that pose a public health threat associated with intensive agriculture [14].
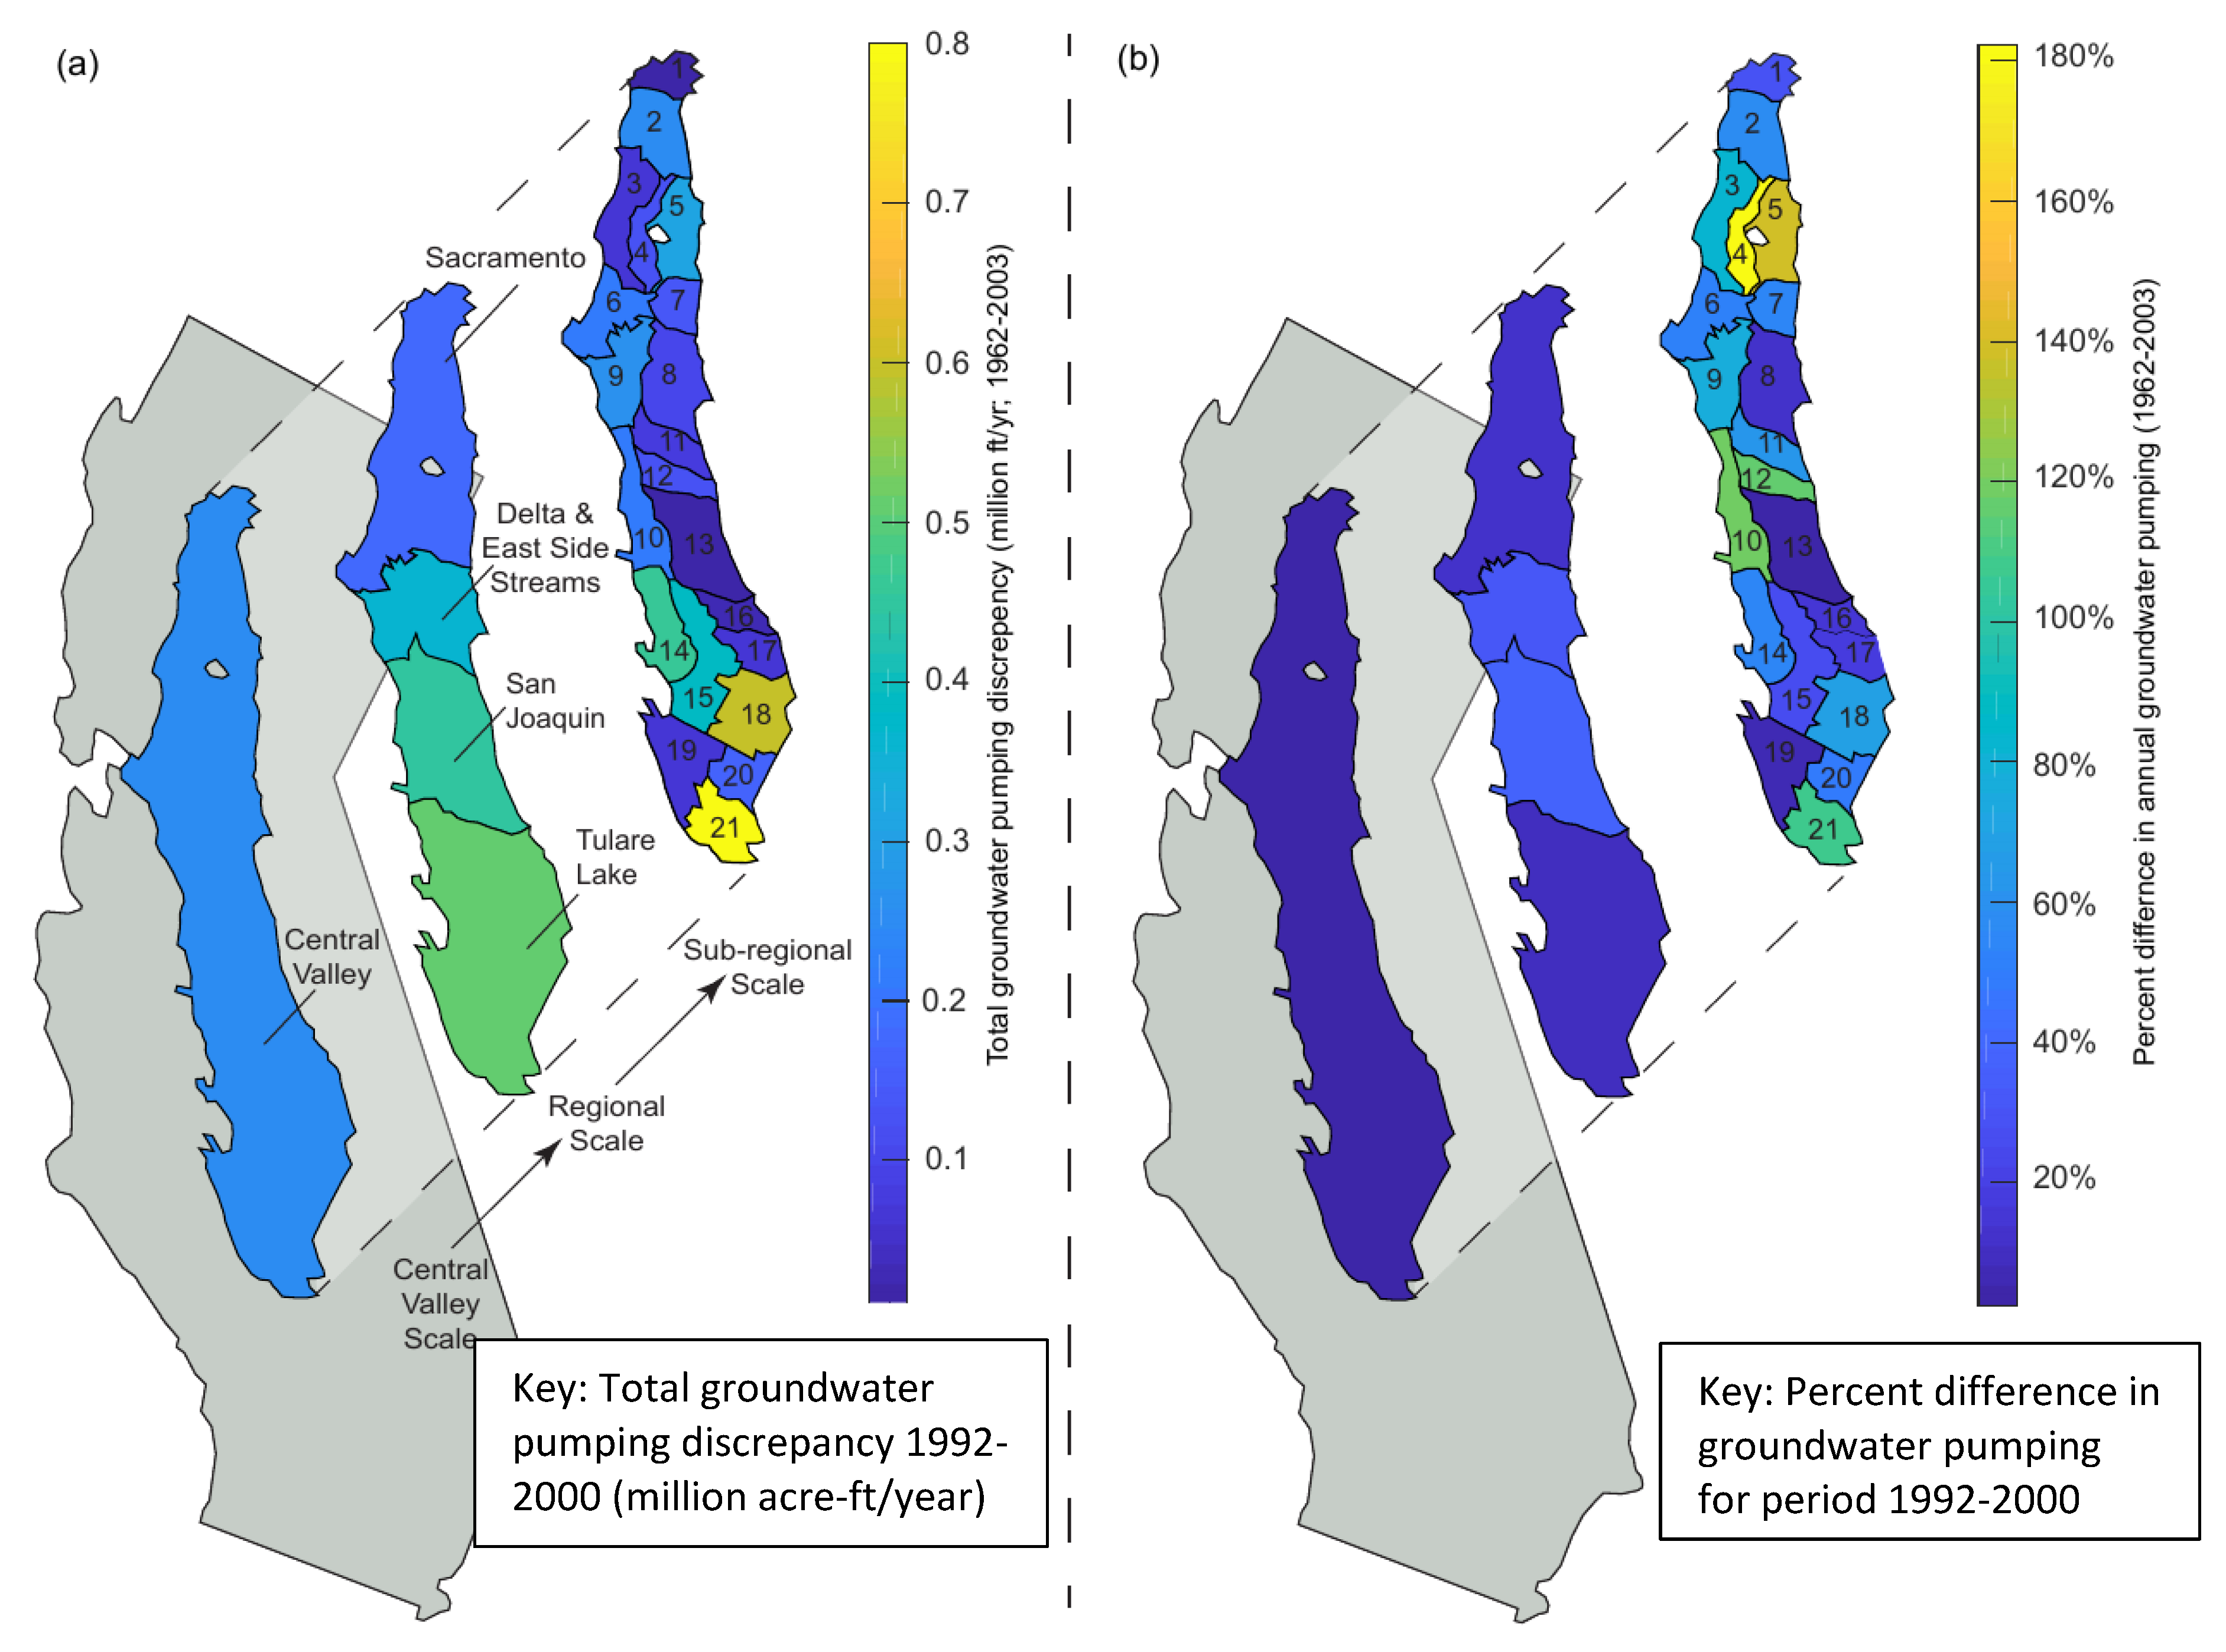
Regional Groundwater Models to Guide SGMA Policy Planning and Future Irrigation Sustainability
3. Water Quality Impediments to Irrigation Sustainability
3.1. The Kesterson Crisis and Policy Implications for Irrigation Sustainability
3.2. Research Directed at Sustainable Solutions to Irrigation-Induced Water Quality Problems
3.3. Surface and Groundwater Strategies for Sustainable Irrigation
3.4. Economic Factors Impacting Sustainable Irrigation Policy
3.5. Regional Policy Planning and Assessment Models for Irrigation Sustainability
4. Evolution of Environmental Policy Mandates Impacting Irrigated Agriculture
4.1. Salinity Load Regulation Methodology for the SJRB
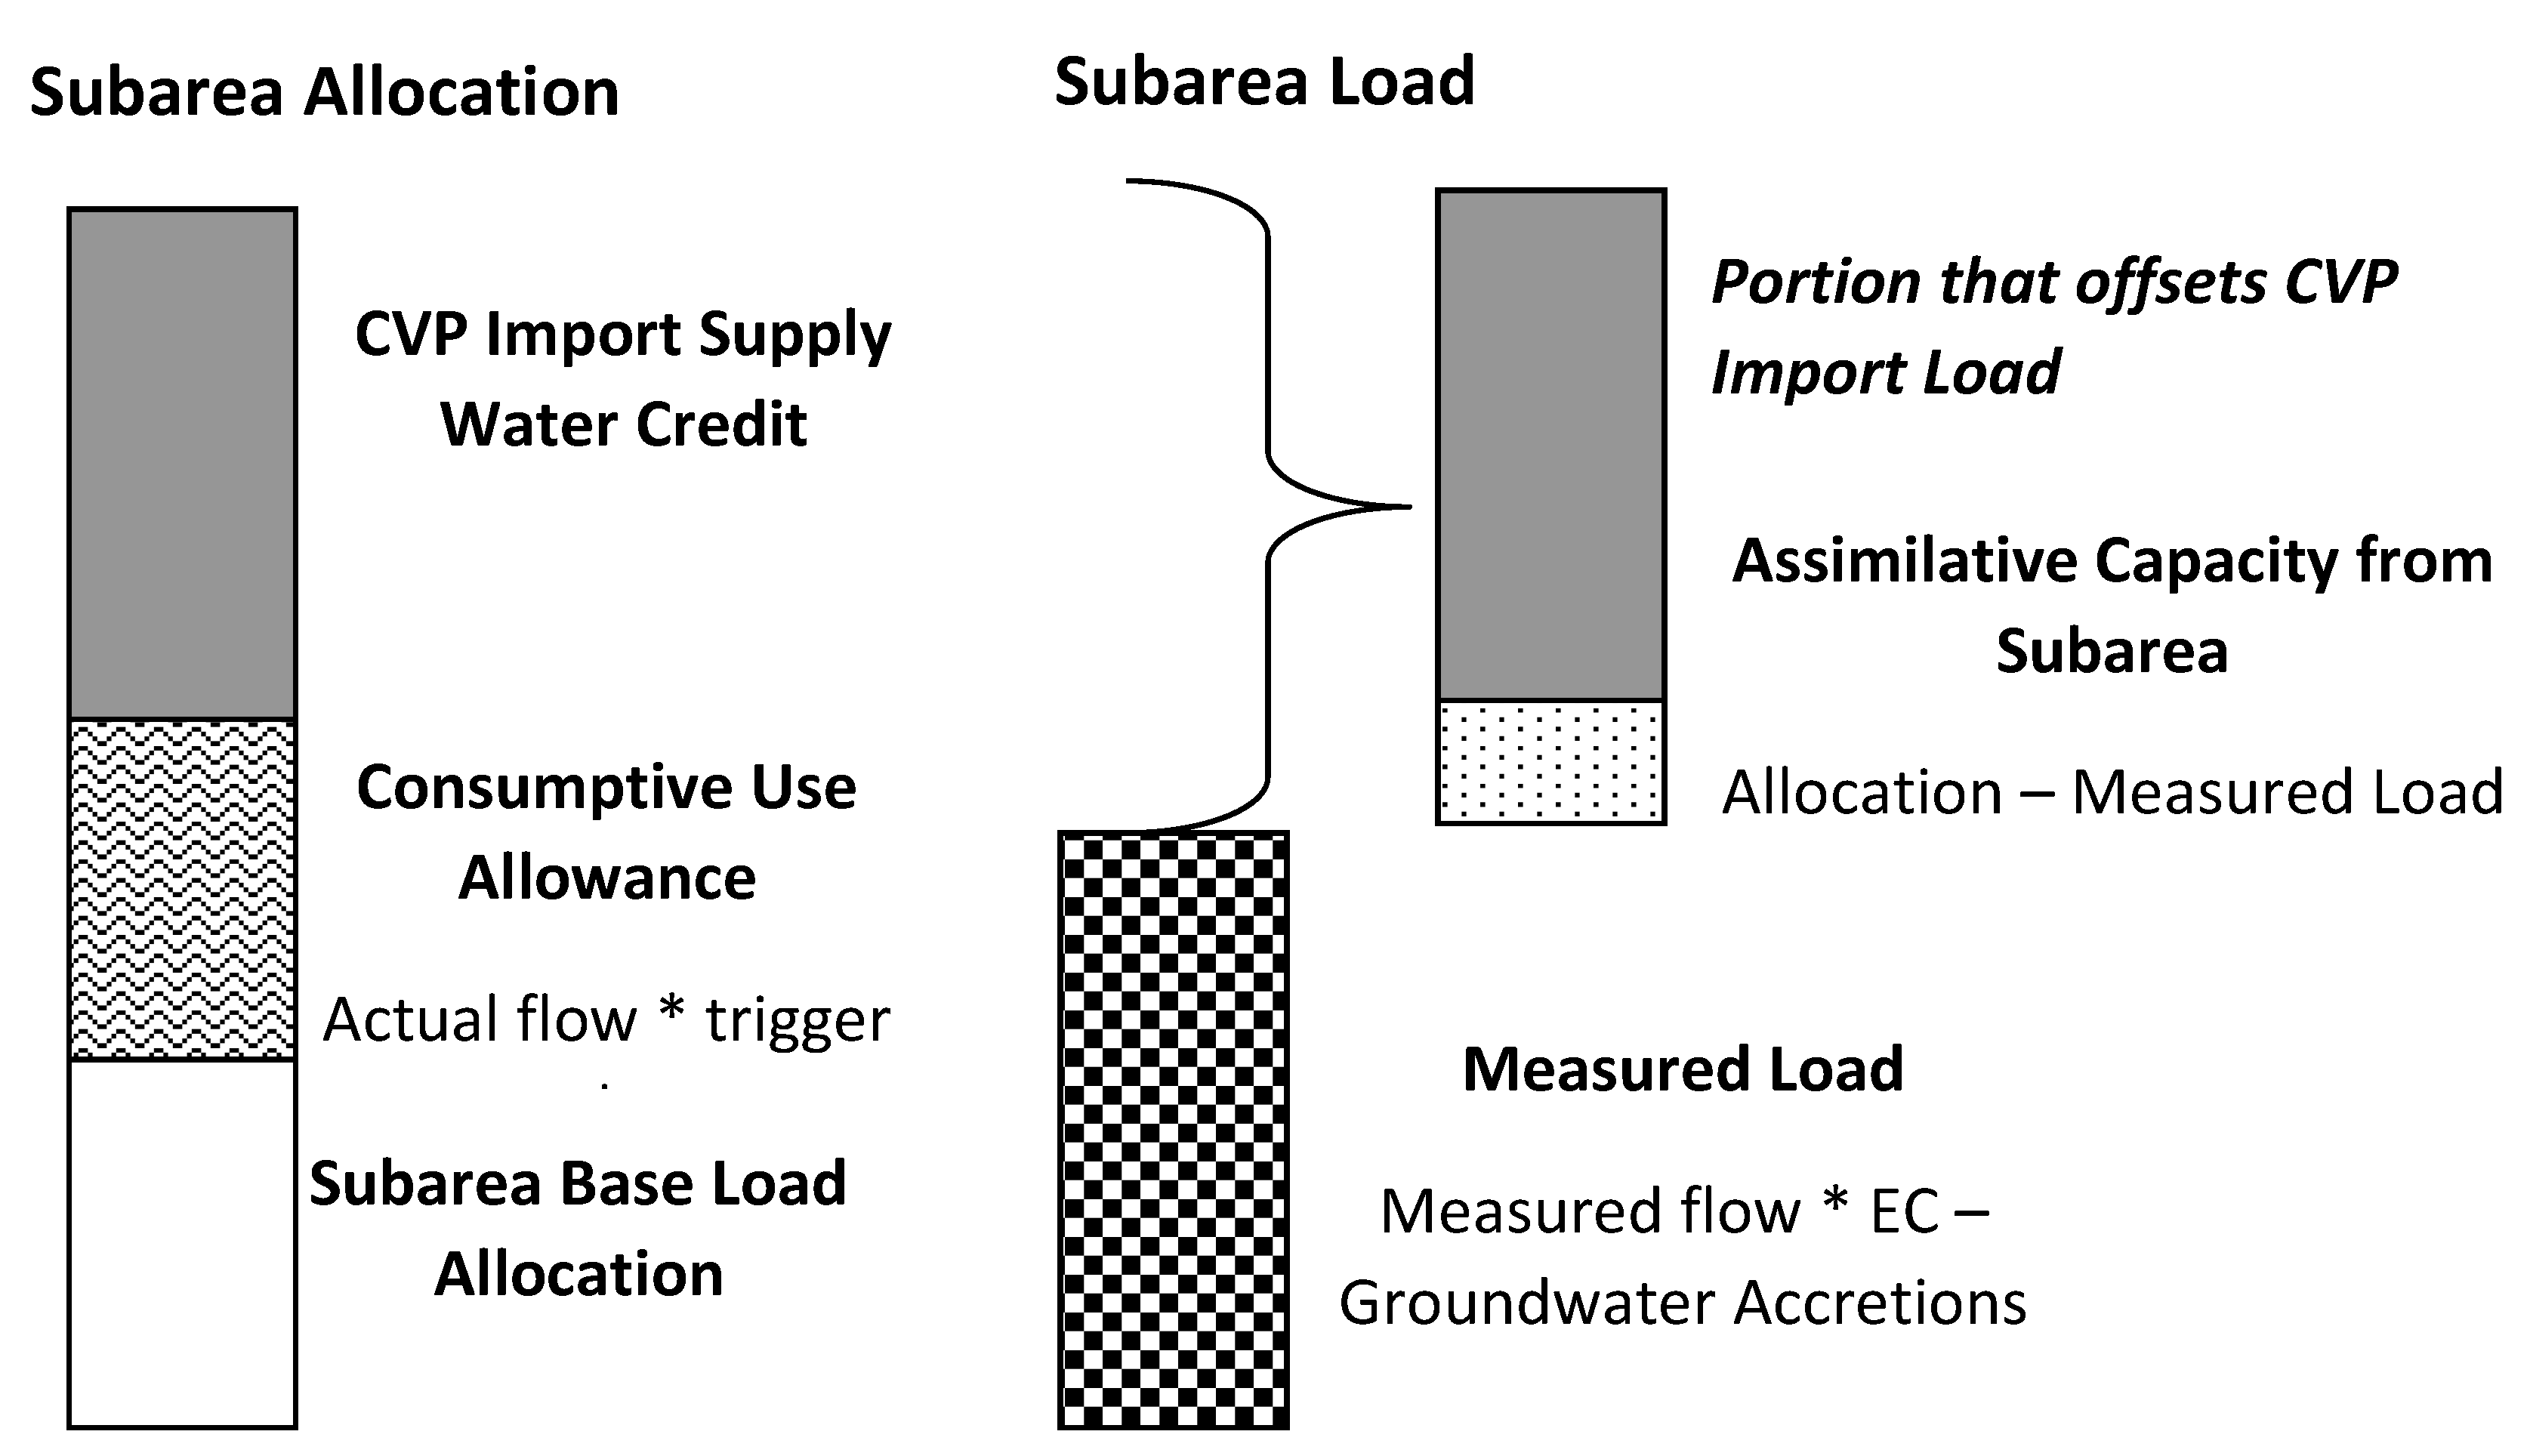
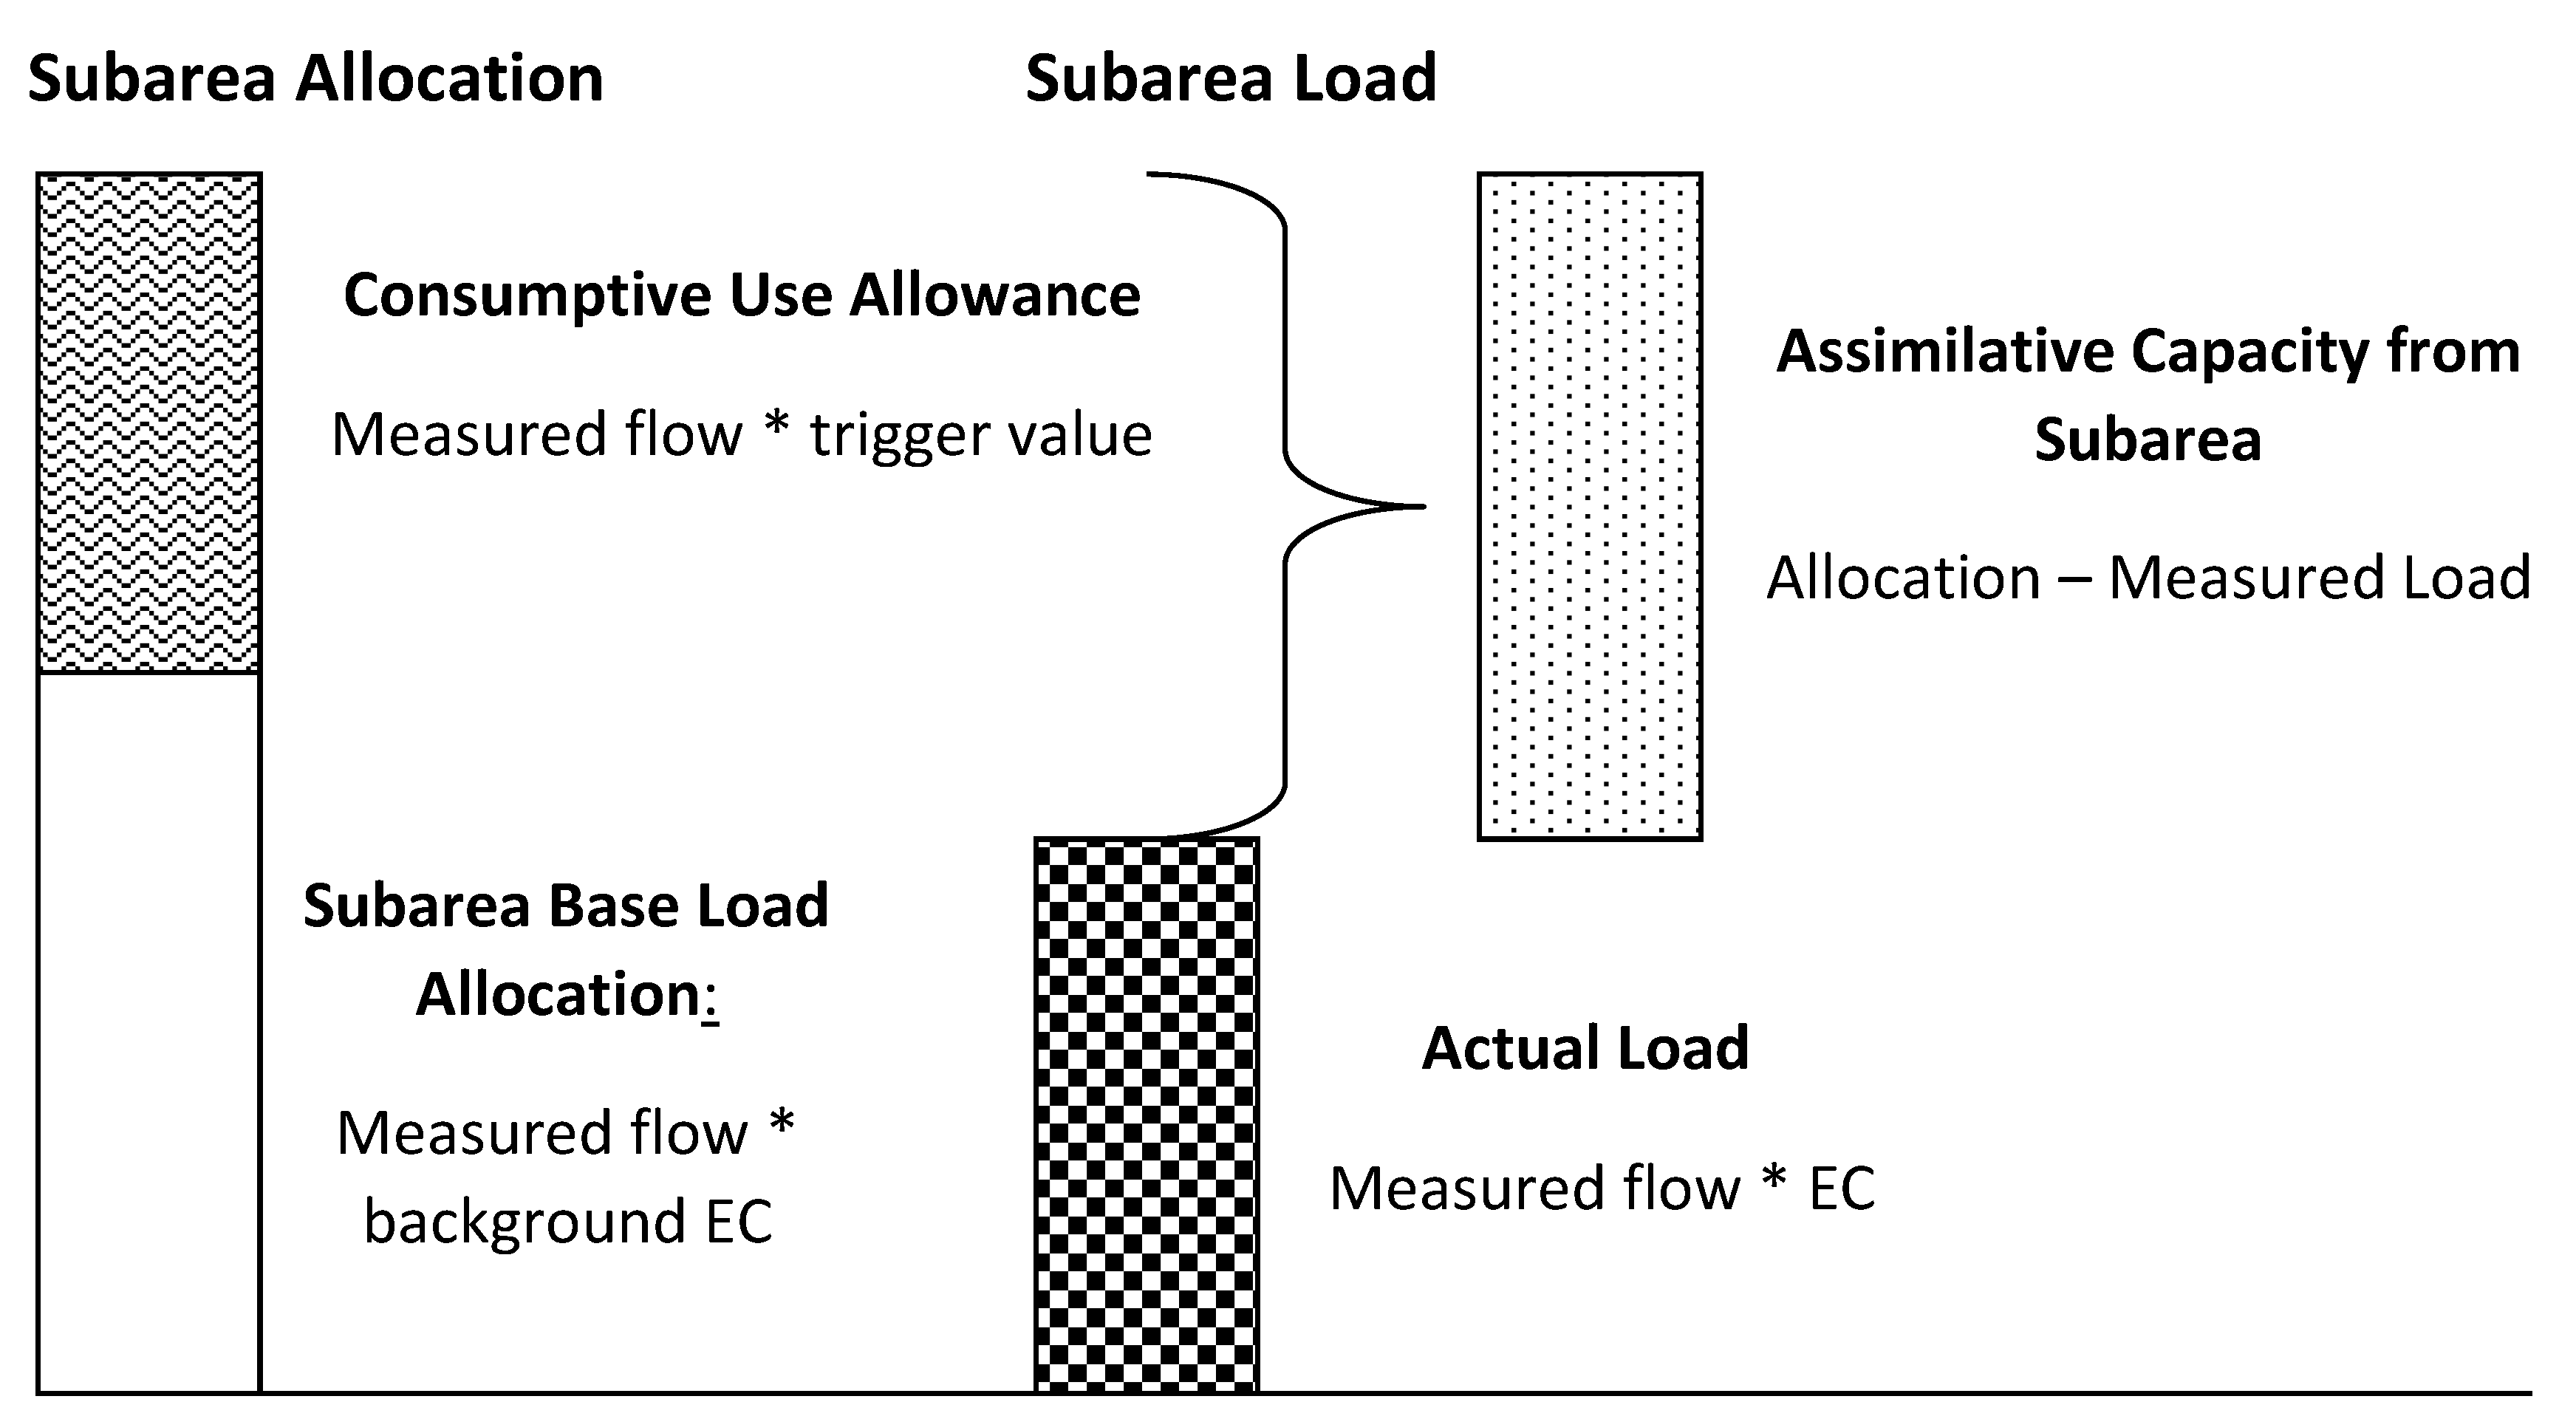
4.2. Model-Based TMDL Salt Load Allocation Methodology
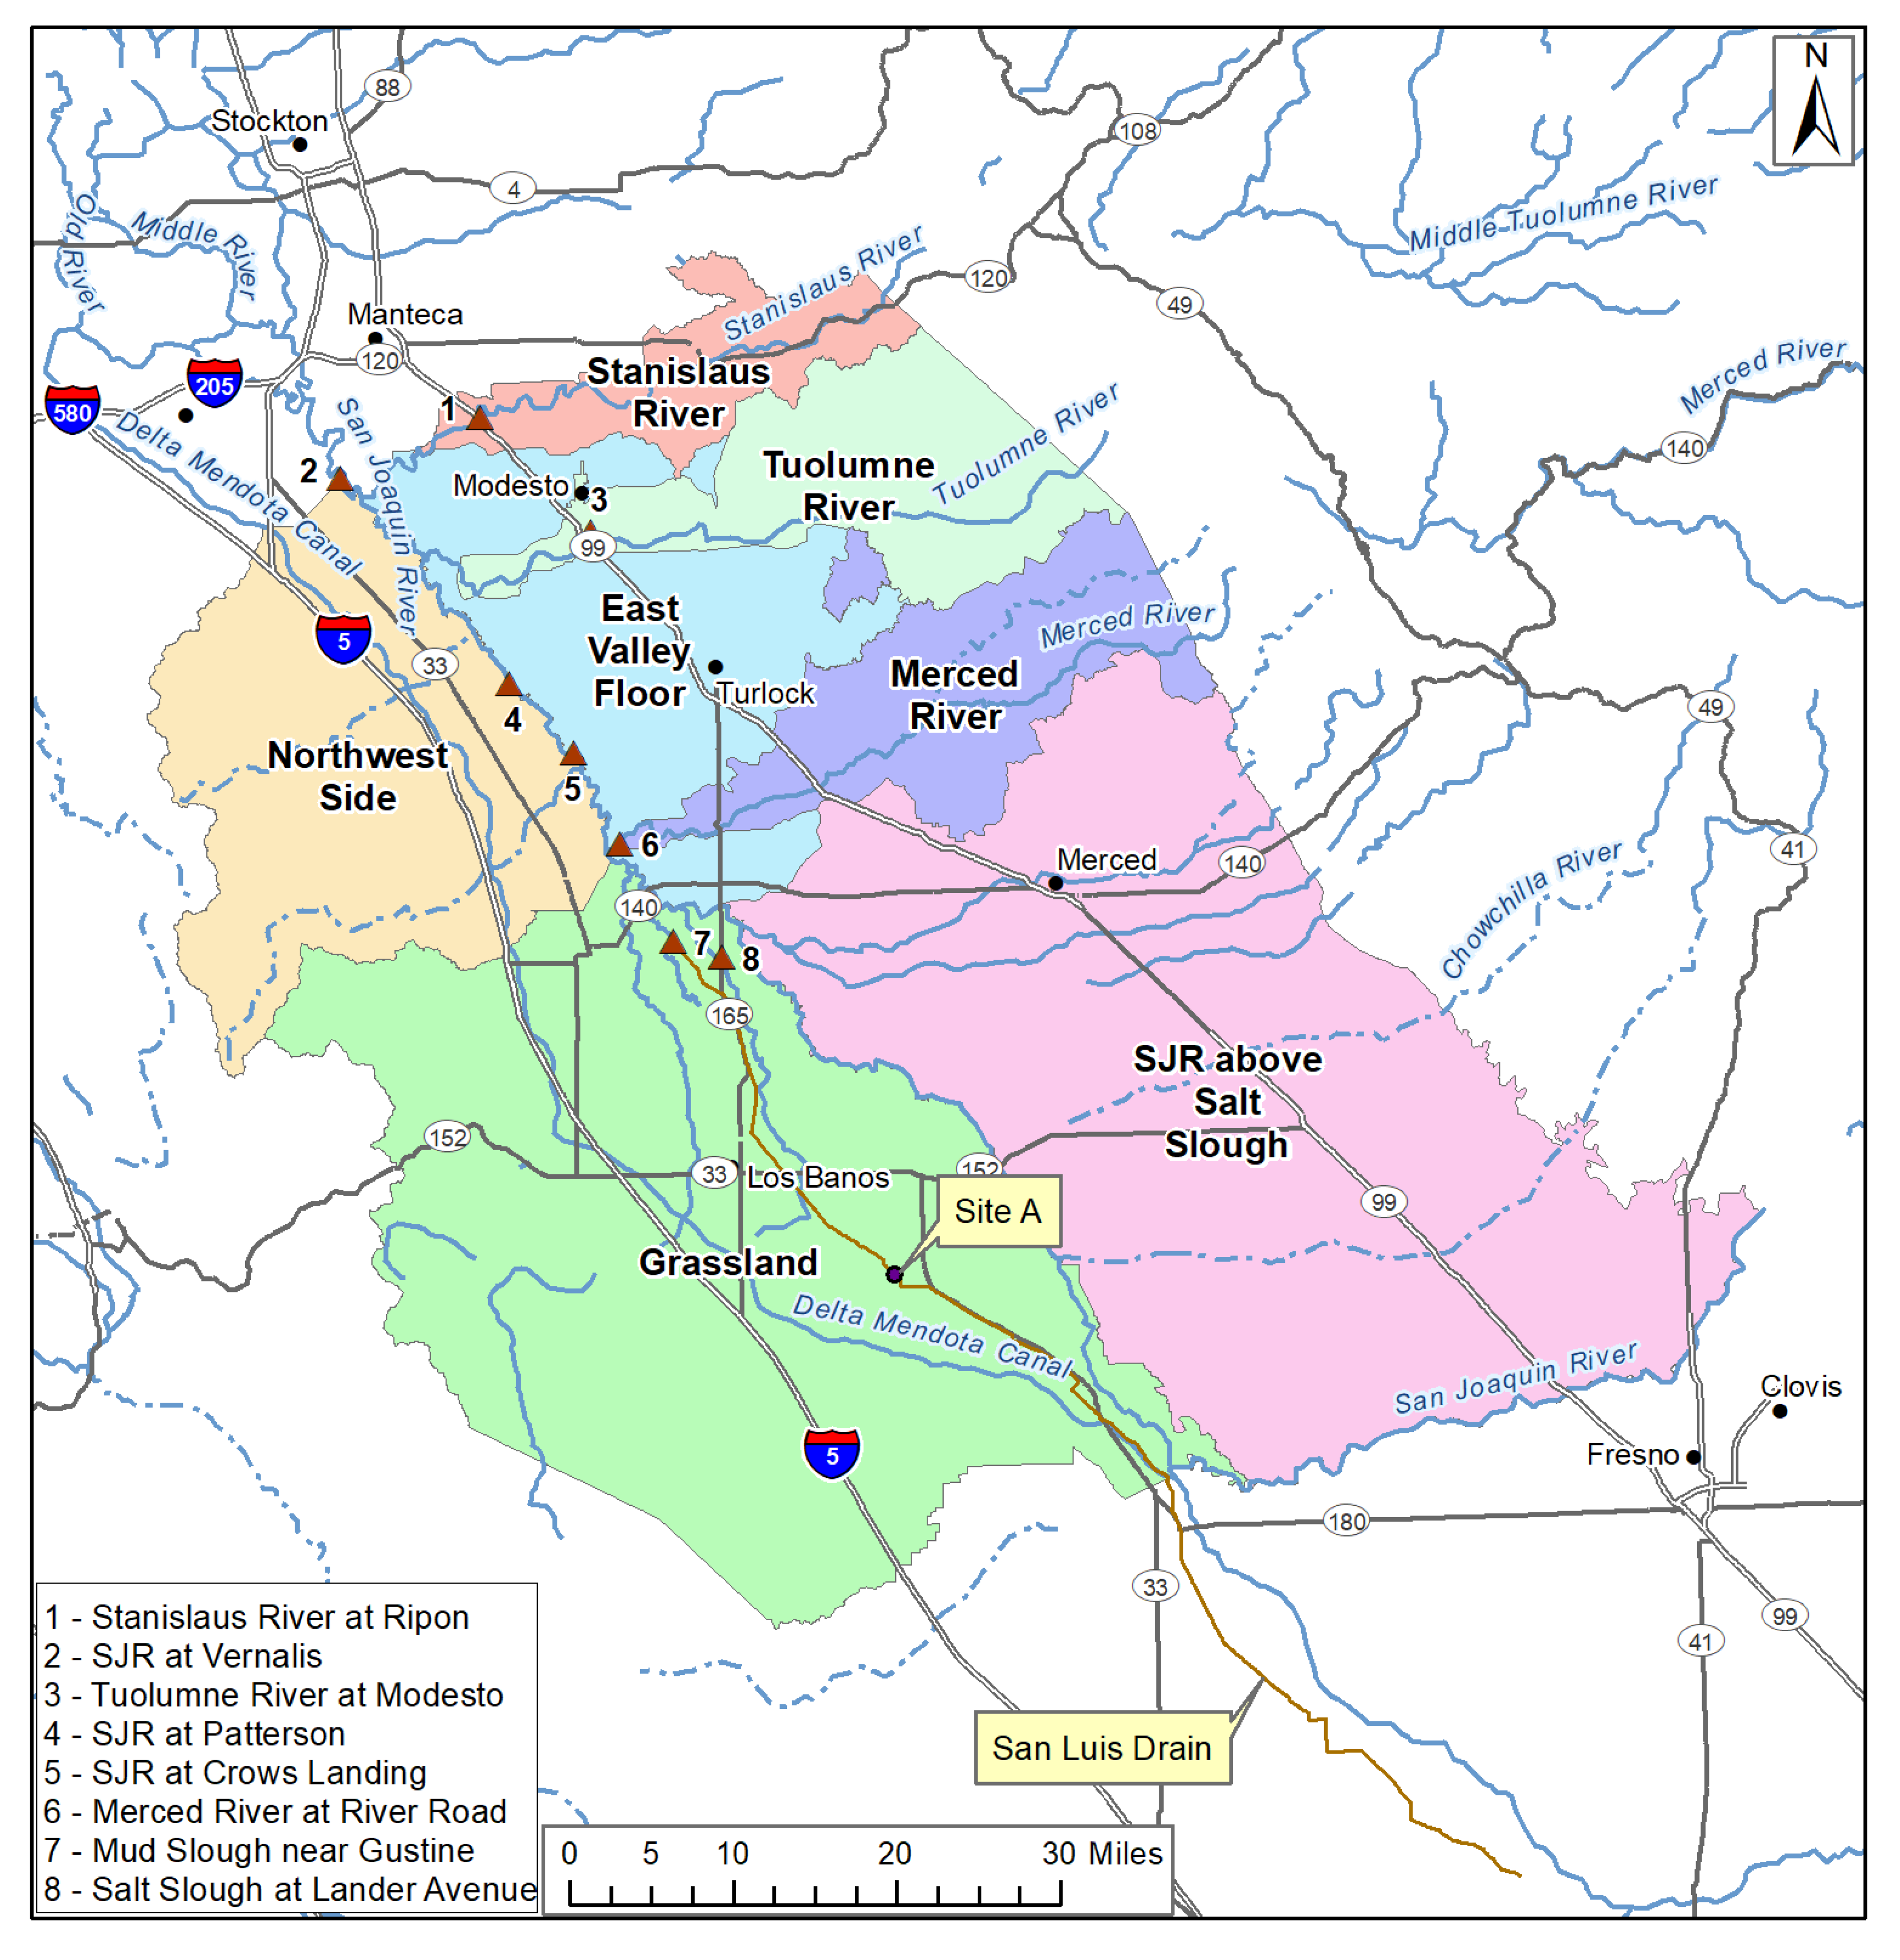
4.3. West Side Salinity Sources
- LADMC = Load Allocation of salt for DMC water deliveries (tons)
- QDMC = monthly volume of water delivered to Grassland and Northwest side sub-areas (acre-feet)
- 52 mg/l = “background” TDS of SJR water at Friant Dam (SJRB Basin Plan)
- 0.0013599 = TDS unit conversion factor (mg/L to tons/acre-feet)
- ELDMC = excess salt load above the Load Allocation (LADMC), in tons
- CDMC = monthly average (arithmetic mean) of salinity of the water delivered to Grassland and Northwest sub-areas, in mg/L
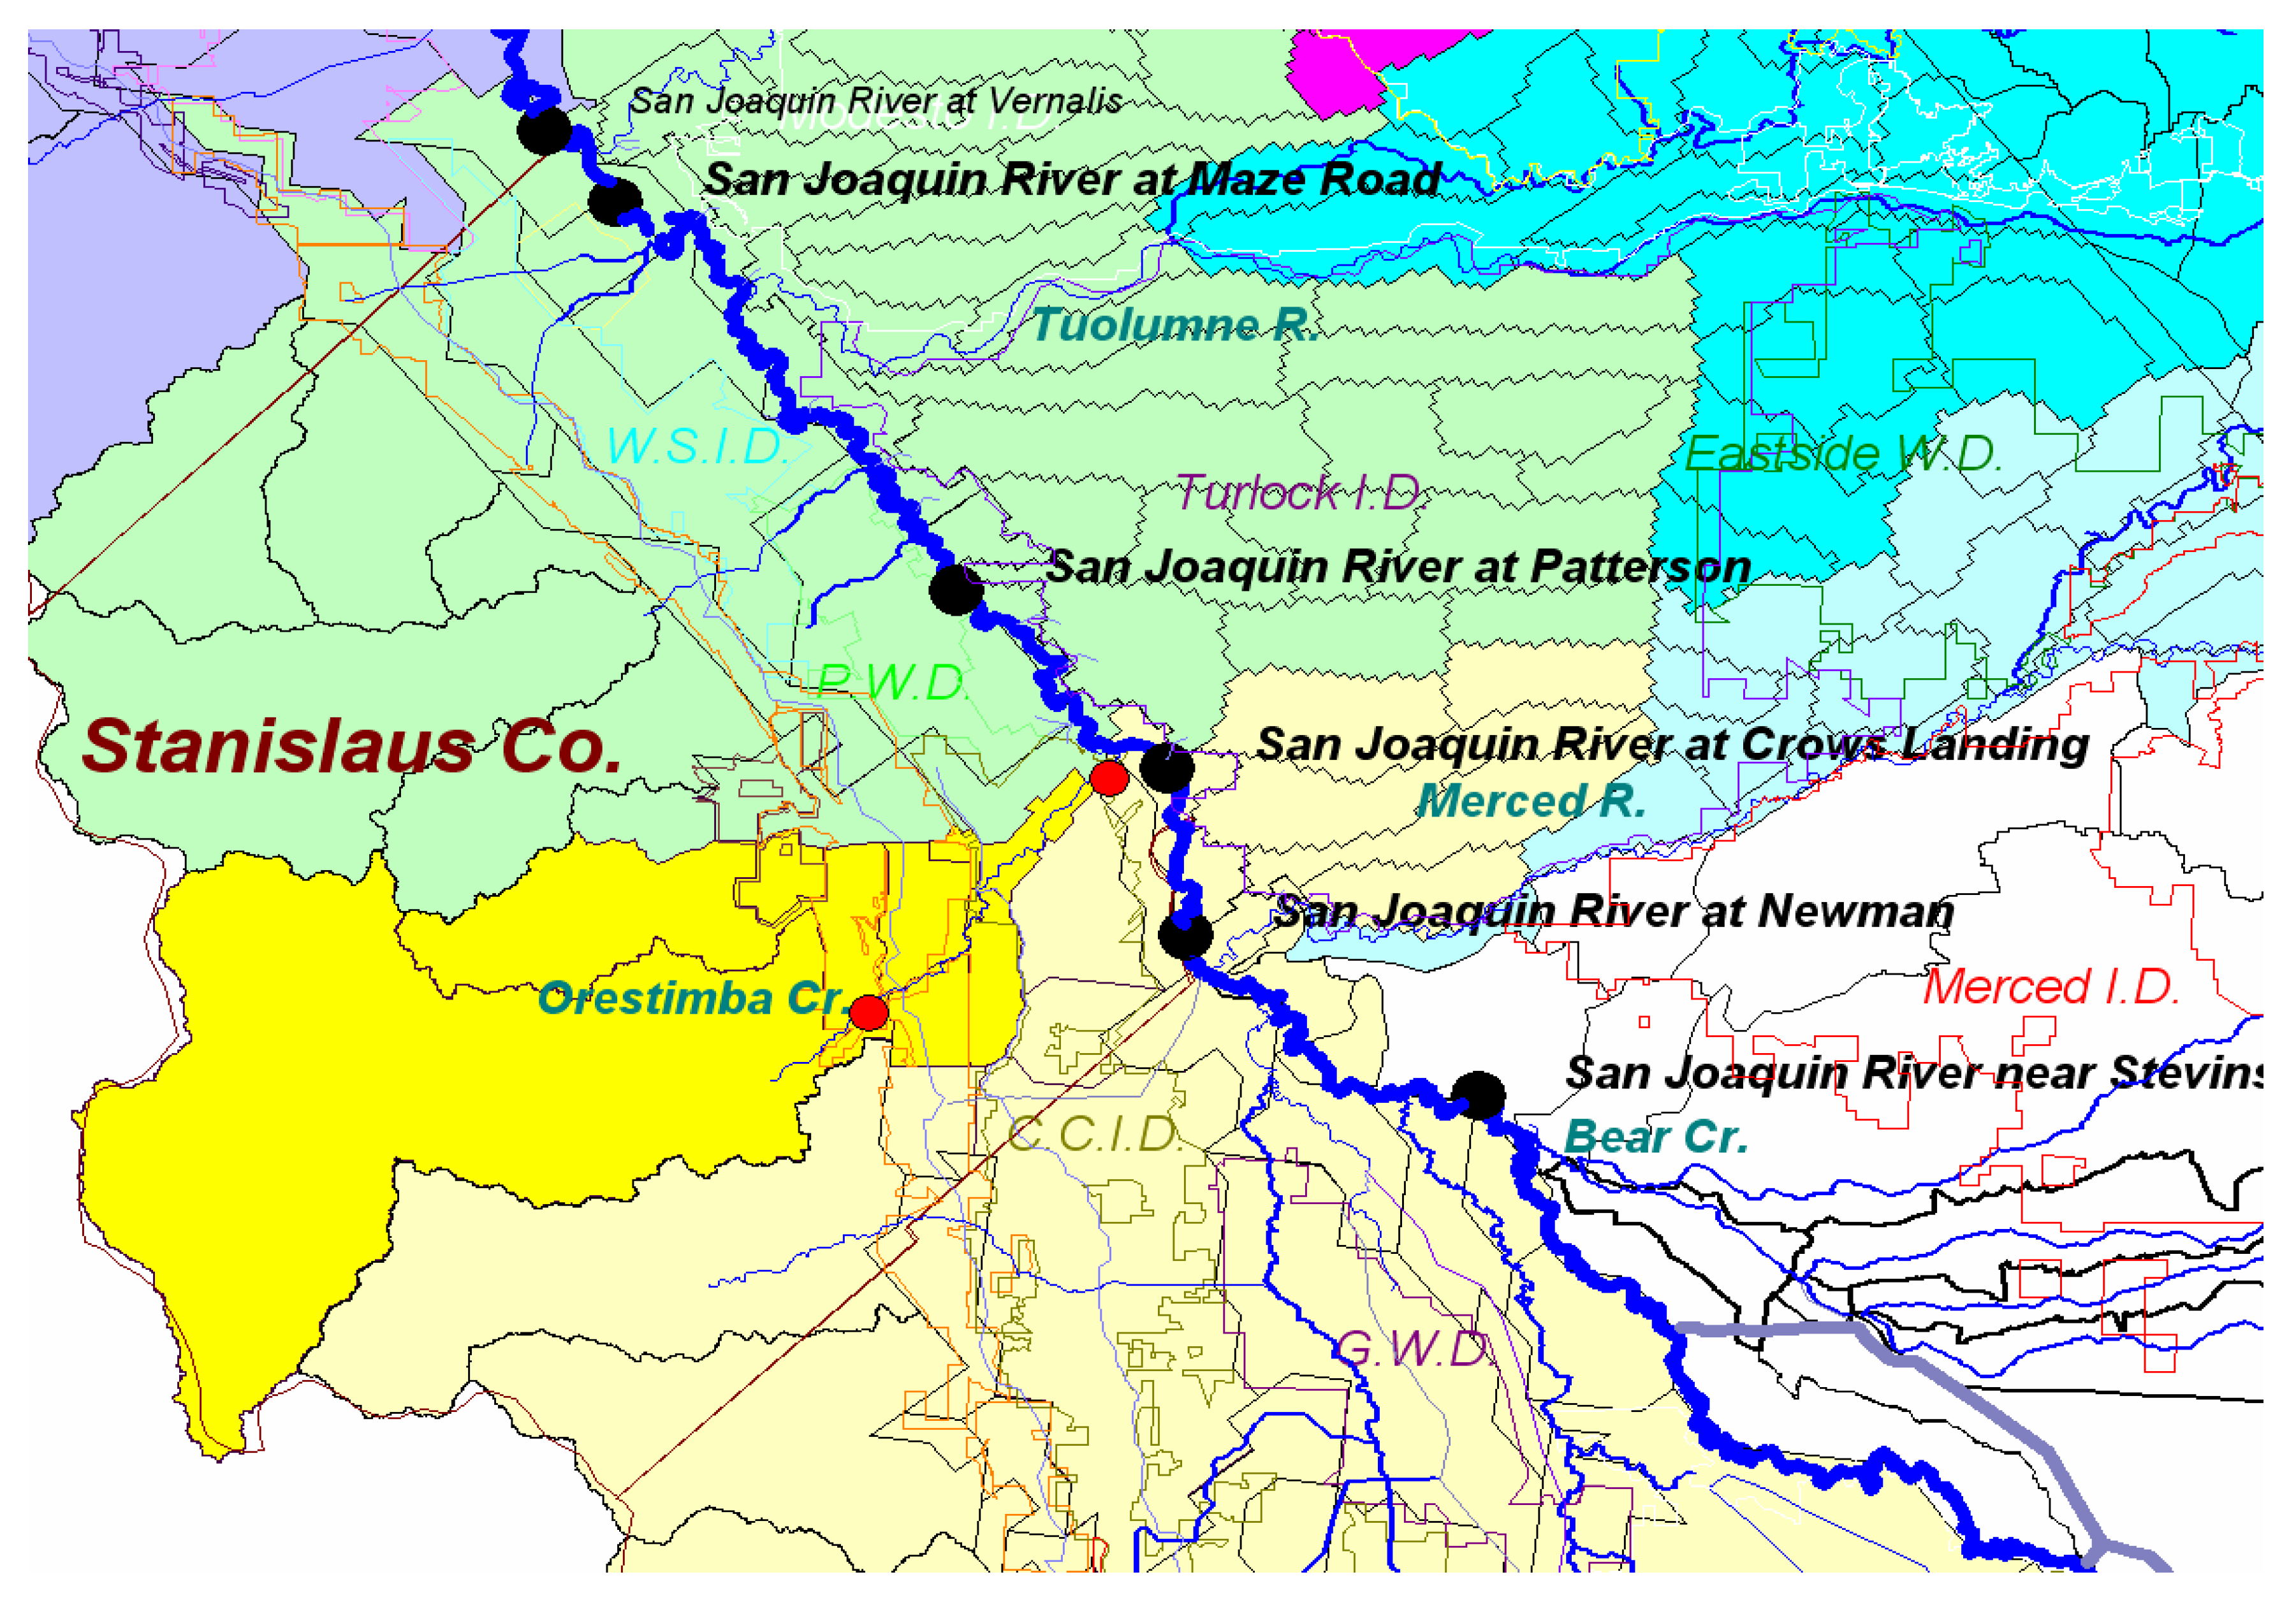
4.4. Quantification of East Side Assimilative Capacity Generating Flows
- Lactual = actual tributary salt loading (tons/month)
- Qactual = actual flow volume (acre-feet/month)
- Cactual = monthly mean EC (µS/cm)
- 0.69 = TDS:EC ratio specific to Stanislaus River
- 0.0013599 = TDS unit conversion factor (mg/L to tons/acre-feet)
- Adil = salt load assimilative capacity allocation provided by dilution flow (tons of salt/month)
- Qdil = dilution flow volume (acre-feet/month)
- Cdil = dilution flow EC (µS/cm)
- WQO = salinity water quality objective for the LSJR at Airport Way Bridge near Vernalis in μS/cm
- EC:TDS = TDS:EC ratio specific to the SJR (0.64). Ratio set to 0.66 for the Merced River and 0.67 for the Tuolumne River
- 0.0013599 = TDS unit conversion factor (mg/L to tons/acre-feet)
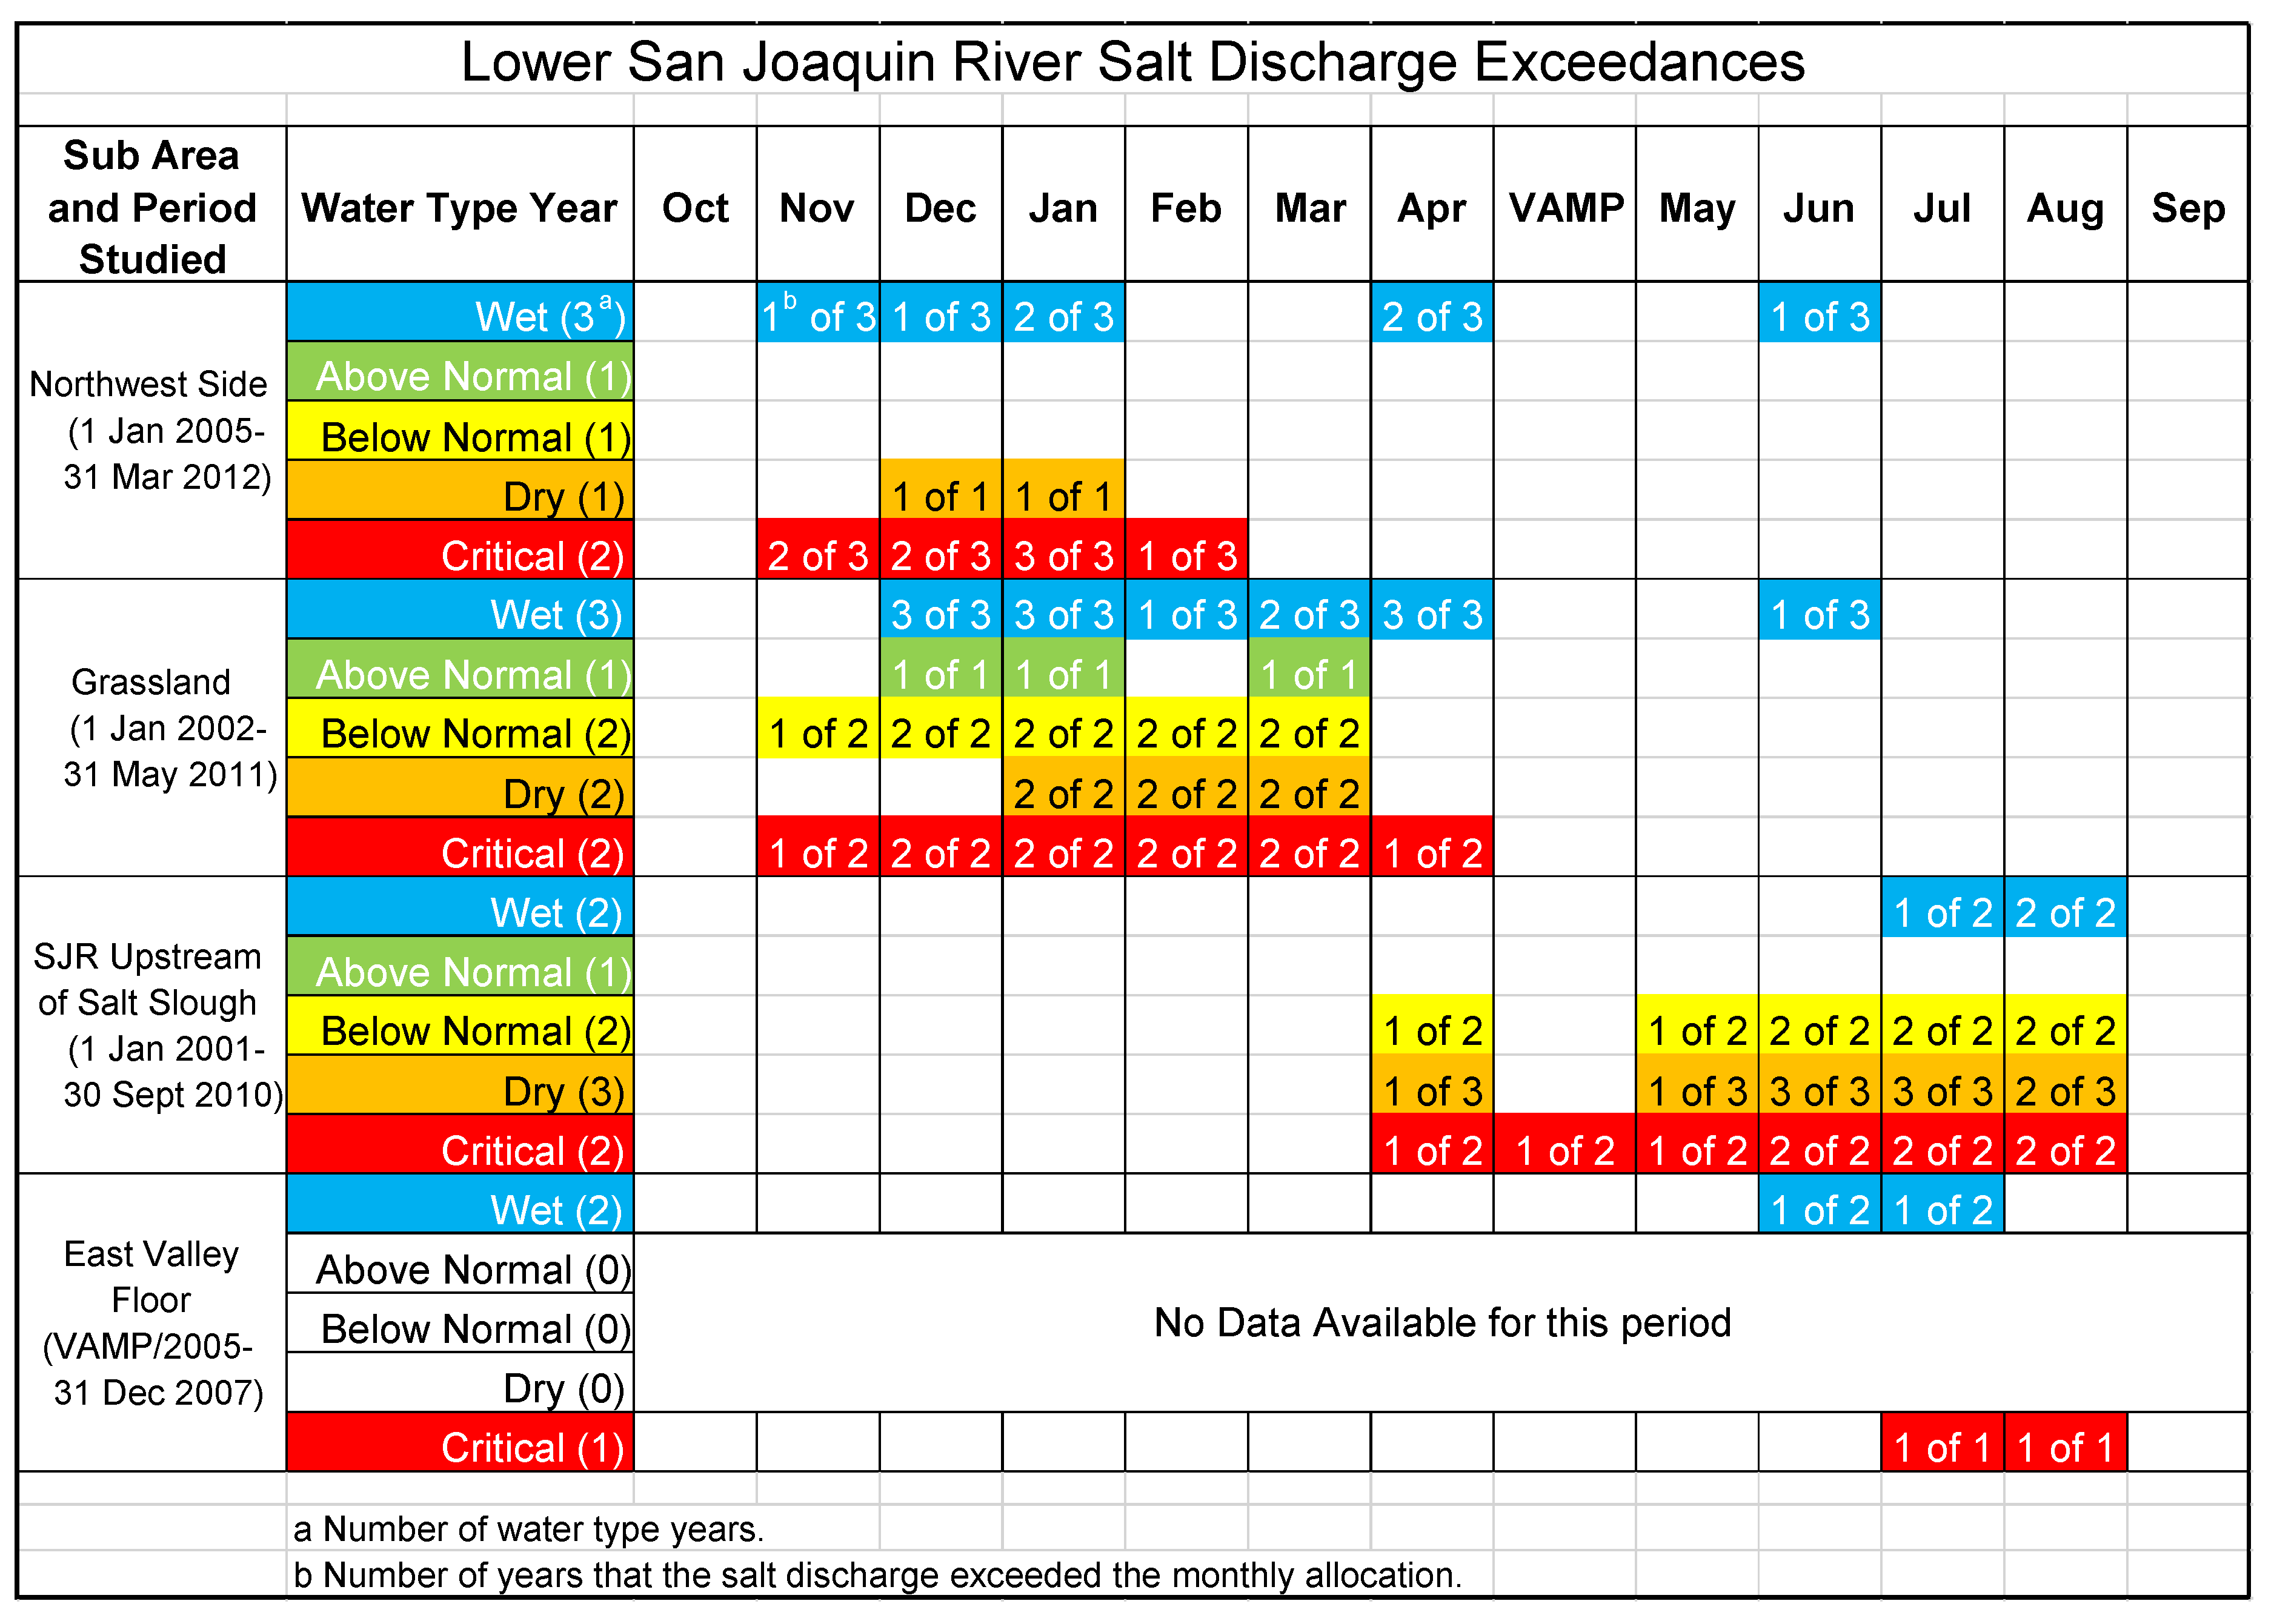
4.5. Salinity Management Policy Implementation
- (a)
- The salt load allocation process in the TMDL is complex. Individual sub-areas defined in the TMDL have no easy way to ascertain their contribution to salt loading to the SJR. Assessment of penalties for non-compliance with objectives is not transparent and may be onerous to enforce.
- (b)
- Salt loading is a product of flow and TDS (often measured via EC) and salt load assimilative capacity is a concept that is understood by few stakeholders. There is an educational outreach activity needed to address this deficiency and to show the benefits of coordination of activities to improve compliance with salinity objectives.
- (c)
- The TMDL provided no guidance with respect to the formation of an organizational entity with police power for implementing the TMDL or the way a market for salt load trading might be established.
- (d)
- The TMDL was developed using existing agency and stakeholder publicly accessible data. No guidance was provided on the expansion of existing or development of new monitoring networks for additional flow and EC data needed to understand current patterns of salt export from sub-areas within the watershed and for improved salt control and management within each sub-area.
4.6. Real-Time Salinity Management Program (RTSMP)
- (a)
- The Program maintains and (where necessary) expands existing accessible real-time monitoring networks that measure flow and EC necessary to assess daily SJR salt load assimilative capacity. The sharing of private water district drainage flow and EC data, as well as diversion data for those riparian districts that utilize the SJR for irrigation water supply, helps to expand the current environmental sensor network and is an important way the agricultural and wetland entities can show their commitment to the RTSMP.
- (b)
- The Program provides technical support of the RTSMP that includes the development and maintenance of a computer-based water quality simulation model that can be used to estimate salt load assimilative capacity in the SJR. The simulation model would accommodate the inclusion of real-time drainage and SJR diversion data from cooperating stakeholders. The model would make 14-day forecasts of SJR flow, EC, and salt load assimilative capacity based on advance schedules of east side tributary reservoir releases and other planned operations such as district diversion pumping schedules. Where these advance schedules are not available, archived data that match time of year and water-year type can be used by the model to make provisional forecasts.
- (c)
- An accessible data repository is a necessary feature of the Program that archives sensor network data and a data screening capability to provide a minimum level of data quality assurance and control. Several of the larger water districts and water agencies use hydrological data management software such as WISKI and HYDSTRA, (https://www.kisters.net) and AQUARIUS (https://aquaticinformatics.com/products to perform real-time quality assurance on data downloaded from their sensor networks.
- (d)
- The Program will benefit and require the construction of physical infrastructure, such as temporary holding ponds, drainage control structures, and drainage reuse and recirculation systems at the water district or sub-basin watershed level to provide rapid response to periods of potential non-compliance with salinity objectives.
4.7. Real-Time Salinity Monitoring and Estimation of Salt Load Assimilative Capacity
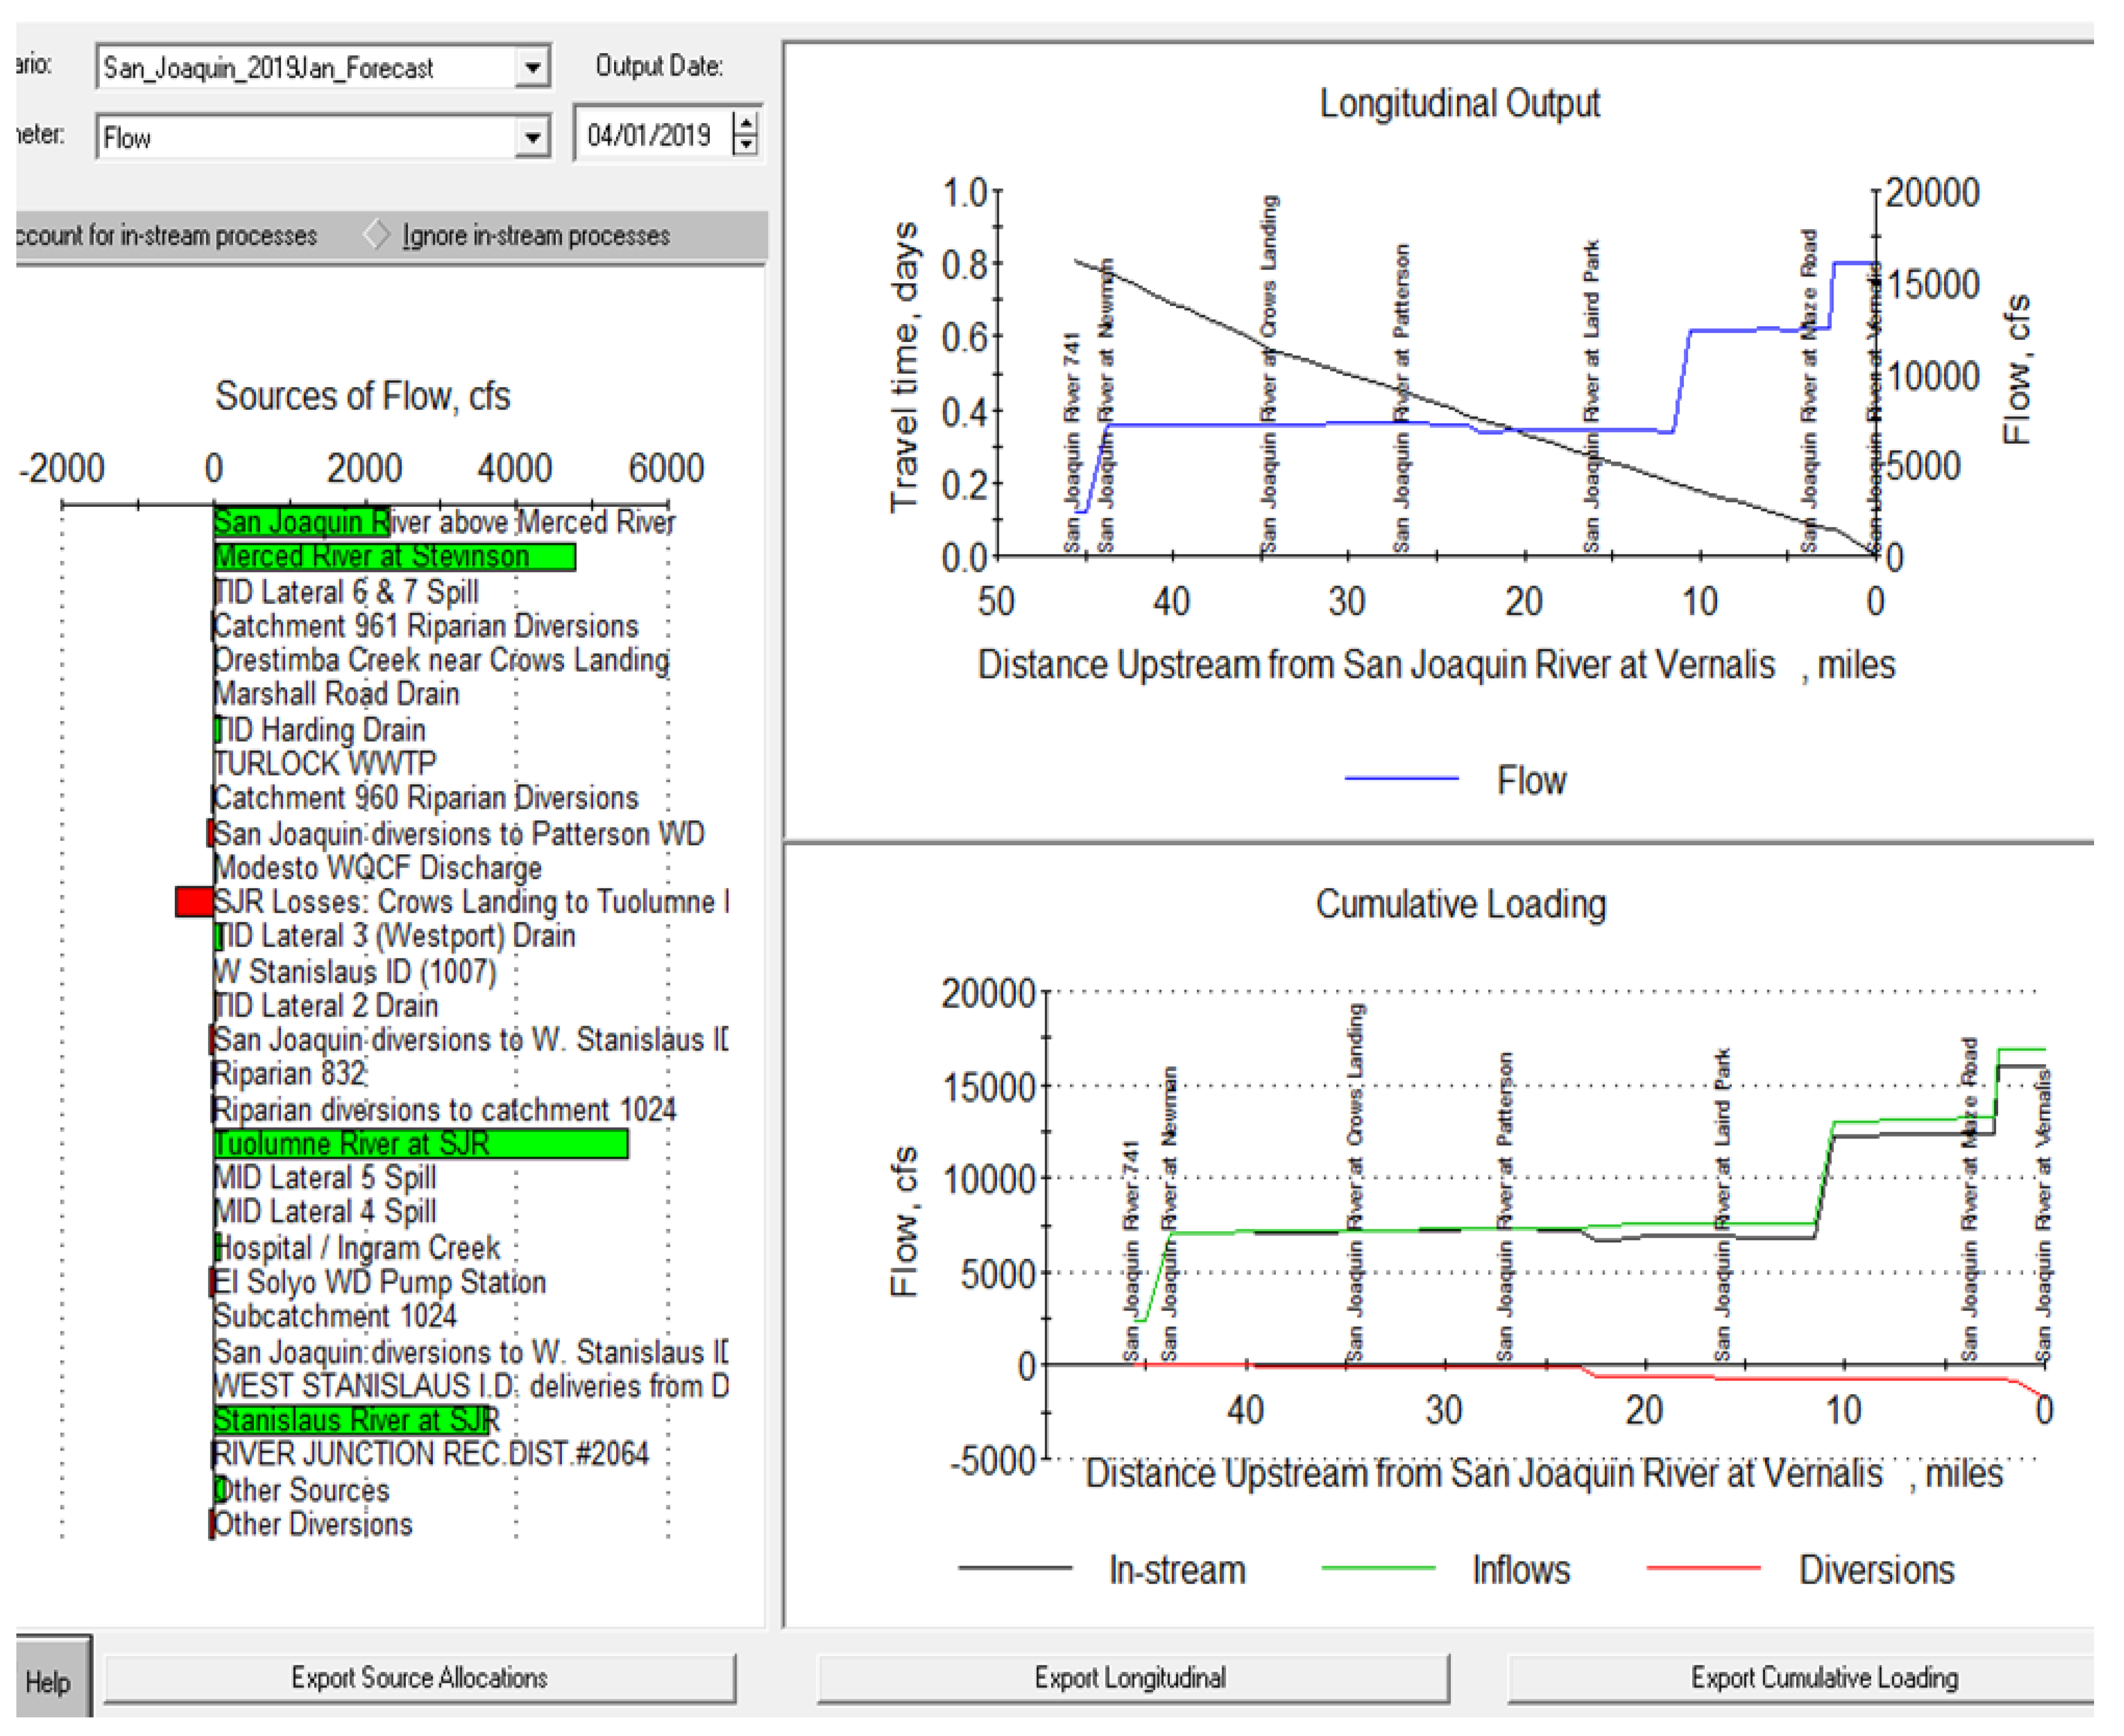
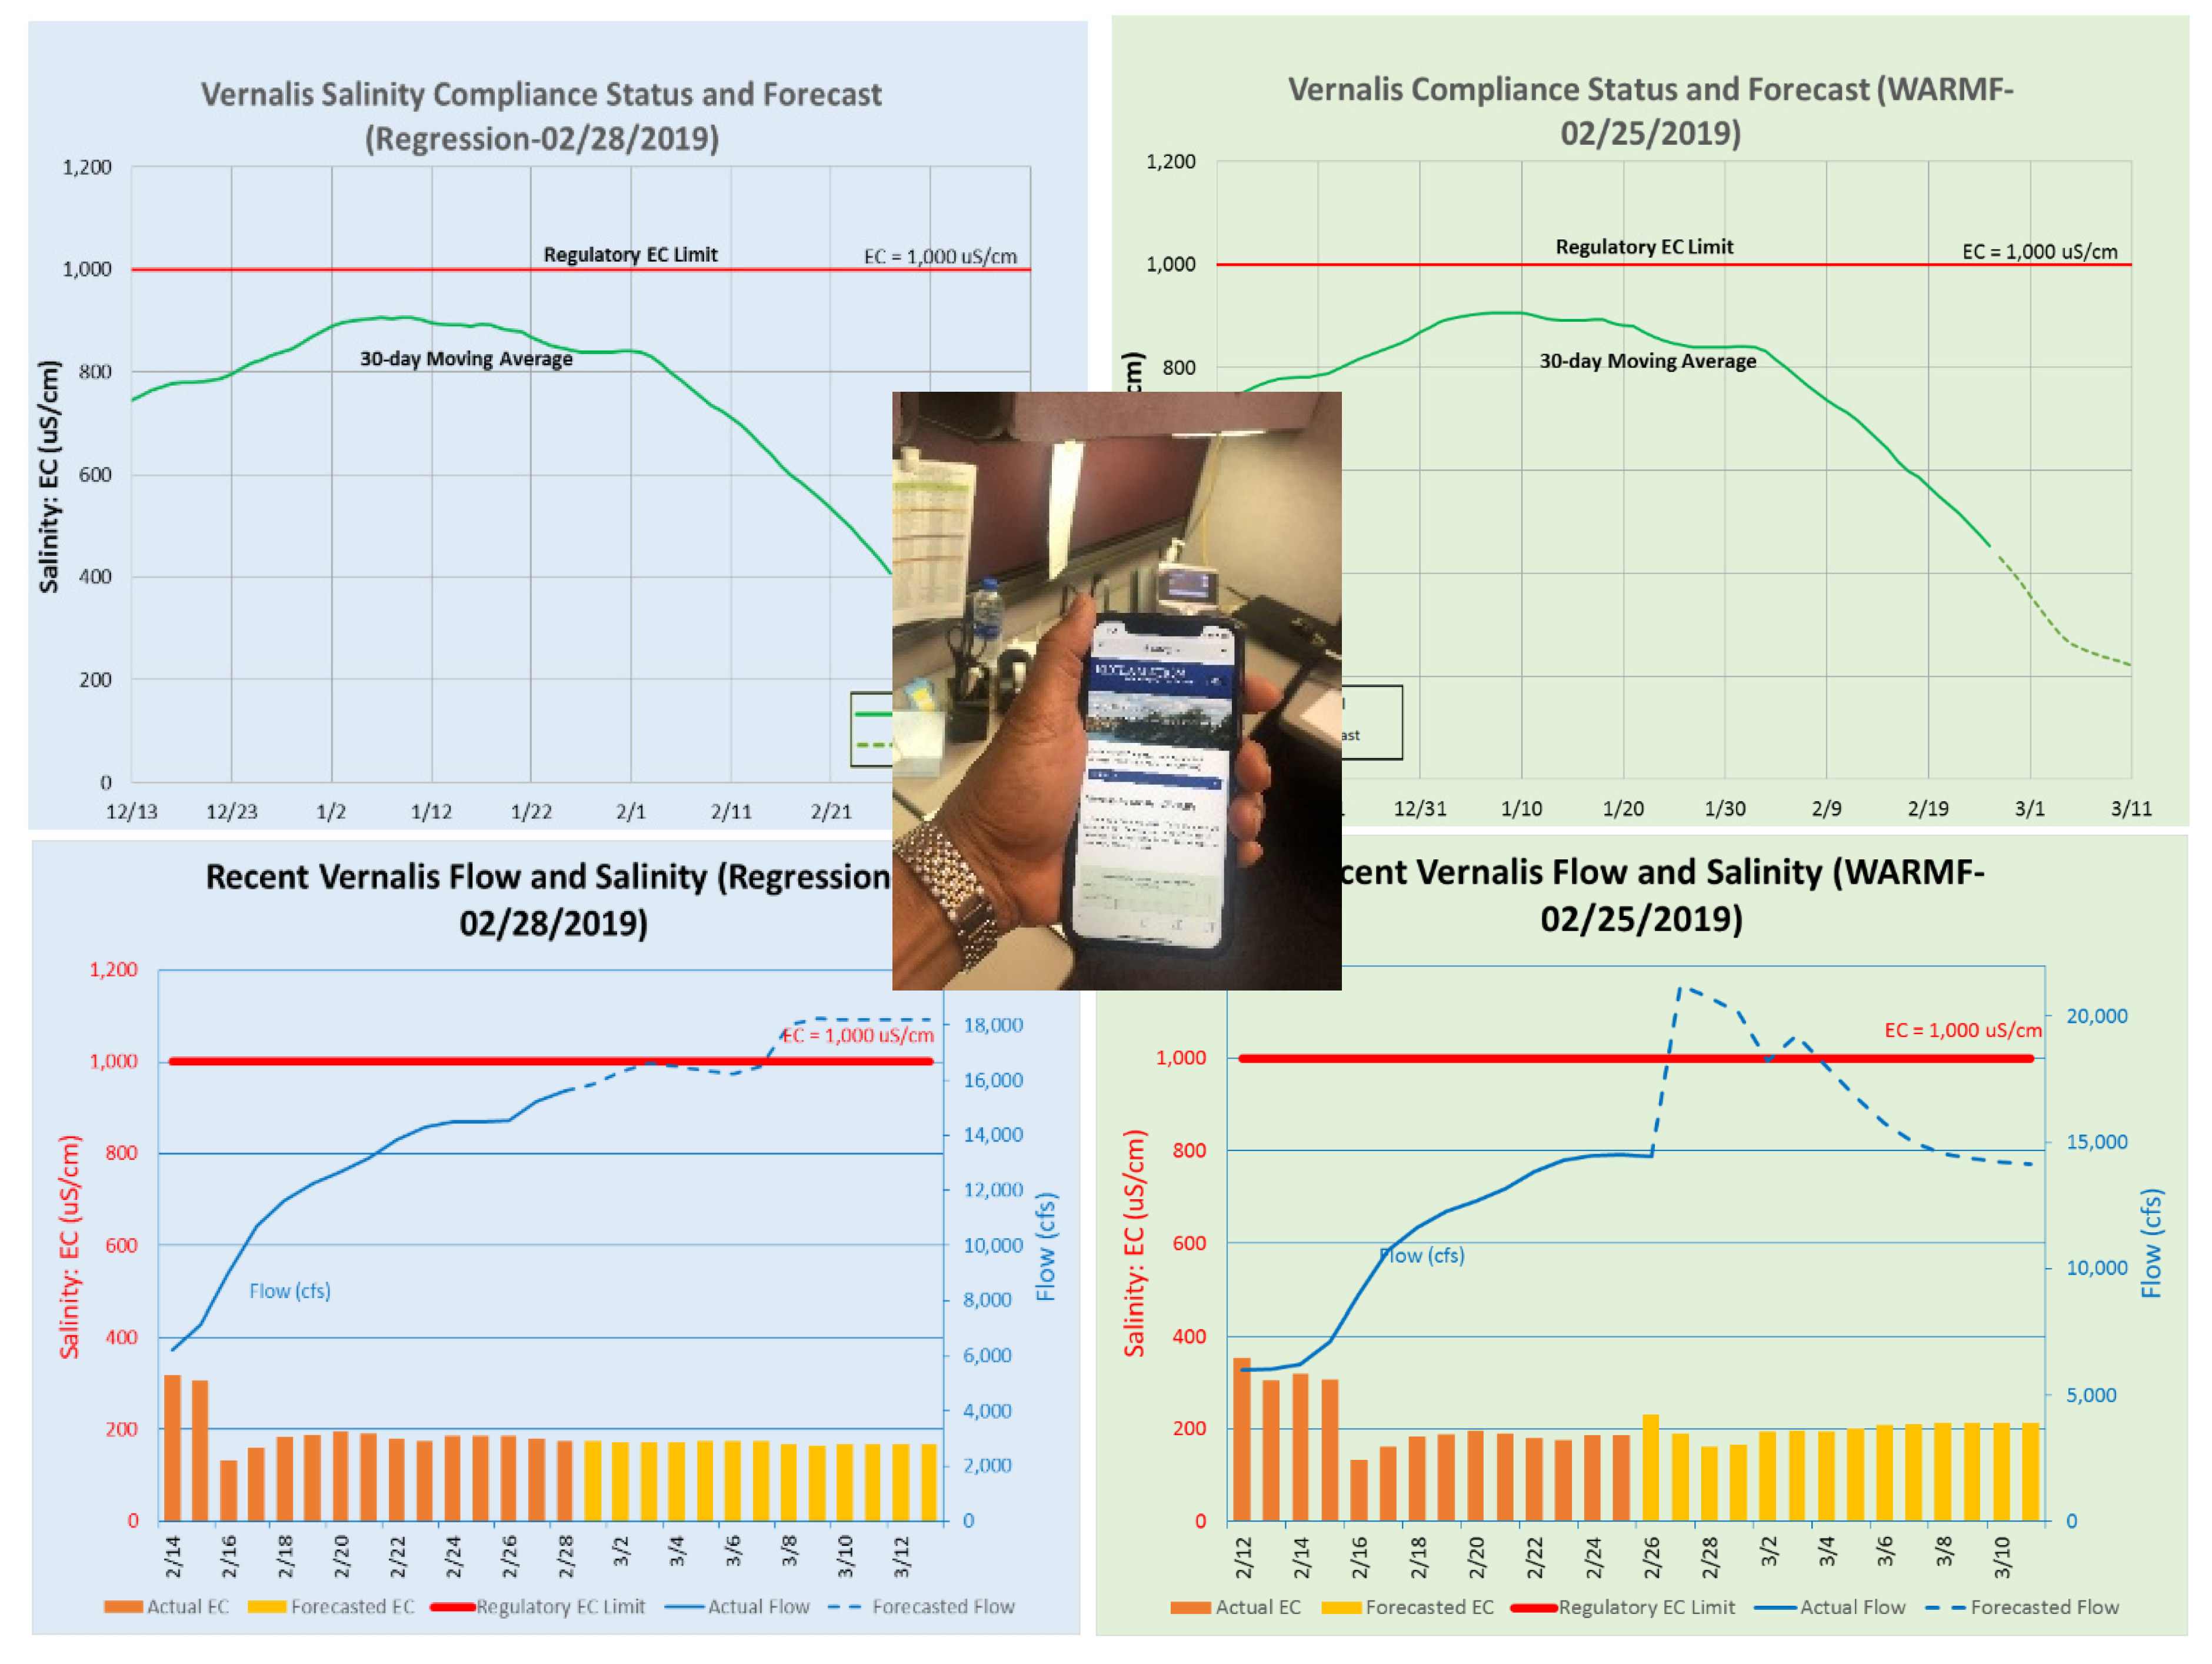
4.8. Real-Time Salinity Modeling and Forecasting
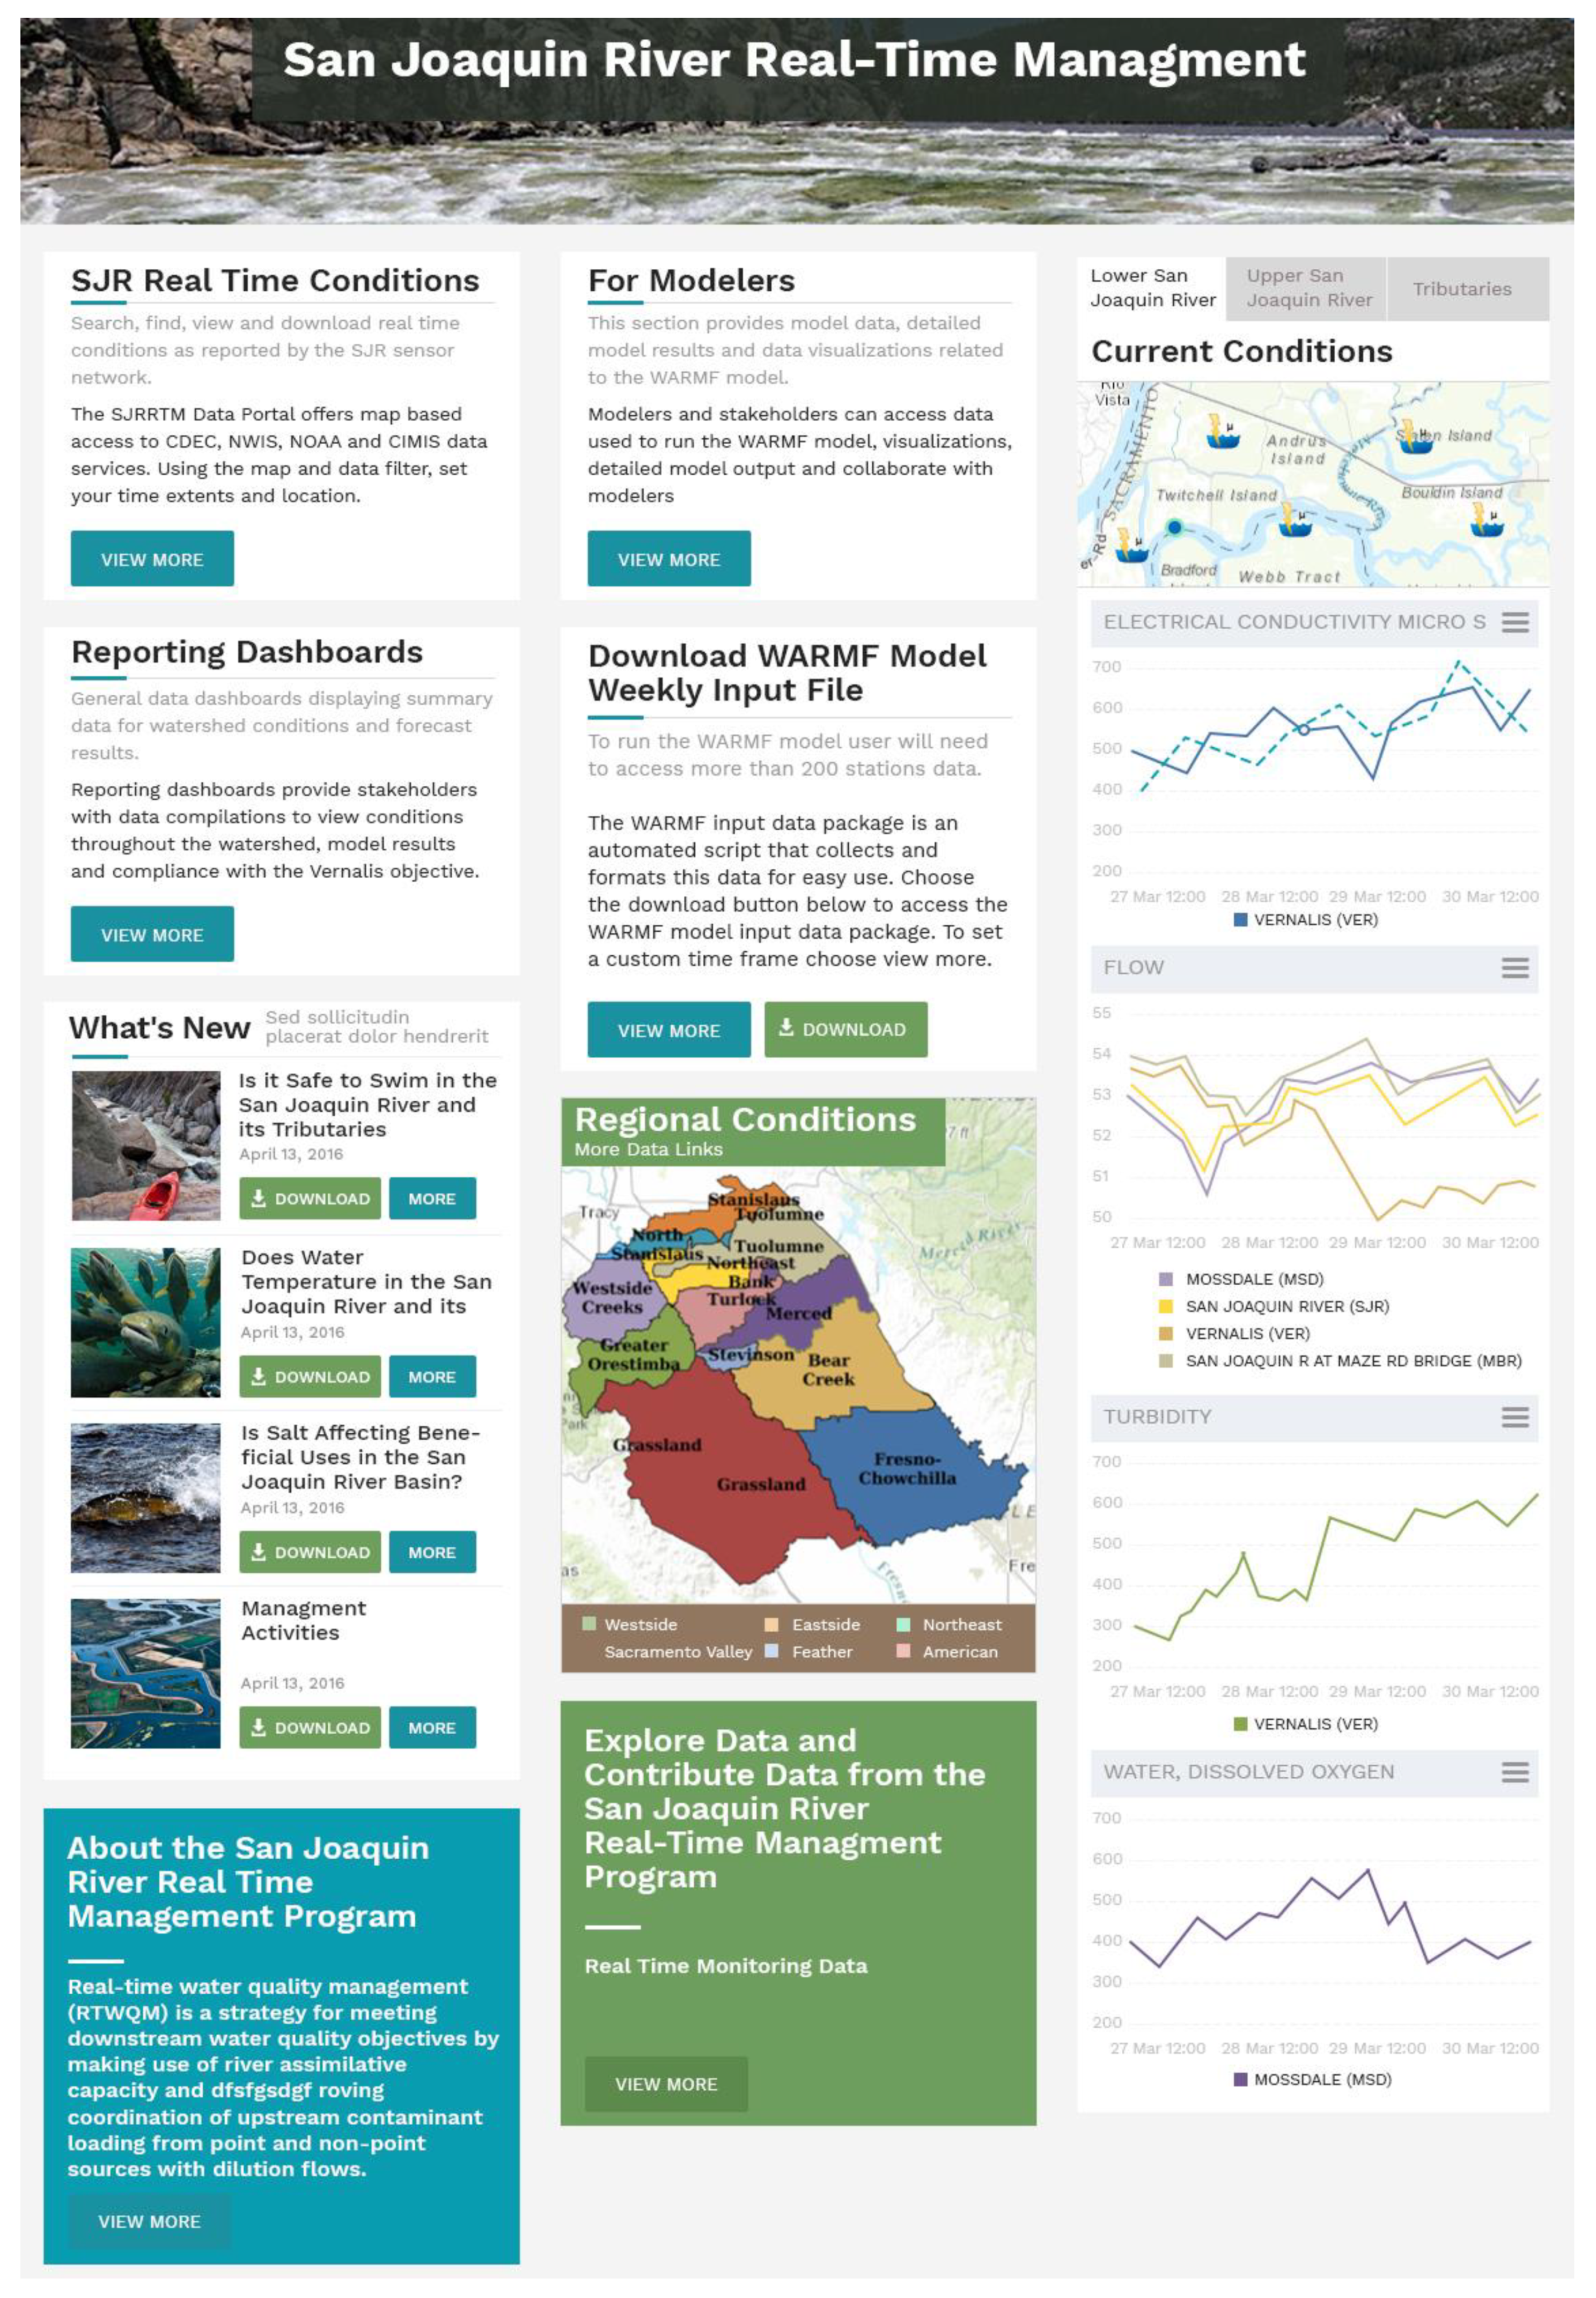
4.9. Web-Based WARMF Model Data and Model Forecast Visualization for Sustainable Real-Time Salinity Management
- (a)
- The Web portal is comprehensive and allows easy access to all current, publicly accessible real-time flow and EC data, however, stakeholder feedback suggests that the Web portal is hard to navigate and there are often too many steps involved in accessing specific data. Although one stakeholder invested time and effort in building a custom dashboard with URL links to data she used routinely others appeared less willing to commit the time. This can be ascribed to the fact that their data access needs were less prescribed and more random—the productivity gains they anticipated from use of the tool were lower than expected by the development team.
- (b)
- There are no current financial incentives with respect to salinity non-compliance that might encourage stakeholders to take advantage of the resources offered by the SJRRTM Online Web portal. During periods of non-compliance the imposition of fees associated with salt loads in excess of sub-area monthly salt load targets would likely incentivize the quantification of salt loads and salt load assimilative capacity and comparisons between monthly sub-area salt load targets and sub-area performance with the SJRB.
4.10. Alternative Modeling Approaches for Sustainable Real-Time Salinity Management
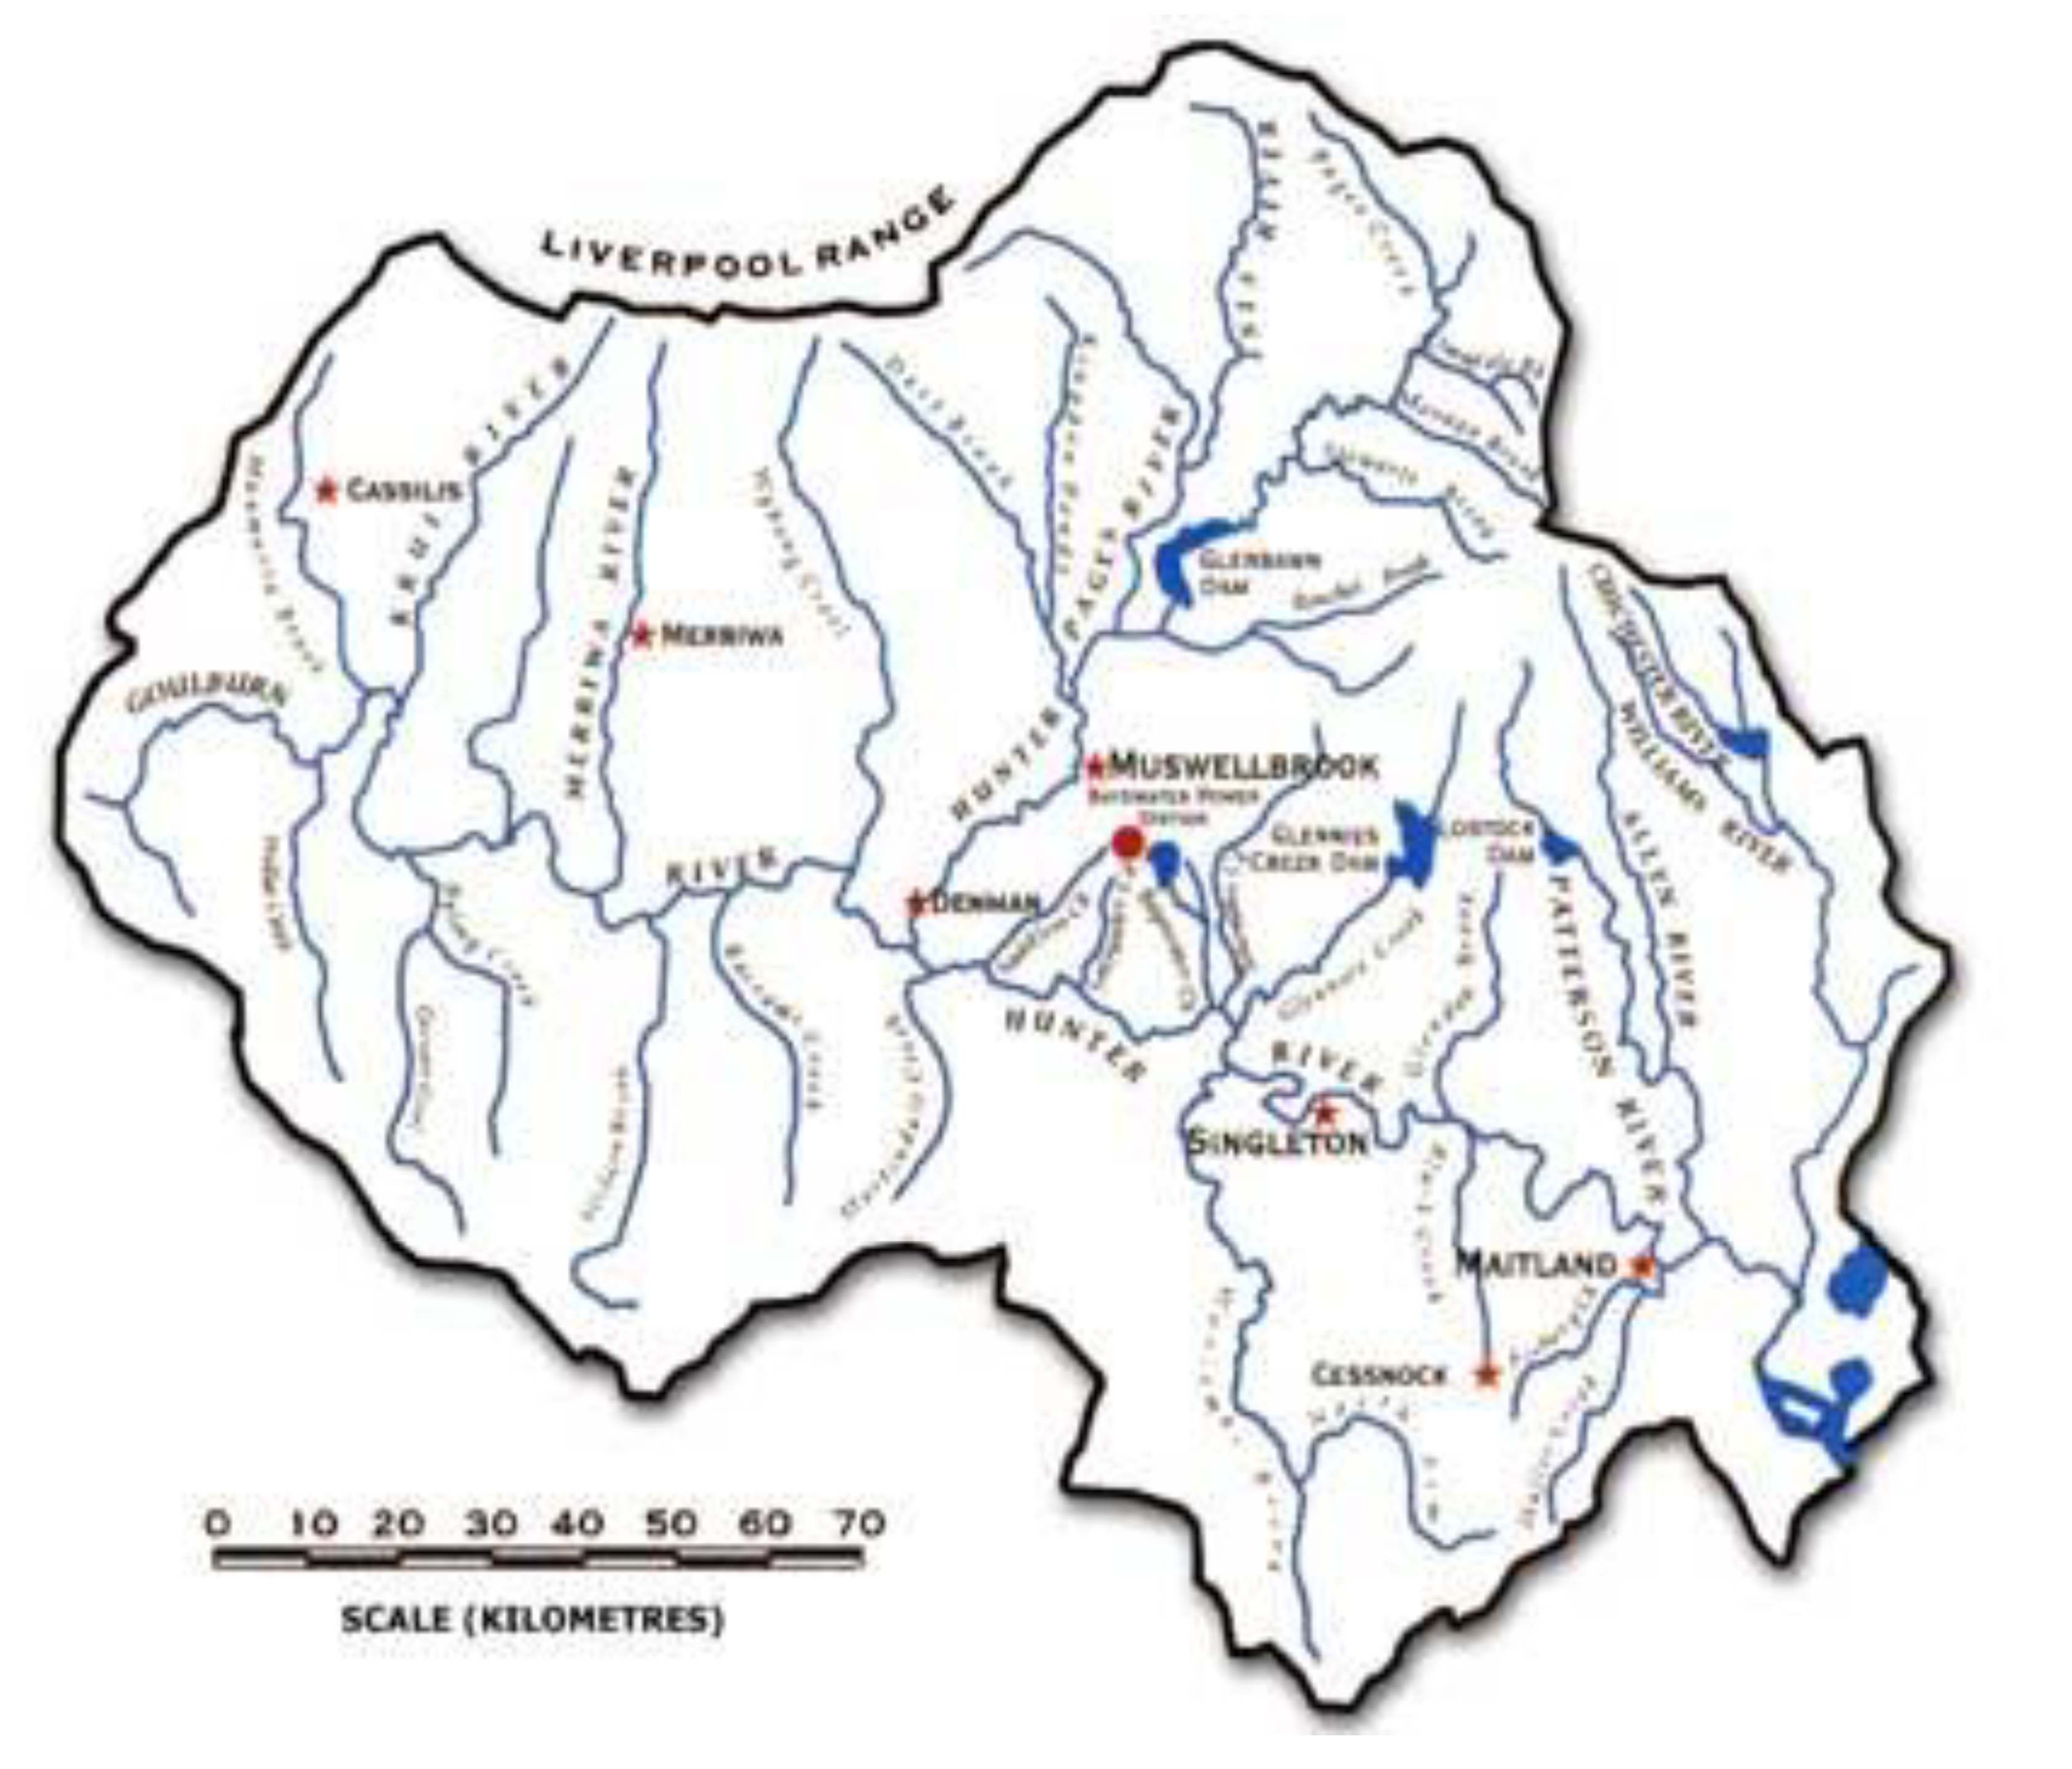
4.11. Case Study of the Hunter River Salinity Trading Scheme
- low flow—discharges not allowed,
- high flow—discharges allowed using tradeable salt load credits,
- flood flows—no limit to salt load unless restricted under a policy provision.
5. Discussion
6. Summary and Conclusions
Funding
Acknowledgments
Conflicts of Interest
Abbreviations
| CDWR | California Department of Water Resources |
| CVHM | Central Valley Hydrologic Model |
| CVP | Central Valley Project |
| CVRWQCB | Central Valley Regional Water Quality Control Board |
| CVWB | Central Valley Water Board (same as above) |
| C2VSIM | Central Valley (groundwater/surface water) Simulation Model |
| DMC | Delta–Mendota Canal |
| EC | Electrical conductivity |
| ET | Evapotranspiration |
| EPA | United States Environmental Protection Agency |
| GBP | Grassland Bypass Project |
| GSA | Groundwater Sustainability Area |
| GSP | Groundwater Sustainability Plan |
| HRSTS | Hunter River Salinity Trading Scheme. |
| InSAR | Interferometric Synthetic Aperture Radar |
| ITRC | Irrigation Technology Research Center at California Polytechnic University |
| NOAA | National Oceanic Atmospheric Administration |
| PWD | Panoche Water District |
| ppm | parts per million |
| RTSM | Real-Time Salinity Management |
| RTSMP | Real-Time Salinity Management Plan |
| SGMA | Sustainable Groundwater Management Act |
| SJRIO | San Joaquin River Input-Output Model |
| SJV | San Joaquin Valley |
| SJR | San Joaquin River |
| SJRB | San Joaquin River Basin |
| SJRRTM | San Joaquin River Real-Time Management Web portal |
| SJVDP | San Joaquin Valley Drainage Program |
| SJRIP | San Joaquin River Improvement Project |
| TMDL | Total Maximum Daily Load |
| USBR | United States Bureau of Reclamation |
| USFWS | United States Fish and Wildlife Service |
| USGS | United States Geological Survey |
| VAMP | Vernalis Adaptive Management Plan |
| WARMF | Watershed Analysis Risk Management Framework |
Appendix A. List of Relevant Metric Conversion Factors
| 1 acre | = | 0.405 ha |
| 1 acre-ft | = | 1233 m3 |
| 1 acre-ft | = | 0.1233 ha-m |
| 1 cfs | = | 0.0283 m3/s |
| 1 ft | = | 0.3048 m |
| 1 cu ft | = | 0.0283 |
| 1 ton (US) | = | 0.907 tonnes |
| 1 ton (salt)/acre-foot | = | 753 mg/L |
References
- Quinn, N.W.T. The San Joaquin Valley: Salinity and Drainage Problems and the Framework for a Response. In Salinity and Drainage in San Joaquin Valley, California; Chang, A.C., Brawer Silva, D., Eds.; Springer Science+Business Media: Dordrecht, The Netherlands, 2014. [Google Scholar] [CrossRef]
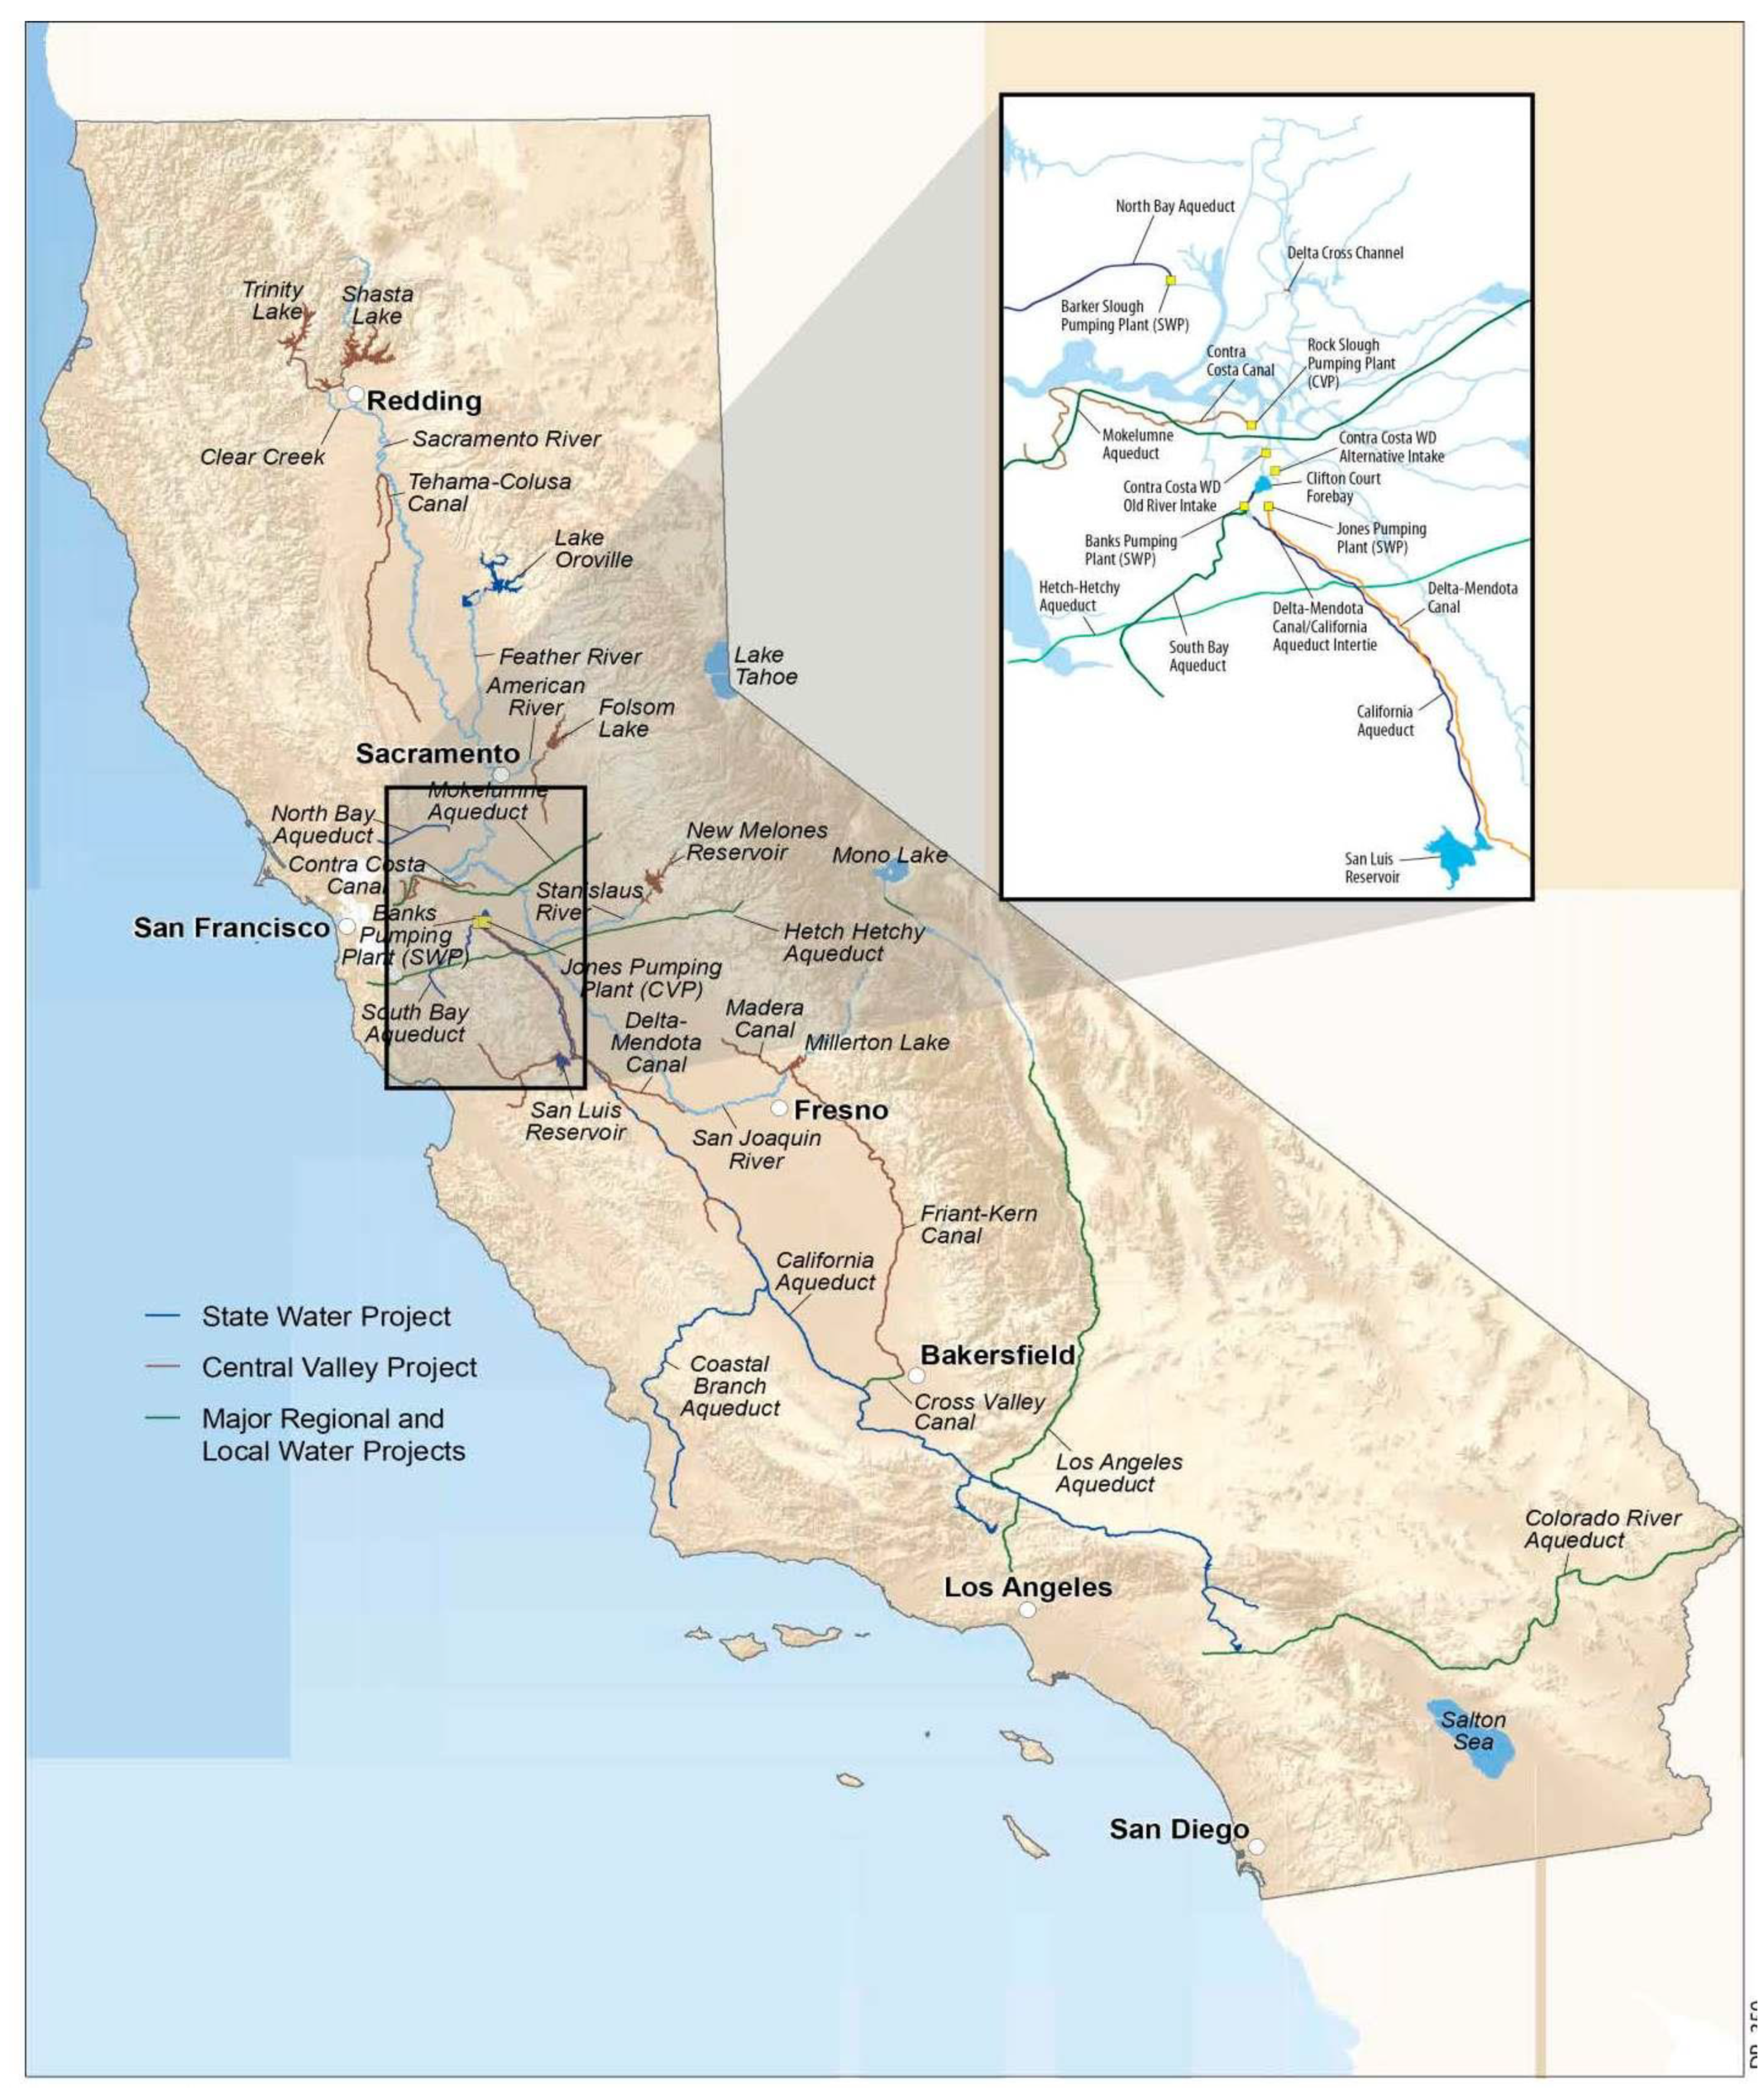
- State of California, Department of Water Resources. Mavens Notebook. 2009. Available online: https://mavensnotebook.com/wp-content/uploads/2013/07/Fig3-1.jpg (accessed on 5 June 2020).
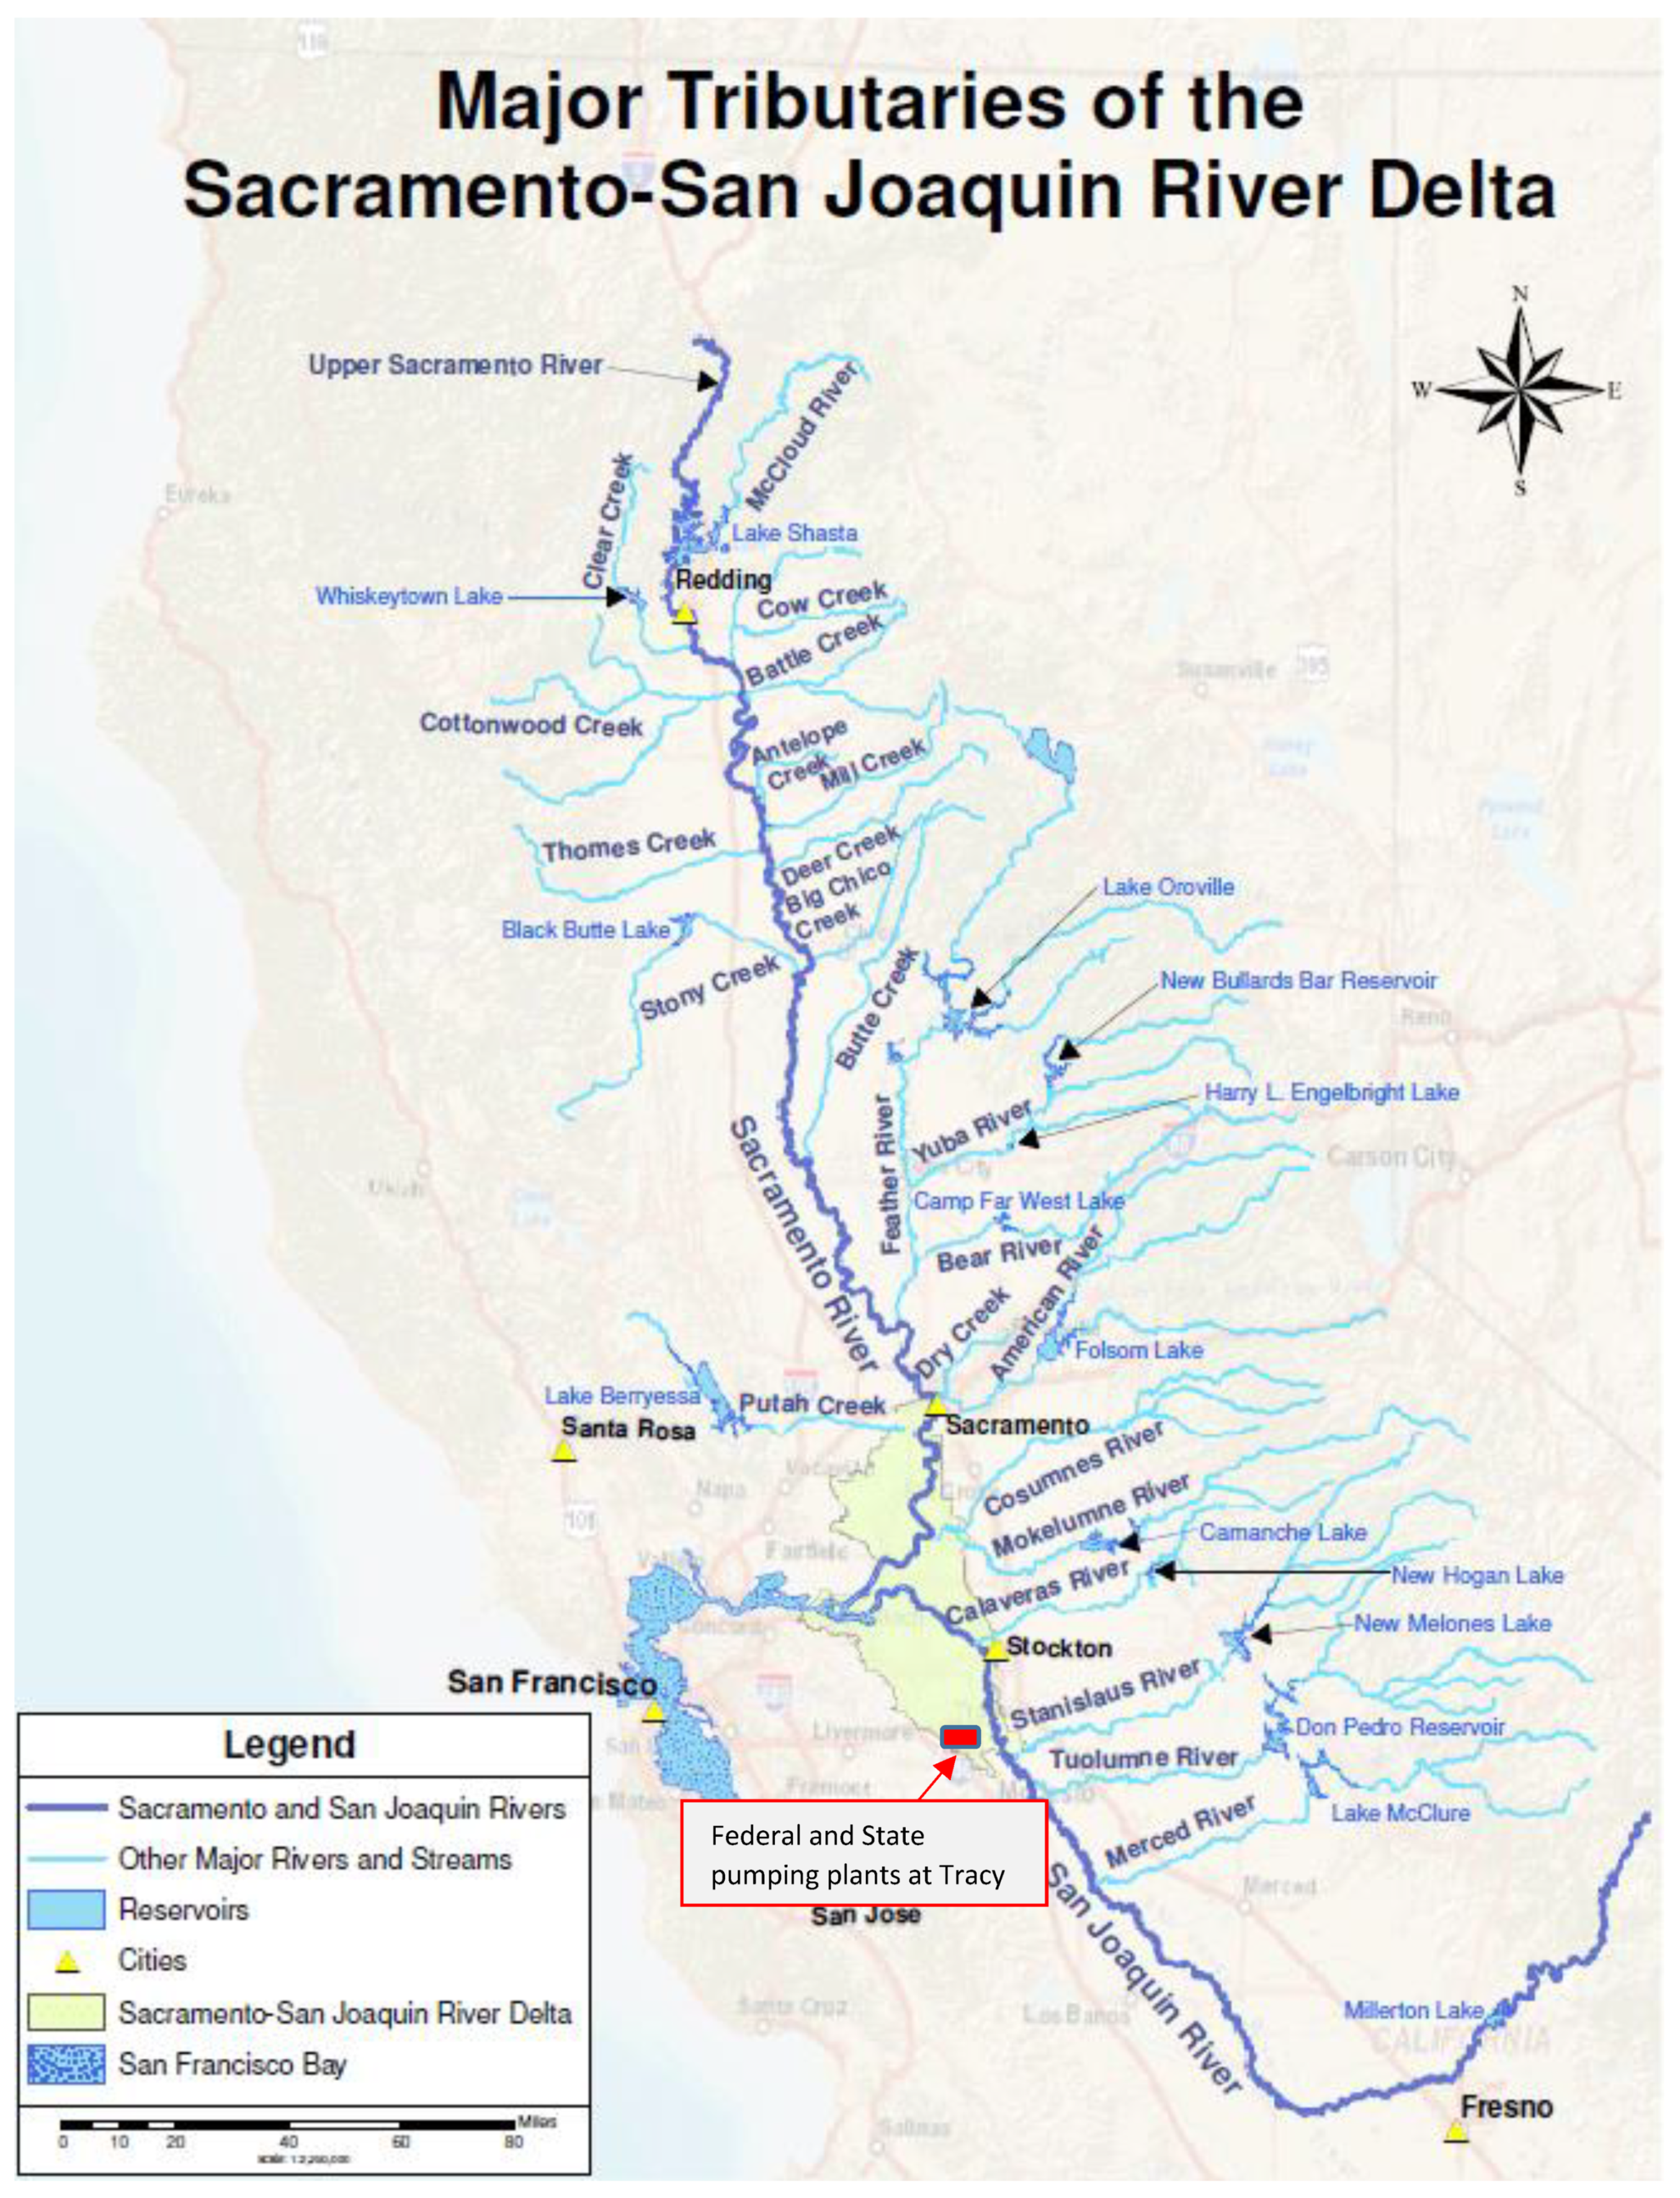
- State of California, Department of Water Resources. Mavens Notebook. 2009. Available online: https://mavensnotebook.com/wp-content/uploads/2013/04/tributary_map.gif (accessed on 5 June 2020).
- Hilgard, E. Irrigation and Alkali in India. College of Agriculture, University of California, Report to the President of the University; Bull. No. 86; California State Printing Office: Sacramento, CA, USA, 1889.
- Galloway, D.; Jones, D.R.; Ingebristen, S.C. Land Subsidence in the United States; Circular 1186; U.S. Geological Survey: Reston, VA, USA, 1999.
- Faunt, C.C. (Ed.) Groundwater Availability of the Central Valley Aquifer, California: U.S. Geological Survey Professional Paper No. 1766; U.S. Geological Survey: Reston, VA, USA, 2009; p. 225.
- Sneed, M.; Brandt, J.T.; Solt, M. Land subsidence along the California Aqueduct in west-central San Joaquin Valley, California, 2003–10: U.S. Geological Survey Scientific Investigations Report. 2018–5144; U.S. Geological Survey: Reston, VA, USA, 2018; p. 67. [CrossRef]
- California Department of Water Resources. Public Update for Drought Response Groundwater Basins with Potential Water Shortages and Gaps in Groundwater Management; California Department of Water Resources: Sacramento, CA, USA, 2014.
- Moran, T. Projecting forward. A Framework for Groundwater Model Development under the Sustainable Groundwater Management Act; Stanford Law School: Stanford, CA, USA, 2016. [Google Scholar]
- State of California, Department of Water Resources. Mavens Notebook. Available online: https://mavensnotebook.com/2017/04/12/panel-discussion-implementing-sgma-how-are-we-getting-there/ (accessed on 5 May 2020).
- Hanak, E.; Lund, J.; Arnold, B.; Escriva-Bou, A.; Gray, B.; Green, S.; Harter, T.; Howitt, R.; MacEwan, D.; Medellín-Azuara, J.; et al. Water Stress and a Changing San Joaquin Valley; Public Policy Institute of California: San Francisco, CA, USA, 2017. [Google Scholar]
- Stewart, J.A.; Butterfield, H.S.; Richmond, J.Q.; Germano, D.J.; Westphal, M.F.; Tennant, E.N.; Sinervo, B. Habitat restoration opportunities, climatic niche contraction, and conservation biogeography in California’s San Joaquin Desert. PLoS ONE 2019, 12, e0210766. [Google Scholar] [CrossRef] [PubMed]
- Butterfield, H.S.; Cameron, D.; Brand, E.; Webb, M.; Forsburg, E.; Kramer, M.; O’Donoghue, E.; Crane, L. Western San Joaquin Valley Least Conflict Solar Assessment; The Nature Conservancy: San Francisco, CA, USA, Unpublished work; 2003. [Google Scholar]
- Almaraz, M.; Bai, E.; Wang, C.; Trousdell, J.; Conley, S.; Faloona, I.; Houlton, B.Z. Agriculture Is a major source of NOx pollution in California. Sci. Adv. 2018, 4, eaao3477. [Google Scholar] [CrossRef] [PubMed]
- Dogrul, E.C.; Schmid, W.; Hanson, R.T.; Kadir, T.; Chung, F. Integrated Water Flow Model and Modflow-Farm Process: A Comparison of Theory, Approaches, and Features of Two Integrated Hydrologic Models; Technical Information Record; California Department of Water Resources: Sacramento, CA, USA, 2011.
- Schmid, W.; Dogrul, E.C.; Hanson, R.T.; Kadir, T.; Chung, F. Comparison of Simulations of Land-use Specific Water Demand and Irrigation Water Supply by MF-FMP and IWFM; Technical Information Record; California Department of Water Resources: Sacramento, CA, USA, 2011.
- Brush, C.F.; Dogrul, E.C.; Kadir, T.N. Development and Calibration of the California Central Valley Groundwater-Surface Water Simulation Model (C2VSim); Version 3.02-CG; Bay-Delta Office, California Department of Water Resources: Sacramento, CA, USA, 2013.
- Maples, S.; Fogg, G.E.; Foglia, L.; Harter, T. Evaluating Groundwater Budget Estimates in an Agriculturally-Intensive Alluvial Aquifer System—Effects of Scale, Complexity, and Data Availability. In Proceedings of the AGU Fall Meeting, San Francisco, CA, USA, 9–13 December 2019. [Google Scholar]
- Maples, S. Simulating Recharge Processes and Evaluating Groundwater Budget Estimates in California’s Central Valley Aquifer System. Ph.D. Thesis, University of California, Davis, CA, USA, 2019. [Google Scholar]
- Bastiaanssen, W.G.M.; Menenti, M.; Feddes, R.A.; Holtslag, A.A.M. A remote 660 sensing surface energy balance algorithm for land (SEBAL). 1. Formulation. J. Hydrol. 1998, 212, 198–212. [Google Scholar] [CrossRef]
- Allen, R.G.; Morton, C.; Kamble, B.; Kilic, A.; Huntington, J.; Thau, D.; Gorelick, S.; Erickson, T.; Moore, R.; Trezza, R.; et al. EEFlux: A Landsat-Based Evapotranspiration Mapping Tool on the Google Earth Engine. Emerging Technologies for Sustainable; Conference Proceedings; American Society of Agricultural and Biological Engineers: St Joseph, MI, USA, 2015. [Google Scholar]
- Hoffman, G.J. Drainage Required to Manage Salinity. J. Irrig. Drain. Eng. 1985, 111, 199–206. [Google Scholar] [CrossRef]
- Hoffman, G.J. Salt Tolerance of Crops in the Southern Sacramento-San Joaquin Delta; Prepared on Behalf of the California Environmental Protection Agency, State Water Resources Control Board, Division of Water Rights; Final Report; California Environmental Protection Agency: Sacramento, CA, USA, 2010.
- Hoffman, G.J.; Van Genuchten, M.T. Water management for salinity control. In Limitations to Efficient Water Use in Crop Production; Taylor, H., Jordan, W., Sinclair, T., Eds.; American Society of Agronomy: Madison, WI, USA, 1983; pp. 73–85. [Google Scholar]
- Hoffman, G.J.; Rhoades, J.D.; Letey, J.; Sheng, F. Salinity management. In Management of Farm Irrigation Systems; Hoffman, G.J., Howell, T.A., Solomon, K.H., Eds.; American Society of Agricultural Engineers: St. Joseph, MI, USA, 1990; pp. 667–715. [Google Scholar]
- San Joaquin Valley Drainage Program. A Management Plan for Agricultural Subsurface Drainage and Related Problems on the Westside San Joaquin Valley; Final Report, September 1990; San Joaquin Valley Drainage Program: Sacramento, CA. USA, 1990. [Google Scholar]
- Grismer, M.E.; Gates, T.K. Hydrologic Aspects of Saline Water Table Management in Regional Shallow Aquifers. In The Economics and Management of Water and Drainage in Agriculture; Dinar, A., Zilberman, D., Eds.; Springer: Boston, MA, USA, 1991; ISBN 978-1-4615-4028-1. [Google Scholar]
- National Research Council. Irrigation-Induced Water Quality Problems. What Can Be Learned from the San Joaquin Valley Experience? National Academy Press: Washington, DC, USA, 1989. [Google Scholar]
- Orlob, G.T. San Joaquin salt balance: Future prospects and possible solutions. In The Economics and Management of Water and Drainage in Agriculture; Dinar, A., Zilberman, D., Eds.; Kluwer Publishing Co.: Alphen aan den Rijn, The Netherlands, 1991; pp. 143–167. [Google Scholar]
- Kratzer, C.; Grober, L. San Joaquin River salinity: 1991 Projections Compared to 1977. Calif. Agric. 1991, 45, 24–27. [Google Scholar] [CrossRef][Green Version]
- Kratzer, C.R.; Pickett, P.J.; Rashmawi, E.A.; Cross, C.L.; Bergeron, K.D. An Input Output Model of the San Joaquin River from the Lander Avenue Bridge to the Airport Way Bridge; Appendix C of the California State Water Resources Control Board; Technical Committee Report on Regulation of Agricultural Drainage to the San Joaquin River; California State Water Resources Control Board: Sacramento, CA, USA, 1987; 173p.
- Burt, C.M. On Farm Irrigation Management—The Shift from Art to Science. In Proceedings of the Irrigation Association of Australia 1998 Conference, Brisbane, Australia, 19–21 May 1998. [Google Scholar]
- Burt, C.M.; Clemmens, A.J.; Strelkoff, T.S.; Solomon, K.H.; Bliesner, R.D.; Hardy, L.A.; Howell, T.A.; Eisenhauer, D.E. Irrigation Performance Measures—Efficiency and Uniformity. J. Irrig. Drain. Eng. 1997, 123, 423–442. [Google Scholar] [CrossRef]
- Hatchett, S.A.; Quinn, N.W.T.; Horner, G.L.; Howitt, R.E. Drainage Economics Model to Evaluate Policy Options for Managing Selenium Contaminated Drainage. Toxic Substances in Agricultural water Supply and Drainage—An International Perspective. In Proceedings of the International Committee on Irrigation and Drainage, Ottawa, ON, Canada, 8–9 June 1989. [Google Scholar]
- Quinn, N.W.T. Overview of the Use of the Westside Agricultural Drainage Economics Model (WADE) for Plan Evaluation; Technical Information Record; San Joaquin Valley Drainage Program: Sacramento, CA, USA, 1990. [Google Scholar]
- Belitz, K.R.; Heimes, F.J. Character and Evolution of the Ground-Water Flow System in the Central Part of the Western San Joaquin Valley, California; Water Supply Paper; No.2348; US Geological Survey: Reston, VA, USA, 1990; p. 28.
- Letey, J.; Knapp, K. Crop-Water Production Functions under Saline Conditions. In Agricultural Salinity Assessment and Management; ASCE Manuals and Reports on Engineering Practice; No. 71; Tanji, K.K., Ed.; American Society of Civil Engineers: Reston, VA, USA, 1990; pp. 305–326. [Google Scholar]
- Burt, C.M.; Walker, R.E.; Canessa, P.; Robison, K. Irrigation and Drainage in the Grassland Area of the Westside of the San Joaquin Valley; California Polytechnic State University: San Luis Obispo, CA, USA, 1992. [Google Scholar]
- Ayars, J.E.; Hoffman, G.J.; Phene, C.J. Irrigation Systems and Management Alternatives for Reducing Drainage from Irrigated Agriculture. In Proceedings of the Regional Meeting—United States Committee on Irrigation and Drainage (USCID), Sacramento, CA, USA, 15–17 November 1987; pp. 61–69. [Google Scholar]
- Kruse, E.G.; Willardson, L.; Ayars, J. On-farm irrigation and drainage practices. In Agricultural Salinity Assessment and Management; Manuals and Reports of Engineering Practice; No. 71; Tanji, K.K., Ed.; American Society of Civil Engineers: Reston, VA, USA, 1990; pp. 349–371. [Google Scholar]
- Knapp, K.C.; Wichelns, D. Dynamic optimization models for salinity and drainage management. In Agricultural Salinity Assessment and Management; Manuals and Reports of Engineering Practice; No. 71; Tanji, K.K., Ed.; American Society of Civil Engineers: Reston, VA, USA, 1990; pp. 530–548. [Google Scholar]
- Knapp, K.C. Irrigation management and investment under saline limited drainage conditions, 1. Model formulation. Water Resour. Res. 1992, 28, 3085–3090. [Google Scholar] [CrossRef]
- Knapp, K.C. Irrigation management and investment under saline limited drainage conditions, 2. Characterization of optimal decision rules. Water Resour. Res. 1992, 28, 3091–3097. [Google Scholar] [CrossRef]
- Knapp, K.C. Irrigation management and investment under saline limited drainage conditions, 3. Policy analysis and extensions. Water Resour. Res. 1992, 28, 3099–3109. [Google Scholar] [CrossRef]
- Dinar, A.; Aillery, M.D.; Moore, M.R. A dynamic model of soil salinity and drainage generation in irrigated agriculture: A framework for analysis. Water Resour. Res. 1993, 29, 1527–1537. [Google Scholar] [CrossRef]
- Dinar, A.; Zilberman, D. (Eds.) The Economics and Management of Water and Drainage in Agriculture; Springer: Boston, MA, USA, 1991; ISBN 978-1-4615-4028-1. [Google Scholar]
- Carlson, G.A.; Zilberman, D.; Miranowski, J.A. (Eds.) Agricultural and Environmental Resource Economics; Oxford University Press: New York, NY, USA, 1993. [Google Scholar]
- Casey, F.; Schmitz, A.; Swinton, S.; Zilberman, D. Flexible Incentives for the Adoption of Environmental Technologies in Agriculture; Kluwer Academic Publishers: Norwell, MA, USA, 1999. [Google Scholar]
- Quinn, N.W.T.; Brekke, L.D.; Miller, N.; Heinzer, T.; Hidalgo, H.; Dracup, J.A. Model Integration For Assessing Future Hydroclimate Impacts on Water Resources, Agricultural Production and Environmental Quality in the SJRB, California. Environ. Model. Softw. 2004, 19, 305–316. [Google Scholar] [CrossRef]
- California Environmental Protection Agency. Total Maximum Daily Load for Salinity and Boron in the Lower San Joaquin River; Staff report by the California Regional Water Quality Control Board, Central Valley Region; California Environmental Protection Agency: Sacramento, CA, USA, 2002.
- Herr, J. Watershed Analysis Risk Management Framework (WARMF); User Guide and Documentation of the Graphical User Interface; Systech Water Resources Inc.: San Ramon, CA, USA, 2017. [Google Scholar]
- California Environmental Protection Agency. Total Maximum Daily Load for Salinity and Boron in the Lower San Joaquin River; Staff report by the Regional Water Quality Control Board, Central Valley Region; California Environmental Protection Agency: Sacramento, CA, USA, 2004.
- Central Valley Regional Water Quality Control Board (CVWB). Amendments to the Water Quality Control Plan for the Sacramento River and San Joaquin River Basin; Draft Final Staff Report and Technical TMDL Report; Central Valley Regional Water Quality Control Board: Sacramento, CA, USA, 2018.
- Brownell, J. Schedule of Potential Annual Penalties. Unpublished work. 2013. [Google Scholar]
- Quinn, N.W.T.; Karkoski, J. Real-Time Management of Water Quality in the San Joaquin River Basin, California; American Water Resources Association: Middleburg, VA, USA, 1998; Volume 34. [Google Scholar]
- Quinn, N.W.T.; Hanna, W.M. A decision support system for adaptive real-time management of seasonal wetlands in California. Environ. Model. Softw. 2003, 18, 503–511. [Google Scholar] [CrossRef]
- Chen, C.W.; Herr, J.; Weintraub, L.H.Z. Watershed Analysis Risk Management Framework: Update One: A Decision Support System for Watershed Analysis and Total Maximum Daily Load Calculation, Allocation, and Implementation; EPRI: Palo Alto, CA, USA, 2001. [Google Scholar]
- Herr, J.; Chen, C.W.; Van Werkhoven, K. Final Report for Task 6 Modeling of the San Joaquin River. CALFED Project ERP-02D-P63. Monitoring and Investigations for the San Joaquin River and Tributaries Related to Dissolved Oxygen; Systech Water Resources Inc.: Walnut Creek, CA, USA, 2008. [Google Scholar]
- Quinn, N.W.T.; Hughes, B.; Osti, A.; Herr, J.; Wang, J. Real-time, web-based decision support for stakeholder implementation of basin-scale salinity management. In Environmental Software Systems, Computer Science for Environmental Protection, Proceedings of the International Symposium on Environmental Software Systems, Zadar, Croatia, 10–12 May 2017; IFIP AICT 507; Hrebicek, J., Denzer, R., Schimak, G., Pitner, T., Eds.; Springer: Berlin/Heidelberg, Germany, 2018. [Google Scholar]
- Lu, J.; Wang, J.; Raley, E.; Quinn, N.W.T.; Kabir, J. An Alternative Approach to Salinity Forecasting in the Lower San Joaquin River. In Modern Environmental Science and Engineering; Academic Star Publishlishing Company: New York, NY, USA, 2019; ISSN 2333-2581. [Google Scholar]
- Quinn, N.W.T. Contrasts in the use of information technology for real-time salinity management in the San Joaquin Basin, California, USA and Hunter River Basin, New South Wales, Australia. Agric. Water Manag. 2011, 98, 930–940. [Google Scholar] [CrossRef]
- Hunter River Salinity Trading Scheme (HRSTS) in New South Wales, Australia. Available online: https://apps.epa.nsw.gov.au/HRSTSPublicApp/Default.aspx (accessed on 25 May 2020).
- U.S. Bureau of Reclamation. San Luis Drainage Feature Re-Evaluation; Record of Decision and Final Environmental Impact Statement; U.S. Bureau of Reclamation: Washington, DC, USA, 2007.
- U.S. Bureau of Reclamation. Grassland Bypass Project, 2010–2019. Record of Decision and Final Environmental Impact Statement/Environmental Impact Report; Entrix for Mid-Pacific Region, South-Central California Area Office: Fresno, CA, USA, 2009.
- U.S. Bureau of Reclamation. Grassland Bypass Project 2008 Annual Report; Mid-Pacific Region, South-Central California Area Office: Fresno, CA, USA, 2009.
- Caswell, M.F.; Zilberman, D. “The effects of well depth and land quality on the choice of irrigation technology”. Am. J. Agric. Econ. 1986, 68, 798–811. [Google Scholar] [CrossRef]
- Zilberman, D.; Khanna, M.; Lipper, L. Economics of New Technologies for Sustainable Agriculture. Aust. J. Agric. Resour. Econ. 1997, 41, 63–80. [Google Scholar] [CrossRef]
- Singh, A.; Quinn, N.W.T.; Benes, S.E.; Cassel, F. Policy-driven sustainable saline drainage disposal and forage production in the western San Joaquin Valley of California. Sustainability 2020, submitted. [Google Scholar]


| Potential Salt Discharge Load Exceedance Fees by sub-area (2001–2012) | |||||
|---|---|---|---|---|---|
| Sub-area | NWS | GL | SJR | EVF | |
| Days exceeded by period | October | 0 | 0 | 0 | 0 |
| November | 90 | 60 | 0 | 0 | |
| December | 124 | 248 | 0 | 0 | |
| January | 186 | 0 | 310 | 0 | |
| February | 28 | 196 | 0 | 0 | |
| March | 0 | 279 | 0 | 0 | |
| April | 28 | 56 | 42 | 14 | |
| VAMP | 0 | 0 | 30 | 30 | |
| May | 0 | 0 | 51 | 17 | |
| June | 30 | 30 | 210 | 90 | |
| July | 0 | 0 | 248 | 91 | |
| August | 0 | 0 | 248 | 31 | |
| September | 0 | 0 | 0 | 0 | |
| Total days of exceedances | 486 | 869 | 1139 | 273 | |
| USD 5000 per day penalty | USD 5000 | USD 5000 | USD 5000 | USD 5000 | |
| Total penalties | USD 2,430,000 | USD 4,345,000 | USD 5,695,000 | USD 1,365,000 | |
| Years calculated | 8 | 10 | 10 | 3 | |
| Average penalty per year | USD 303,750 | USD 434,500 | USD 569,500 | USD 455,000 | |
| Sub-area acreage | 118,000 | 353,000 | 187,000 | 201,000 | |
| Average penalty per acre | USD 2.57 | USD 1.23 | USD 3.05 | USD 2.26 | |
© 2020 by the author. Licensee MDPI, Basel, Switzerland. This article is an open access article distributed under the terms and conditions of the Creative Commons Attribution (CC BY) license (http://creativecommons.org/licenses/by/4.0/).
Share and Cite
Quinn, N.W.T. Policy Innovation and Governance for Irrigation Sustainability in the Arid, Saline San Joaquin River Basin. Sustainability 2020, 12, 4733. https://doi.org/10.3390/su12114733
Quinn NWT. Policy Innovation and Governance for Irrigation Sustainability in the Arid, Saline San Joaquin River Basin. Sustainability. 2020; 12(11):4733. https://doi.org/10.3390/su12114733
Chicago/Turabian StyleQuinn, Nigel W. T. 2020. "Policy Innovation and Governance for Irrigation Sustainability in the Arid, Saline San Joaquin River Basin" Sustainability 12, no. 11: 4733. https://doi.org/10.3390/su12114733
APA StyleQuinn, N. W. T. (2020). Policy Innovation and Governance for Irrigation Sustainability in the Arid, Saline San Joaquin River Basin. Sustainability, 12(11), 4733. https://doi.org/10.3390/su12114733