1. Introduction
Today, countries around the world are striving to achieve sustainable prosperity in the future. Such effort at the country level represents environmental performance. Following Grossman and Krueger’s proposal of the U-shaped relationship between per-capita income and environmental quality based on reduced-form estimation [
1], researchers have long examined the bivariate relationship between income and environmental performance. In this paper, we aim to add to the literature by taking a disaggregated approach to test the cross-country relationships between the national environmental performance and sources of income, such as physical capital stock and human capital per capita. Specifically, we attempt to identify the effects of each income source on environmental performance by applying the instrumental variable method, which helps to minimize biases that may arise from omitted variables or measurement errors. We pay particular attention to human capital, as it is malleable to government education policy, citizens’ yearning for learning, and social activists’ dedicated effort.
A simple linear regression of environmental performance on human capital can lead to biased estimates due to omitted variables. For example, previous studies suggested that political institutions [
2,
3] and social capital [
4,
5,
6,
7], both of which are likely to be correlated with human capital, play an important role in determining the national environmental performance. Furthermore, the existing literature indicates that the environmental performance can be affected by institutions [
8], politics [
9], government effectiveness [
10], corruption [
11], free trade [
12], financial openness and liberalization [
13], and inequality [
14]. Although we controlled for democratic and social capital, failing to adjust for the other non-economic factors that are positively correlated with human capital can cause the true effect of human capital on environmental performance to be overstated [
15].
Furthermore, unlike physical capital stock, it is far from straightforward to measure the level of human capital precisely and consistently across countries. If the human capital index used for data analysis has measurement errors, the estimated coefficient can understate the true effects of human capital on environmental performance due to an attenuation bias [
16]. To address these issues and identify the causal effects of human capital on environmental performance, we conduct a Two-Stage Least Square (2SLS) estimation using historical elementary school enrollment rates as an instrument for human capital today.
Our results show that human capital is indeed effective in improving a country’s environmental performance. The effect of human capital on environmental performance, estimated by using the 1920 primary school enrollment rates as an instrument for the current level of human capital, is far greater in magnitude than those estimated by ordinary least squares regressions. These results indicate that measurement errors in the human capital index used for data analysis may have led to an attenuation bias. Our findings are consistent with previous studies that proposed that greater human capital leads to a better awareness of and compliance with environmental regulations, thus leading to an improvement in environmental performance [
17,
18,
19,
20].
2. Literature
Researchers have long been interested in the functional form of the bivariate relationship between the national output and a pollutant to test the hypothesis of the Environmental Kuznets Curve (EKC hereafter) [
1,
21,
22]. The studies implicitly presumed that the environmental performance, or the pollution level, is determined by the national output and its components [
23]. These studies often conducted cross-country comparisons to check the existence of the EKC and to test theories to explain it [
24].
A strand of research has focused on the role of various factors that affect the national output in determining the environmental performance at the national, provincial, and firm levels. An interesting group of such factors are variables related to institutions, social capital, and politics. For example, Farzin and Bond provided empirical evidence that democracy leads to reducing pollution [
2], which is in the same line with Ward’s analysis about liberal democracy and sustainability [
3]. A series of empirical studies based on the cross-country analysis showed that social capital measured by trust or civic and public capital is closely associated with environmental performance [
4,
5], as was confirmed by studies that used a country’s or region’s data [
6,
7]. Showing that the environmental performance varies significantly among countries at similar income levels depending on institutional characteristics relevant to the economic system and legal structure, Esty and Porter suggested that various institutional, social, and economic factors matter for environmental performance [
8]. Apostoaie and Maxim extended the analysis to include political factors as explanatory variables and found that they are associated with the Environmental Performance Index using Ordinary Least Squares (OLS) regressions of countries in the European Union [
9].
Empirical studies using cross-country data have also noticed a significant role of various factors, such as government effectiveness, corruption, free trade, financial liberalization, and inequality, in promoting environmental performance. Basrija and Handoyo reported that measures of government accountability, political stability, government effectiveness, and regulatory quality are significantly correlated with national environmental performance [
10]. Lisciandra and Migliardo found, from a panel data analysis, that corruption had a negative impact on the Environmental Performance Index [
11]. Frankel and Rose used an instrumental variable method to show that trade can lead to pollution reduction [
12]. Tamazian et al. analyzed a panel data set of Brazil, Russia, India, and China, and found an importance of financial openness and liberalization for reducing CO
2 emissions [
13]. Morse showed that income inequality can also be related to environmental performance [
14].
A series of research studying the determinants of environmental performance at the firm level found similar stories. For example, Al-Tuwaijri et al. studied the relationship between environmental disclosure, environmental performance, and economic performance by applying a simultaneous equation model with firm-level data, and they found a significant link between environmental and economic performance [
25]. Using a sample of 191 US firms, Clarkson et al. also found a positive correlation between environmental performance and discretionary environmental disclosures [
26].
Human capital, which has long been regarded as an essential engine of economic growth [
27,
28], has been a subject of research on the determinants of national environmental performance. For example, Hettige et al.’s analysis of the plant-level data from Bangladesh, India, Indonesia, and Thailand suggested that education is a significant determinant of the informal regulatory outcomes of pollution abatement [
18]. Lan and Munro also showed the significance of human capital in environmental performance by analyzing firm-level data in China [
20]. In a province-level analysis on China, Lan et al. found that an increase in foreign direct investment exacerbated pollution in provinces with a low level of human capital, whereas it abated pollution in provinces with a high level of human capital [
19].
Unlike the literature on the EKC, previous studies about the effect of human capital on national environmental performance regarded environmental performance as an explicitly chosen outcome. However, they also often neglected the potential role of other inputs, such as physical capital, which may embody the pollution-reduction technology. Additionally, few studies have examined the relative contributions of the production functions.
We contribute to the literature by testing the cross-country relationship between human capital and environmental performance after controlling for other important input factors. Such factors include physical, social, and democratic capital, and endowments. We also examine human capital’s effects on a range of the various measures of environmental performance rather than leaning on a specific pollutant or single aggregate measure. In terms of methodology, we utilize a novel instrument to address issues regarding potentially endogenous human capital.
3. Conceptual Framework and Methodology
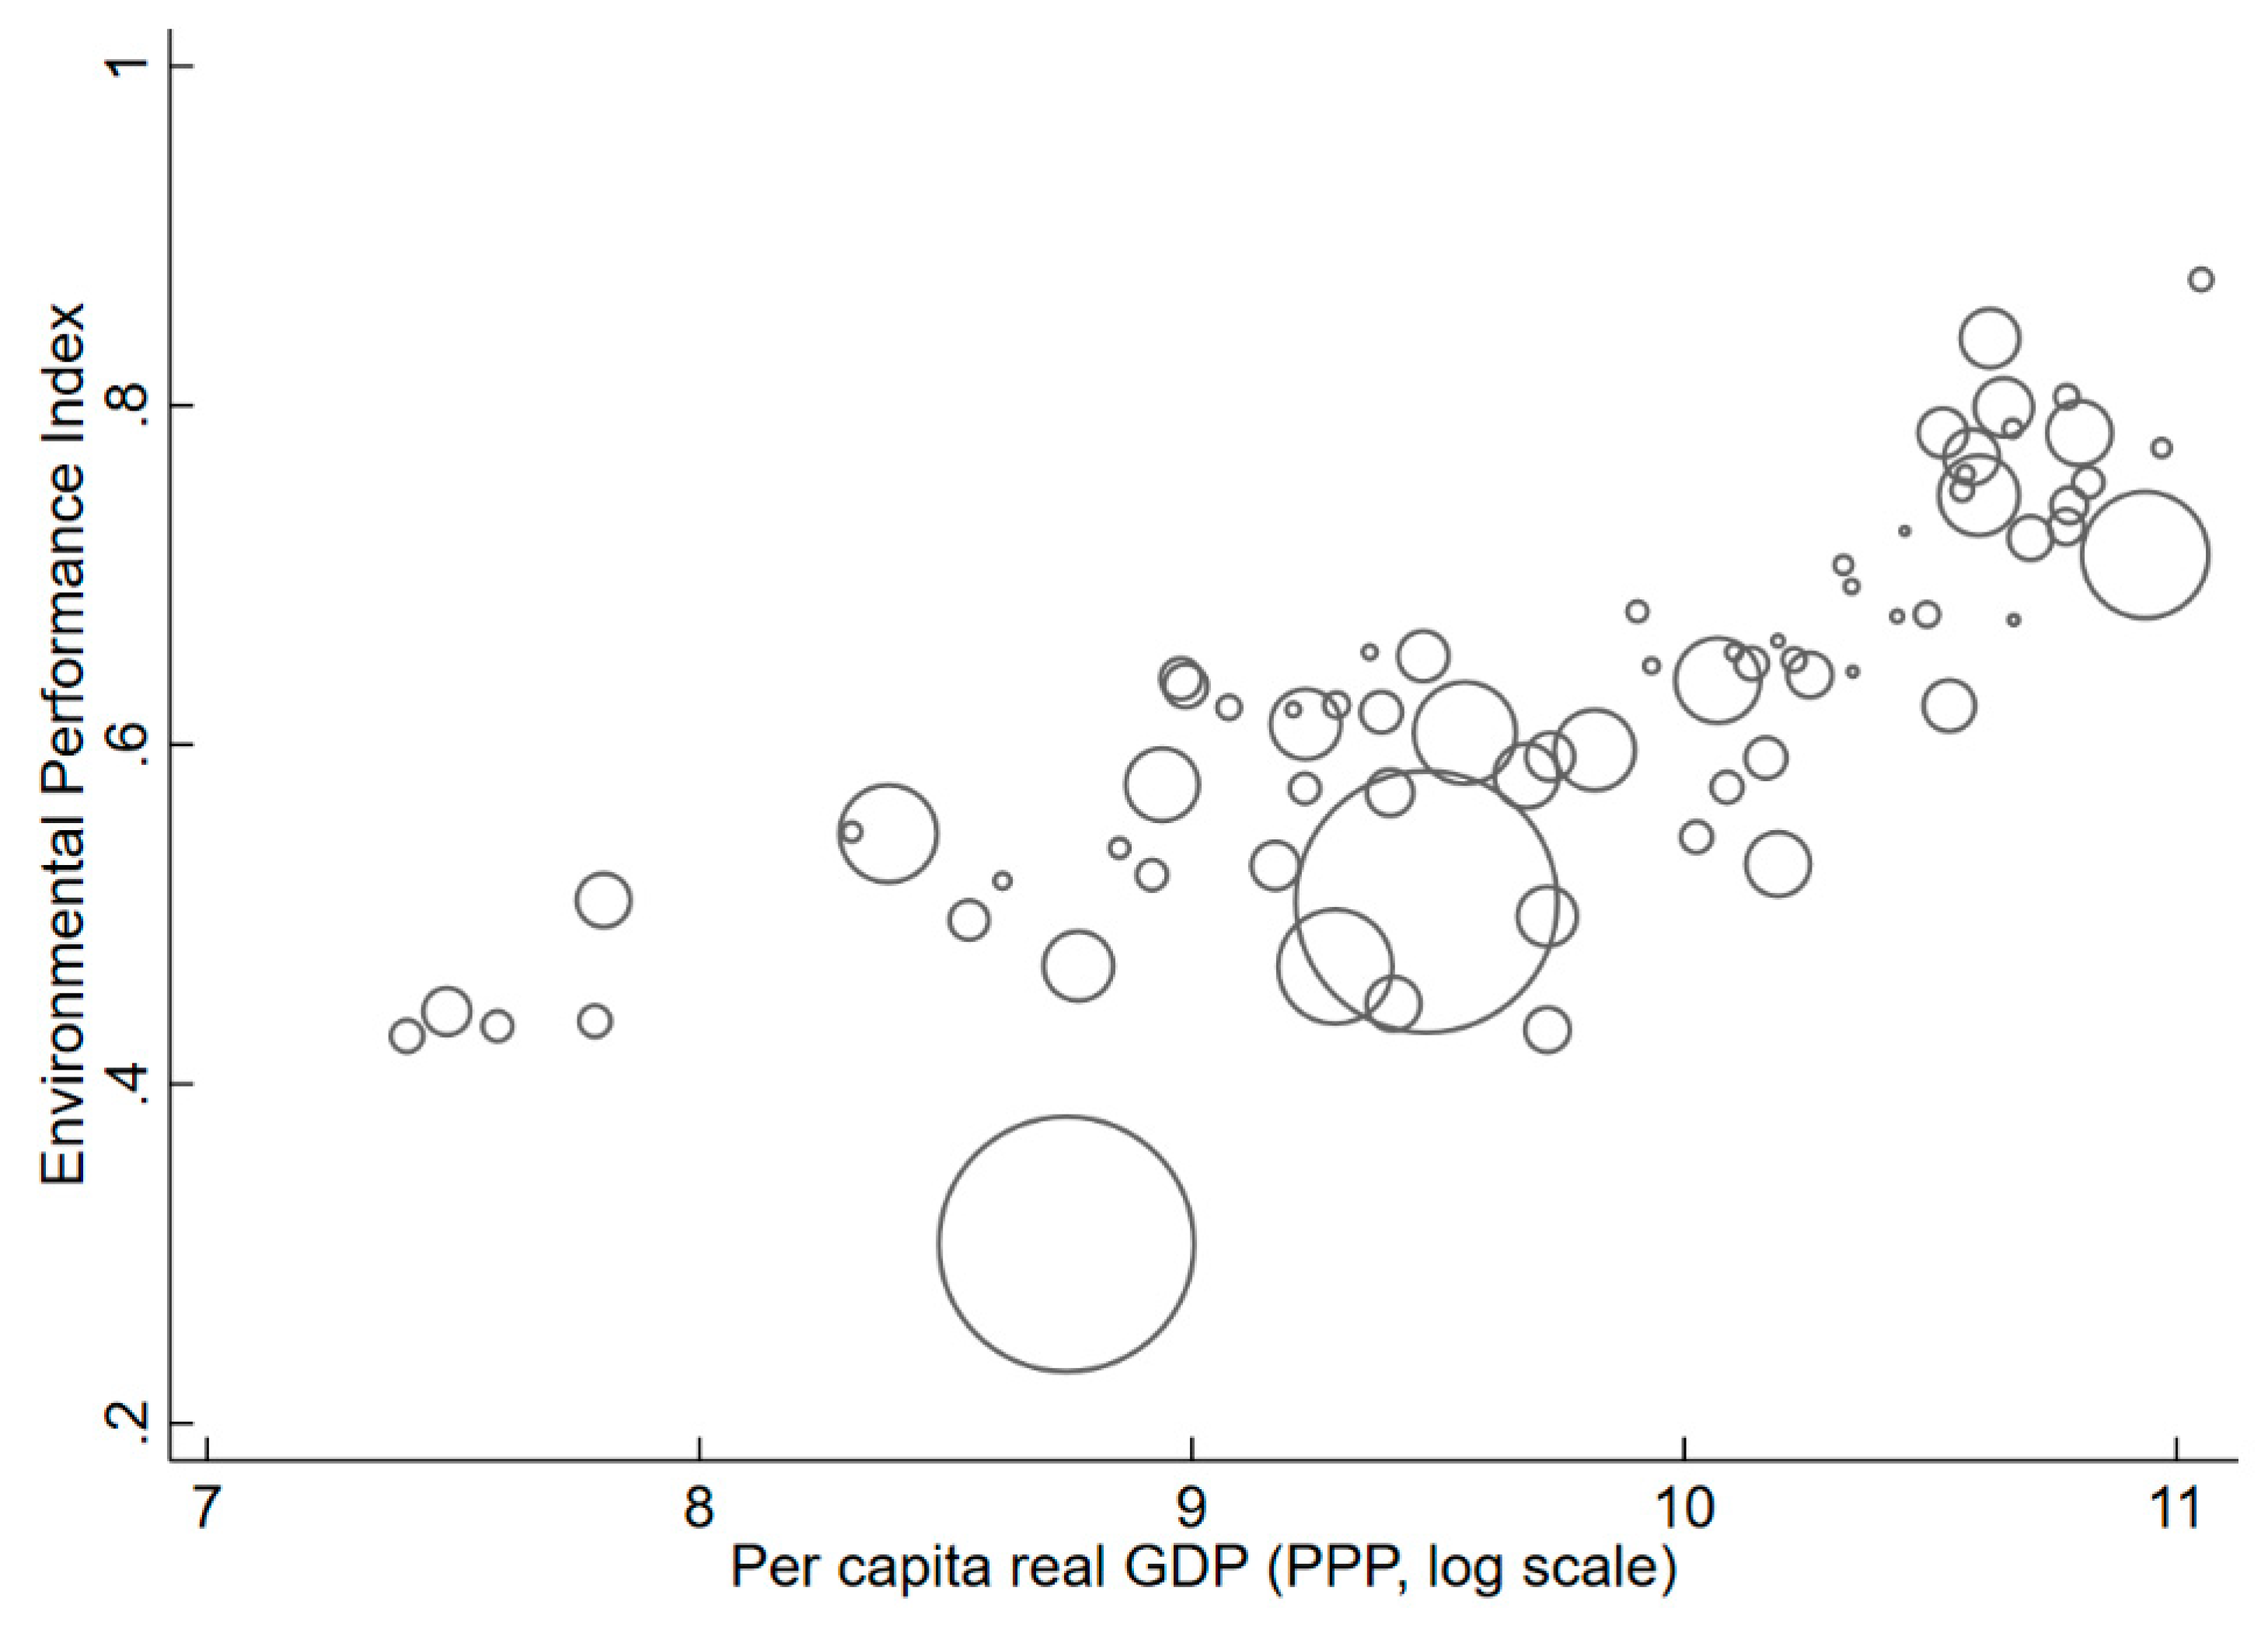
We began by presenting the cross-country association between per capita output and environmental performance measured by the Environmental Performance Index [
29].
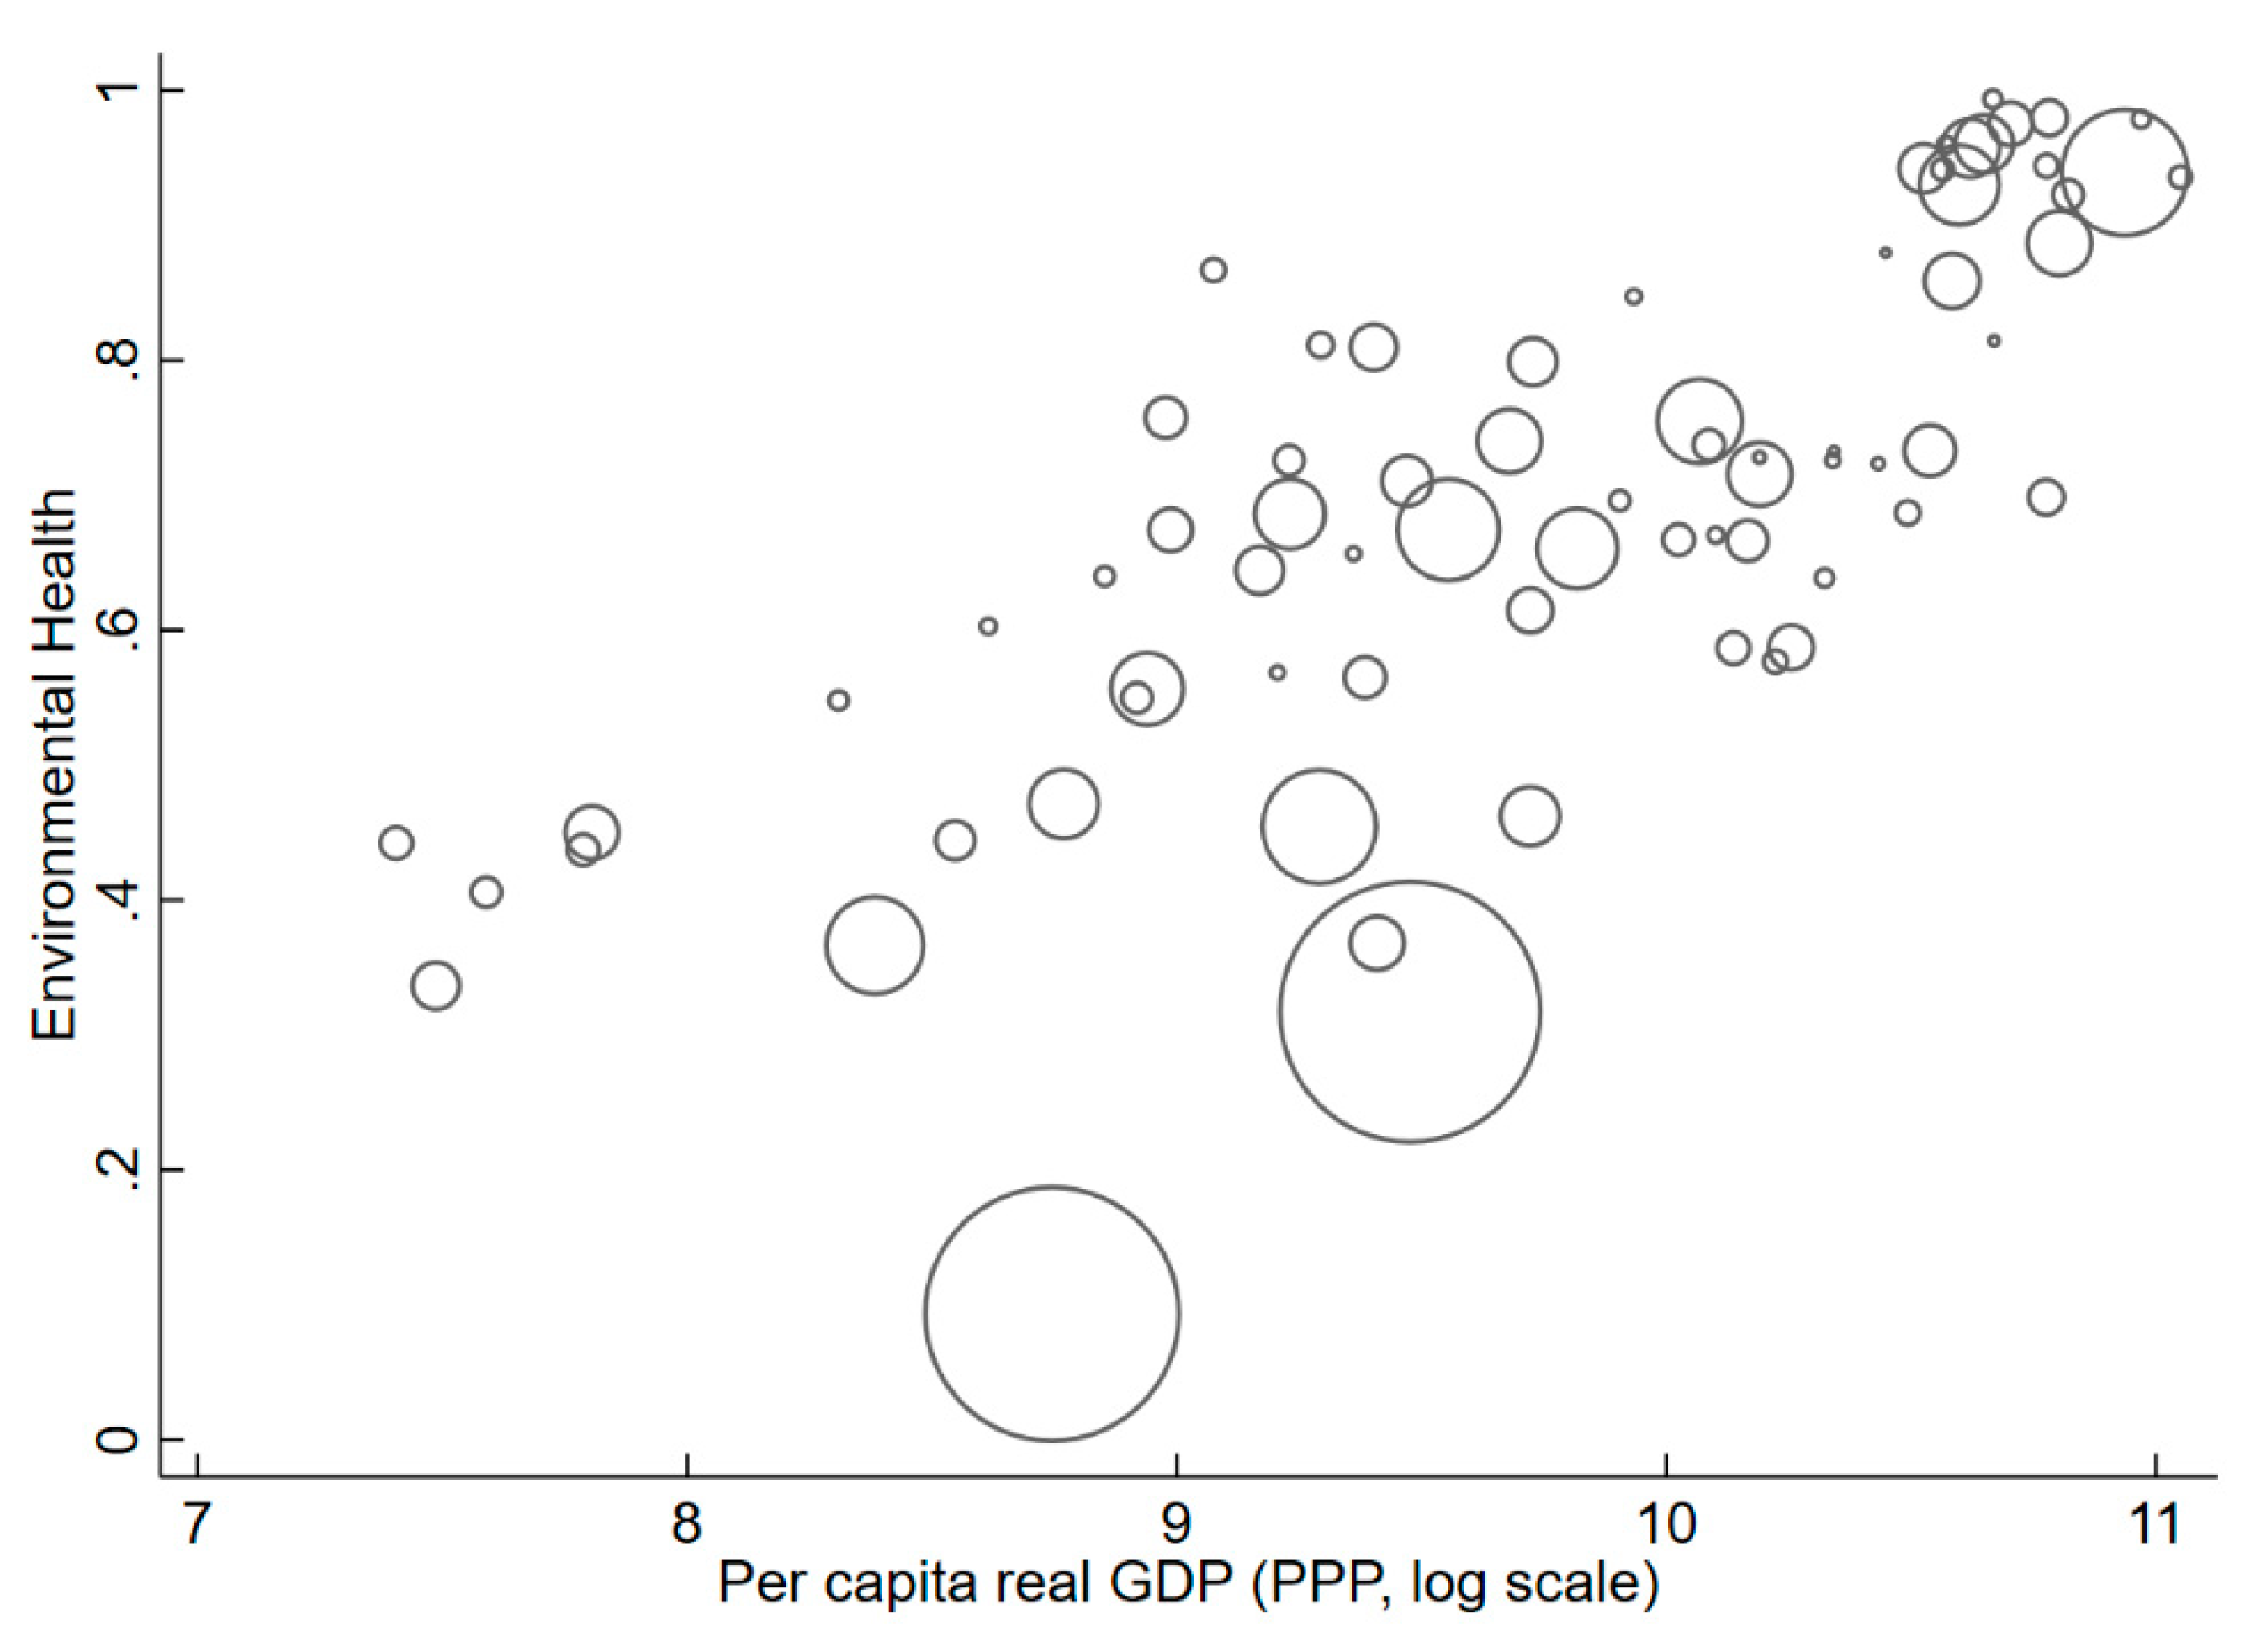
Figure 1 shows that the national environmental performance measured by the Environmental Performance Index (EPI hereafter) is closely and positively associated with per capita output, indicating that the determinants of per capita GDP are good candidates for explaining a country’s environmental performance. The positive association between GDP per capita and environmental performance is also found for the components of the EPI, the Environmental Health Index (EHI hereafter), and the Ecosystem Vitality Index (EVI hereafter), as shown in
Figure A1 and
Figure A2 in
Appendix A, respectively.
Based on the positive cross-country association between environmental performance and per capita output, we modeled environmental performance as a function of per capita capital stock and human capital, both of which are the fundamental inputs determining per capita income. To extend the analogy to the aggregate production function, we consider the democratic capital and social capital as additional inputs generating national environmental performance, in line with recent studies on economic growth that proposes democratic and social capital as critical factors explaining cross-country variations in economic growth [
31,
32,
33].
Based on the analogy to the production function, we can formally write the production of national environmental performance as follows:
where
denotes the environmental performance,
the environmental technology available to all countries,
the physical capital which may embody the country-specific technology,
the population,
the human capital stock, and
the natural endowments. For
, where
,
,
, we can rewrite the above equation in per capita terms as
By taking the natural logarithm of the above equation, we have
where
represents
, and
,
, and
denote the inputs divided by
. In this way, we synthesize various factors that have been shown to affect environmental performance in a single framework, which can be summarized as follows:
where
denotes one of the measures of national environmental performance;
denotes the average level of human capital;
denotes the other determinants of environmental performance, including per capita physical capital stock, democratic capital, social capital, and per capita natural endowment; and
denotes the error term. We controlled for the natural log of the population and land area to proxy the log per capital natural endowment as they can be relevant determinants of some of the items measuring environmental health and ecosystem vitality. In sum, this aggregate production approach allows us to test the effect of human capital on environmental performance, controlling for other determinants, such as physical, democratic, and social capital, and endowment.
Most previous cross-country studies relied on the Ordinary Least Squares (OLS hereafter) estimation of the multivariate regression models to analyze the association between multiple factors and national environmental performance. However, a simple OLS regression may lead to biased estimates if an independent variable is endogenous. For example, a higher level of human capital stock may be positively correlated with compliance with environmental regulation, improvement of pollution abatement technology, and greater awareness of environmental issues, all of which lead to a higher level of environmental performance but are difficult to measure and control in the regressions [
17,
18,
19,
20]. Moreover, we cannot rule out the possibility of reverse causality in which a country’s environmental performance may affect human capital through the political, economic, and social structure. In either case, the OLS regression of environmental performance on human capital will overestimate the effect of human capital on environmental performance.
On the other hand, human capital is more likely to be subject to measurement errors compared to physical capital stock. Although we employed the human capital index, which is designed to capture both the quality and quantity of human capital, this measure may not fully reflect variations in educational content and institutions across nations. The measurement errors in the human capital index can lead to an attenuation bias in the OLS estimates [
16].
To address the potential problems of endogeneity and measurement errors regarding human capital, we used the instrumental variable method to identify the causal impact of human capital on environmental performance [
15]. The instrumental variable estimation has also been used in a handful of studies to identify the causal effect of other factors on environmental performance. For example, Frankel and Rose used an aggregate of the predicted values of the bilateral gravity model on trade as an instrument for a country’s trade volume to determine the causal impact of international trade on pollution emission [
12]. Lan and Munro used the industry-location share of highly educated employees as an instrument for a firm’s share of college-educated workers [
20].
We extended the literature by analyzing country-level data using the historical 1920 primary school enrollment rate as a novel instrument for the human capital index. Our use of the historical enrollment rate as an instrumental variable for the current human capital is inspired by Tabellini’s research that used the 19th century literacy rate and political institution as an instrument for current cultural traits of a country [
34]. We selected the year 1920 from 1870–1940 decennial source data to keep it dated far enough back and limit the generation of missing values [
35]. The historical primary school enrollment rate meets the conditions for a valid instrument. The primary school enrollment rates a century ago may be exogenous for environmental performances in the sense that it does not have a direct link to the current environmental performance except the channel through human capital accumulation. Furthermore, the primary school enrollment rate in 1920 is closely associated with the human capital index in 2018. We formally tested this and present the results in
Section 4.
If our instrument is legitimate, the difference between the Instrumental Variable (IV hereafter) and OLS estimates can shed light on the sources and size of bias in the OLS estimates. If the IV regression result is similar to that of the OLS regression, we can conclude that the OLS regression is not critically biased. If the IV estimates for the effects of human capital are greater than the OLS estimates, this would indicate that the OLS estimates understate the true effects of human capital on environmental performance, possibly due to measurement errors. To the contrary, if the IV estimates are smaller than the OLS estimates, this would suggest that there can be omitted variable bias or reverse causality, either of which can cause the true effects of human capital on environmental performance to be overstated.
We estimated Equation (4) using the REG command in STATA for the OLS estimates and the IVREGRESS 2SLS command in STATA for the 2SLS estimates. We adjusted for the heteroscedasticity of errors using the ROBUST command in STATA.
4. Data
We constructed a data set containing variables indicating a country’s environmental performance, as well as economic, social, political, and natural characteristics. The definition and source of the variables are listed in
Table A1 in
Appendix A. Our sample consists of 72 countries across the world. From the initial sample of 180 countries with the EPI in 2018, we excluded 108 countries that have missing data for the regressors, in particular the primary school enrollment rate in 1920, with a sample consisting of 72 countries. Although the number of the countries in the sample is limited due to data availability, our sample still covers countries across all major continents. The countries in the analytic sample are listed in
Table A2 in
Appendix A.
We measured the national environmental performance by the EPI, which is a composite index that measures a country’s performance of environmental activities and has been constructed for 180 countries [
36]. Among alternative measures of environmental performance, the EPI is one of the most widely used measures, particularly for cross-country analyses. For example, Gallego-Alvarez et al. showed from a multivariate regression analysis of 149 countries that GDP, adult literacy, and the control of corruption are significant determinants of the 2008 EPI [
37]. Mavragani et al. ran an ordinary linear regression of the 2014 EPI on country-level characteristics and found that the environmental performance is significantly associated with GDP, trade openness, and governance effectiveness [
38]. Popescu et al. studied the relationship among the EPI, Human Development Index, Global Competitiveness Index, and GDP [
39]. Arbolino et al. analyzed 15 European countries and found a significant association between economic factors and the EPI [
40]. Rodríguez-Martínez et al. found that lower corruption leads to a higher EPI [
41]. Zimmermann and Graziano used the EPI to study how environmental performance is associated with social performance, as captured by income inequality and the unemployment rate [
42]. We extended this literature by focusing on human capital and utilizing an IV method.
The key dependent variable of our research was the 2018 EPI, which comprises 24 performance indicators across ten issue categories of air quality, water and sanitation, heavy metals, biodiversity and habitat, forests, fisheries, climate and energy, air pollution, water resources, and agriculture. The indicators were scored from zero, representing worst performance, to one hundred, indicating best performance, and normalized as zero to one for consistency with the other measures used as covariates. In the issue category level, the score for each issue was calculated by the weighted average of related indicators. Furthermore, the scores of two policy objectives, environmental health and ecosystem vitality, were calculated by the weighted average of corresponding issue-category scores. Finally, the EPI was computed by the sum of 60% of the ecosystem vitality score and 40% of the environmental health score [
29].
To determine how the human capital of a country affects environmental performance, we took an aggregate production function approach. Following the recent development in the literature on economic growth, which explains that a country’s GDP can be determined by physical, democratic, social, and human capital [
31,
32,
33], we modeled a country’s environmental performance as a function of the determinants of the GDP, including human capital, physical capital, democratic capital, and social capital. We also included population and land area in the model as determinants of environmental performance.
Human capital was measured by the 2018 human capital index of the Penn World Table 9.1 [
30], which is a composite index of a country’s average years of schooling estimated by Barro and Lee [
43] and the assumed rate of return to education by Psacharopoulos [
44]. We also used population and per-capita capital stock for 2018 from Penn World Table 9.1. Land area data were from the United Nations’ statistical database [
45]. Population, per-capita capital stock, and land were transformed into a log scale. For democratic capital, we used Persson and Tabellini’s measurement [
33], which considers a country’s historical experience with democracy and the incidence of democracy in the neighboring countries. Social capital was measured by social trust following the literature on social capital [
31], which was calculated using data from the World Value Survey Waves 1–6 [
46].
The averages and standard deviations of the variables are presented in
Table 1. All the variables show wide cross-sectional variation. Most of the variables were available for the 72 countries in the sample, but the environmental performance scores for the forests and fisheries categories were missing for some countries. In the bottom row of
Table 1, the summary statistics of the country-level primary school enrollment rate in 1920 are also reported. We used this variable as an instrument for the current human capital of a country. The historical primary school enrollment data are compiled by Benavot and Riddle [
35].
5. Results and Discussion
Table 2 presents the results from the OLS estimation of Equation (4), along with those from the 2SLS estimation for the aggregate measures of the national environmental performance. The results in column 1 of
Table 2 show the OLS estimates for the EPI, based on Equation (4). They show that per capita capital stock and democratic capital are the only statistically significant predictors of the EPI. The estimated effect of human capital is small in magnitude and statistically insignificant, albeit positive. Columns 2 and 3 in
Table 2 show that the effects of capital stock and democratic capital on the EPI are primarily driven by their effects on the EHI, which captures the environmental quality that is closely related to health, such as air quality (the level of particulates) and water quality (drinking water and sewage). In contrast, human capital is weakly associated with the EVI, which represents the factors that are more closely related to environmental sustainability, such as biodiversity and global warming.
Columns 4 to 6 in
Table 2 present the results from the 2SLS estimation, where the primary school enrollment rate in 1920 was used for an instrument for the potentially endogenous human capital index in 2018. The estimates in column 4 indicate that what matters more for the EPI may be human capital rather than physical capital. The 2SLS estimate for the effect of human capital on the EPI is statistically significant and larger in magnitude than the OLS estimate, whereas the estimated effect of physical capital stock by the IV method becomes much smaller and statistically insignificant. Estimates in columns 5 and 6 of
Table 2 reveal the source of the difference between the OLS and 2SLS estimations. As shown in column 5, the effects of human capital and capital stock on the EHI estimated by the 2SLS regressions are very similar to those by the OLS regressions. The difference in the estimated effects on the EPI between the two methods arises from the EVI equation estimation, reported in column 6, where only human capital reveals positive and statistically significant effects. Because the EVI has a greater weight in determining the EPI than the EHI, the effect of capital stock on the EPI is estimated to be small and statistically insignificant, as in column 4. Unlike human capital and physical capital, democratic capital remains a critical determinant of environmental health, regardless of the estimation method. This suggests that the cumulative experiences of democracy may create a policy environment, in which the government is more responsive to the demand for environmental health. In sum, provided that our instrument is valid, human capital plays a greater role in enhancing ecosystem vitality, whereas per capita capital stock matters more for improving environmental health.
Although the exogeneity of our instrument is not testable, we can test whether our instrument is relevant. The last column of
Table 2 presents the results from the first-stage regression, where the potentially endogenous human capital index in 2018 was regressed on its instrument, the 1920 primary school enrollment rate, along with the other covariates included in the second-stage regressions. The estimated coefficient for the primary school enrollment rate in 1920 shows that our instrument is strongly and significantly associated with the current level of human capital. The F statistic from the first-stage regression is 10.12, which exceeds the conventional threshold of 10 for weak instruments [
47].
Further analysis for each component of the aggregate index may reveal the channels through which human and physical capital can affect environmental health, ecosystem diversity, and overall environmental performance. Several items consist of the EHI and EVI, respectively. The EHI is composed of air quality, water and sanitation, and lead exposure. The EVI comprises biodiversity and habitat, climate and energy, air pollution, water resources, and sustainable agriculture. Forests and fisheries, two items included in the EVI, are excluded from the analysis because some countries have geographic characteristics (i.e., land locked) that necessarily generate missing values.
Table 3 presents the 2SLS estimates for the effects of human, physical, democratic, and social capitals on each item of the EHI. As expected from the results in
Table 2, human capital has statistically insignificant effects on the items of the EHI except lead exposure. The positive and significant effects of human capital on the reduction of lead exposure may be driven by a greater awareness of the harms caused thereby, which is crucial for government regulations and prevention efforts. Human capital can increase such environmental awareness. On the other hand, the positive effect of per capita capital stock on the EHI is largely driven by its effect on water and sanitation, which tends to involve public or private projects requiring a sizable capital investment. Democratic capital is the only statistically significant determinant of air quality, which is measured based on the solid fuel usage of households, average exposure to PM 2.5, and PM 2.5 exceedance [
29]. Democratic capital also enhances water and sanitation, which is measured based on the type of primary toilet used by households, the primary source of water used by households, and the treatment of drinking water. These results suggest that a more democratic government may be more responsive to public demand for better environmental health.
Table 4 presents the 2SLS estimates for each component of national ecosystem diversity. The results show that human capital significantly enhances national biodiversity and habitat as well as environment-friendly agricultural management practices. The biodiversity and habitat scores, calculated based on the marine protected areas, terrestrial biome protection, species protection index, protected area representativeness index, and species habitat index [
29], are positively and significantly associated with human capital, suggesting that citizens’ awareness and cooperation can be more important for maintaining biodiversity and habitat than physical investment and political institutions. Similarly, the agriculture scores capturing the nitrogen management for sustainable agriculture [
29] are also significantly affected by human capital but not by others, reflecting its relevance to individual awareness and compliance. In contrast, the estimates in
Table 4 suggest that higher capital stock can be harmful for preserving biodiversity and habitat, as higher capital stock may imply developments of properties and resorts, which in turn can damage biodiversity and habitat.
As in the case of water and sanitation belonging to environmental health, per capita capital stock is positively and significantly associated with the water resource scores that measure wastewater treatment [
29], indicating that physical capital investment may play a dominant role in improving the drainage system. The results for the climate and energy, as well as air pollution, suggest that the level of greenhouse gasses and pollutants, such as CO
2, methane, and SO
2 emissions, may not be determined linearly by human, physical, democratic, and social capital, respectively.
6. Conclusions
Our novel use of the historical primary school enrollment rate in 1920 as an instrument for the potentially endogenous measure of the current level of human capital allows us to identify the causal link from human capital to environmental performance by addressing the endogeneity issues and measurement errors. The findings from the 2SLS estimation indicate that a higher level of human capital increases the national environmental performance index primarily through enhancing ecosystem vitality, which captures the environmental sustainability more closely, as opposed to environmental health. More specifically, our 2SLS estimation results show that human capital is negatively associated with the level of lead exposure and positively associated with the level of biodiversity and habitat preservation, as well as the level of the sustainable management of nitrogen in agriculture. These results would not be found by the conventional OLS estimation, where all the estimates for the effects of human capital remain small in size and statistically insignificant. Our results also suggest that the widely used measure of human capital may suffer from measurement errors, leading to an attenuation bias in estimating the determinants of national environmental performance.
Our findings from cross-country comparison confirm that human capital enhances environmental sustainability. Although the mechanism through which human capital entails better environmental performance needs further scrutiny, the IV regression results using cross-country data are consistent with the previous findings from the firm-level and within-country studies, suggesting that education and human capital can enhance environmental performance by improving the awareness of and compliance with environmental regulations.
It is also notable that democratic capital is significantly associated with environmental health. The mechanism behind this is unclear as well. However, the finding indicates that environmental health is the outcome of the deliberate choice of the voters of a country at least as much as a byproduct or output generated from the input factors such as capital stock.
Our use of an instrument for potentially endogenous human capital significantly reduces the sample size as the data for the primary school enrollment rate in 1920 are available only for a limited number of countries. This may diminish the statistical power of the test. It is also difficult to figure out how the sample exclusion could bias the estimates, although the sample appears widely dispersed geographically.
Although we addressed the endogeneity and measurement errors regarding human capital, there can be omitted variables that are correlated with the regressors besides human capital, which would bias the estimates. To better identify the true causal impact of each determinant of environmental performance, additional instruments for the other covariates may be warranted, a pursuit we leave for future research.


