Cycling Master Plans in Italy: The I-BIM Feasibility Tool for Cost and Safety Assessments


Abstract
1. Introduction
2. Cycling Urban Planning
I-BIM and Its Infrastructure Applications
- Cp is production cost, and includes the value of the area on which it is built, construction costs, design costs, financial costs, and any advertising promotion costs;
- Cm is the cost for ordinary and extraordinary maintenance, i.e., useful for conservation;
- Cge is the management cost, from energy costs to those necessary for cleaning;
- Vr is the residual value or the cost of final disposal;
- 1/qn is the discount coefficient;
- n are the years of the building’s life cycle.
- Transport infrastructure: bridges, roads, railways, tunnels, airports, ports, and harbors.
- Energy infrastructure: wind power plants; hydroelectric power plants; nuclear power plants; substations; electricity grids; oil and gas extraction plants; copper, iron, and coal mines.
- Public utility infrastructure: distribution of natural gas, electricity and water, sewerage, sewage treatment systems, and oil pipelines.
- Recreational facility infrastructure, such as parks or playing grounds.
- Water management infrastructure, such as white water and waste water facilities, dams, canals, and embankments.
3. Methods
- Location. Cycle routes can be located in urban and suburban areas. The design of cycle networks must take into account this element, guaranteeing the cyclist maximum usability and permeability of road infrastructure. Moreover, the design of routes for slow mobility must be correctly inserted in the landscape. In urban areas, particularly significant are the so-called areas 30, where vehicles’ speed cannot exceeding 30 km/h, and restricted traffic zones (ZTL as they care called in Italy), even if in other areas the allowed speed may be higher, such as in the 30–50 km/h range. In suburban areas, instead vehicles are normally allowed to move at speeds in the range of 50–70 km/h. National and European experiences on the design and construction of urban cycle paths have shown that standard costs can be adopted. In fact, in the absence of geological problems, it is possible to hypothesize a design with a single substrate layer for both infrastructures. In suburban areas, on the other hand, it is often necessary to construct cycle paths from scratch and related costs depend heavily on eventual works at different altitudes (bridges, cantilevered constructions, etc.). Therefore, it is possible to define three different categories of areas in which cycle paths are to be added:
- A1_Urban area with speed < 30 km/h, where cycle paths serve urban or residential areas;
- A2_Urban area with speed 30–50 km/h, where there is normally a promiscuous presence of vehicles and high presence of pedestrians and cyclists. There are often commercial activities and schools. Parks, tourist areas, along the sea or along the river, often fall in this category;
- A3_Urban area with speed 50–70 km/h, including ring roads and extra-urban roads.
- Economic availability. The budget for the cycle path is a piece of data of major importance. To assess it, not only construction costs should be considered, but also the costs related to management and maintenance, such as the possible reconstruction of the pavement, adjustments of public lighting, street green spaces, and rainwater conveyance systems in the existing sewage network. Depending on the available budget, it will be possible to choose the best solution considering the quality–price ratio (QPR).
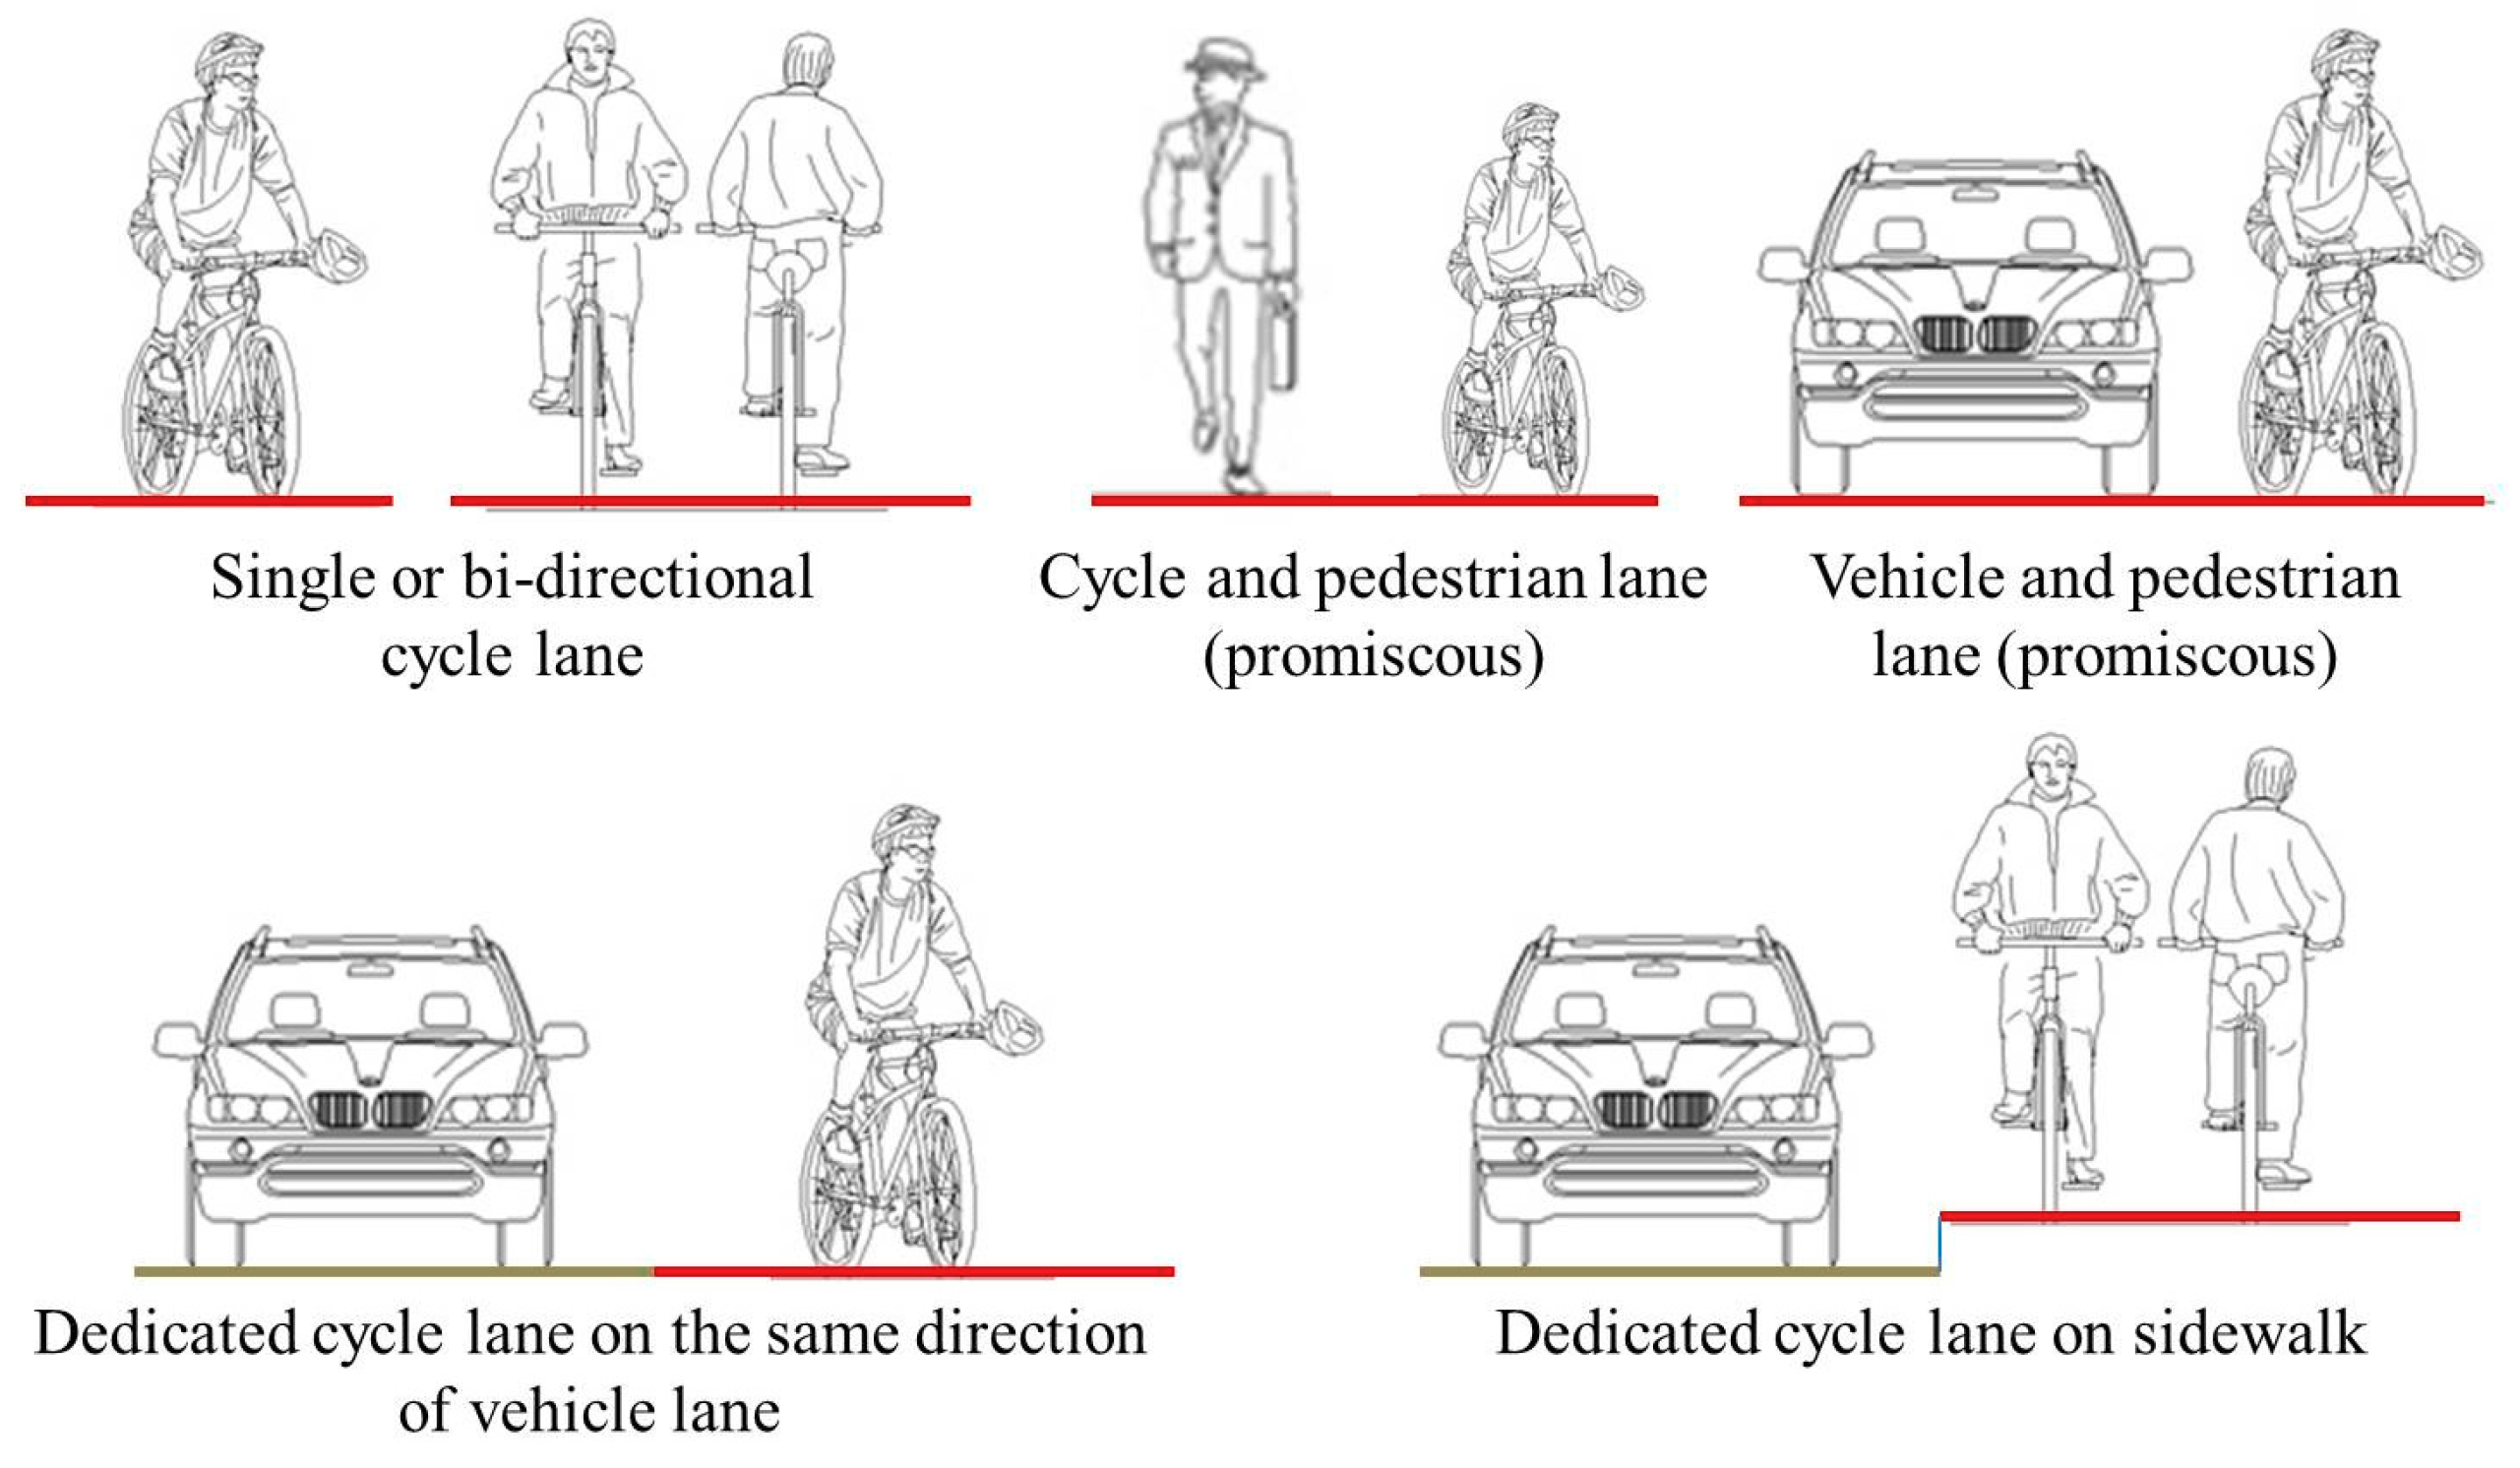
- Cycle routes selection. Considering the different location, it is possible to identify three different categories related to the urban and nonurban environment with different speeds, as mentioned above (A1, A2, A3). Besides, cycle routes can be located close to the parking lots (B1) and to residential accesses or where those are not there (B2). From the geometric–functional point of view, the presence of a dedicated lane (L1) or a promiscuous cycle–pedestrian lane (L2) must be taken into account. Furthermore, the direction of the cycle flow with respect to the vehicle, either in the same (D1) or in the opposite direction (D2), is to be taken into account. The combination of these parameters provides the types of cycle infrastructure shown in Table 2.At the national Italian level, considering the presence or absence of neighboring car parks on the roadside, the most common geometries are the following shown in Figure 1:
- Cycle paths completely separated from streets, (L1) with one (D1) or double direction (D2): where the lane is separate from motor vehicles and from pedestrians, by means of suitable obstacles or horizontal separation signs. The combinations linked to this category are titled R4 (one direction) and R5–R7 (double direction).
- Cycle paths on dedicated lane of roadway (L1) with one direction (D1): the cycle path has here the same direction as the vehicle lanes, is usually located on the right side and is characterized by a separation element i.e., a longitudinal delimitation strip or curbs. The combination R3 refers to this category.
- Cycle paths on dedicated lanes on sidewalk (L1) with one (D1) or double direction (D2): they are located on the side adjacent to the roadway and are built if there is a suitable width, which does not create problems for pedestrian flow. The combinations linked to this category are titled R3 and R5.
- Promiscuous paths (pedestrian + cyclist) (L2): they are usually built in parks or areas with mainly pedestrian traffic, in the event that the width of the roadway or the low cyclist flows do not require the construction of specific cycle paths. The combinations R1, R2, R6, and R8 belong to this class.
- Promiscuous path (motorized vehicle + cyclist) (L2): this solution, envisaging that vehicles and bicycles use the same lane, is the most risky for cyclists. It is necessary to design specific measures (i.e., raised pedestrian crossings or speed cruise sensors) that reduce the problems due the difference in speed among the two traffic components (bike + motorized vehicle). These types are defined by (*). These solutions are generally to be discarded or limited.
Cycle paths with two adjacent reserved lanes may be designed in the following cases:- On the pedestrian lane, if the cycling traffic is more intense than the pedestrian; in this case, these are lanes with one side for each direction of travel, generally located in the middle of the road;
- On the roadway, in this case, these are cycle lanes, located to the right of the roadway with the same direction of travel as the vehicles. This solution is mandatory when the cycle flow exceeds 1200 units/h, for at least two peak periods of not less than fifteen minutes in 24 h.
The direction of the cycle flow must always be according to that of the vehicles, unless there are separation works, such as islands or not surmountable curbs, especially for categories (*).This separation element reduces the risk of crashes between vehicles and bikes that occur when they move in the opposite direction, and avoids possible improper use of the lane (e.g., trespassing of heavy vehicles on the cycle lane). In Italy, the design choice must comply with specific standard no. 208 of the 1991 “Interventions for the construction of cycle and pedestrian itineraries in urban areas” and must also comply with the CNR (National Research Council of Italy) standards, as well as the ministerial decree 557/1999 “Regulation containing rules for the definition of the technical characteristics of the cycle paths”. Following the aforementioned standards, Table 3 below classifies the design combinations into admissible, preferable, and not allowed/rarely implemented. Furthermore, once a budget is set, the solutions are defined considering a low (green), medium (yellow), or high (red) value. This range was set considering the recent national completed projects. It should be noted that the low category includes projects with a budget (estimated for 1 km of lane) between 20000,00–30000,00 euros, the middle category linked to 30000,00–40000,00 euros and the high category with budgets > 40000,00 euros. - Standard design definition. The design and analysis procedure of cycle routes must be conducted in relation to the following technical–functional aspects:
- Geometrical aspect of the roadway: the geometric standards to be guaranteed, in accordance with travel speed measures, are linked to the section width, the longitudinal slope, the radii of the curves, and the visibility distance. In detail, the minimum values to be respected (in accordance with ministerial decree 557/1999 “Regulation containing rules for the definition of the technical characteristics of the cycle paths”) are shown in the Table 4, Table 5 and Table 6:
Among the design standards, the following should be well kept and estimated in advance: minimum radii of curvature as a function of the design speed, which must never be less than 20 km/h, and visibility from afar.- Operational speed: it is the travel speed of motorized vehicles in normal outflow conditions; as specified in point 1 of the methodology, the speeds taken as a reference are: v1 < 30 km/h, v2 = 30–50 km/h, and v3 = 50–70 km/h.
- Conflict point definition: in order to guarantee the safety and ride comfort for cyclists, both in the case of single and promiscuous lanes, different types of conflicts (lateral, longitudinal, and transversal) must be analyzed. Road junctions and crossings are the most critical points of a cycle network.
- Safety index: in the literature, there are numerous indicators that allow us to describe the safety of cycle paths, looking at conflict points, visibility between bicycles, and vehicles, but also regularity of the pavement and adequate lighting of the cycle paths. Here we relate to two indicators for the safety level, bicycle compatibility index (BCI) and bicycle level of service (BLOS), shown in Table 7. BCI (bicycle compatibility index) gives a synthetic judgment directly linked to the volume of traffic (bike/h), the speed of the vehicle flow (m/s or km/h), and the width of the track or space available for cycle transit (m) [34]. It is also refers to other factors that influence the level of comfort (presence/absence of signs, volume of traffic that turns right, presence of car parks, presence of traffic dividers, etc.), in accordance with the Highway Capacity Manual (HCM) [35]. The BLOS (Bicycle Level Of Service) index expresses synthetically a judgment of darkness and ride comfort perceived by cyclists on the basis of traffic volumes and the geometric functional conditions of the infrastructure. In fact, it depends logarithmically on the volume of traffic, on the pavement conditions and on the presence of heavy vehicular traffic, while no correlation exists with the number of parking maneuvers and the volume of traffic that turns occupying the lane [36,37]. Yet, a sound design should consider all permitted maneuvers and all potential points of conflict among bikes and vehicles.
- Road pavement section and relative classification. Most of the cycle paths are made up of flexible or semi-rigid floors. In both cases, a bituminous mix is used for packaging the bonded layers of the structural package (binder layer and wear layer).They are located in the upper layers, but in this part there is the foundation layer, which in turn divides the loads towards the supporting ground (subgrade or subbase). In order to guarantee the stability and resistance of the cycle platform, the following materials and processes have been provided in the four proposed cases:
- Use of a geotextile. It is useful as a filter and as a separation layer, avoiding not only the contamination between materials of different grain size but also managing to maintain the physical–mechanical performance of the layers over time;
- Use of stabilized granular mixture for subbase/subgrade. It ensures adequate bearing capacity of the superstructure and at the same time provides a sufficiently level and regular surface for laying the upper layers;
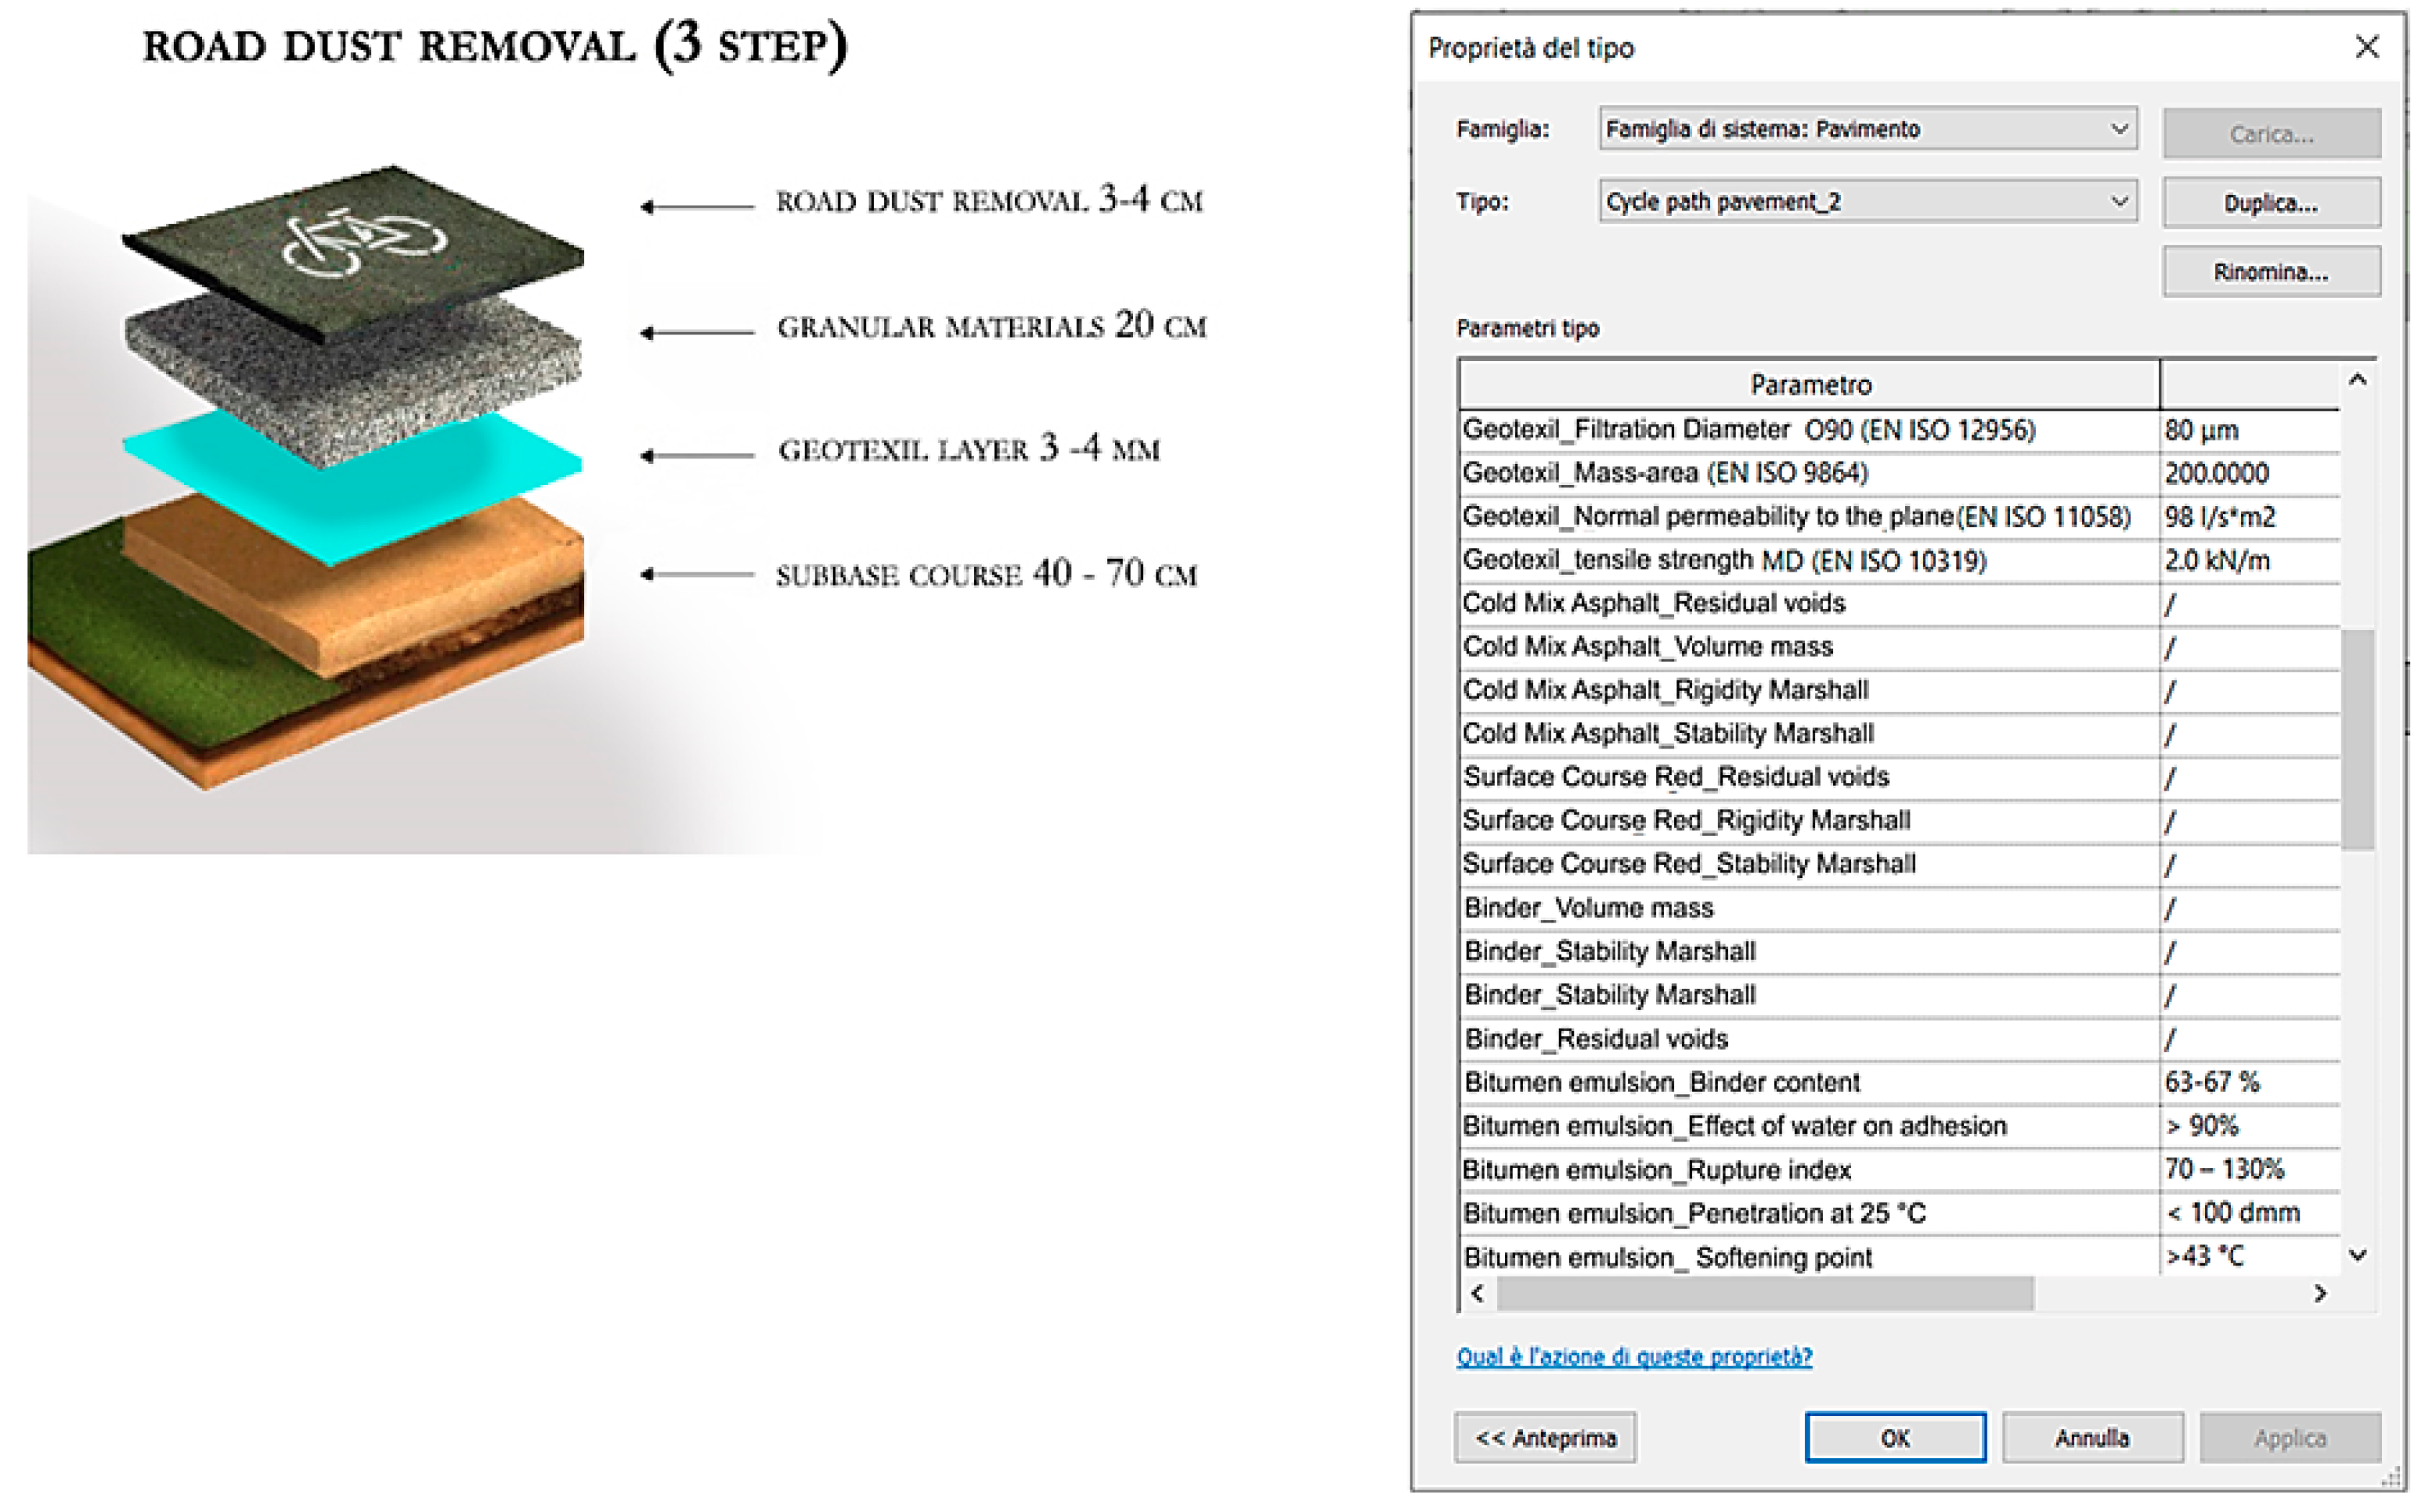
- Use of dedusting pavement course [39]. It is applied on low-traffic roads to create a low-cost course, reducing the environmental impact. By reprofiling the laying surface, the dedusting phase consists of the first laying phase of a substance composed of diluted bituminous emulsion and crumbling, and secondly of a double emulsion/grit treatment.
The low viscosity bituminous emulsion penetrates the foundation and makes the laying surface cohesive and also ensures good adhesion to the subsequent multilayer treatment. It allows, in turn, the obtaining of a waterproof surface, to reduce dust in the dry season and avoid the formation of mud in the wet season:- Use of treatment of the surface layer (single or double layer). This technique consists of a slim bitumen layer covered with a layer of monogranular material. To obtain a more resistant treatment, the binder/aggregate combination can be repeated by applying two or three monogranular layers (gradually decreasing in size), which are mutually united.
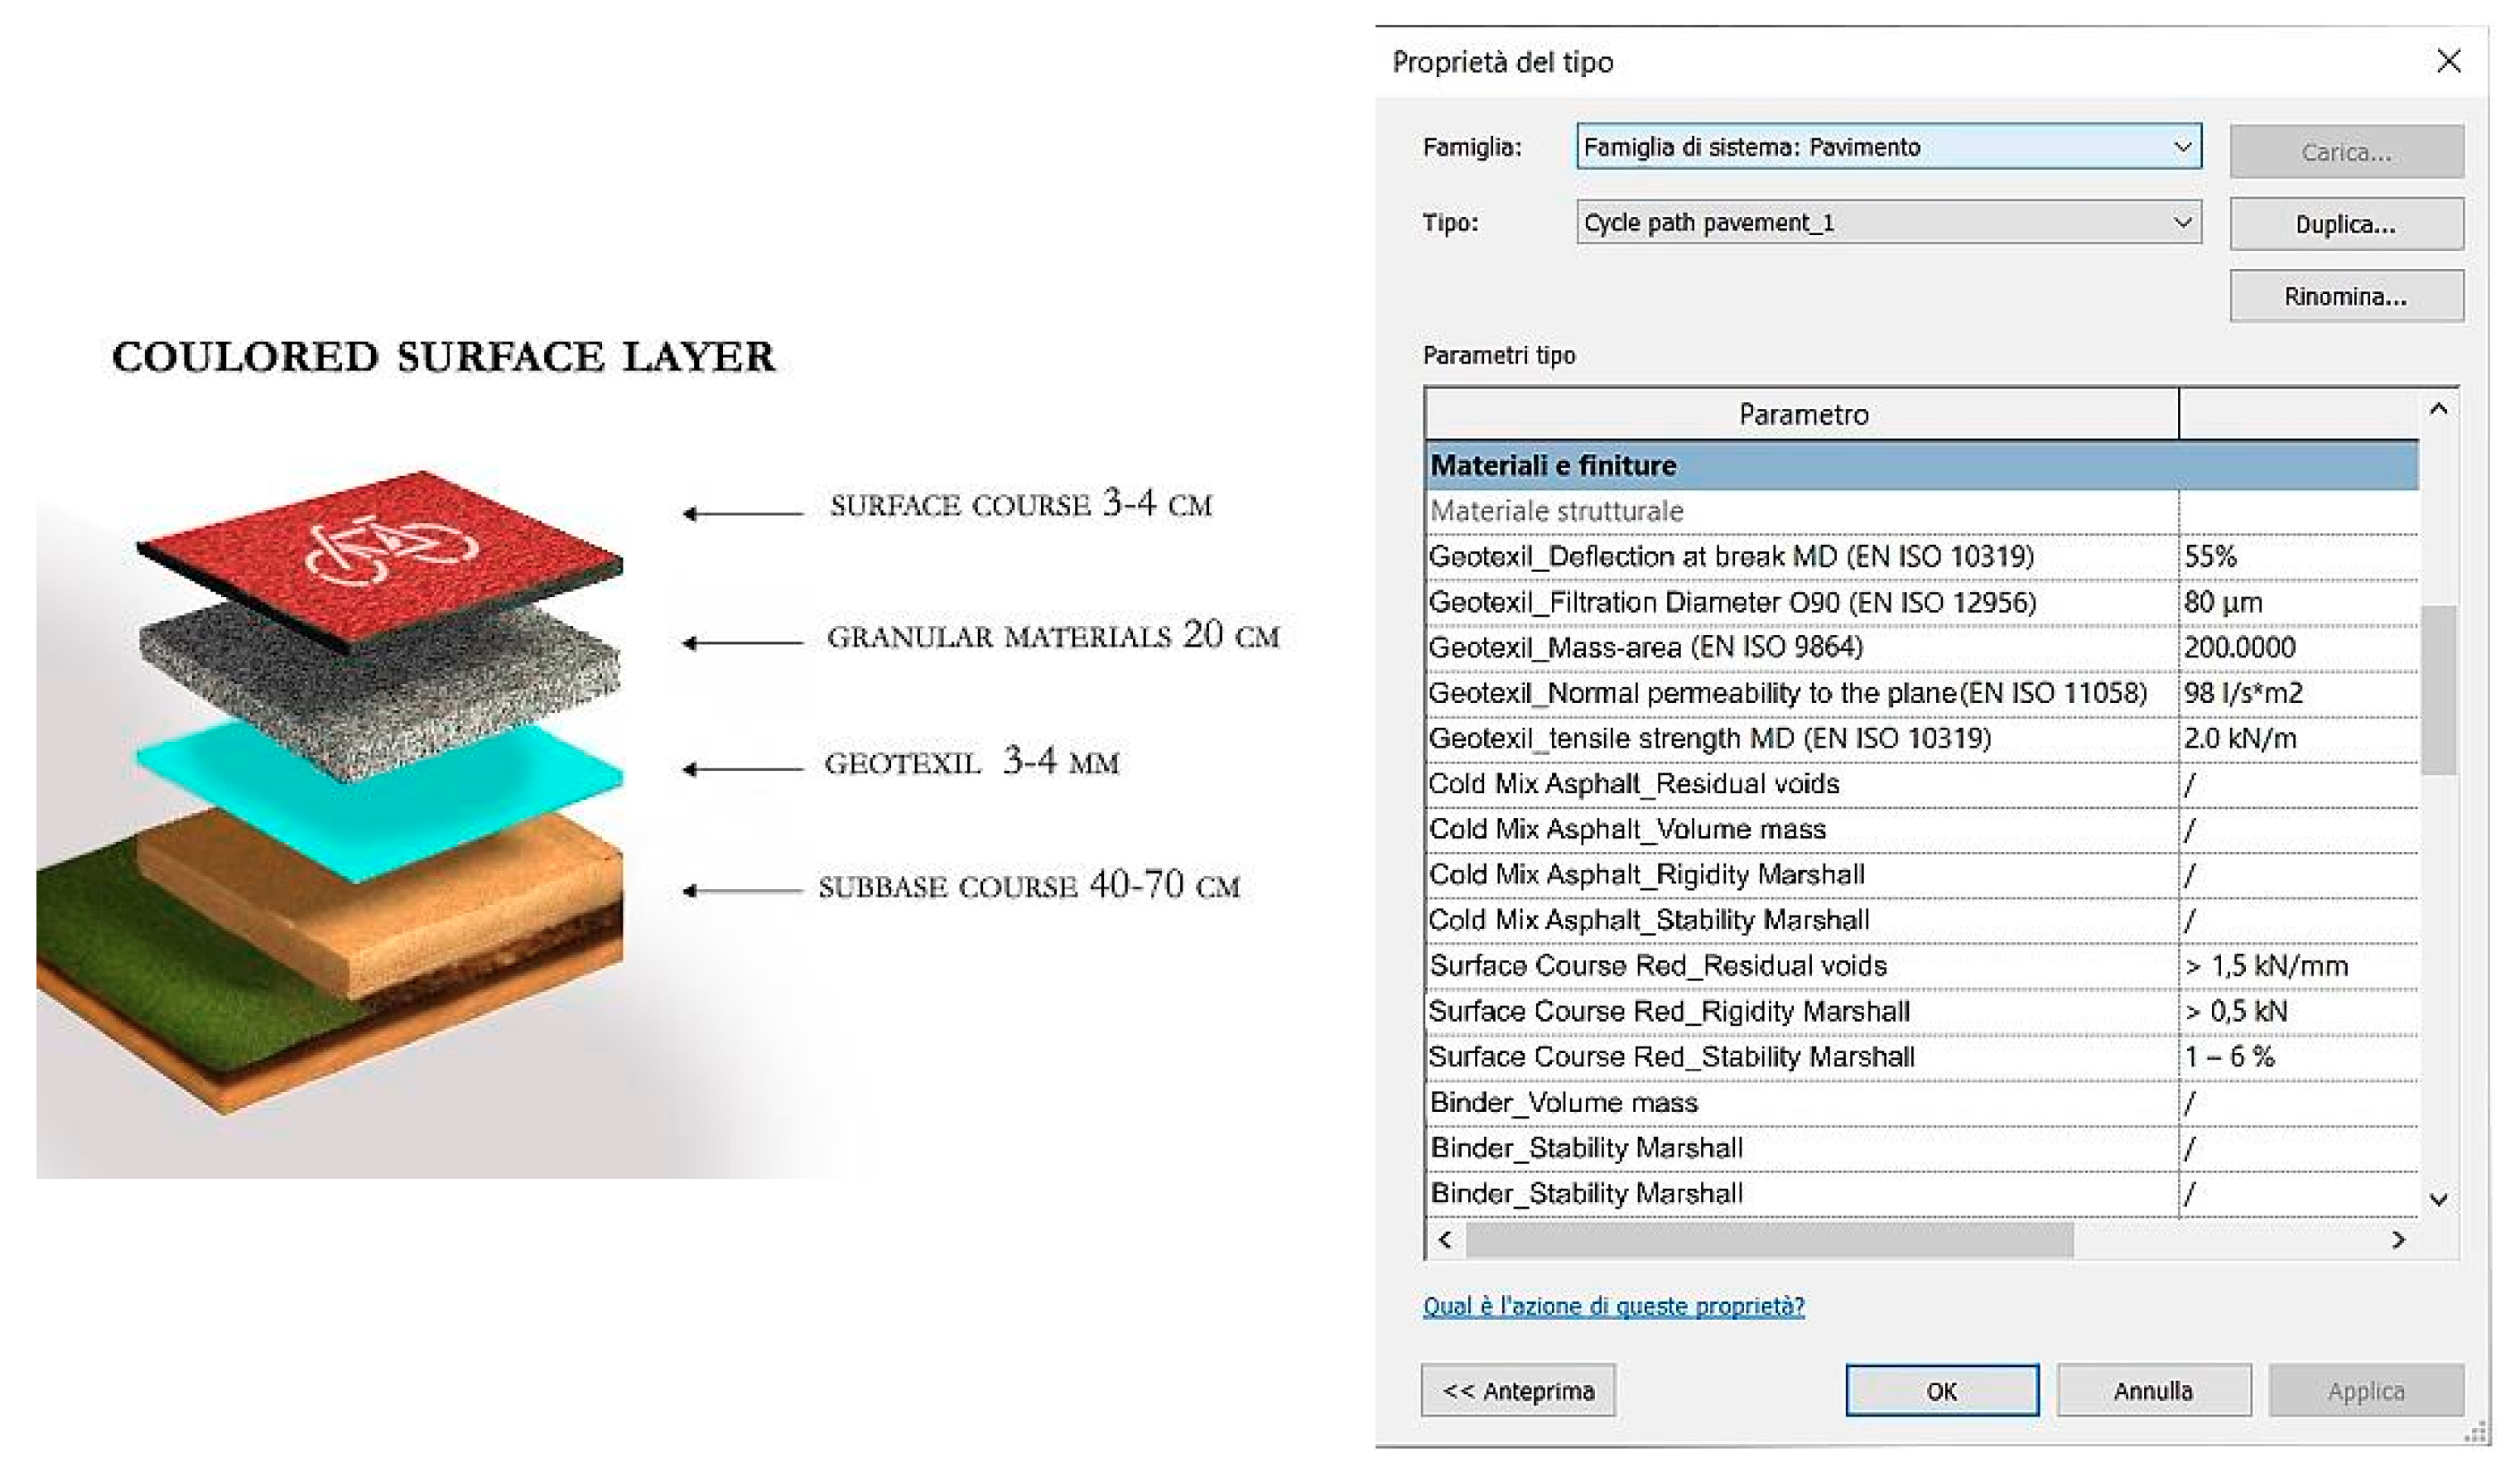
The following pavement sections have been supposed not limited to:- Pavement section with colored surface layer: as per Figure 2, the pavement section is a cohesive and waterproof wear layer (about 4 cm), made of a mixture of different stones and grits according to the desired color effects, crushing sands, mineral additives (filler), colored pigments, hot mixed with a transparent oil-based binder. This layer is applicable in all situations in which low environmental impact chromatic effects are desired, compared to the traditional bituminous conglomerates used for the wear layers.
- Dust removal treatment in 3 steps (on surface layer of pavement section): as described in Figure 3, the layers are made of a bituminous emulsion with grit above the granular mixed layer. The first layer, with larger aggregates, makes the first centimeters of the granular mixed foundation layer cohesive and solid, while the other two layers, with smaller aggregates, seal the surface and, at the same time, give regularity.
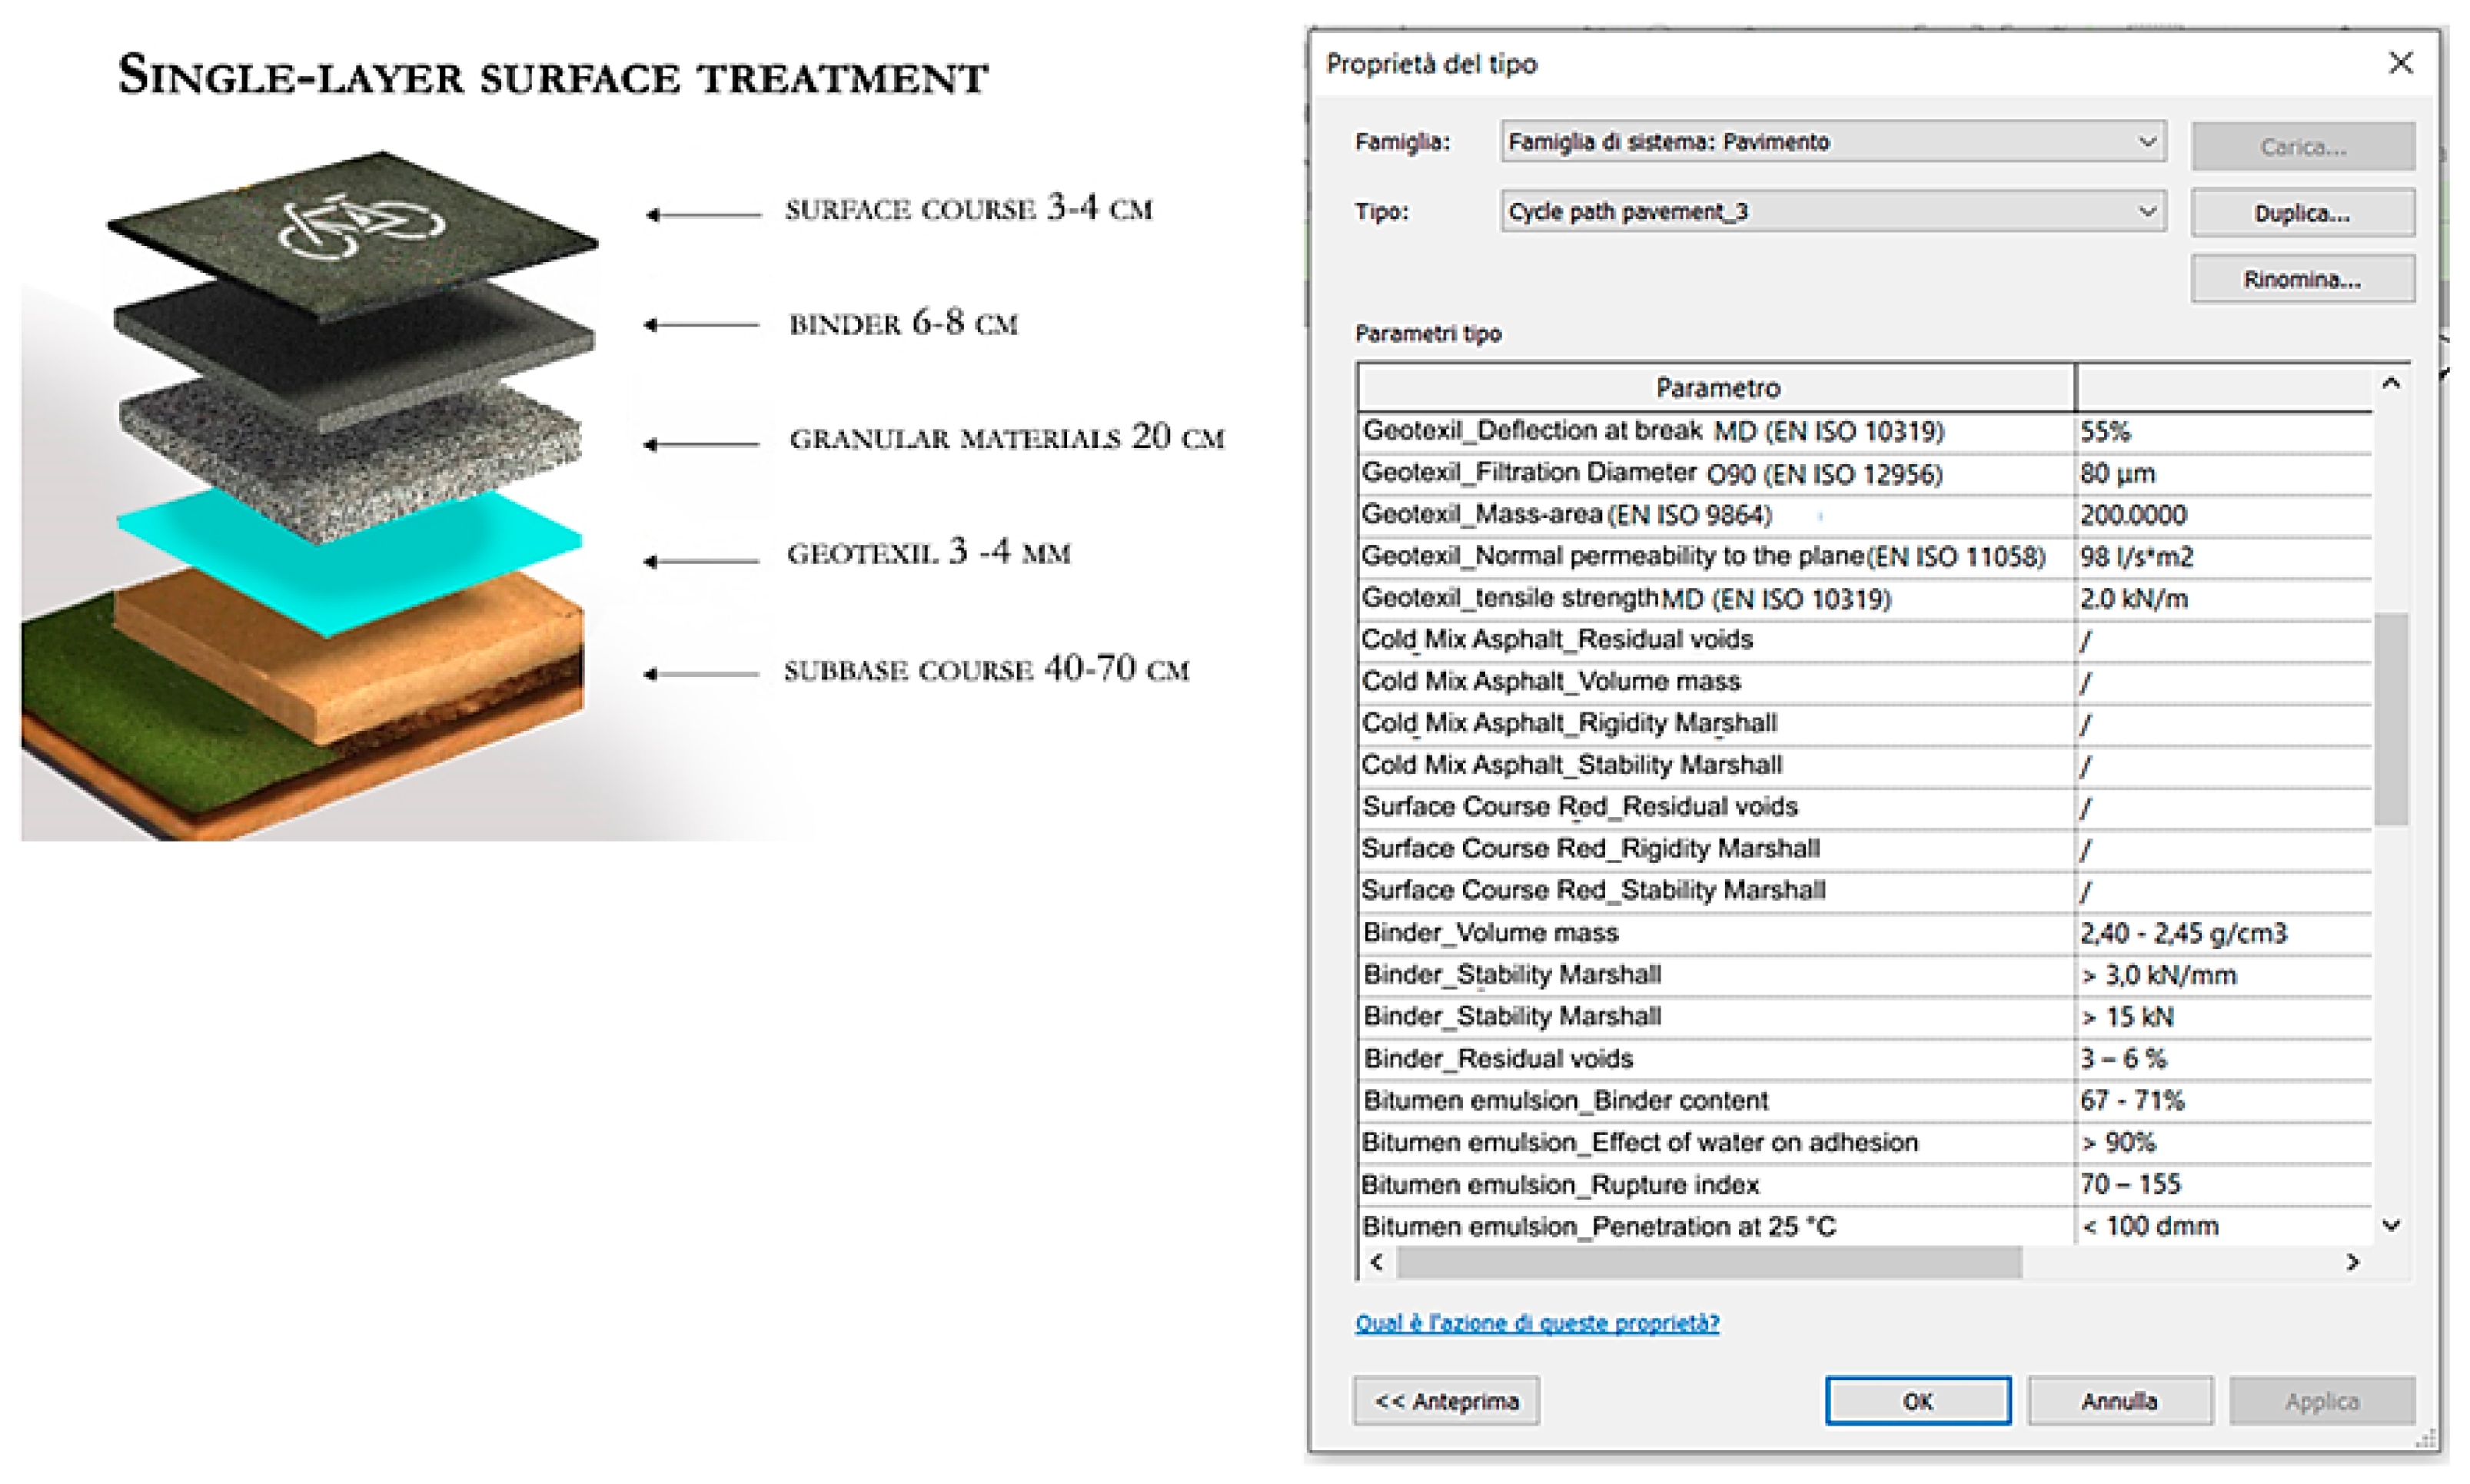
- Single layer surface treatment: as shown in Figure 4, in order to give greater resistance to the superstructure, a layer of binder in traditional bituminous conglomerate (about 7 cm) may be used, coupled with a single-layer surface treatment. To do so, the surface is treated with bituminous emulsion (bitumen modified with thermoplastic polymers) and quality grit, using a special equipment that can apply the bituminous emulsion and, immediately after, the grit in quantities according to the path’s width, slope, and direction. Owing to this treatment, the surface gets a higher level of adherence and the pores of the underlying binder layer are sealed, guaranteeing greater water resistance.
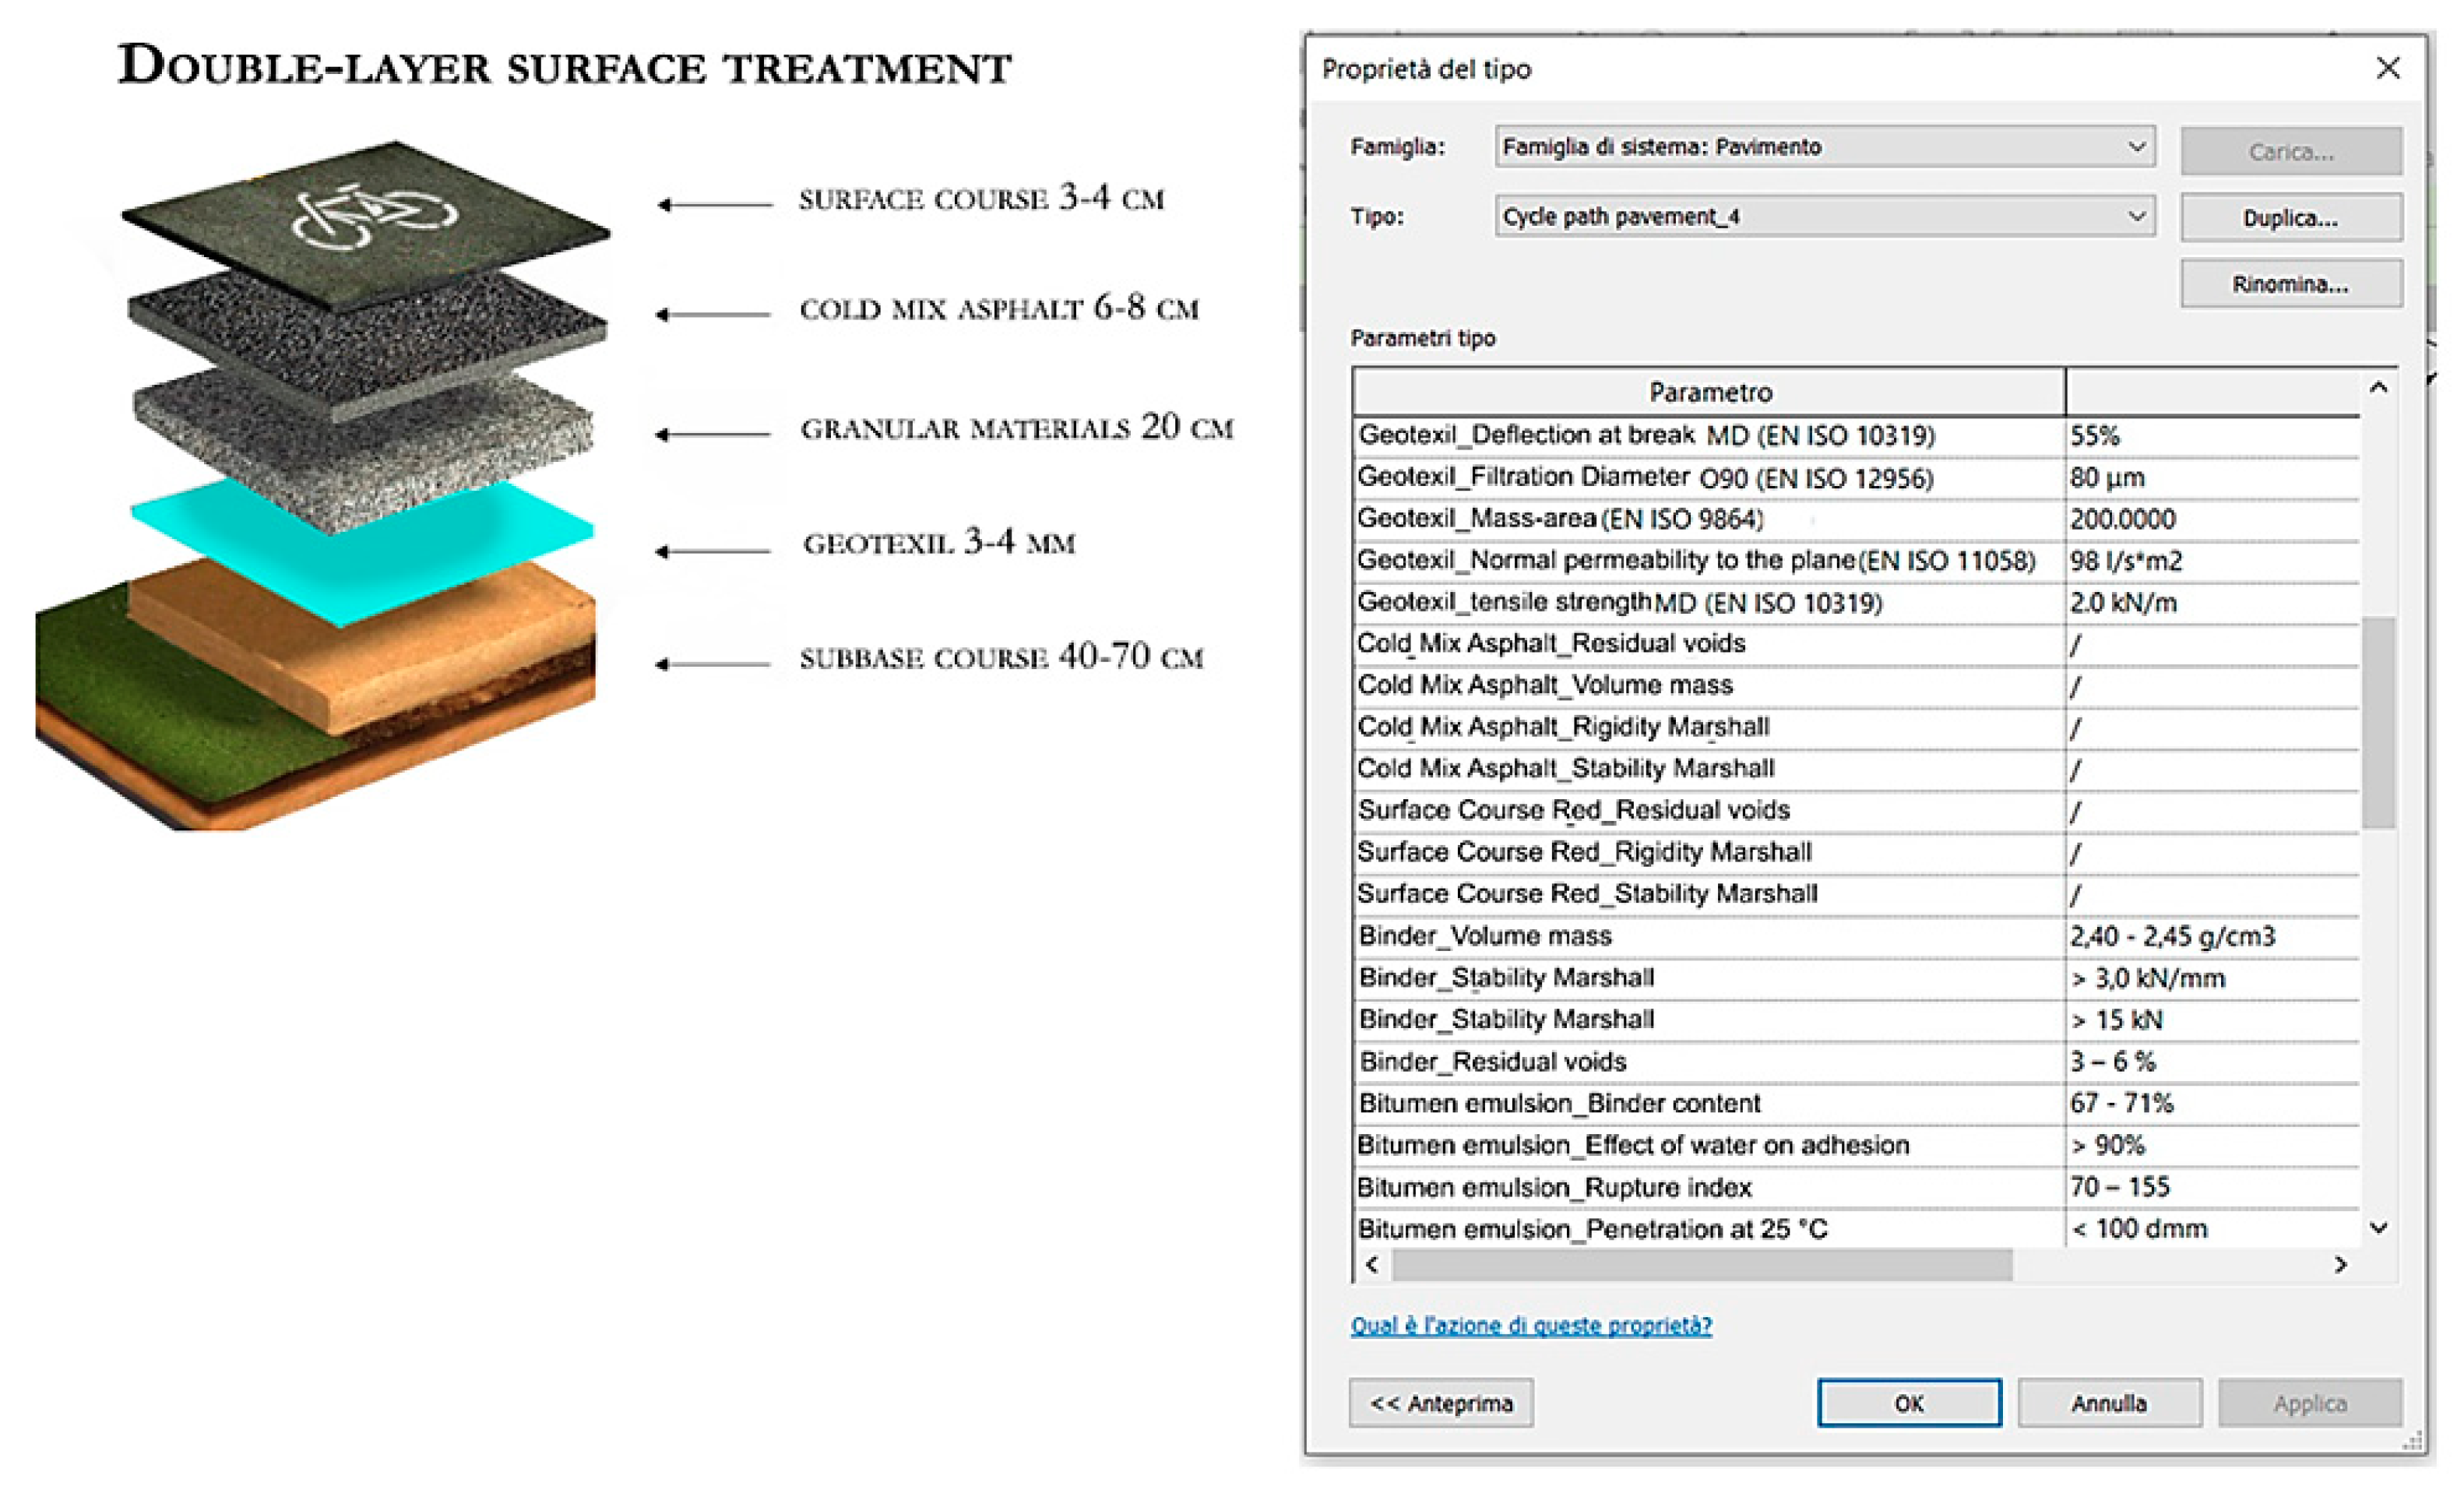
- Double layer surface treatment: as described in Figure 5, on a layer of cold-recycled bituminous conglomerate (about 10 cm), a milling of bituminous conglomerate is applied (70%) and natural aggregates are used as granulometric correction for not more than 30%. Alternatively cement and modified bituminous emulsion can be used. Owing to this treatment, the surface gets a higher level of adherence and the pores of the underlying binder layer are sealed, guaranteeing greater water resistance.
- BIM implementation. In our hypothesis, the type sections and the technology packages defined above are implemented in BIM software, storing, and managing. The objective is to link all the data within the model so as to provide a picture of possible solutions for the performance related to each type of track chosen in relation to costs and pavement. Once the shared parameters have been chosen and the schedules created, they can be compiled in different ways:
- Directly inside the model, manually filling in the sections related to the layer properties that appear once selected;
- If the data are provided in an external file, the preferred choice is a standard Excel file that can be easily compiled and imported later into the model that will automatically update with the new information.
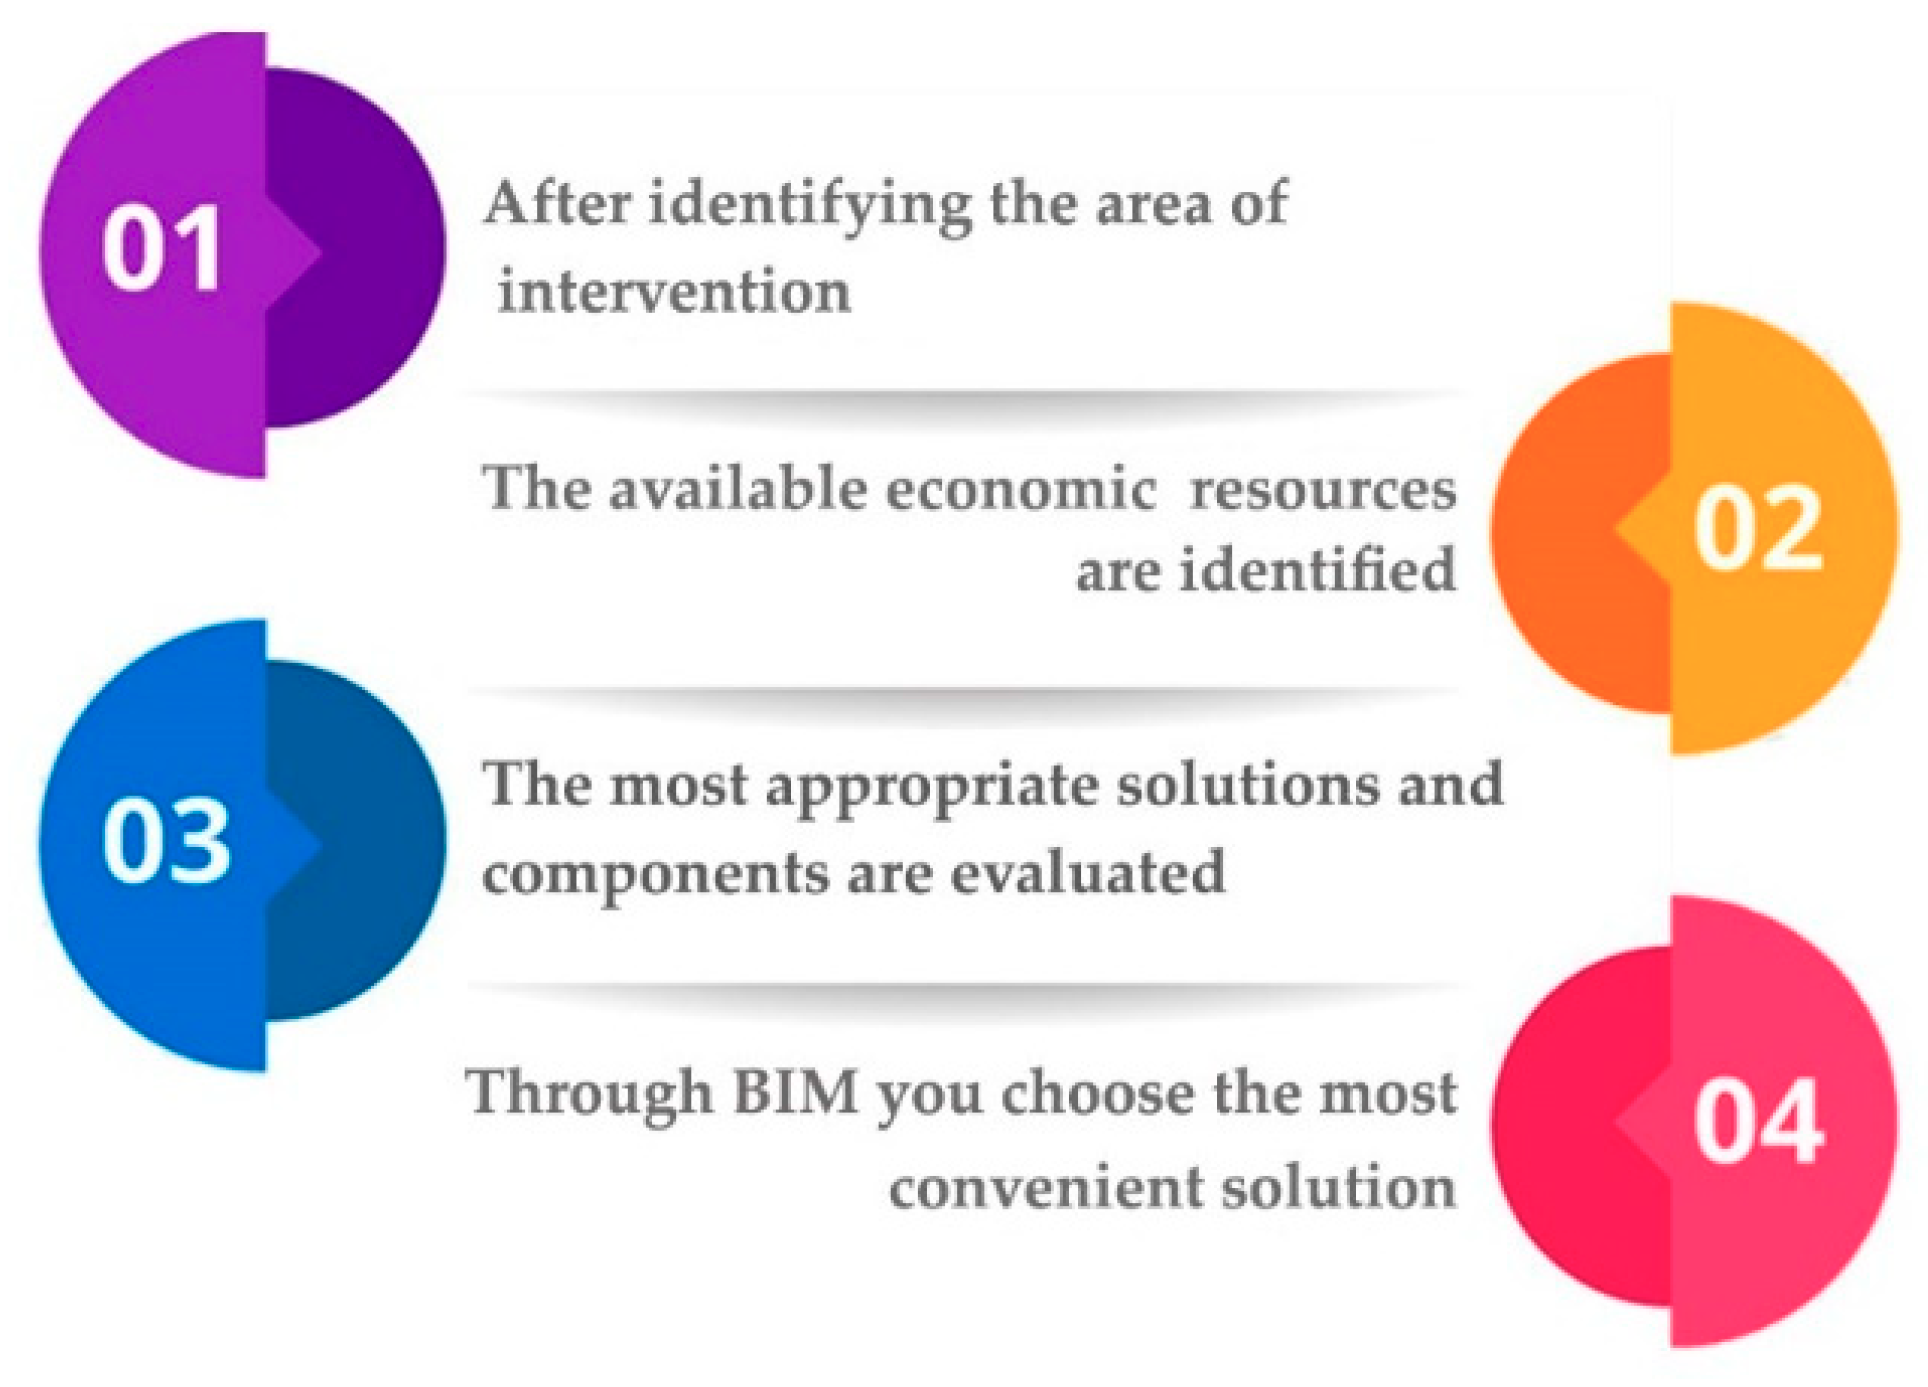
- Final evaluation. The final choice will be made through a logic explained in Figure 6:
4. Results
- Localization of area of intervention. In the case study, the cycle path is designed in the following location:
- A1_A urban area with speed < 30 km/h
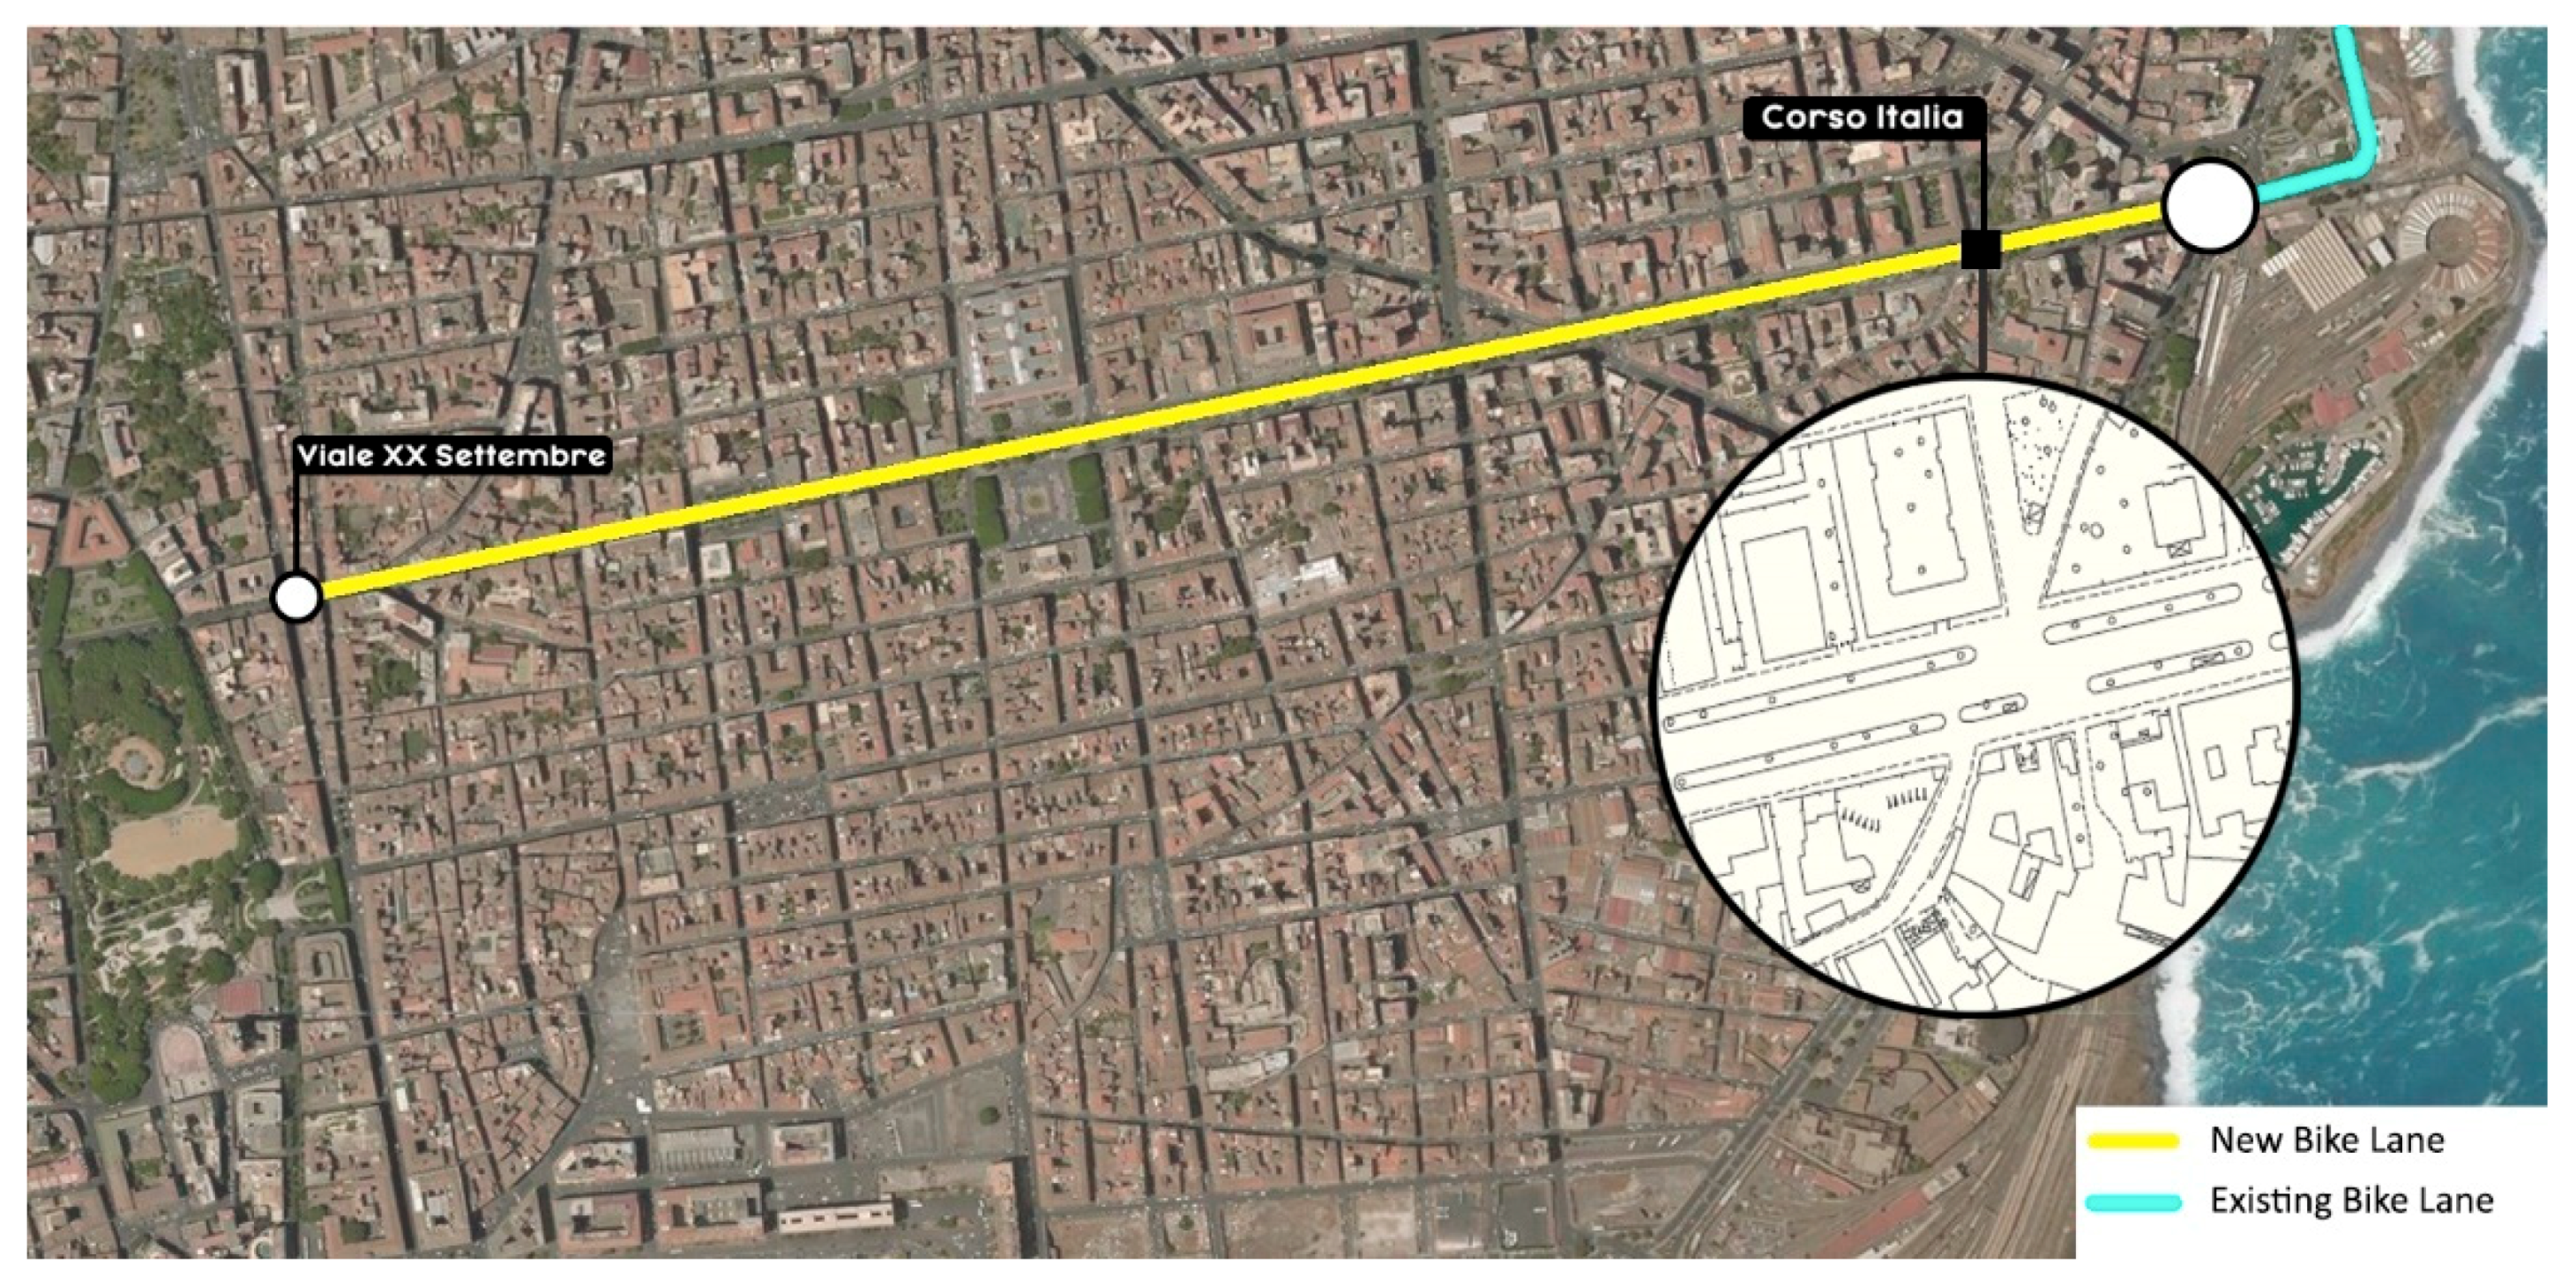
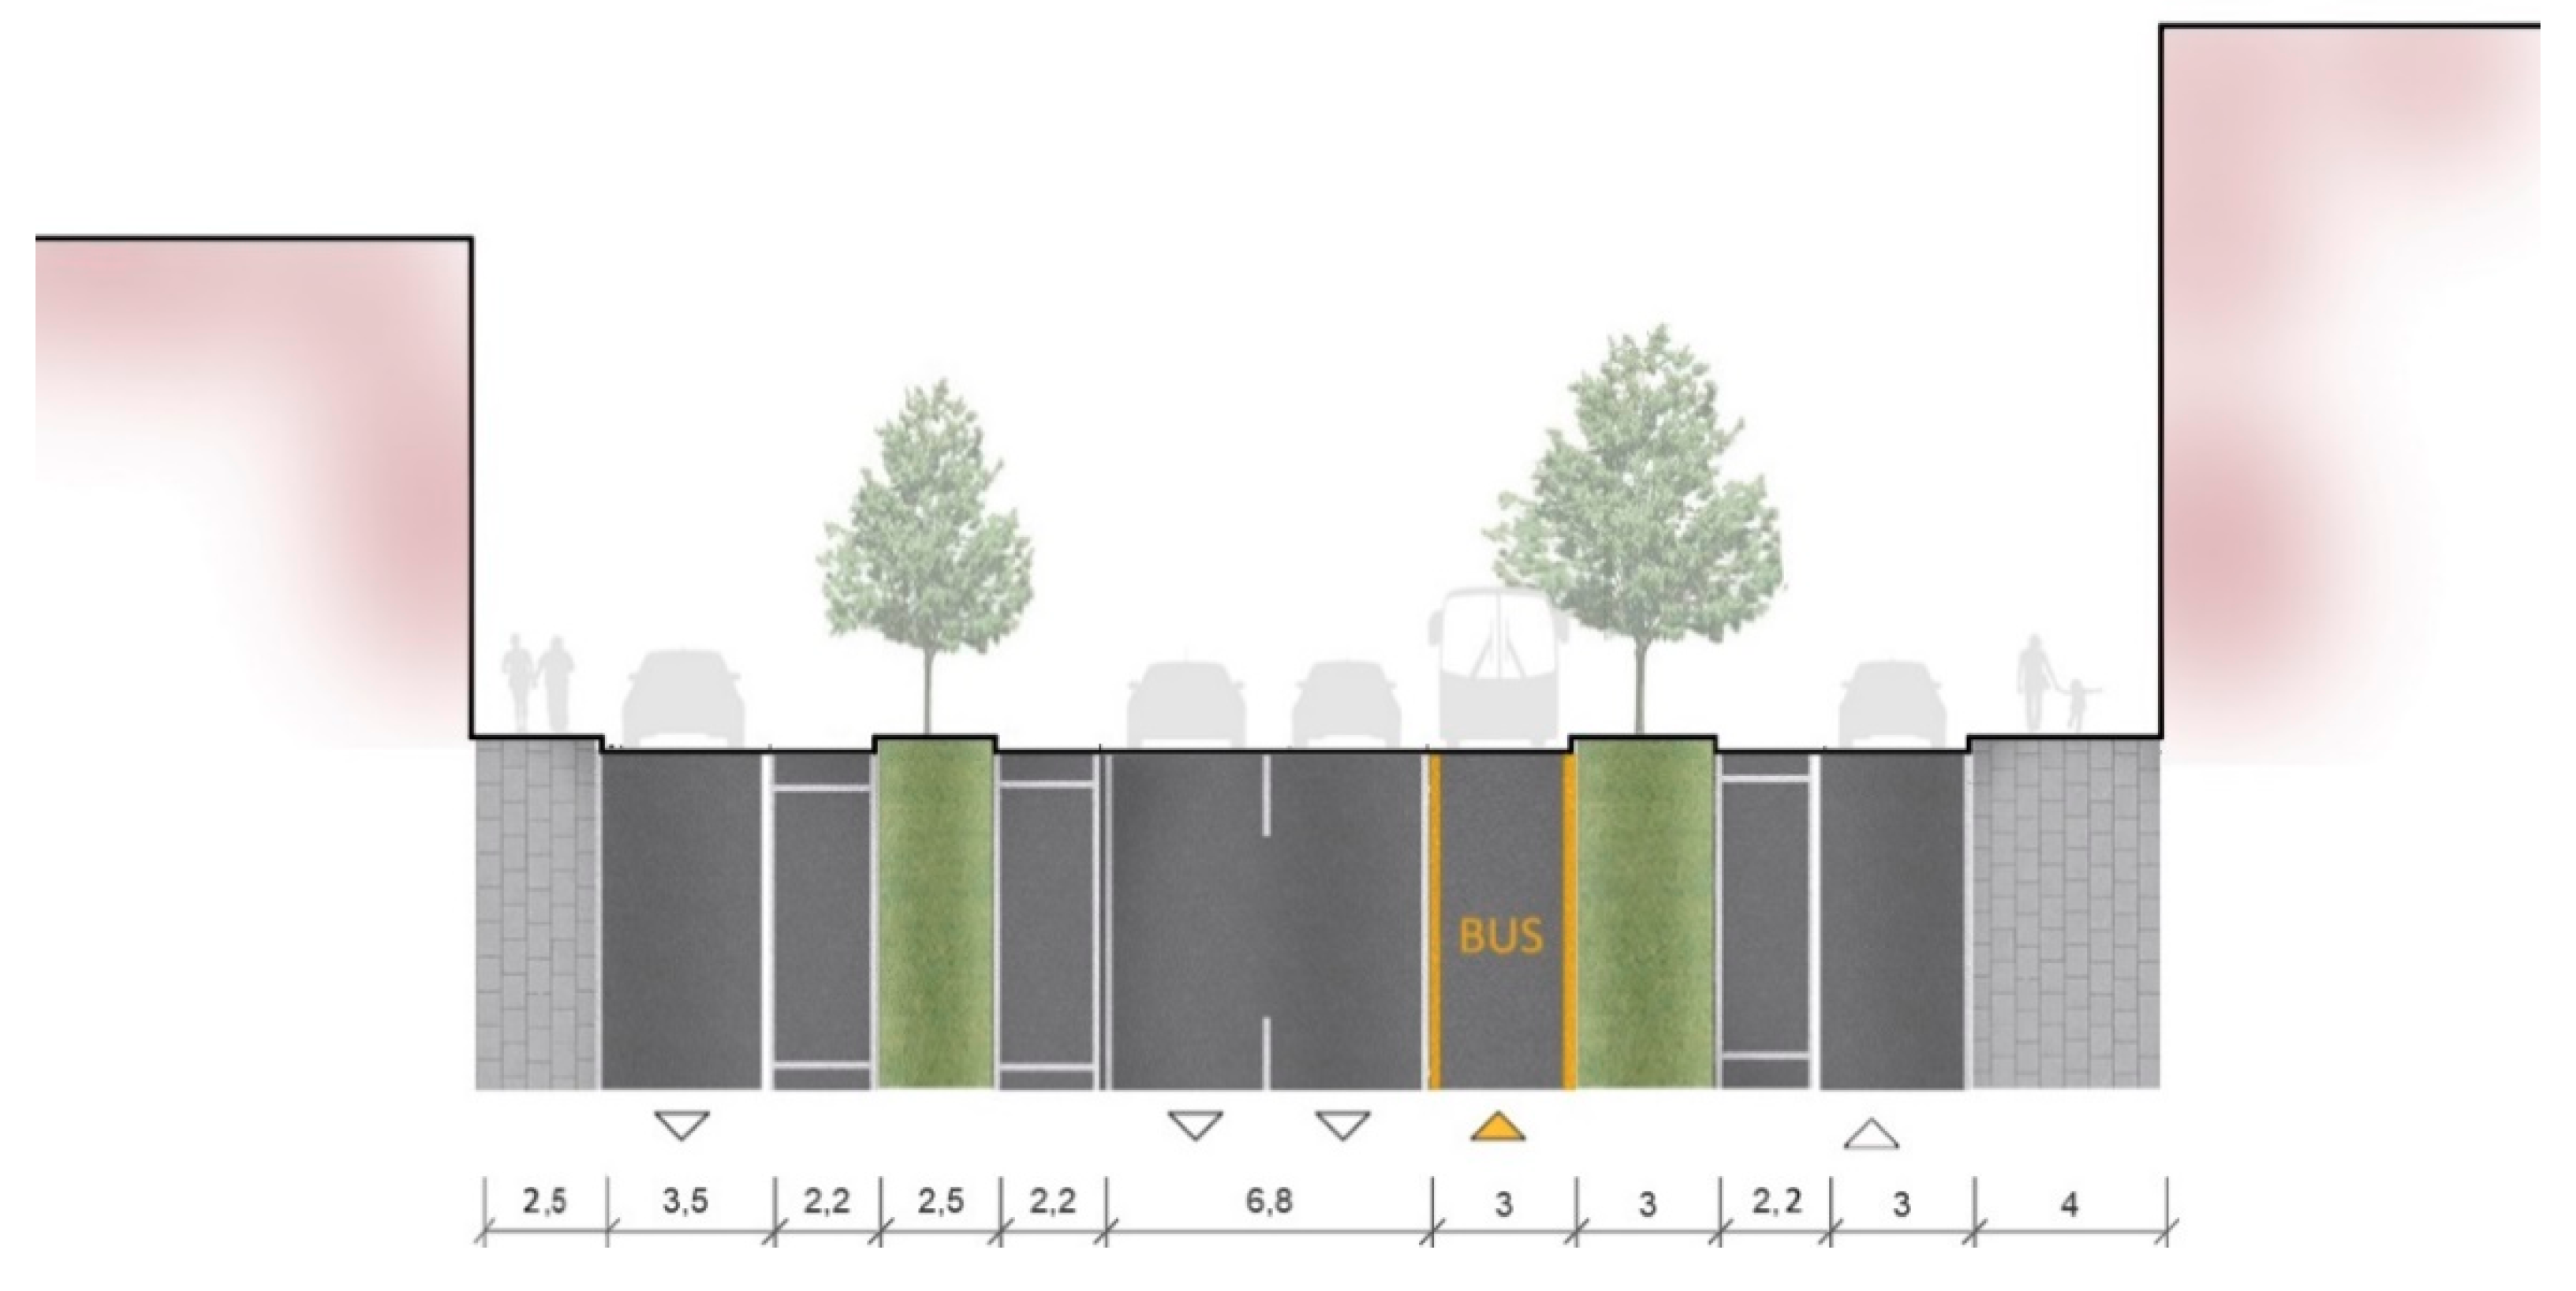
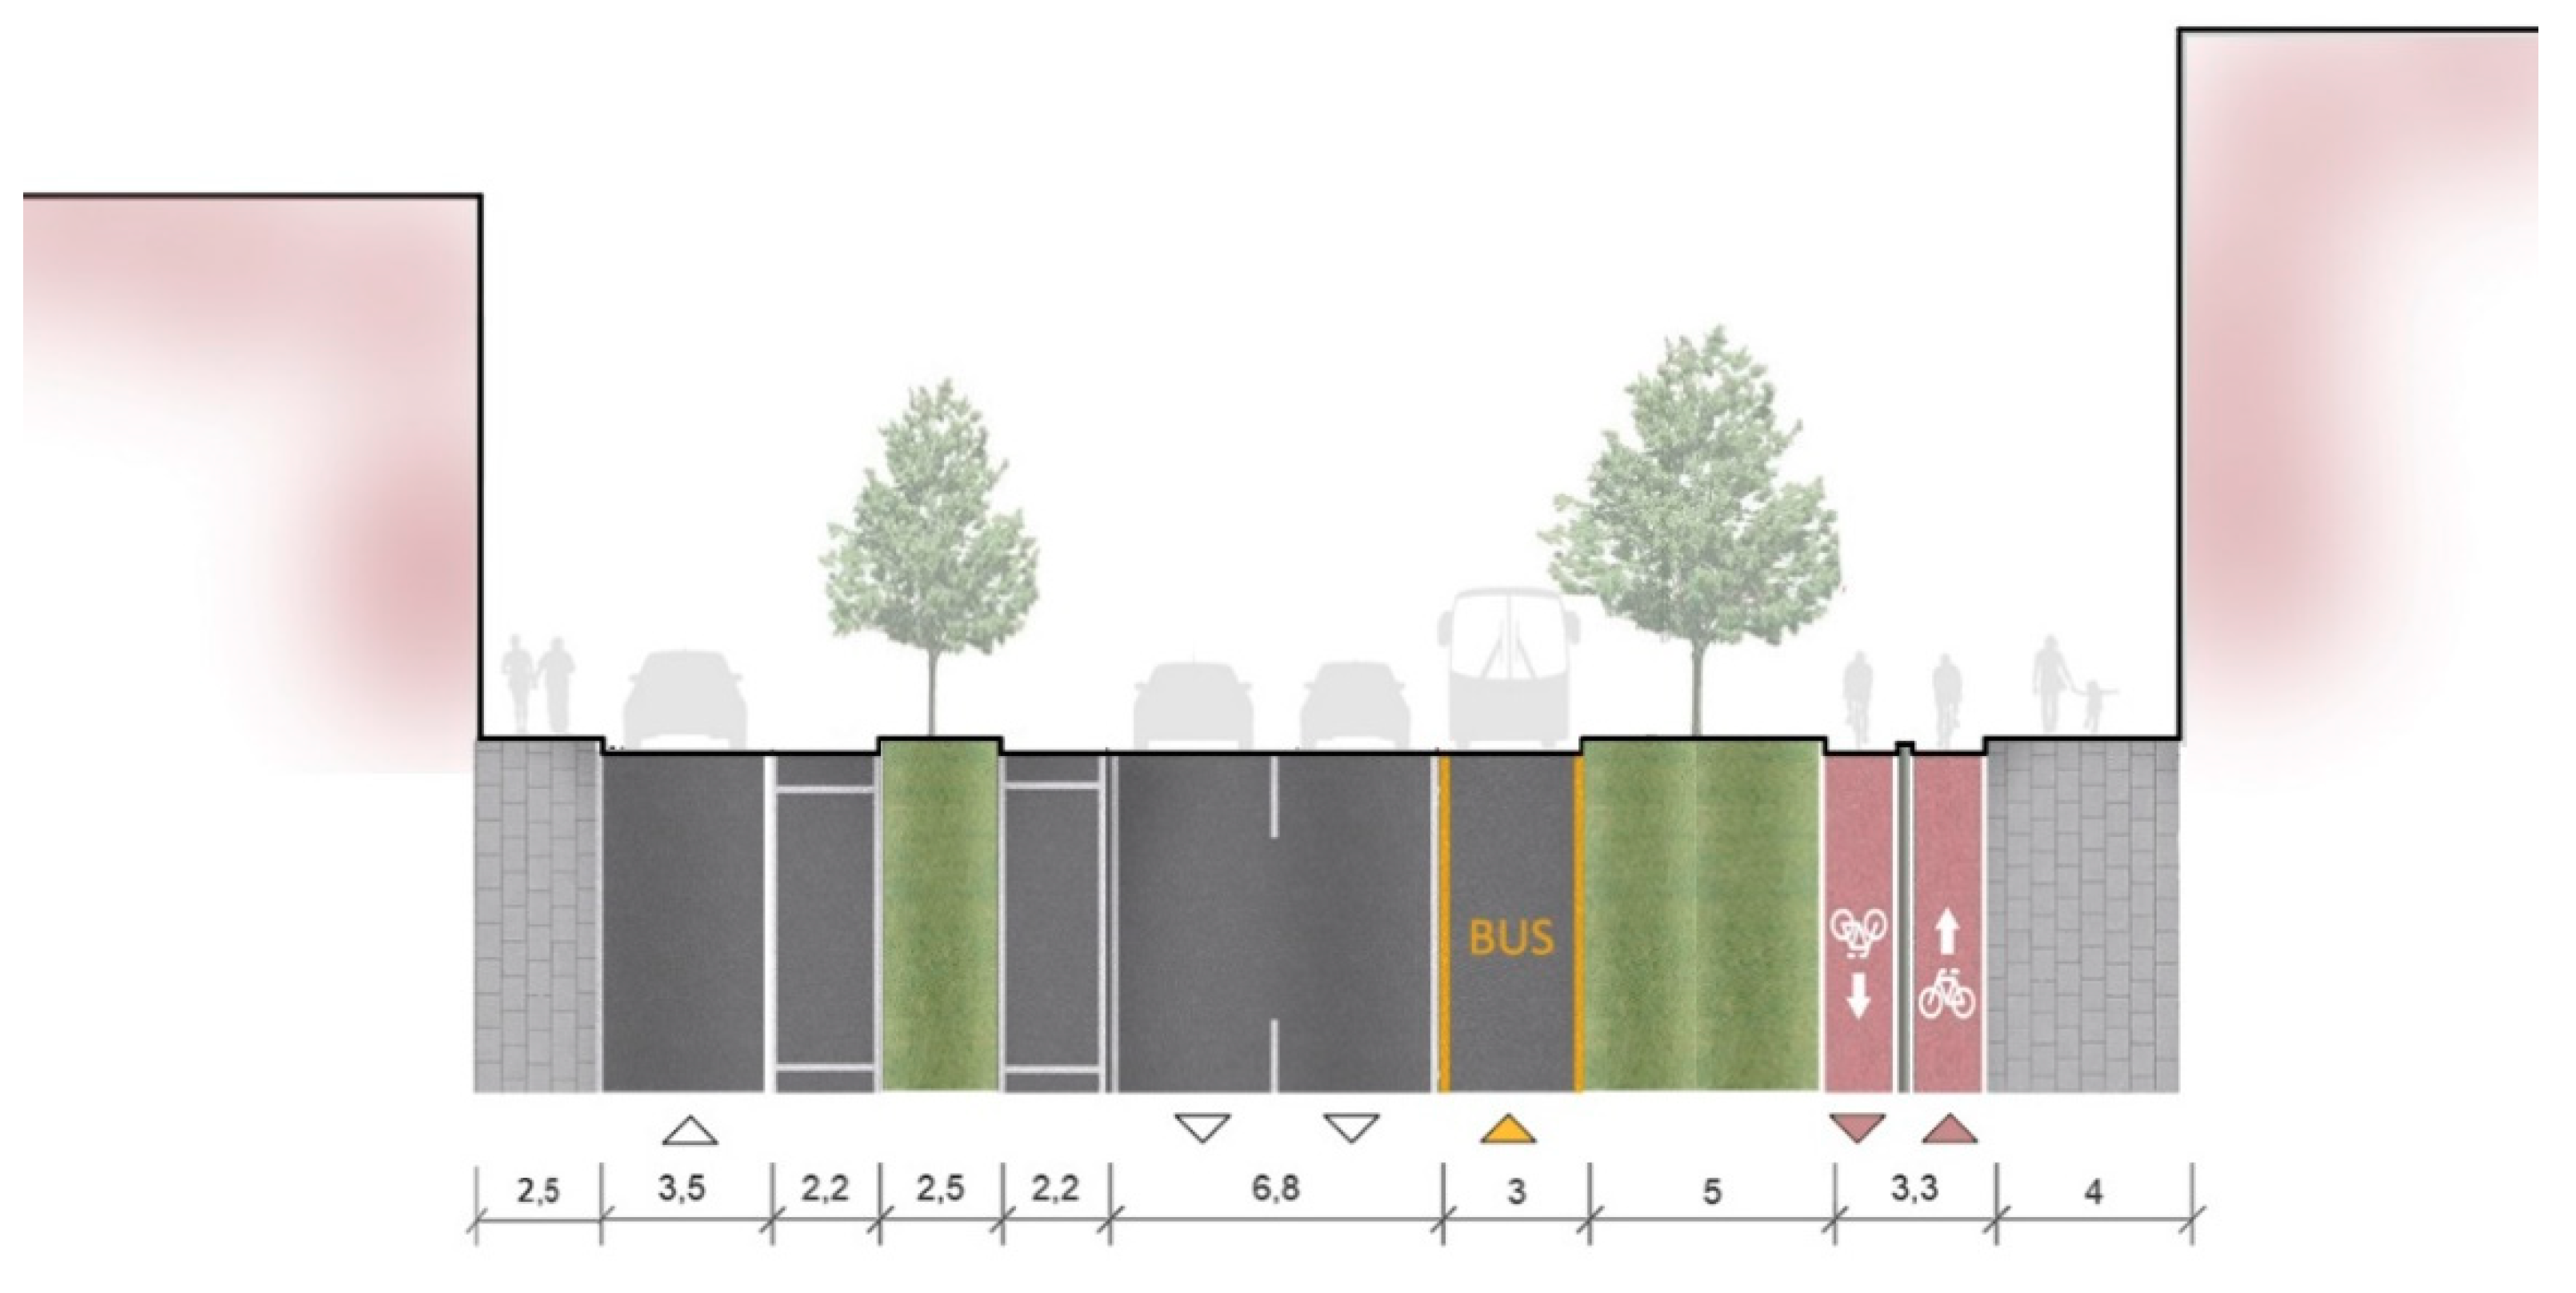
The cycle path originating from Viale XX Settembre, becoming later Corso Italia, would connect the historical center with the existing cycle path on the coast (see Figure 7). By zooming on one portion of the plan, we can see in Figure 8 the road section and its lanes. The total road width is 35 m, divided into five lanes for vehicles (beginning from the left): three towards the sea and the last two (one for buses and taxis) towards the center. Among these are stalls for car parks and tree-lined sidewalks. - Economic availability. The designer will have to consider the economic constraints. For the sake of the example, we assumed that the choice should fall on one of three budget levels, defined as low–middle–high; the budget will dictate the construction and manufacturing materials to be used according to the construction requirements specified in the tender. We assumed a middle budget.
- Cycle routes selection. The third step depends on the cycle path’s functions. In the case study, we had
- Cycle path in a promiscuous cycle–pedestrian path, with the same direction of travel as vehicular traffic, located in an area where there are accesses and parking lots.
- Standard design definition. The identification of the cycle path infrastructure location allows designers to select the best material combination according to the parameters proposed in Table 3, Table 4 and Table 5 above described. The cost is estimated in reference to a typical 1 km long segment placed in a straight line. The planimetric approach of the infrastructure allows designers to define the different types of straight and curved sections and to recalculate the entire route when the gradients vary.
- Road pavement section and its classification. The choice of the different types of flooring will depend on the type of materials used and on cost. To choose the package, both the available budget and the best suited type for the case study should be taken into account. The methodology therefore considers 4 different flooring packages (defined respectively P1, P2, P3, and P4) with different implementation budgets defined as low–middle–high that divide each type of package into three subcategories. The choice of the package therefore stems from the combination of economic and design choices. In our case study we considered packages with middle cost.
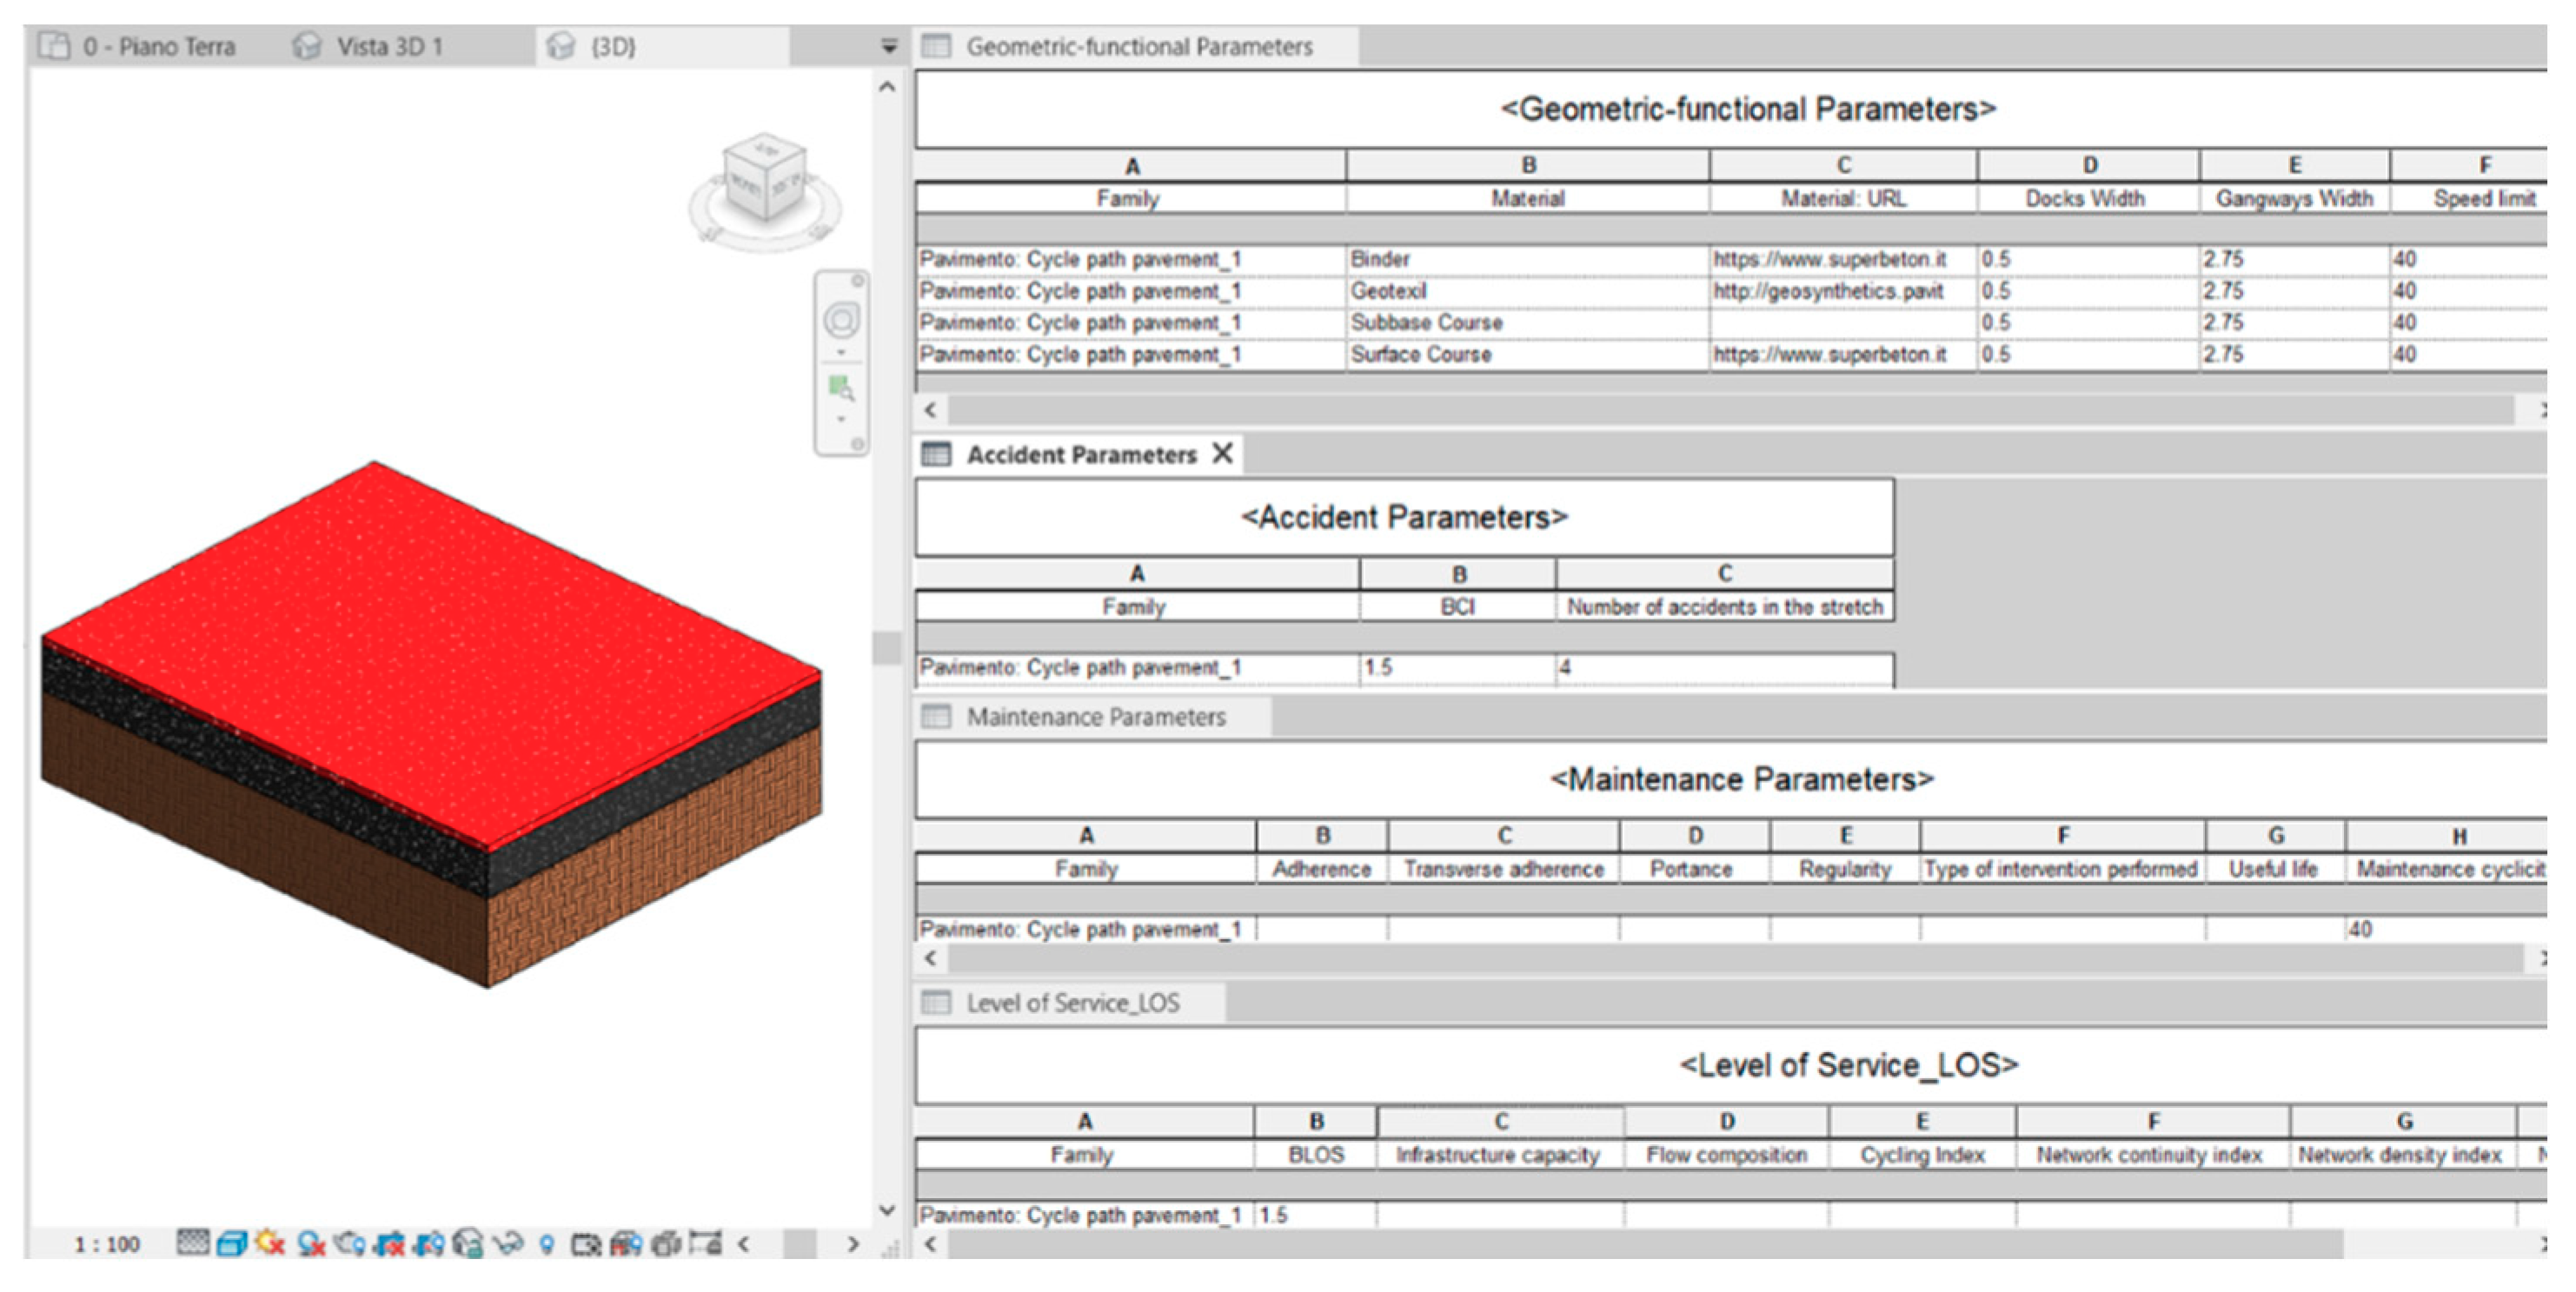
- BIM Revit software implementation. Revit allows users to create a three-dimensional model of the typological section considered, evaluating the best among different solutions.The requalification of monitored road infrastructure involved the variation of the vehicular flow directions in the lane on the left of the cross section proposed in Figure 8 and Figure 9. Furthermore, the introduction of a double bidirectional cycle lane was considered (previously vehicular lane and parallel parking area) located near the sidewalk on the right. An analysis of vehicle flows through sensors and video cameras allowed the evaluation of the flows entering and leaving the historic center, implementing a strategy to promote sustainable mobility by reducing vehicle mobility. It took into consideration the outgoing flow smaller than that entering the historical center and envisaged the widening of the sidewalks for the removal of architectural barriers, implementation of public green spaces, and the use of micro mobility. The presence of the parking lots located on the right side of the infrastructure was reallocated to easily accessible neighboring areas.Besides, shared parameters play a key role in a BIM design process because they can be called up through schedules and displayed in tabular form. They are updated in real time whenever a change is made by the user, who will be able to view the hypotheses with the relative ones through the creation of three schedules containing respectively:
- Geometrical–functional parameters;
- Safety parameters;
- Cost.
In Figure 10, by way of example, all the implemented parameters related to the first technology package are visible. - Final evaluation. The designer, after considering the functional geometrical aspect and selecting the eligible budget type, can evaluate which flooring package is the most suitable by looking at Table 8. It also allows the designer to consider the safety standards, considering minimum acceptable values in terms of BLOS and BCI, and also to define an incident range from the number of conflict points generated by the selected geometric combination.
5. Discussion and Conclusions
Author Contributions
Funding
Acknowledgments
Conflicts of Interest
References
- Together—Your Home Base to Face Pediatric Cancer. Available online: https://together.stjude.org/en-us/ (accessed on 18 May 2020).
- COVID-19: The Evolution of Bicycle and Pedestrian Activity Following Containment Measures—Eco-Counter. Available online: https://www.eco-compteur.com/en/blog/covid-19-the-evolution-of-bicycle-and-pedestrian-activity-following-containment-measures/ (accessed on 18 May 2020).
- Kamel Boulos, M.N.; Geraghty, E.M. Geographical tracking and mapping of coronavirus disease COVID-19/severe acute respiratory syndrome coronavirus 2 (SARS-CoV-2) epidemic and associated events around the world: How 21st century GIS technologies are supporting the global fight against outbreaks and epidemics. Int. J. Health Geogr. 2020, 19, 8. [Google Scholar] [CrossRef] [PubMed]
- Acampa, G.; Garcìa, J.O.; Grasso, M.; Diaz-Lopez, C. Project sustainability: Criteria to be introduced in BIM. Valori Valutazioni. 2019, N 23, 119–128. [Google Scholar]
- Szigeti, S.; Csiszár, C.; Földes, D. Information Management of Demand-responsive Mobility Service Based on Autonomous Vehicles. Procedia Eng. 2017, 187, 483–491. [Google Scholar] [CrossRef]
- Misso, F.E.; Pani, F.E.; Porru, S.; Repetto, C.; Sansone, U. Opportunities and boundaries of transport network telematics. In Proceedings of the 3rd World Congress on Civil, Structural, and Environmental Engineering, Budapest, Hungary, 8–10 April 2018. [Google Scholar]
- Wong, Y.Z.; Hensher, D.A.; Mulley, C. Mobility as a service (MaaS): Charting a future context. Transp. Res. Part A Policy Pract. 2020, 131, 5–19. [Google Scholar] [CrossRef]
- Canale, A.; Tesoriere, G.; Campisi, T. The MAAS development as a mobility solution based on the individual needs of transport users. AIP Conf. Proc. 2019, 2186, 160005. [Google Scholar] [CrossRef]
- Földes, D.; Csiszár, C. Conception of future integrated smart mobility. In Proceedings of the 2016 Smart Cities Symposium Prague (SCSP), Prague, Czech Republic, 26–27 May 2016; pp. 1–6. [Google Scholar] [CrossRef]
- Midgley, P.M. Bicycle-Sharing Schemes: Enhancing Sustainable Mobility in Urban Areas; Department of Economics and Social Affairs: New York, NY, USA, 2011. [Google Scholar]
- O’Brien, O.; Cheshire, J.; Batty, M. Mining bicycle sharing data for generating insights into sustainable transport systems. J. Transp. Geogr. 2014, 34, 262–273. [Google Scholar] [CrossRef]
- Pogačar, K.; Dežan, L.; Lamot, M.; Renčelj, M. Determinants of Bicycle Use among Student Population: Exploratory Research of Social and Infrastructure Factors. ASI 2020, 3, 6. [Google Scholar] [CrossRef]
- Paschalidis, E.; Prodromou, M.; Basbas, S.; Politis, I. Investigation of Cyclists’ Attitudes and Perceptions Towards other Road Users: Evidence from a Case Study in Thessaloniki, Greece. IJT 2017, 5, 33–46. [Google Scholar] [CrossRef]
- Suárez Rojas, S.M.; Garcia Galindo, J.A. Análisis del Comportamiento de las dos Últimas Estrategias Comunicativas “Plan Bici” y “mi Estilo es bici” que Permiten la Viabilidad de la Actual Campaña de Enrique Peñalosa Londoño. Alcalde mayor de Bogotá Decreto 596 (2014). Sistema de Bicicletas Públicas. Recuperado de. Available online: http://www.alcaldiabogota.gov.co/sisjur/consulta_tematica.htm (accessed on 8 June 2016).
- Nikiforiadis, A.; Basbas, S. Can pedestrians and cyclists share the same space? The case of a city with low cycling levels and experience. Sustain. Cities Soc. 2019, 46, 101453. [Google Scholar] [CrossRef]
- Acampa, G.; Marino, G.; Ticali, D. Validation of infrastructures through BIM. AIP Conf. Proc. 2019, 2186, 160011. [Google Scholar] [CrossRef]
- BIM Handbook: A Guide to Building Information Modeling for Owners, Managers, Designers, Engineers and Contractors, 2nd ed.; Eastman, C.M., Ed.; Wiley: Hoboken, NJ, USA, 2011; ISBN 978-0-470-54137-1. [Google Scholar]
- Acampa, G.; Contino, F.; Grasso, M.; Ticali, D. Evaluation of infrastructure: Application of TOD to Catania underground metro station. AIP Conf. Proc. 2019, 2186, 160010. [Google Scholar] [CrossRef]
- Acampa, G.; Crespo Cabillo, I.; Marino, G. Representación del dibujo frente a simulación de los sistemas BIM. Oportunidad o amenaza para la arquitectura. ACE Archit. City Environ. 2019, 14, 111. [Google Scholar] [CrossRef]
- Acampa, G.; Forte, F.; De Paola, P.B.I.M. Models and Evaluations. In Values and Functions for Future Cities; Mondini, G., Oppio, A., Stanghellini, S., Bottero, M., Abastante, F., Eds.; Springer International Publishing: Cham, Switzerland, 2020; pp. 351–363. ISBN 978-3-030-23784-4. [Google Scholar] [CrossRef]
- Dave, B.; Boddy, S.; Koskela, L. Challenges and opportunities in implementing lean and BIM on an infrastructure project. In Proceedings of the 21st Annual Conference of the International Group for Lean Construction 2013, IGLC 2013, Fortaleza, Brazil, 29 July–2 August 2013; pp. 741–750. [Google Scholar]
- Sarkar, D. Risk Based Building Information Modeling (BIM) for Urban Infrastructure Transportation Project. Int. J. Struct. Constr. Eng. 2016, 10, 1022–1026. [Google Scholar]
- Dell’Acqua, G. BIM per infrastrutture. Il Building Information Modeling per le grandi opere lineari; EPC Editore: Roma, Italy, 2018; p. 125. Available online: https://www.libroco.it/english/dl/Gianluca-Dell-Acqua/EPC/9788863108804/BIM-per-infrastrutture-Il-Building-Information-Modeling-per-le-grandi-opere-lineari/cw989203458380784.html (accessed on 8 June 2020).
- Lu, Q. Evaluation of the BIM Adoption for Civil Infrastructure and Development of a 5D BIM Financial Decision Making Framework; The Hong Kong University of Science and Technology: Clear Water Bay: Hong Kong, China, 2015; p. b1514765. [Google Scholar]
- Holmström, J.; Singh, V.; Främling, K. BIM as Infrastructure in a Finnish HVAC Actor Network: Enabling Adoption, Reuse, and Recombination over a Building Life Cycle and between Projects. J. Manag. Eng. 2015, 31. [Google Scholar] [CrossRef]
- Heikkilä, R.; Kaaranka, A.; Makkonen, T. Information Modelling Based Tunnel Design and Construction Process. In Proceedings of the 31st International Symposium on Automation and Robotics in Construction and Mining, Sydney, Australia, 9–11 July 2014; pp. 672–675. [Google Scholar]
- Neves, J.; Sampaio, Z.; Vilela, M. A Case Study of BIM Implementation in Rail Track Rehabilitation. Infrastructures 2019, 4, 8. [Google Scholar] [CrossRef]
- Liu, W.; Guo, H.; Li, H.; Li, Y. Retracted: Using BIM to Improve the Design and Construction of Bridge Projects: A Case Study of a Long-Span Steel-Box Arch Bridge Project. Int. J. Adv. Robot. Syst. 2014, 11, 125. [Google Scholar] [CrossRef]
- Marzouk, M.; Hisham, M.; Ismail, S.; Youssef, M.; Seif, O. On the use of Building Information Modeling in Infrastructure Bridges. In Proceedings of the 27th International Conference on Applications of IT in the AEC Industry, Cairo, Egypt, 16–18 November 2010. [Google Scholar]
- Chen, J.; Bulbul, T.; Taylor, J.E.; Olgun, G. A Case Study of Embedding Real-time Infrastructure Sensor Data to BIM. In Proceedings of the Construction Research Congress, Atlanta, GA, USA, 19–21 May 2014; American Society of Civil Engineers: Atlanta, Georgia, 2014; pp. 269–278. [Google Scholar] [CrossRef]
- Bruhova Foltynova, H.; Braun Kohlova, M. Cost-Benefit Analysis of Cycling Infrastructure: A Case Study of Pilsen; Charles University Environment (Prague): Prague, Czech Republic, 2002. [Google Scholar]
- Main, H.E. Cost-Benefit Analysis of Building Bicycle Lanes in Truro, Nova Scotia; Acadia University: Wolfville, NS, Canada, 2013. [Google Scholar]
- CodiceAppalti.it—Codice Degli Appalti e Delle Concessioni (DLgs 50-2016). Available online: https://www.codiceappalti.it/ (accessed on 14 May 2020).
- Campisi, T.; Tibljaš, A.D.; Tesoriere, G.; Canale, A.; Rencelj, M.; Šurdonja, S. Cycling traffic at turbo roundabouts: Some considerations related to cyclist mobility and safety. Transp. Res. Procedia 2020, 45, 627–634. [Google Scholar] [CrossRef]
- Implementing BIM for Infrastructure Guide|Autodesk. Available online: https://www.autodesk.com/solutions/bim/hub/bim-for-infrastructure-implementation-guide (accessed on 14 May 2020).
- Beura, S.K.; Bhuyan, P.K. Development of a bicycle level of service model for urban street segments in mid-sized cities carrying heterogeneous traffic: A functional networks approach. J. Traffic Transp. Eng. (Engl. Ed.) 2017, 4, 503–521. [Google Scholar] [CrossRef]
- Renčelj, M.; Campisi, T.; Canale, A.; Tesoriere, G. The Developing Benefits of the Advance Space Line (ASL) Systems for Planning Safer Traffic Light Intersections; AIP Publishing LLC: Rhodes, Greece, 2019; p. 160007. [Google Scholar]
- Landis, B.W.; Vattikuti, V.R.; Brannick, M.T. Real-Time Human Perceptions: Toward a Bicycle Level of Service. Transp. Res. Rec. 1997, 1578, 119–126. [Google Scholar] [CrossRef]
- Comune di Catania Piano Generale del Traffico Urbano. Comune di Catania. Available online: https://www.comune.catania.it/il-comune/uffici/piano-generale-del-traffico-urbano/ (accessed on 7 January 2020).


|
|
|
|
|
|
|
|
|
|
|
|
|
|
|
| Combination | Parking Area Closed to Cycle Path | Type of Lane | Motorized Vehicle Lane | |||
|---|---|---|---|---|---|---|
| B1 | B2 | L1 | L2 | D1 | D2 | |
| Presence | Absence | Dedicated Lane | Promiscuous Lane | One Direction | Double Direction | |
| R1 | • | • | • | |||
| R2 | • | • | • | |||
| R3 | • | • | • | |||
| R4 | • | • | • | |||
| R5 * | • | • | • | |||
| R6 * | • | • | • | |||
| R7 * | • | • | • | |||
| R8 * | • | • | • | |||
| Area | Possible Combination | Preferable Combination | Combinations Rarely Implemented/Not Allowed |
|---|---|---|---|
| A1 | R1 | R3 R4 | n.v. |
| R2 | |||
| R3 | |||
| A2 | R3 | * R5 | |
| * R6 | |||
| * R7 | |||
| R4 | * R8 | ||
| A3 | R3 | * R5 | |
| R4 | * R7 |
| Minimum Width | (cm) |
|---|---|
| Cycle path width single lane | 125 |
| Cycle path width double lanes (one or double direction) | 250 |
| Cycle path width single lane and lateral curbs | 125 |
| Cycle path width double lanes and lateral curbs | 250 |
| Promiscuous paths (pedestrian + cyclist) | 250 (150 cyclist + 100 pedestrian) |
| Curbs width | 50 cm |
| Lateral marking signs | 20–25 cm |
| Max Slope | Max Extension (m) |
|---|---|
| Usual longitudinal slope (max 5%) | changing value |
| Longitudinal slope (max 12%) | 12 m |
| Longitudinal slope (max 6%) | 100 m |
| Transversal slope (max 2.5%) (for rainwater disposal) | changing value |
| Min Width | (cm) |
|---|---|
| Traffic island or green island | 50 |
| Curbs (for low speed) | 30 |
| Index | Parameters | Comparison LOS/BLOS |
|---|---|---|
| BLOS | Average Daily Traffic (ADT) Traffic volume N° lane Max speed Pavement condition range | LOS = A BLOS ≤ 1.50 |
| LOS = B BLOS = 1.51–2.50 | ||
| LOS = C BLOS = 2.51–3.50 | ||
| LOS = D BLOS = 3.51 4.50 | ||
| LOS = E BLOS = 4.51–5–50 | ||
| LOS = F BLOS ≥ 5.50 | ||
| Index | Parameters | Comparison LOS/BCI |
| BCI | Presence of cycle path and roadside pavement | LOS = A BCI ≤ 1.50 |
| Presence of parking area and traffic islands | LOS = B BCI = 1.51–2.30 | |
| Cycle paths width or roadside pavement | LOS = C BCI = 2.31–3.40 | |
| Traffic volume related to the lane closed to sidewalk | LOS = D BCI = 3.41–4.40 | |
| or other lanes | LOS = E BCI = 4.41–5.30 | |
| Speed of traffic flow (km/h) | LOS = F BCI ≥ 5.30 |
| Area | ID | Safety Index | Pavement | |||||
|---|---|---|---|---|---|---|---|---|
| Min BLOS | Min BCI | Supposed Accidents | Colored Binder | Road Dust Removal | Single Layer | Double Layer | ||
| P1—Low | P2—Low | P3—Low | P4—Low | |||||
| P1—Middle | P2—Middle | P3—Middle | P4—Middle | |||||
| P1—High | P2—High | P3—High | P4—High | |||||
| A1 | R1 | B | B | low number | P1—middle/P2—middle | |||
| R2 | C | C | middle number | P1—low/P2—low | ||||
| R3 | B | B | low number | P1—middle/P2—middle | ||||
| R4 | A | A | absence | P1—high/P2—high | ||||
| A2 | R3 | B | B | low number | P3—middle/P4—middle | |||
| R4 | A | A | absence | P3—high/P4—high | ||||
| * R5-*R6-*R7-*R8 | C | C | middle number | P3—middle/P4—middle/P3—low/P4—low | ||||
| A3 | R3 | B | B | low number | P3—low/P4—low/P3-middle/P4—middle | |||
| R4 | A | A | absence | P3—high/P4—high | ||||
| * R7-*R8 | B | B | low number | P3—middle/P4—middle | ||||
© 2020 by the authors. Licensee MDPI, Basel, Switzerland. This article is an open access article distributed under the terms and conditions of the Creative Commons Attribution (CC BY) license (http://creativecommons.org/licenses/by/4.0/).
Share and Cite
Campisi, T.; Acampa, G.; Marino, G.; Tesoriere, G. Cycling Master Plans in Italy: The I-BIM Feasibility Tool for Cost and Safety Assessments. Sustainability 2020, 12, 4723. https://doi.org/10.3390/su12114723
Campisi T, Acampa G, Marino G, Tesoriere G. Cycling Master Plans in Italy: The I-BIM Feasibility Tool for Cost and Safety Assessments. Sustainability. 2020; 12(11):4723. https://doi.org/10.3390/su12114723
Chicago/Turabian StyleCampisi, Tiziana, Giovanna Acampa, Giorgia Marino, and Giovanni Tesoriere. 2020. "Cycling Master Plans in Italy: The I-BIM Feasibility Tool for Cost and Safety Assessments" Sustainability 12, no. 11: 4723. https://doi.org/10.3390/su12114723
APA StyleCampisi, T., Acampa, G., Marino, G., & Tesoriere, G. (2020). Cycling Master Plans in Italy: The I-BIM Feasibility Tool for Cost and Safety Assessments. Sustainability, 12(11), 4723. https://doi.org/10.3390/su12114723