Street Network Resilience Put to the Test: The Dramatic Crash of Genoa and Bologna Bridges


Abstract
1. Introduction
2. Literature Review
2.1. Urban Resilience
2.2. Resilience of Urban Form
2.3. Street Network Resilience
2.4. Resilience Indices
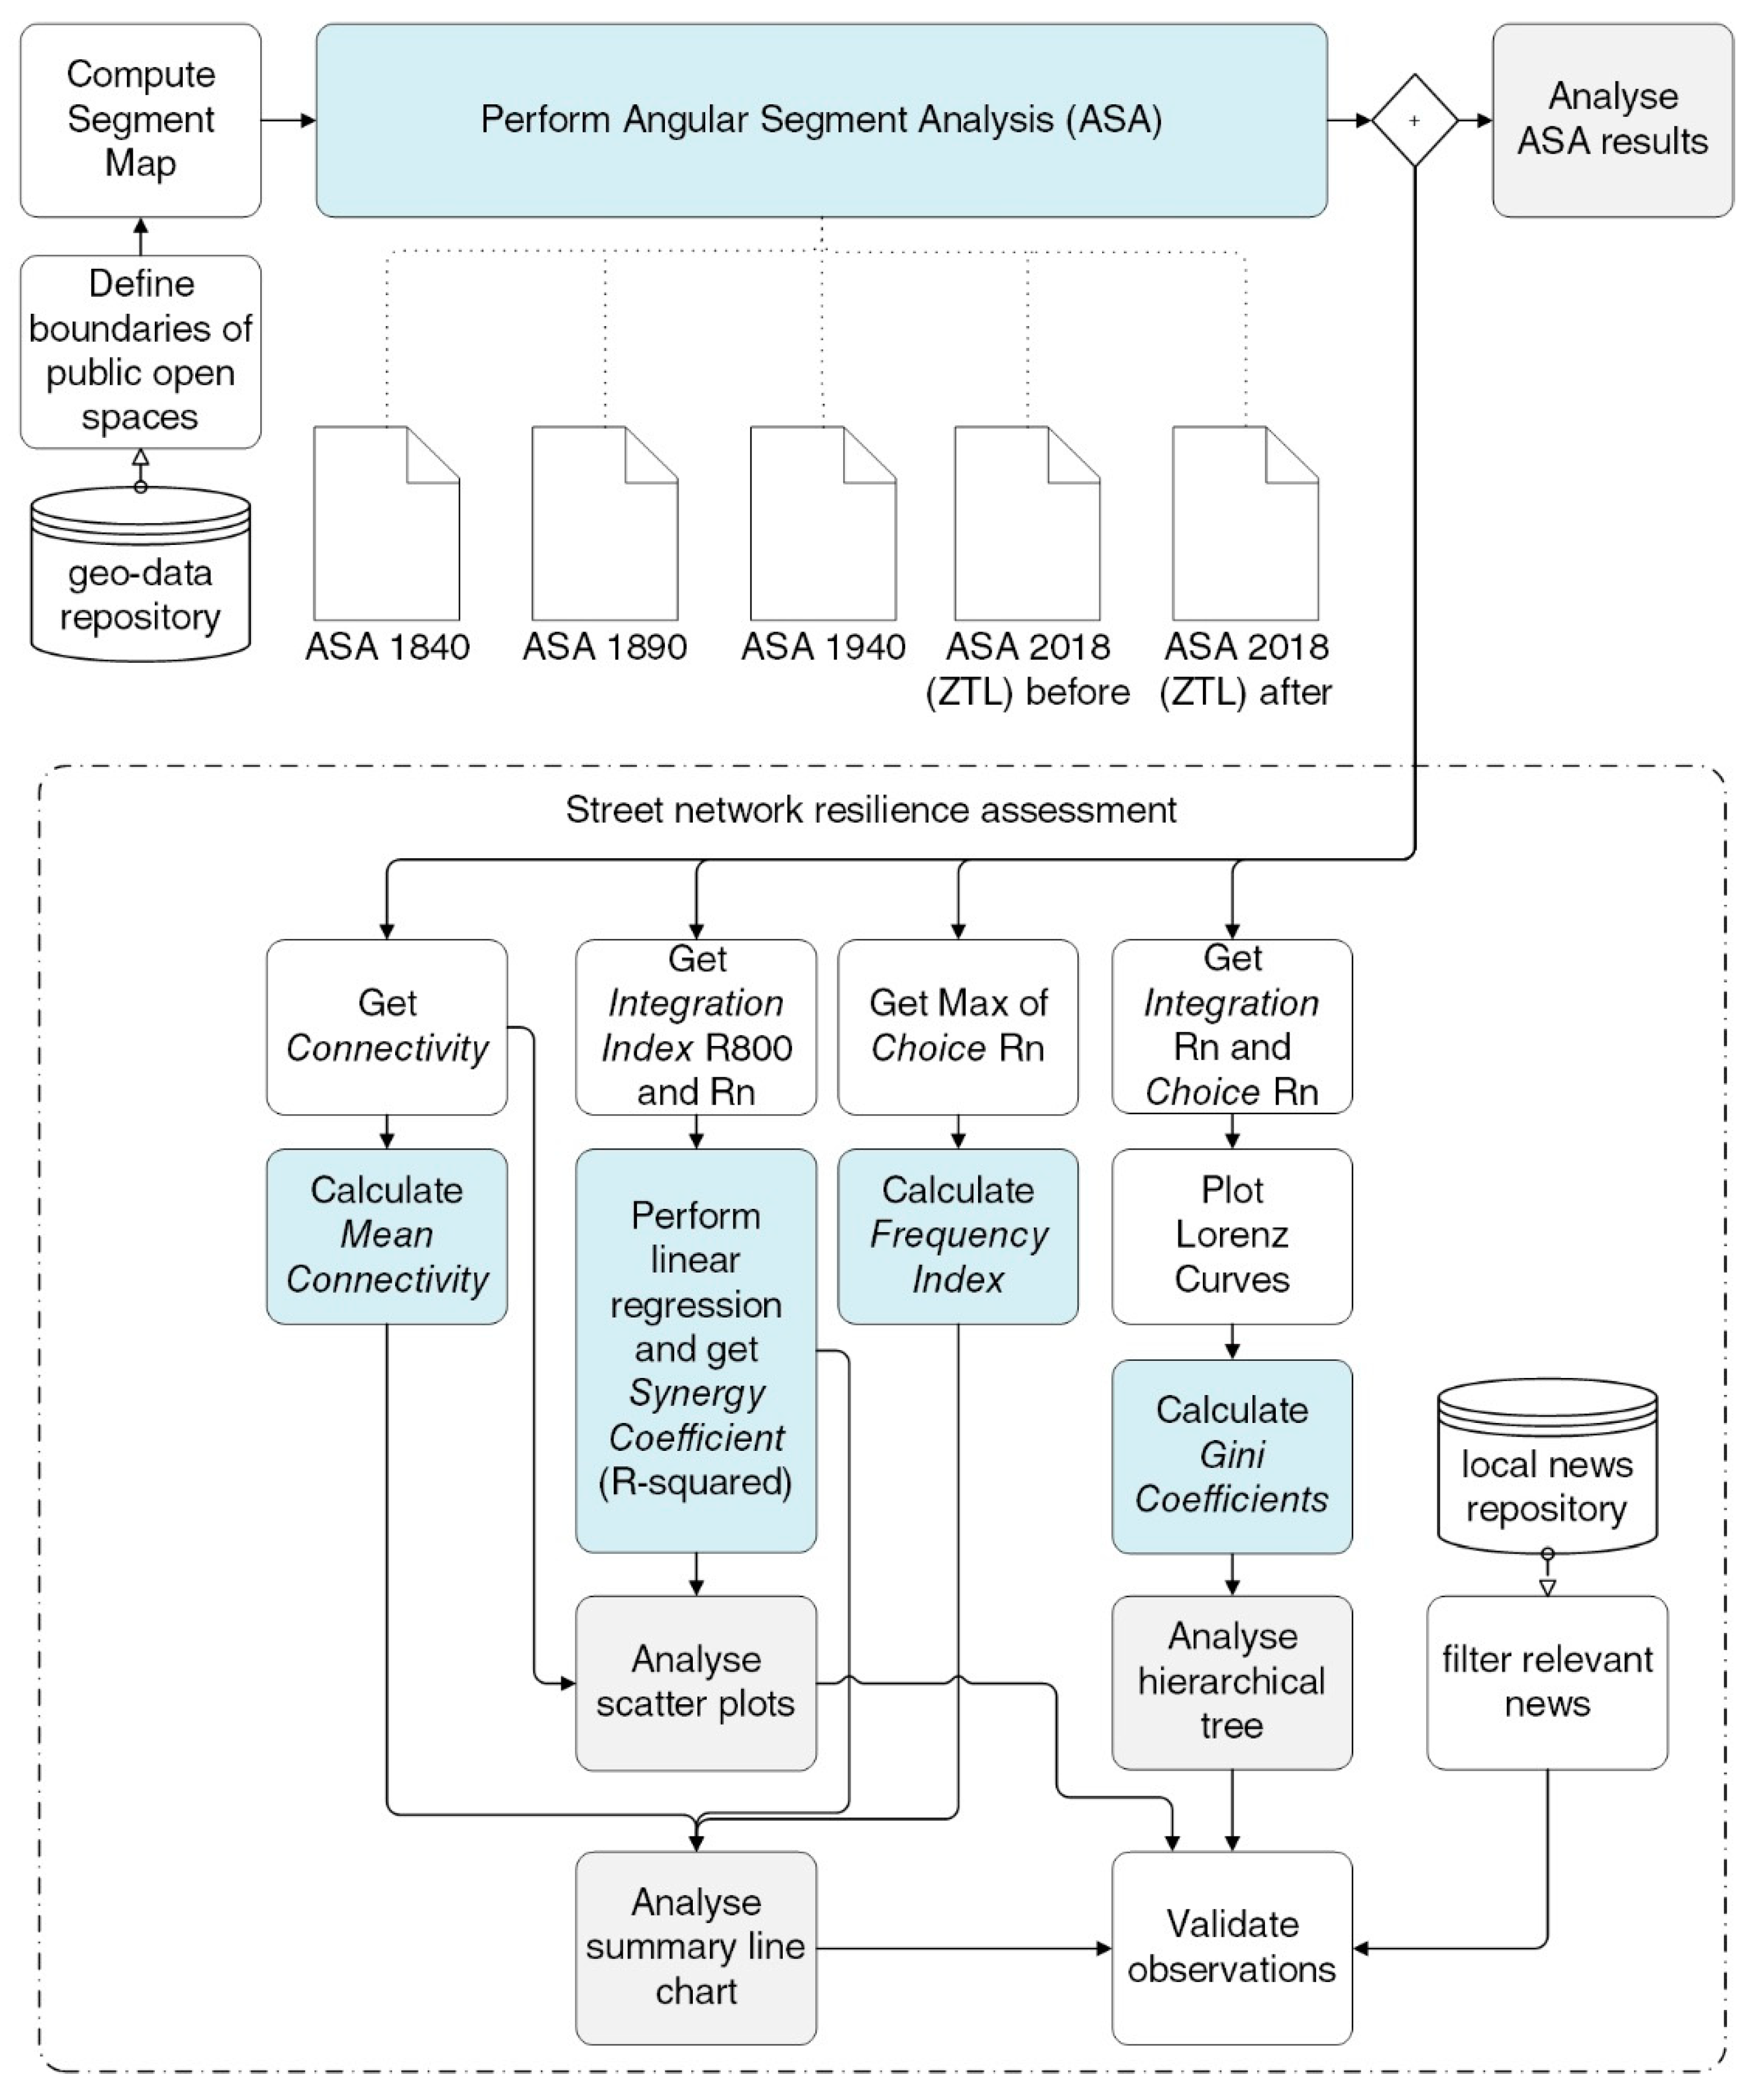
3. Materials and Methods
3.1. Angular Segment Analysis
3.2. Street Network Resilience Assessment
4. Street Network Resilience Indices
- Connectivity: presence of road intersections supporting mutual interaction.
- Redundancy: availability of several path alternatives.
- Robustness: road system designed to contain the effect of localised failures.
- Independence: ability to continue operating after a disaster without the need for physical interventions.
- Efficiency: presence of a hierarchic distribution of accessibility levels.
- Diversity: presence of different types of roads with different functions and accessibility levels.
4.1. Mean Connectivity
4.2. Frequency Index
4.3. Synergy Coefficient
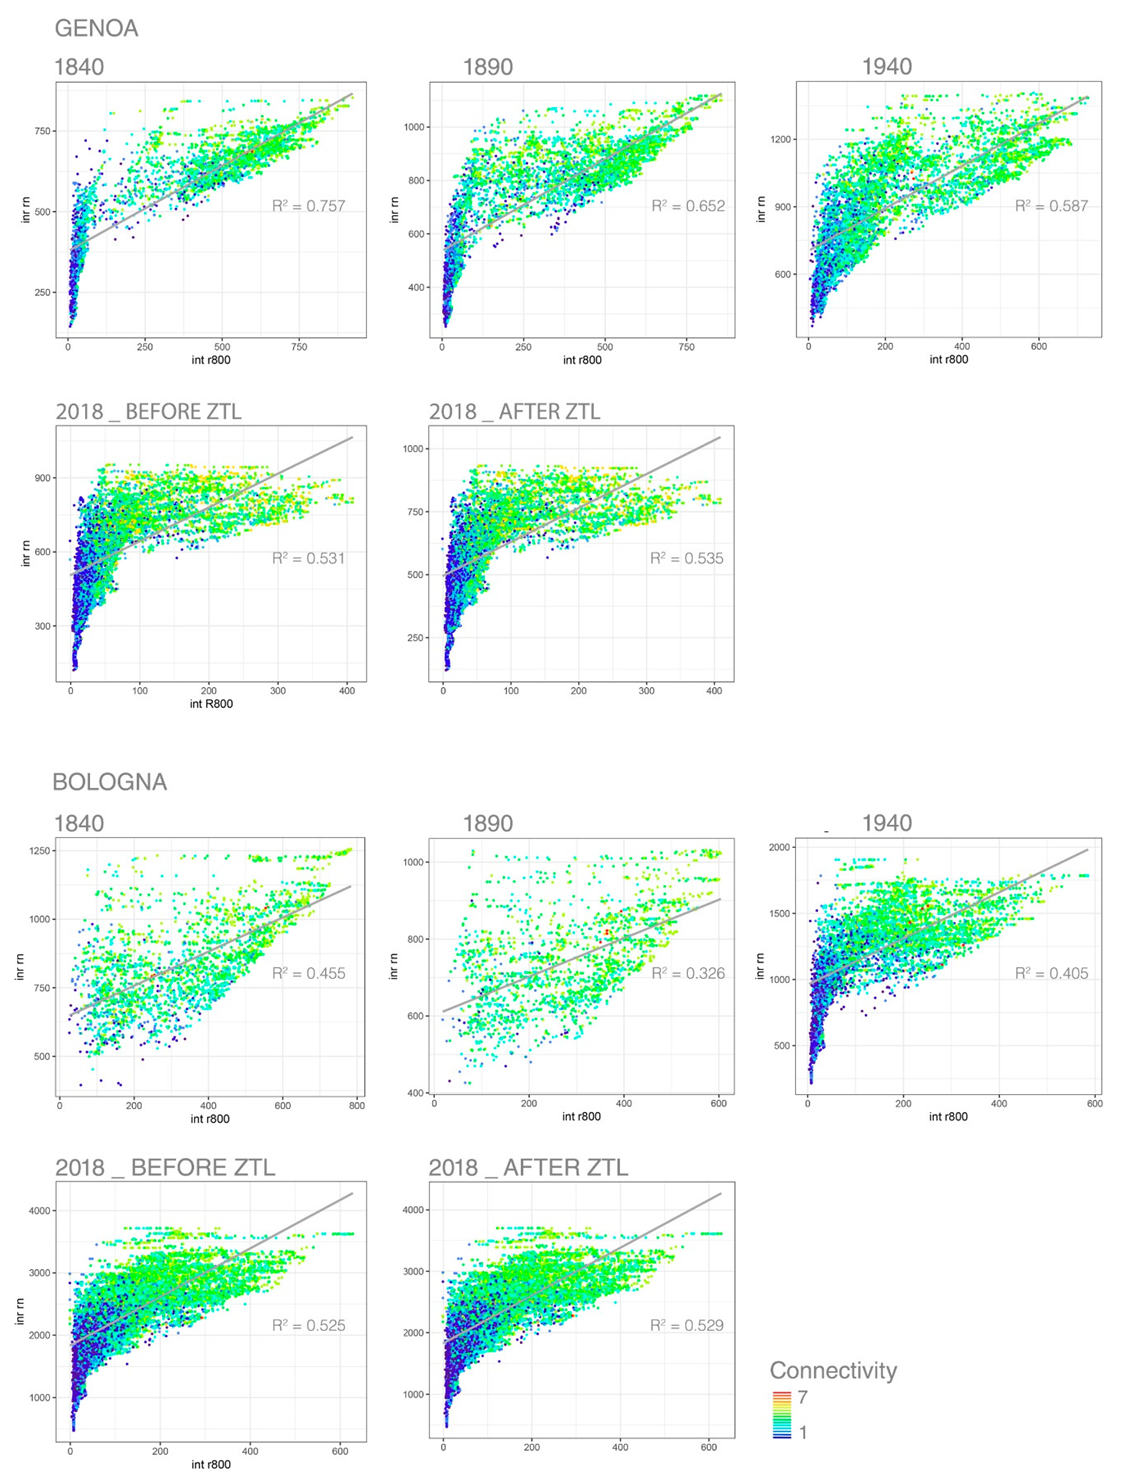
4.4. Gini Coefficient
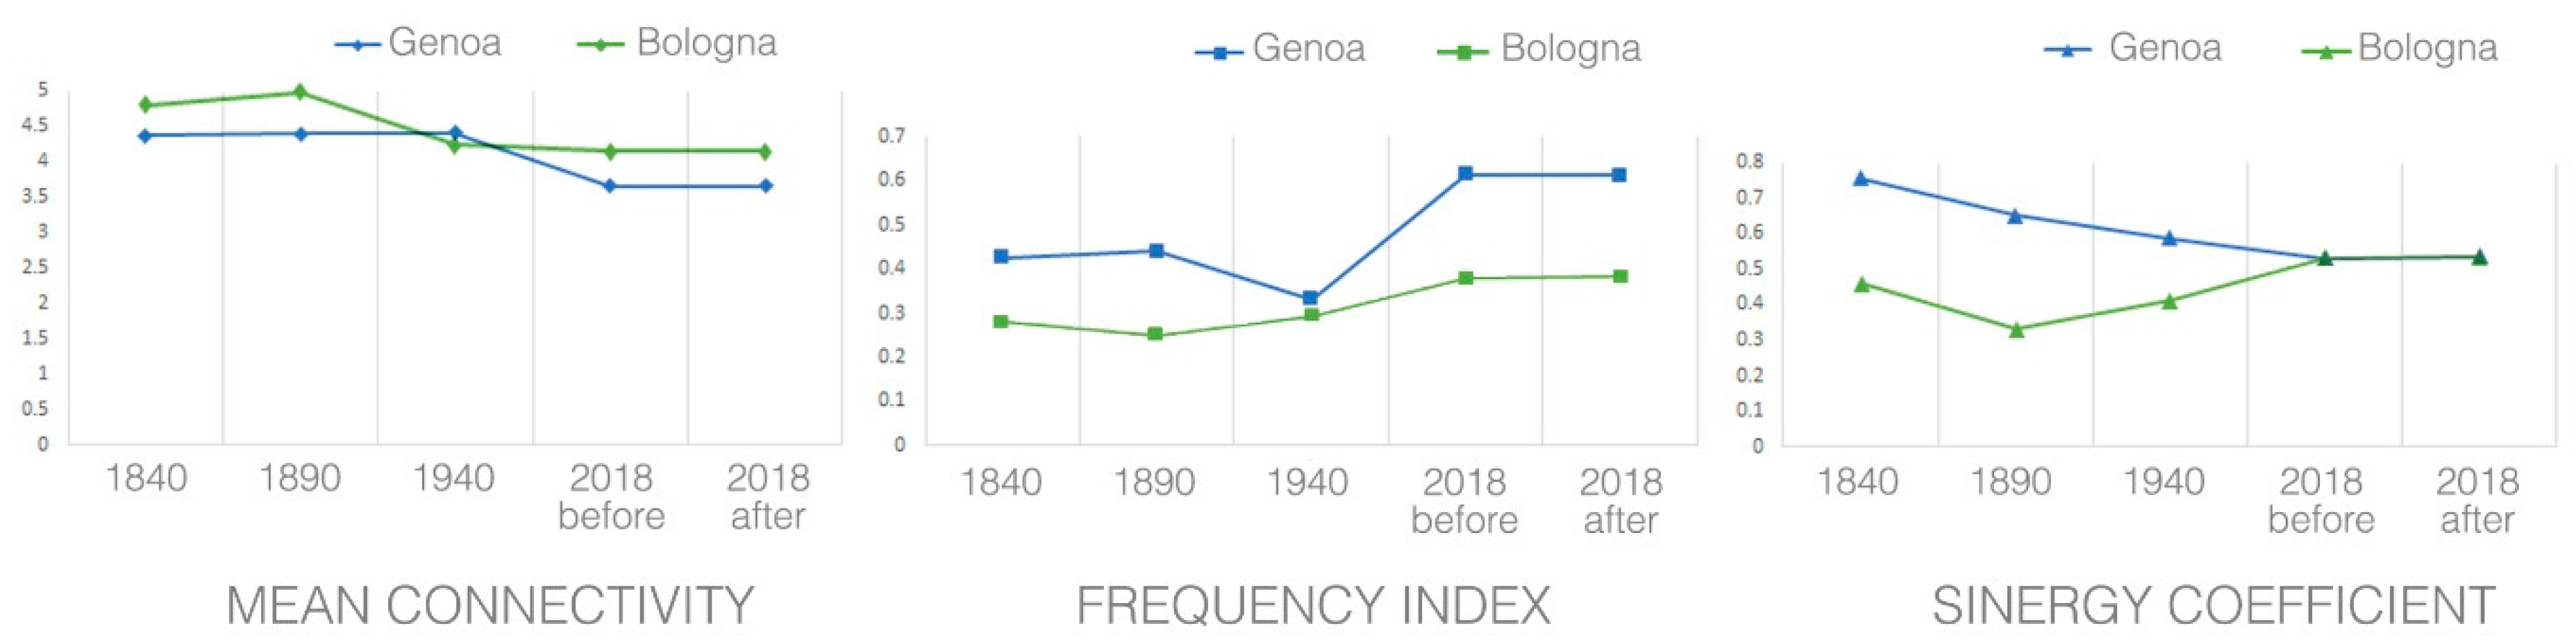
5. Results
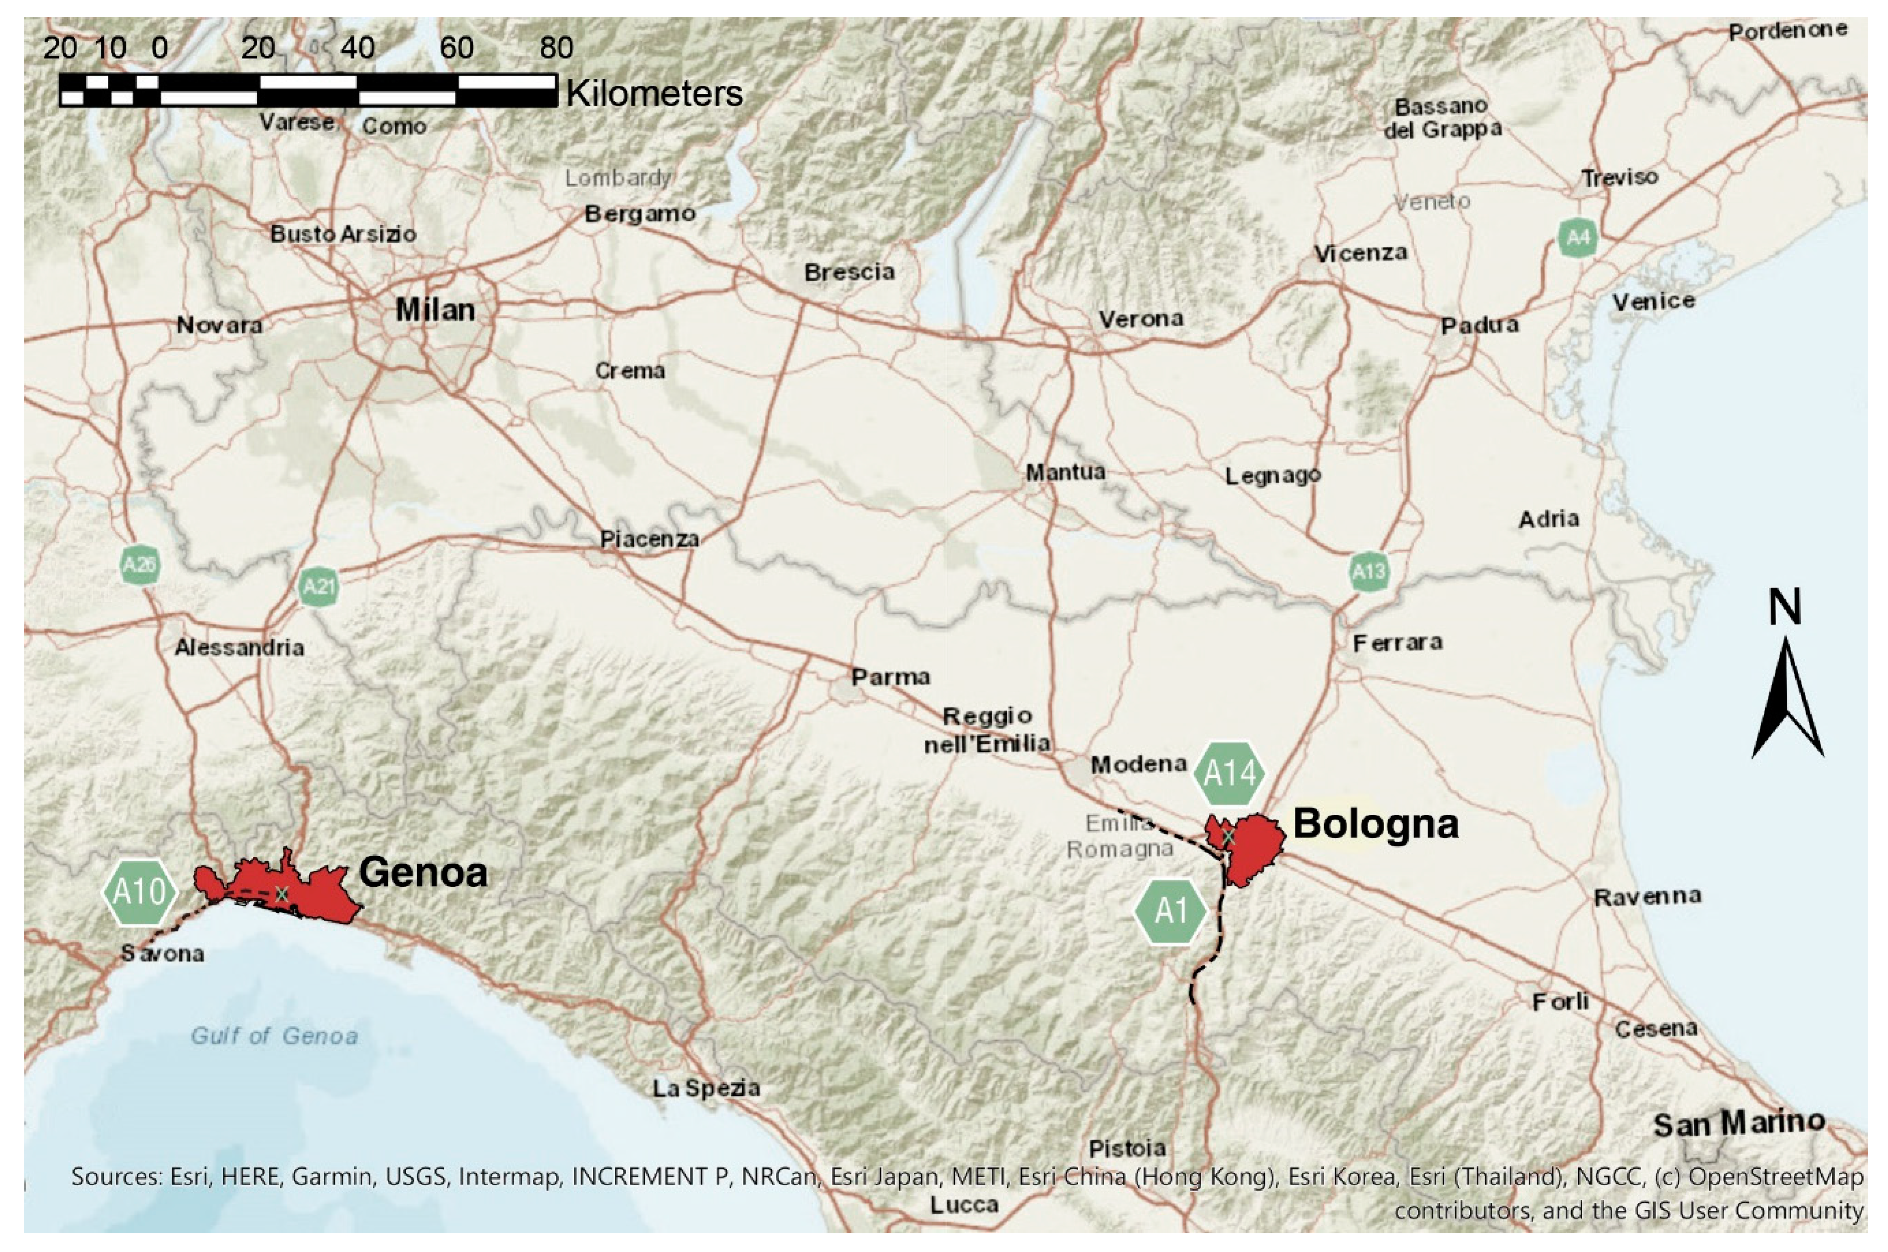
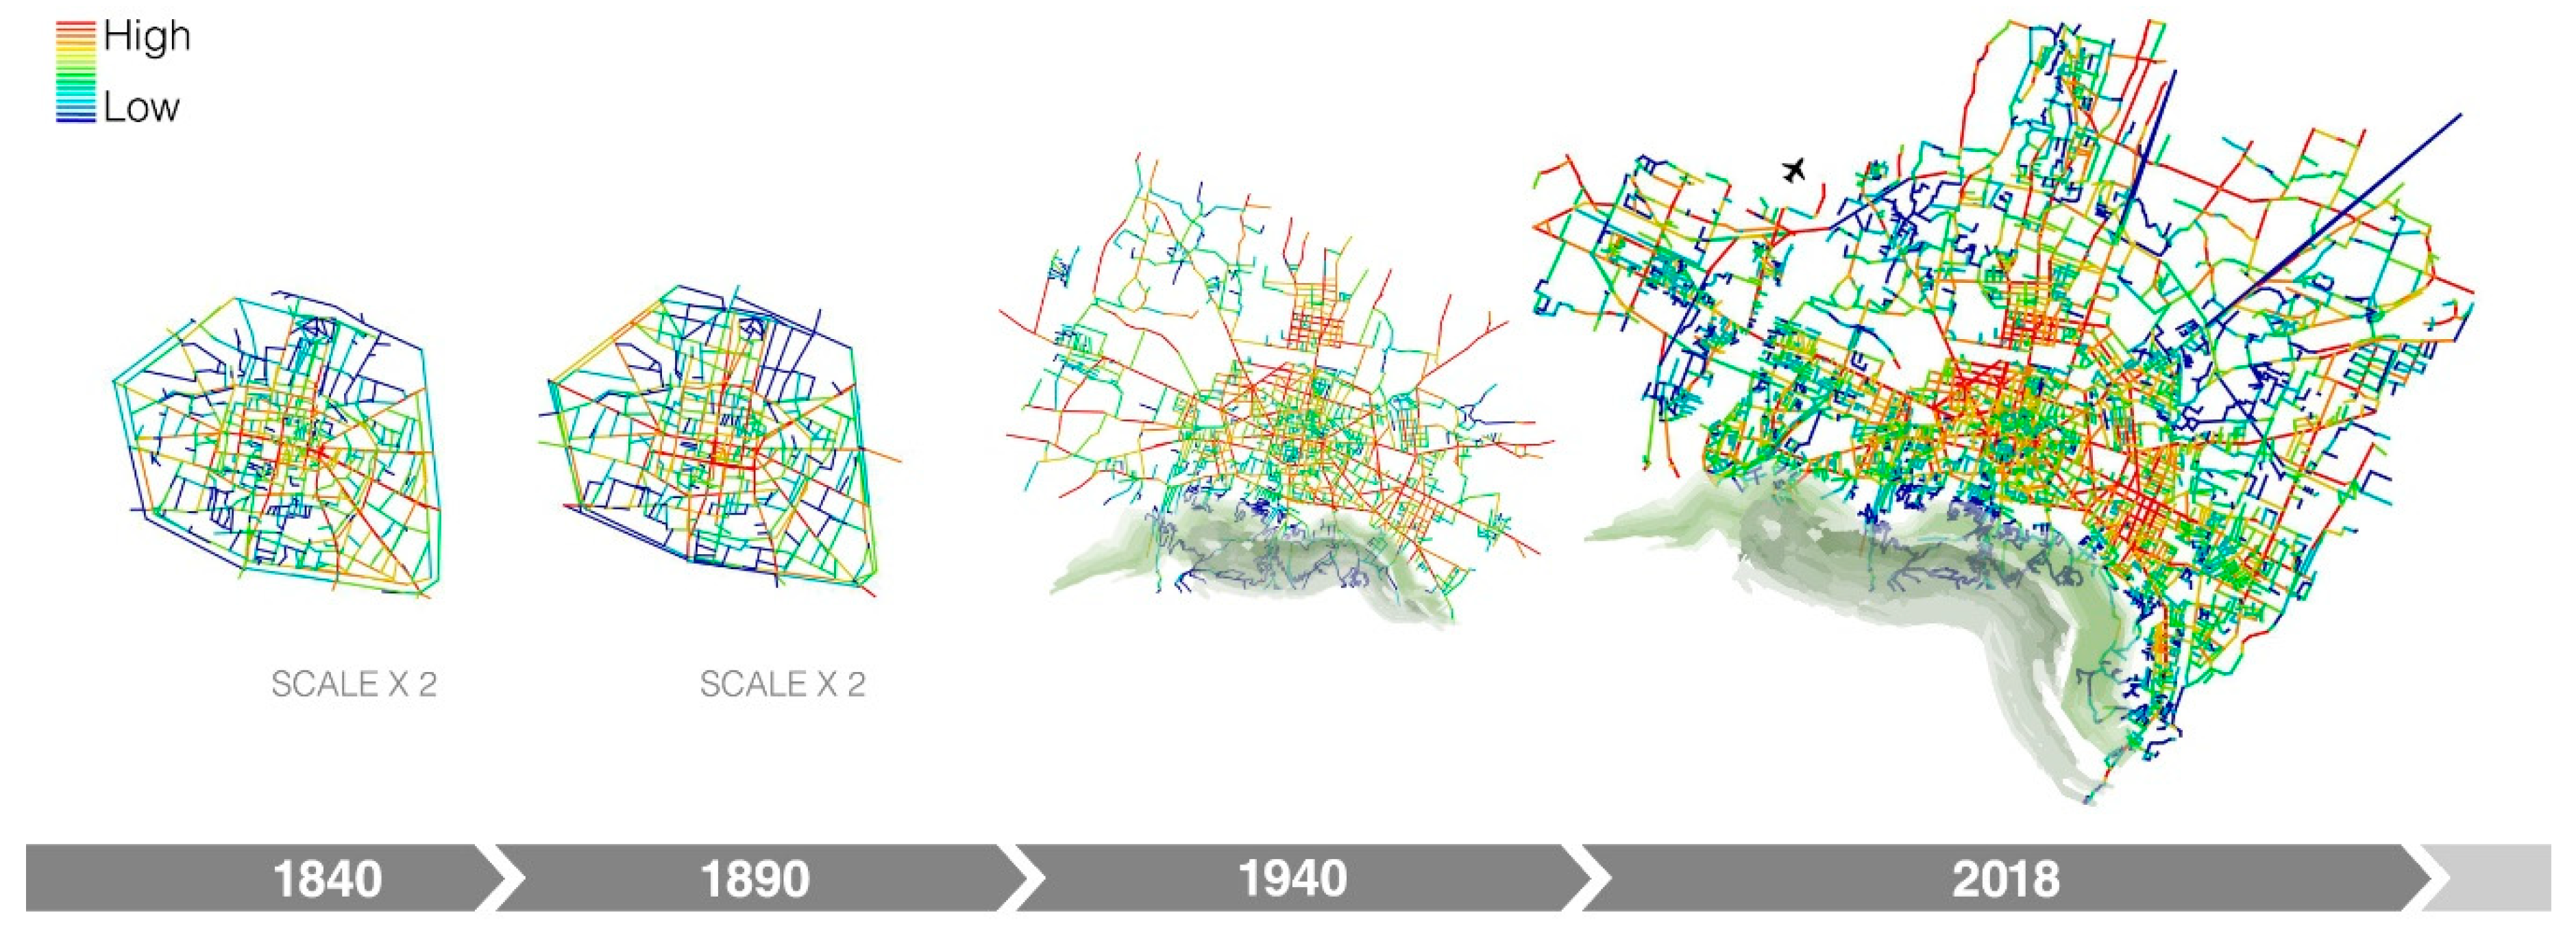
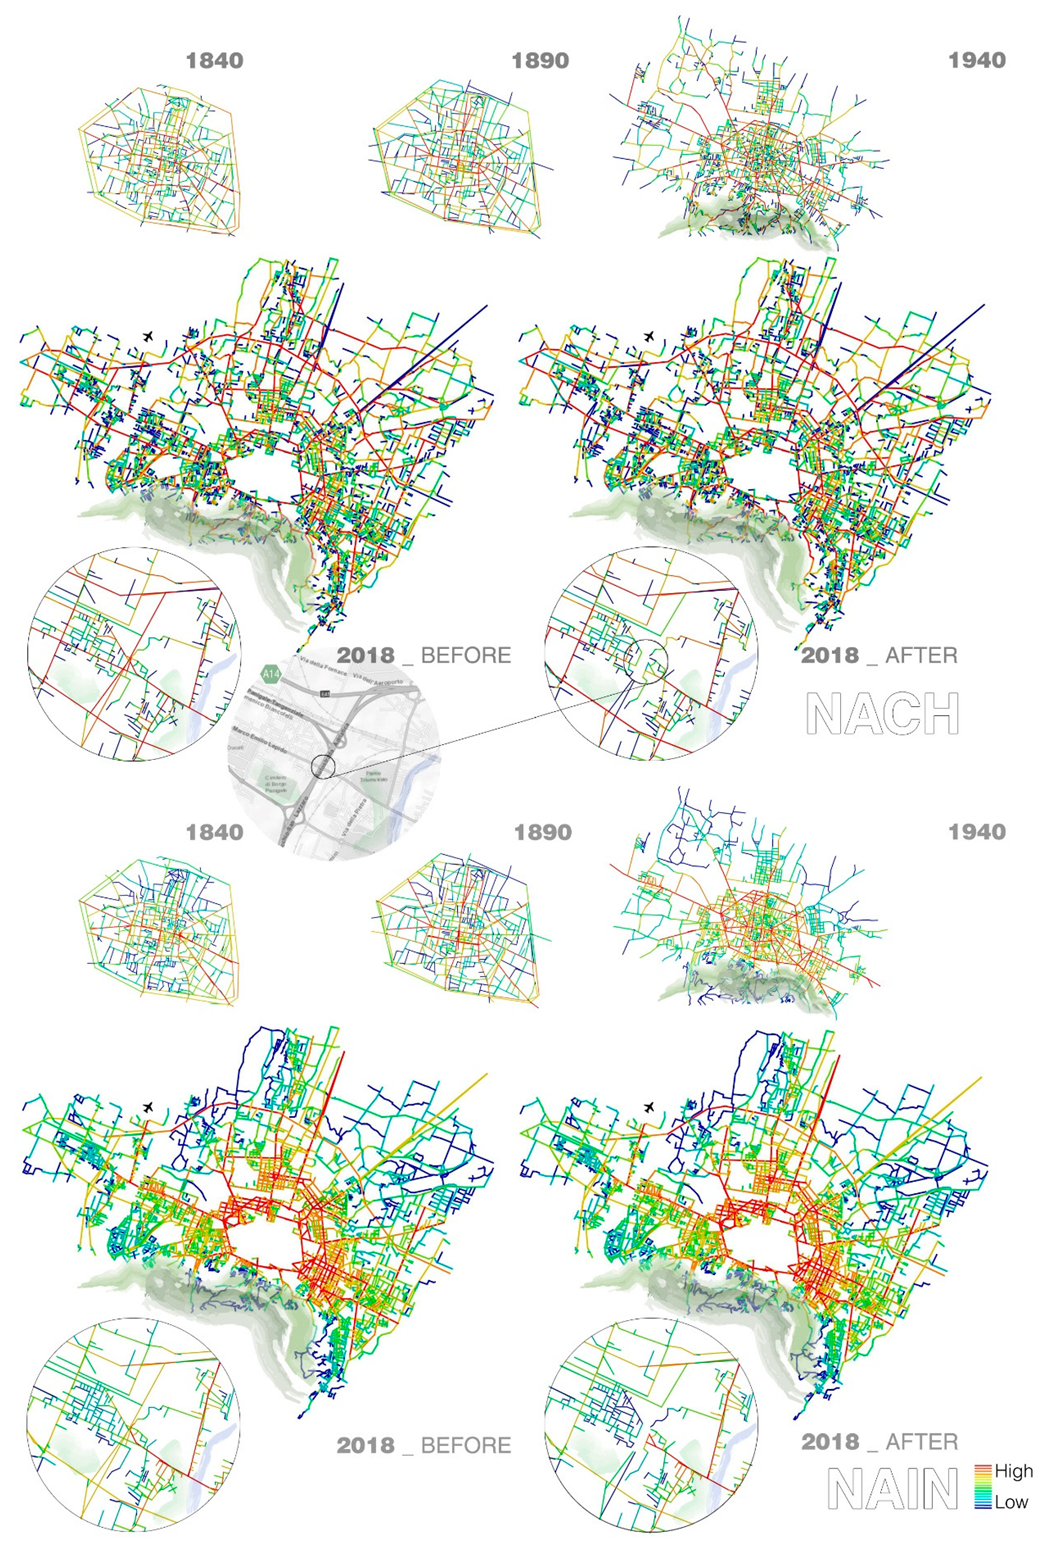
5.1. Case Studies
- Bologna and Genoa are both medium sized cities, with 400,000 and 850,000 inhabitants, respectively.
- During the last century, both cities have grown around their walled historic centres, so as to integrate within a wider conurbation several minor settlements present in their surroundings.
- Both disasters have stricken one of the most congested spatial elements of the road network, namely a bridge ordinarily subjected to crowding due to a continuous and intense vehicular traffic.
- Both bridges belonged to a motorway passing through a metropolitan area.
- The collapse of both bridges provoked a larger crisis affecting the road network system at a national, regional and urban scale.
- In both cases a large part of the traffic flowing in the destroyed motorway sections was originated from vehicles moving from an origin to a destination within the urban area [50].
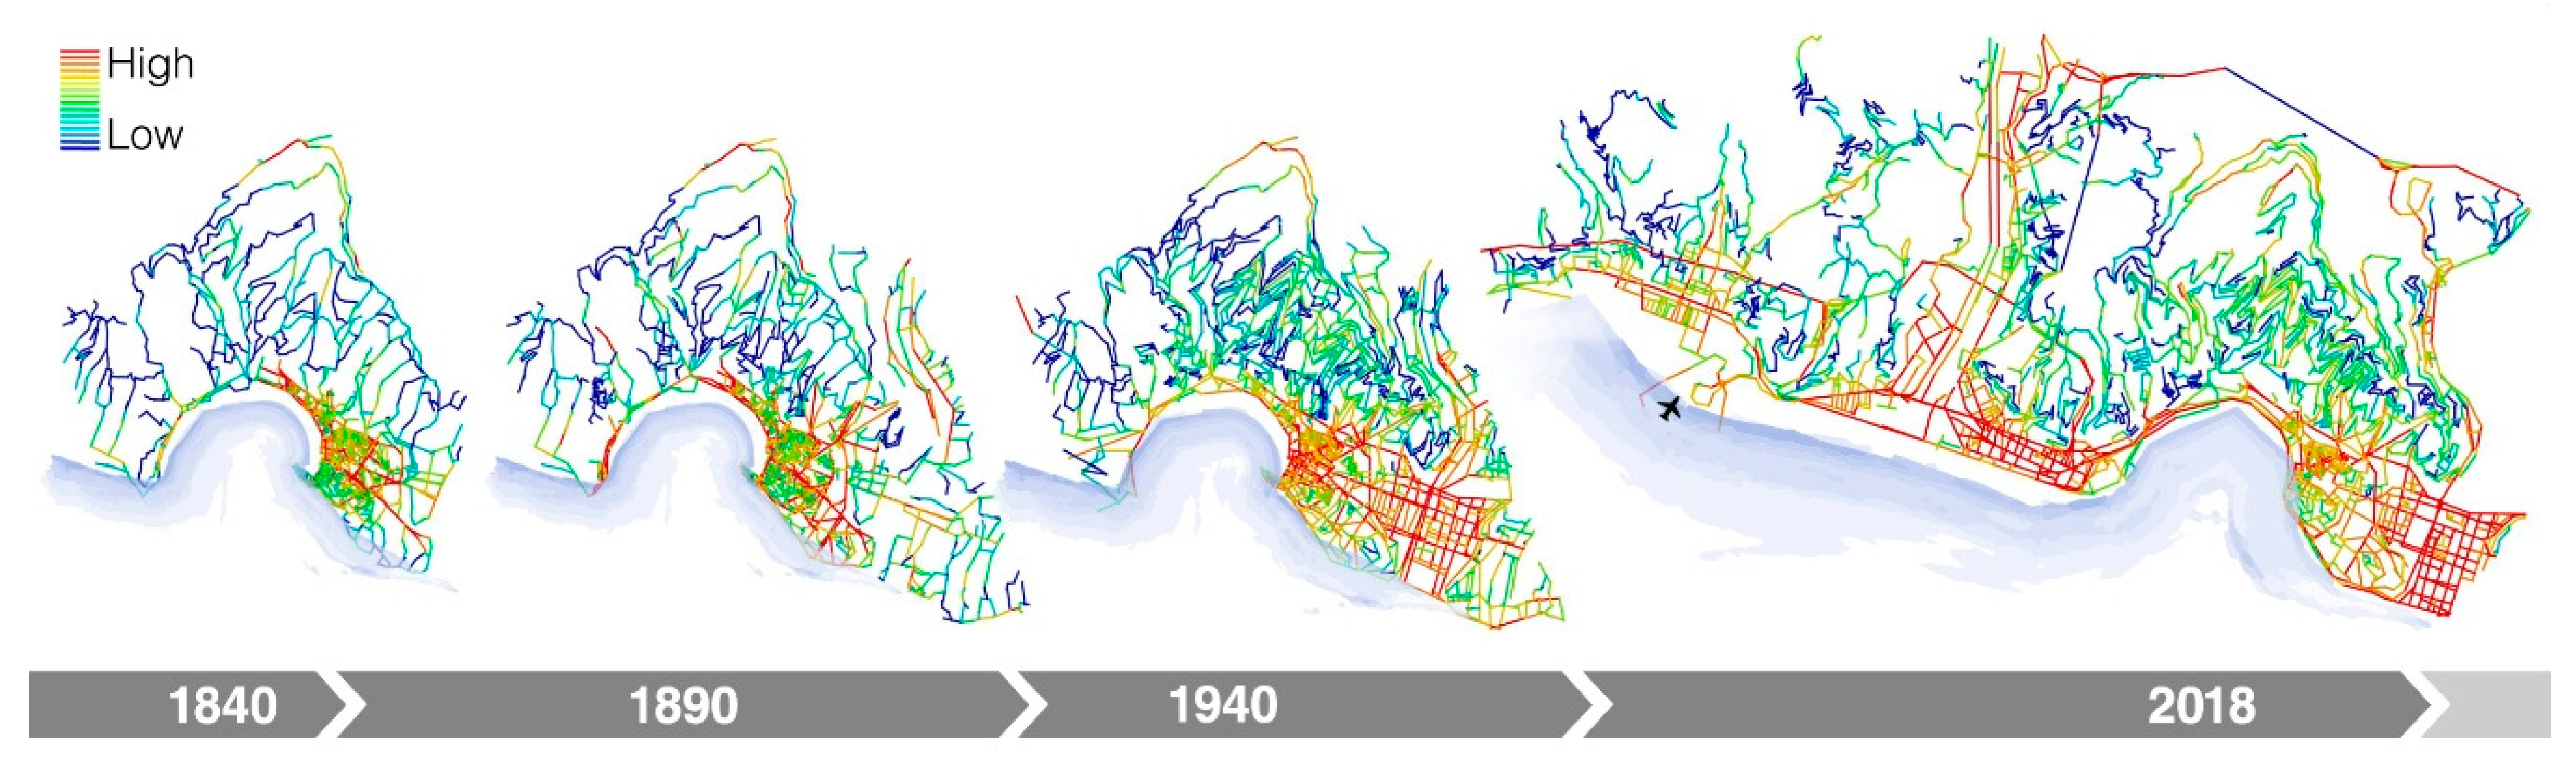
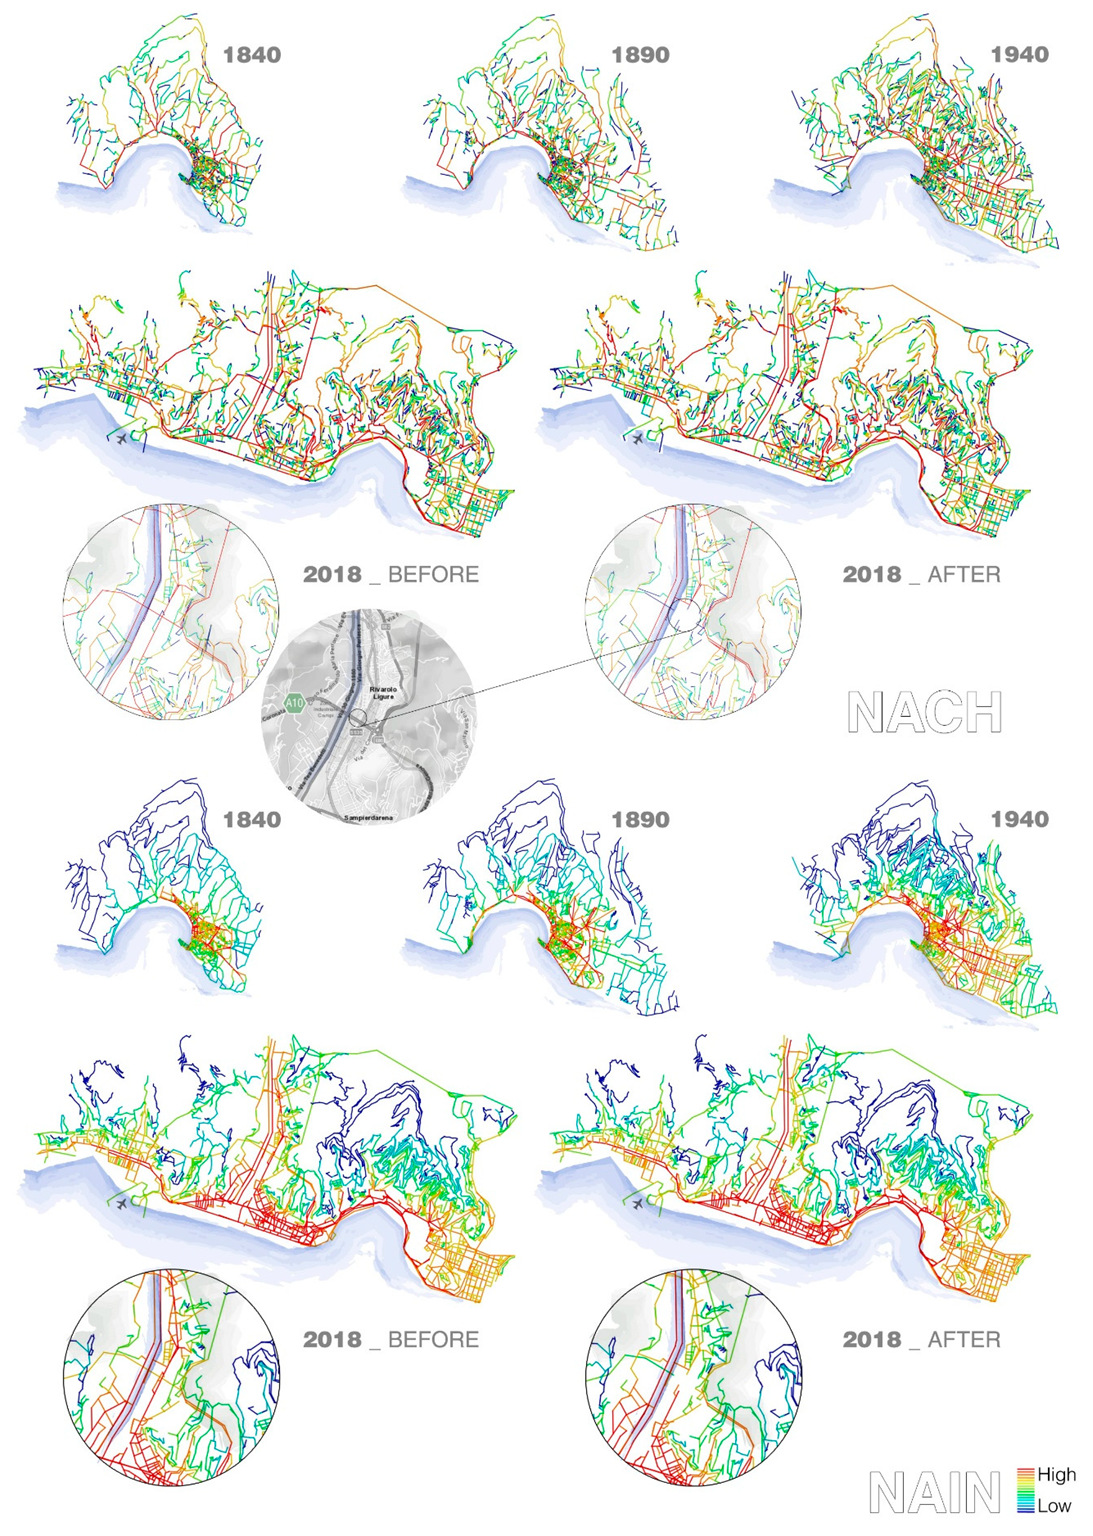
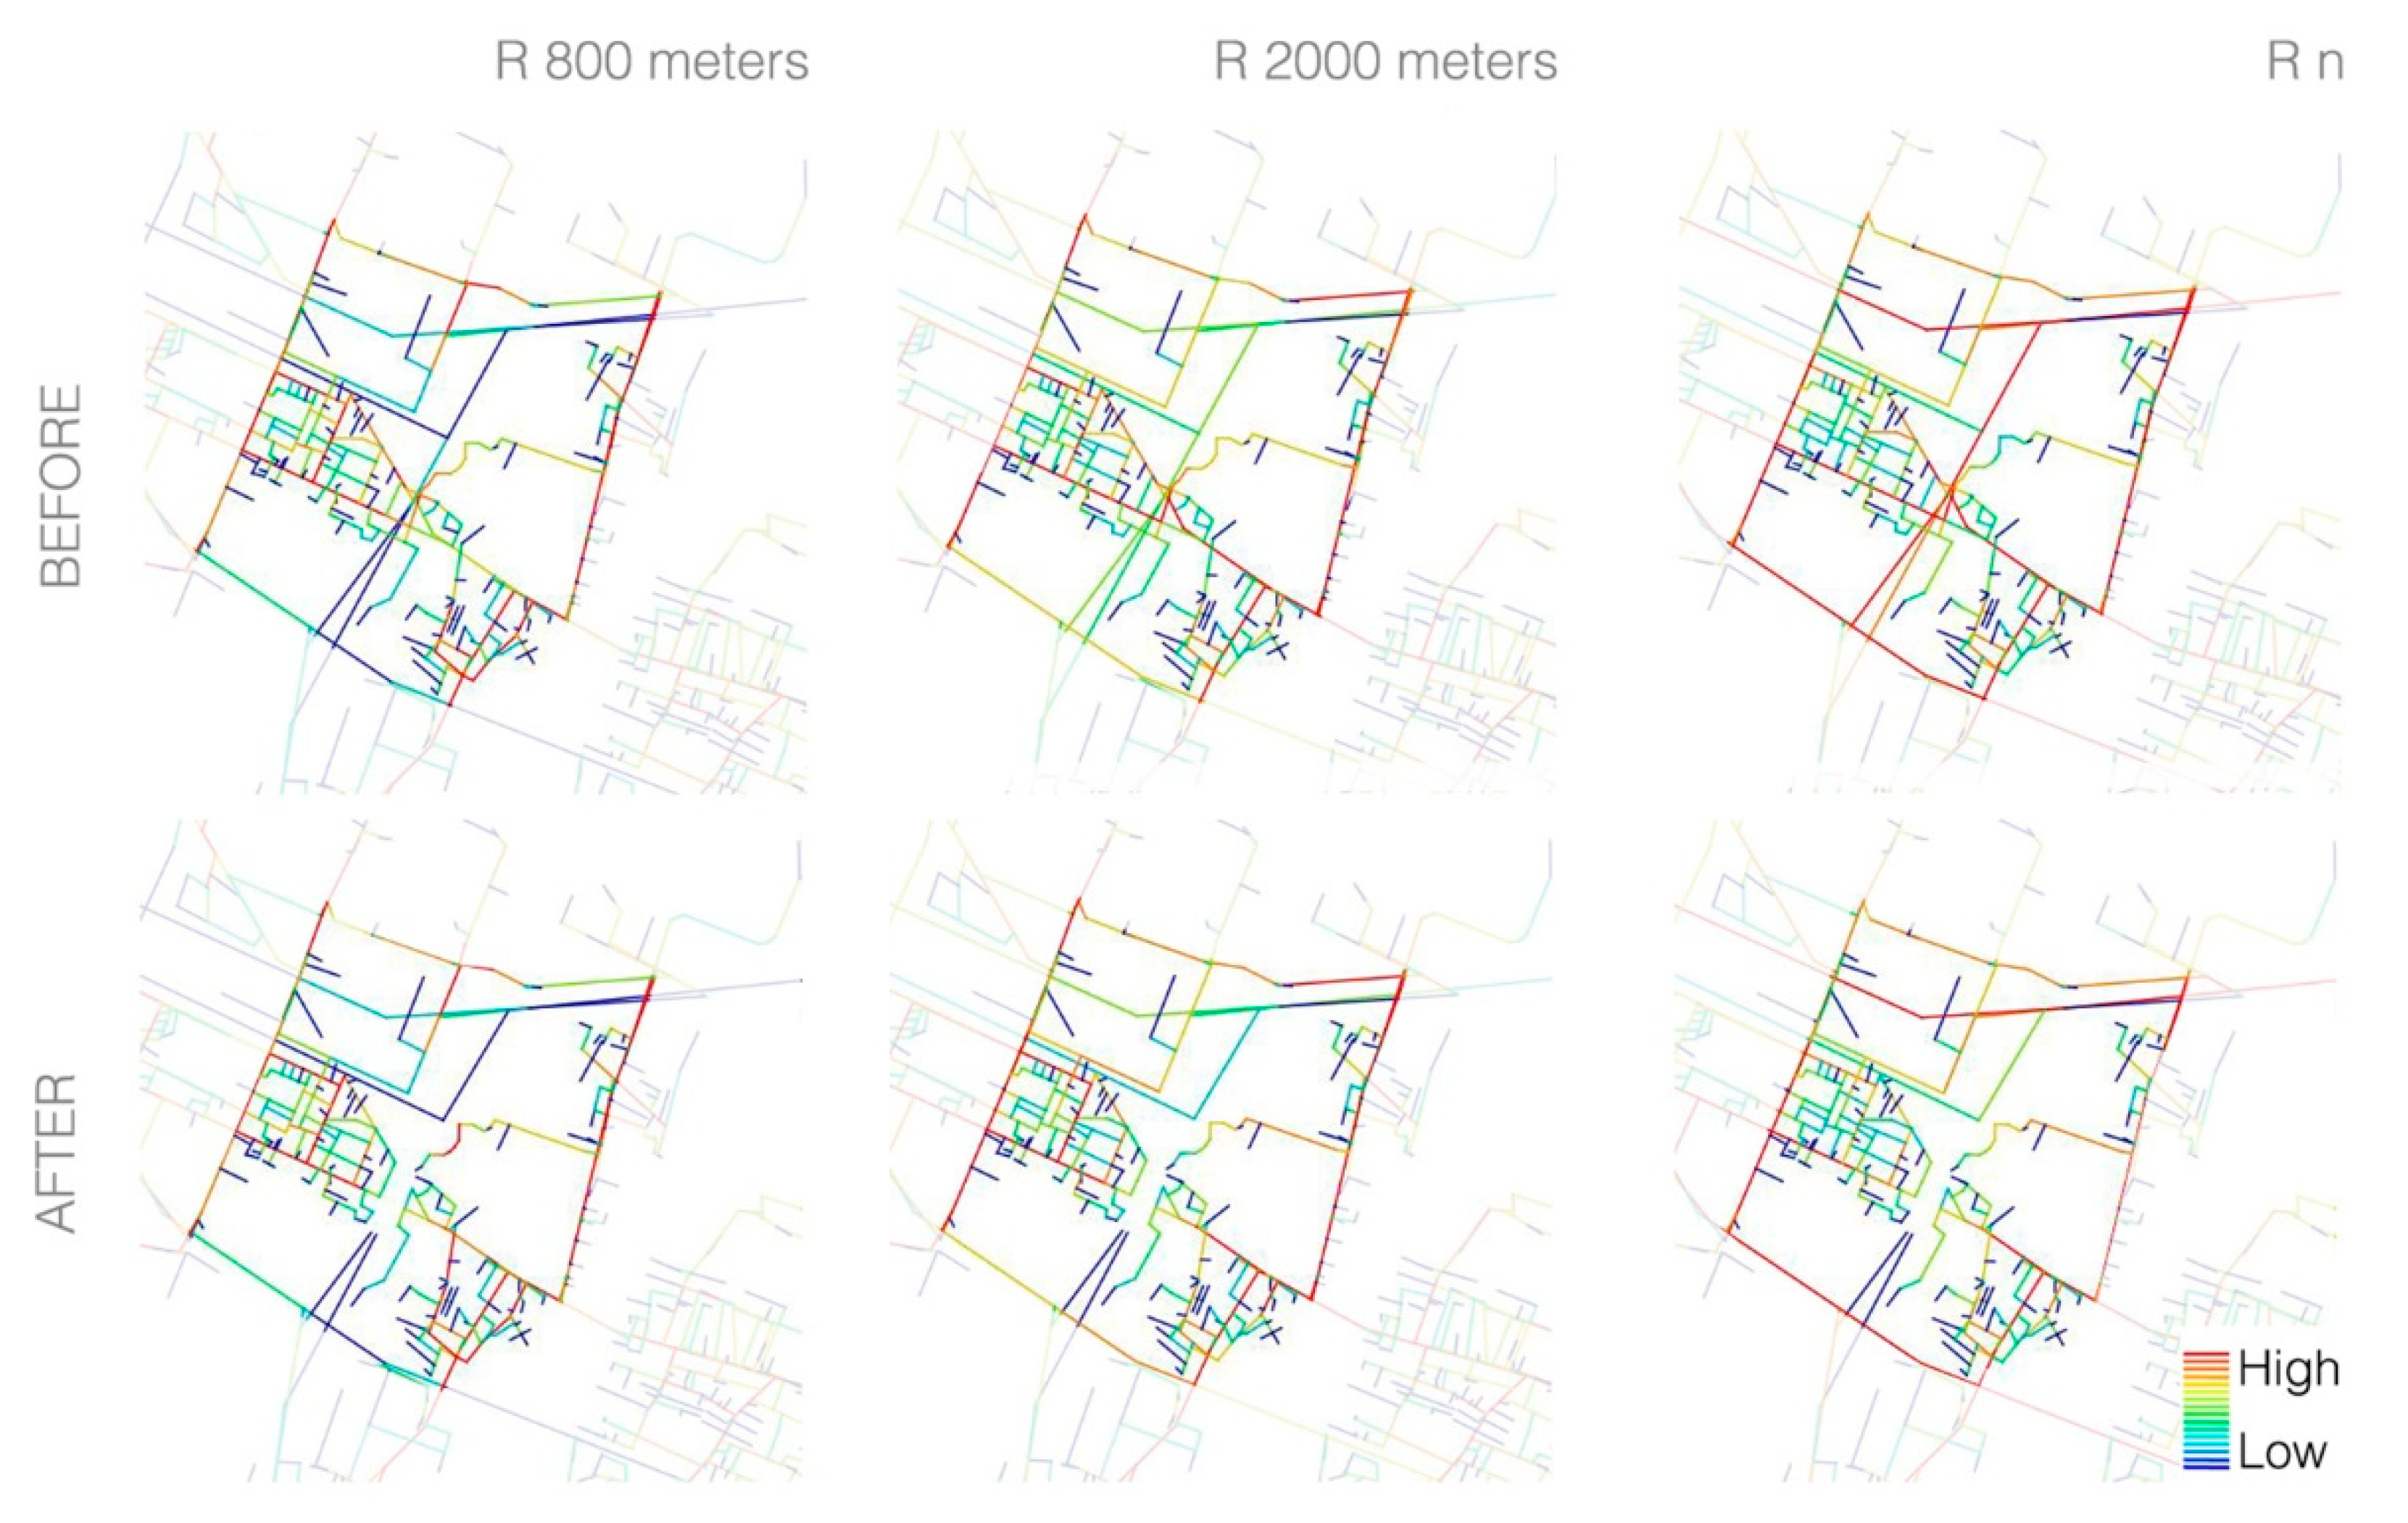
5.2. ASA Genoa
5.3. ASA Bologna
5.4. Resilience Assessment
6. Discussion
7. Conclusions
Author Contributions
Funding
Conflicts of Interest
References
- United Nations, World Population Prospects 2019 Highlights, 2019. Available online: https://population.un.org/wpp/Publications/Files/WPP2019_Highlights.pdf (accessed on 11 February 2020).
- United Nations, The 2030 Agenda for Sustainable Development. New York: United Nations General Assembly, 2015. Available online: https://sustainabledevelopment.un.org/post2015/transformingourworld/publication (accessed on 11 February 2020).
- UNDRR, Sendai Framework for Disaster Risk Reduction, 2015. Available online: https://www.unisdr.org/we/coordinate/sendai-framework (accessed on 31 May 2019).
- Borsekova, K.; Nijkamp, P. Resilience and Urban Disasters: Surviving Cities; Edward Elgar Publishing: Cheltenham, UK, 2019. [Google Scholar]
- Cariolet, J.M.; Vuillet, M.; Diab, Y. Mapping urban resilience to disasters–A review. Sustain. Cities Soc. 2019, 51. [Google Scholar] [CrossRef]
- Botequilha-Leitão, A.; Díaz-Varela, E.R. Performance Based Planning of complex urban social-ecological systems: The quest for sustainability through the promotion of resilience. Sustain. Cities Soc. 2020, 56. [Google Scholar] [CrossRef]
- Pelorosso, R. Modeling and urban planning: A systematic review of performance-based approaches. Sustain. Cities Soc. 2020, 52. [Google Scholar] [CrossRef]
- Kato, S.; Ahern, J. ‘Learning by doing’: Adaptive planning as a strategy to address uncertainty in planning. J. Environ. Plan. Manag. 2008, 51, 543–559. [Google Scholar] [CrossRef]
- Hillier, B.; Hanson, J. The Social Logic of Space; Cambridge University Press: Cambridge, UK, 1984. [Google Scholar]
- Cutini, V. The city, when it trembles: Earthquake destructions, post-earthquake reconstructions and grid configuration. In Proceedings of the 9th International Space Syntax Symposium, Seoul, Korea, 31 October–3 November 2013; Sejong University Press: Seoul, Korea, 2013; pp. 102:1–102:17. [Google Scholar]
- Pezzica, C.; Cutini, V.; Bleil De Souza, C. Rapid configurational analysis using OSM data: Towards the use of Space Syntax to orient post-disaster decision making. In Proceedings of the 12th International Space Syntax Symposium, Beijing, China, 8–13 July 2019; Beijing JiaoTong University: Beijin, China, 2019; pp. 147.1–147.18. [Google Scholar]
- Chelleri, L. From the «Resilient city» to urban resilience. a review essay on understanding and integrating the resilience perspective for urban systems. Doc. d’Analisi Geogr. 2012, 58, 287–306. [Google Scholar] [CrossRef]
- Batty, M. The size, scale, and shape of cities. Science 2008, 319, 769–771. [Google Scholar] [CrossRef]
- Portugali, J. Complexity, Cognition and the City; Springer: Berlin/Heidelberg, Germany, 2011. [Google Scholar]
- Ribeiro, P.J.G.; Pena Jardim Gonçalves, L.A. Urban resilience: A conceptual framework. Sustain. Cities Soc. 2019, 50. [Google Scholar] [CrossRef]
- Elmqvist, T.; Barnett, G.; Wilkinson, C. Exploring urban sustainability and resilience. In Resilient Sustainable Cities; Pearson, L., Newton, P., Roberts, P., Eds.; Routledge: London, UK, 2014; pp. 31–40. [Google Scholar]
- Janssen, M.A.; Bodin, Ö.; Anderies, J.M.; Elmqvist, T.; Ernstson, H.; McAllister, R.R.J.; Olsson, P.; Ryan, P. Toward a network perspective of the study of resilience in social-ecological systems. Ecol. Soc. 2006, 11. [Google Scholar] [CrossRef]
- Elmqvist, T. Development: Sustainability and resilience differ. Nature 2017, 546, 352. [Google Scholar] [CrossRef]
- Marcus, L.; Colding, J. Toward an integrated theory of spatial morphology and resilient urban systems. Ecol. Soc. 2014, 19. [Google Scholar] [CrossRef]
- Masnavi, M.R.; Gharai, F.; Hajibandeh, M. Exploring urban resilience thinking for its application in urban planning: A review of literature. Int. J. Environ. Sci. Technol. 2019, 16, 567–582. [Google Scholar] [CrossRef]
- Sharifi, A.; Yamagata, Y. Resilient Urban Form: A Conceptual Framework. Lect. Notes Energy 2018, 65, 167–179. [Google Scholar] [CrossRef]
- Jacobs, J. The Death and Life of Great American Cities; Vintage bo.: New York, NY, USA, 1961. [Google Scholar]
- Chokhachian, A.; Perini, K.; Giulini, S.; Auer, T. Urban Performance and Density: Generative Study on Interdependencies of Urban Form and Environmental Measures. Sustain. Cities Soc. 2019, 53. [Google Scholar] [CrossRef]
- Feliciotti, A.; Romice, O.; Porta, S. Design for change: Five proxies for resilience in the urban form. Open House Int. 2016, 41, 23–30. [Google Scholar]
- Sharifi, A. Resilient urban forms: A macro-scale analysis. Cities 2019, 85, 1–14. [Google Scholar] [CrossRef]
- Sharifi, A. Urban form resilience: A meso-scale analysis. Cities 2019, 93, 238–252. [Google Scholar] [CrossRef]
- Sharifi, A. Resilient urban forms: A review of literature on streets and street network. Build. Environ. 2019, 147, 171–187. [Google Scholar] [CrossRef]
- Koch, D.; Marcus, L.; Steen, J.; Lee, I.H.; Kim, Y.O. The Effect of Spatial Configuration and Land Use Pattern on Land Price Formation. In Proceedings of the 7th International Space Syntax Symposium, Stockholm, Sweden, 8–11 June; KTH: Stockholm, Sweden, 2009; pp. 063:1–063:12. [Google Scholar]
- Kim, H.K.; Sohn, D.W. An analysis of the relationship between land use density of office buildings and urban street configuration: Case studies of two areas in Seoul by space syntax analysis. Cities 2002, 19, 409–418. [Google Scholar] [CrossRef]
- Lhomme, S.; Serre, D.; Diab, Y.; Laganier, R. Analyzing resilience of urban networks: A preliminary step towards more flood resilient cities. Nat. Hazards Earth Syst. Sci. 2013, 13, 221–230. [Google Scholar] [CrossRef]
- Porta, S.; Crucitti, P.; Latora, V. The Network Analysis of Urban Streets: A Primal Approach. Environ. Plan. B Plan. Des. 2006, 33, 705–725. [Google Scholar] [CrossRef]
- Porta, S.; Crucitti, P.; Latora, V. The network analysis of urban streets: A dual approach. Phys. A Stat. Mech. Appl. 2006, 369, 853–866. [Google Scholar] [CrossRef]
- Pezzica, C.; Cutini, V.; Bleil de Souza, C.; Santucci, A. Adapting analysis workflows to humanitarian needs: Different road network models and tools. In Advances in Science, Technology & Innovation. In Proceedings of the 5th International Symposium Formal Methods in Architecture (5FMA), Lisbon, Portugal, 13–16 October 2020; Springer Nature: Berlin, Germany, in press.
- Abshirini, E.; Koch, D. Resilience, space syntax and spatial interfaces: The case of river cities. A/Z ITU J. Fac. Archit. 2017, 14, 25–41. [Google Scholar] [CrossRef]
- Cutini, V.; Di Pinto, V. On the slopes of Vesuvius: Configuration as a thread between hazard and opportunity. In Proceedings of the 10th International Space Syntax Symposium, London, UK, 13–17 July 2015; Space Syntax Laboratory: London, UK, 2015; pp. 066:1–066:16. [Google Scholar]
- Carpenter, A. Disaster resilience and the social fabric of space. In Proceedings of the 9th International Space Syntax Symposium, Seoul, Korea, 31 October–3 November 2013; Sejong University Press: Seoul, Korea, 2013; pp. 105:1–105:14. [Google Scholar]
- Cutter, S.L. Resilience to What? Resilience for Whom? Geogr. J. 2016, 182, 110–113. [Google Scholar] [CrossRef]
- Schipper, E.L.; Langston, L. A Comparative Overview of Resilience Measurement Frameworks: Analysing Indicators and Approaches. Working Paper 422, Overseas Development Institute, July 2015. Available online: https://www.odi.org/sites/odi.org.uk/files/odi-assets/publications-opinion-files/9754.pdf (accessed on 21 May 2020).
- Turner, A. From Axial to Road-Centre Lines: A New Representation for Space Syntax and a New Model of Route Choice for Transport Network Analysis. Environ. Plan. B Plan. Des. 2007, 34, 539–555. [Google Scholar] [CrossRef]
- Batty, M.; Rana, S. The Automatic Definition and Generation of Axial Lines and Axial Maps. Environ. Plan. B Plan. Des. 2004, 31, 615–640. [Google Scholar] [CrossRef]
- Varoudis, T. depthmapX by Varoudis. Available online: https://varoudis.github.io/depthmapX/ (accessed on 21 May 2020).
- Hillier, B.; Yang, T.; Turner, A. Normalising least angle choice in Depthmap and how it opens up new perspectives on the global and local analysis of city space. J. Sp. Syntax 2012, 3, 155–193. [Google Scholar]
- RStudio Team. RStudio: Integrated Development for R.; RStudio, Inc.: Boston, MA, USA, 2015. [Google Scholar]
- Dalton, N.S.C. Synergy, Inteligibility and Revelation in Neighbourhood Places. Ph.D. Thesis, UCL (University Coll. London), London, UK, November 2011. [Google Scholar]
- Salat, S.; Bourdic, L. Urban Complexity, Efficiency and Resilience. In Energy Efficiency—A Bridge to Low Carbon Economy; Morvaj, Z., Ed.; IntechOpen: London, UK, 2012; pp. 25–44. [Google Scholar]
- Gini, C. Indice di concentrazione e di dipendenza. Bibl. dell’Economista 1910, XX, 1–151. [Google Scholar]
- Lorenz, M.O. Methods of Measuring the Concentration of Wealth. Publ. Am. Stat. Assoc. 1905, 9, 209. [Google Scholar] [CrossRef]
- Huffpost, Genova alla Prova del Traffico Dopo il Crollo del Ponte: Nel Primo Lunedì di Settembre Code e Rallentamenti | L’HuffPost, 2018. Available online: https://www.huffingtonpost.it/2018/09/03/genova-alla-prova-del-traffico-dopo-il-crollo-del-ponte-nel-primo-lunedi-di-settembre-code-e-rallentamenti_a_23515229/ (accessed on 21 May 2020).
- Genova24.it, Traffico, via Albareto torna a doppio senso di marcia: Tra oggi e domani i lavori di ripristino della viabilità—Genova 24,” 2019. Available online: https://www.genova24.it/2019/03/traffico-via-albareto-torna-a-doppio-senso-di-marcia-tra-oggi-e-domani-i-lavori-di-ripristino-della-viabilita-213872/ (accessed on 3 February 2020).
- Amirfeiz, M.; Ruggeri, M.; Cenzuales, V. Ponte Morandi, Gronda e Ferrovia: Una Riflessione | CityRailways. Available online: https://cityrailways.com/ponte-morandi-gronda-e-ferrovia/ (accessed on 21 May 2020).
- Webb, C.; Bodin, Ö. A network perspective on modularity and control of flow in robust systems—Stockholm Resilience Centre. In Complexity Theory for a Sustainable Future; Norberg, J., Cumming, G., Eds.; Columbia Press: New York, NY, USA, 2008; pp. 85–118. [Google Scholar]
- Bologna Today, Incidente Bologna, Deviazione Chilometrica Durante i Lavori per il Ponte Tangenziale. Available online: http://www.bolognatoday.it/cronaca/incidente-bologna-deviazione-tangenziale-priolo-distanze.html (accessed on 21 May 2020).
- Barabási, A.-L. Linked: How Everything is Connected to Everything Else and What it Means for Business, Science, and Everyday Life, 2nd ed.; Basic Books: New York, NY, USA, 2014; pp. 1–294. [Google Scholar]
- Nilsson, L.; Gil, J. The Signature of Organic Urban Growth. In The Mathematics of Urban Morphology. Modeling and Simulation in Science, Engineering and Technology; D’Acci, L., Ed.; Springer: Cham, Switzerland, 2019; pp. 93–121. [Google Scholar] [CrossRef]
- Zeileis, A.; Kleiber, C. R package ineq. Measuring Inequality, Concentration, and Poverty. Comprehensive R Archive Network (CRAN), 2014. Available online: https://cran.r-project.org/web/packages/ineq/index.html (accessed on 21 May 2020).
- R-core, Stats Package | R Documentation. Available online: https://www.rdocumentation.org/packages/stats/versions/3.6.2 (accessed on 21 May 2020).


| Indicator | Principles | Type | Calculation in a Grid with n Roads | Range |
|---|---|---|---|---|
| Mean Connectivity | Connectivity Redundancy Robustness Independence | Global | Number of connections per node/node count | 2 ≤ MC ≤ n |
| Frequency Index | Redundancy Robustness Independence | Local | ChoiceMax/k with: Choice = Σj Σz fjz(i)/fjz; fjz(i) = n. of shortest paths between nodes j and z passing through i fjz = total n. of shortest paths between nodes j and z | 0 ≤ FI ≤ 1 |
| Synergy Coefficient | Efficiency Independence | Global and Local | R2 coefficient of the linear correlation between: Integration Index r800 m Integration Index rn (r infinity) | 0 ≤ R2 ≤ 1 |
| Gini Coefficient | Efficiency Diversity | Global | δ = Ac/At with: Ac = concentration area At = triangular area below line of perfect equality | 0 ≤ δ ≤ 1 |
| City and Date | Gini Integration | Gini Choice | Mean Connectivity | Frequency Index | Synergy Coefficient |
|---|---|---|---|---|---|
| Genoa after | 0.161179 | 0.86373 | 3.73618 | 0.61725 | 0.43728 |
| Genoa after ZTL | 0.160389 | 0.86088 | 3.65581 | 0.61267 | 0.53499 |
| Genoa before | 0.159549 | 0.86221 | 3.74079 | 0.61544 | 0.53087 |
| Genoa before ZTL | 0.161179 | 0.85747 | 3.65814 | 0.61544 | 0.53087 |
| Genoa 1940 | 0.142323 | 0.82389 | 4.41173 | 0.33262 | 0.58718 |
| Genoa 1890 | 0.151465 | 0.82827 | 4.39245 | 0.44098 | 0.65152 |
| Genoa 1840 | 0.155820 | 0.79944 | 4.37413 | 0.42638 | 0.75668 |
| Bologna after | 0.120946 | 0.87416 | 4.23544 | 0.33991 | 0.52232 |
| Bologna after ZTL | 0.122105 | 0.87817 | 4.14034 | 0.37707 | 0.52900 |
| Bologna before | 0.134307 | 0.87413 | 4.23569 | 0.34053 | 0.52252 |
| Bologna before ZTL | 0.120946 | 0.87765 | 4.14276 | 0.37197 | 0.52546 |
| Bologna 1940 | 0.141838 | 0.83391 | 4.23395 | 0.28937 | 0.40497 |
| Bologna 1890 | 0.095301 | 0.66559 | 4.99012 | 0.24632 | 0.32599 |
| Bologna 1840 | 0.114239 | 0.73405 | 4.81143 | 0.27418 | 0.45478 |
| Policy |
| The configuration of the urban grid is a key component of the resilience of urban form |
| The failure of a central node can seriously impact the global functioning of an organic road network system |
| The configuration of the urban grid influences its capacity to cope with local perturbations |
| Non-physical resilience factors can play a compensating role in the presence of a deficient road network system |
| Planning |
| The proposed configurational approach is a reliable, sustainable planning tool |
| Disaster scenarios can be simulated using the proposed methods to enhance disaster preparedness |
| Disaster impacts can be assessed using the proposed method to estimate the extent and course of network alterations |
| The proposed configurational indices reliably reproduce some key street network resilience properties |
| The method is only valid if supported by an effort to contextualise resilience mapping choices |
| Resilience properties |
| Redundancy of local connections and paths between origin-destination pairs is key for street network resilience |
| Synergy, intended as inner spatial coherence, is key for street network resilience |
| Path polarisation make an urban street network vulnerable to attacks |
© 2020 by the authors. Licensee MDPI, Basel, Switzerland. This article is an open access article distributed under the terms and conditions of the Creative Commons Attribution (CC BY) license (http://creativecommons.org/licenses/by/4.0/).
Share and Cite
Cutini, V.; Pezzica, C. Street Network Resilience Put to the Test: The Dramatic Crash of Genoa and Bologna Bridges. Sustainability 2020, 12, 4706. https://doi.org/10.3390/su12114706
Cutini V, Pezzica C. Street Network Resilience Put to the Test: The Dramatic Crash of Genoa and Bologna Bridges. Sustainability. 2020; 12(11):4706. https://doi.org/10.3390/su12114706
Chicago/Turabian StyleCutini, Valerio, and Camilla Pezzica. 2020. "Street Network Resilience Put to the Test: The Dramatic Crash of Genoa and Bologna Bridges" Sustainability 12, no. 11: 4706. https://doi.org/10.3390/su12114706
APA StyleCutini, V., & Pezzica, C. (2020). Street Network Resilience Put to the Test: The Dramatic Crash of Genoa and Bologna Bridges. Sustainability, 12(11), 4706. https://doi.org/10.3390/su12114706