Abstract
Various hazards and endemic threats are increasingly looming over cities, leading planners to rely on a rich toolbox of flexible and inclusive planning instruments and methods, capable of dealing with unpredicted events or sudden urban contingencies, when seeking sustainable urban futures. While sustainability-oriented innovative planning approaches are gaining momentum, ways to embed connected concepts in operational planning and design decision support systems have yet to be fully developed and validated. This paper tackles this issue by proposing and testing, in a real-life scenario, a method for the computational analysis of street network resilience, based on Space Syntax theory. The method is suitable to quantify the capacity of urban grids to absorb sudden disturbances and adapt to change, and to offer support for mitigation decisions and their communication to the public. It presents a set of configurational resilience indices, whose reliability is qualitatively assessed considering the ex-ante and ex-post urban configurations generated by two exceptional and dramatic bridge crashes. These events occurred almost simultaneously in two Italian cities with peculiarly similar characteristics. The results confirm the value of the proposal and highlight urban form, and particularly its grid, as a key driver in building urban resilience, together with the self-organisation capacity of local communities.
1. Introduction
Most of the world population already lives in cities [1], whose stability is threatened by numerous natural or man-made hazards, ranging from earthquakes to flooding, from wars and terrorist attacks to pandemics and disastrous accidents. The combined effects of rapid urbanisation trends, climate change and the diffusion of political uncertainty make such occurrences increasingly frequent and alarming, with important implications for planning, and the need to provide rapid and sustainable responses. The 11th Sustainable Development Goal puts both sustainability and urban resilience at the centre of the international strategic urban agenda [2]. Although some related concepts have been transferred to multilateral risk management and urban disaster mitigation policies such as [3], urban resilience principles are yet to be fully operationalised [4]. Indeed, the plethora of existing definitions of urban and community resilience generates ambiguities (e.g., confusion between urban resilience and urban vulnerability mapping [5]) which impact on the creation, use and output interpretation of urban analysis models, simulation tools and connected Decision Support Systems (DSS). However, urban resilience-thinking [6] and novel sustainable urban planning approaches based on urban systems’ performance, such as Performance-Based Planning (PBP) [7] and Adaptive Planning and Management (APM) [8], require the support of a rich toolkit of such planning instruments that is fully operational.
While acknowledging that resilience is related to many aspects of urban life, this paper specifically contributes to the discussion on how to measure the configurational resilience of the road network system. This task is approached in this paper from the perspective of Space Syntax theory [9], a subfield of urban morphology studies which understands cities as movement economies and allows for the observation of correlations between urban form and society through the analysis of natural movement patterns, considering the availability of alternative paths between origin-destination pairs. Therefore, in this paper street network resilience is understood as the capacity of an urban grid to maintain the operation of urban functional assets by redistributing movement after a physical perturbation. The paper seeks to demonstrate that some relational properties of an urban grid influence its ability to cope with localised network failures and retain the efficient functioning of all connected systems and subsystems. Building on previous research work [10,11], it identifies a set of configurational indices useful to account for the redundancy of connections and the distribution of accessibility levels in a road network, creating overlaps in infrastructure facilities which enable an adaptive response to perturbations. The proposal, which is based on a diachronic configurational analysis, is validated by critically confronting simulation outputs with field observations in two paradigmatic Italian case studies, namely the two exceptional and dramatic bridge disasters which happened in the summer of 2018, just a week apart, in Genoa and Bologna.
The significant changes in network resilience a settlement goes through in its development over time ought to be considered when preparing for unpredicted events. Ultimately, the paper seeks to show that, even if the impact of an urban disaster clearly depends on the specifics and actual extent of the destructive event, the proposed analysis could have been exploited to anticipate the different impacts that the collapse of the bridges had in the two settlements, while contributing in both cases to mitigate their effects.
The paper is structured as follows: Section 2 reviews some theoretical concepts related to urban resilience that are relevant to this study and highlights key links with street network analysis. The proposed method for street network resilience analysis is illustrated in Section 3, and the proposed resilience indicators in Section 4. Section 5 introduces the case studies and presents the outputs of the analysis, whereas Section 6 discusses their practical implications and Section 7 provides suggestions for future research.
2. Literature Review
2.1. Urban Resilience
From a purely engineering perspective, urban resilience is the capacity of a city to bounce back to an initial equilibrium status (coping strategy). From a socio-ecological perspective, urban resilience is understood as the capacity of an urban system to undergo incremental change (adaptive strategy) and transform (transformative strategy), reaching new equilibrium points. The latter approach focuses on thresholds and drivers that move urban systems to tipping points [12] and is arguably more in line with an understanding of cities as complex open systems [13,14] characterised by non-linear evolution trajectories. In a recent attempt to put all the key conceptual components of urban resilience into a well-defined theoretical framework, Ribeiro & Pena Jardim Gonçalves [15] noted that most of the existing definitions relate the concept of urban resilience to a situation involving a threat to an urban system and its consequent change or alteration across space and time, while others focus on urban sustainability and development aspects. This aligns with the results of Elmqvist et al. [16], who call “general resilience” the capacity of a city to deal with all kinds of shocks, including those not necessarily sudden or abrupt, and “specified resilience” any possible declinations of general resilience, which implies specifying the “resilience of what to what”. Here, Janssen et al. [17] note that framing resilience as a matter of the efficiency of just one system at one scale may contradict the principle of redundancy, as it involves limiting resources to an over-specific end. Conversely, prioritising diversity and the positive backup capacity over efficiency may contradict the sustainability goals [18]. Finally, Ribeiro & Pena Jardim Gonçalves identify five dimensions of urban resilience, namely natural resilience (ecological and environmental), economic resilience (socio-economic development), social resilience (of communities and people), institutional resilience (governance and mitigation policies) and finally physical resilience, which concerns, among other things, infrastructure networks [15].
2.2. Resilience of Urban Form
Among these five urban resilience domains, the physical dimension has been underexplored in the scientific literature, and many authors [19,20,21] have highlighted the need for further research in the field of spatial morphology and resilience of urban form, to better link related urban elements to resilience principles. In fact, urban form is the result of the assemblage of several physical elements, which together play a key role in supporting the functioning of a city by enabling the day-to-day reproduction of its activities and culture [22]. Chokhachian et al. [23] highlight that land use and built form in terms of urban physical density have implications for both environmental (energy use) and social resilience (people’s health and well-being), and thus should be adequately factored in performance-based planning (PBP). Additionally, Feliciotti et al. [24] study the cross-scale dependencies of urban form elements such as urban plots, street edges, blocks, streets and districts in relation to five proxies of urban form resilience: connectivity, redundancy, efficiency, modularity and diversity. In an attempt to trace such intra- and inter-scale interactions, Sharifi & Yamagata [21] propose studying the resilience of urban form by classifying macro-scale [25], meso-scale [26] and micro-scale urban components.
2.3. Street Network Resilience
Sharifi [27] clearly demonstrates the importance for urban resilience of implementing a performative design of urban street networks in terms of topology, urban design and orientation. Additionally, Sharifi & Yamagata [21] report that a special attention should be paid by planners to the negative cascade effects that a potential failure of a street segment with a high centrality value would trigger in an urban system. In fact, Space Syntax studies have shown that the location of commerce and retail activities in a city empirically correlates with certain street networks’ centrality measures, with implications for the size and morphology of buildings and urban plots [28,29].
Urban street networks and embedded components such as bridges, tunnels and overpasses are key and long-enduring features of urban form, which dictate the conditions for urban growth and development. This applies particularly to bridges, in that they overcome natural and manmade physical obstacles (e.g., rivers, rail infrastructure etc.) and are essential in enabling the road network system to function as a unique entity. Their importance for cities has been stressed in the famous puzzle of the seven bridges of Königsberg, elegantly resolved in 1736 by Leonard Euler, which opened the door to the development of Graph Theory. Lhomme at al. [30] note that bridges represent strategic—and yet topologically vulnerable—links, which need to be adequately considered in urban risk mitigation plans.
Street network resilience can be computed using an urban network model in which the road system is modelled as a non-planar graph, either primal or dual [31,32,33]. The former translates streets into links and intersections into nodes, while the latter—due to its focus on the properties of different road segments—translates streets into nodes and their mutual intersections into graph edges. Abshirini & Koch [34] use a dual-graph model to measure the ability of an urban grid to retain its foreground road network structure (Similarity) and relative composition (Sameness) after a disturbance. Cutini [10] and Cutini & Di Pinto [35] propose using it to retrieve a set of street network resilience indices, suitable to comparatively assess the configurational resilience of different urban grids, while Carpenter [36] adopts it as a basis for mapping community resilience.
2.4. Resilience Indices
When it comes to mapping the urban resilience to disasters, Cariolet et al. [5] note that some researches concentrate on mapping urban adaptive resilience, which, according to Cutter’s definition [37], involves measuring the impact of, and the recovery trajectory after, a disastrous event; whereas others focus on mapping the urban inherent resilience capacity, considering the characteristics that determine the ability of a system to absorb, recover from and adapt to change, using a set of resilience indices. Overall, the authors identify a lack of studies validating analytical top-down methods for mapping the ex-ante urban inherent resilience capacity, based on empirical observations of the ex-post situation. However, this is critical to overcome potential issues connected to the subjective definition and arbitrary selection of resilience capacity indicators.
These indices can be holistic or system-specific. Schipper & Langston [38] warn that system-specific indicators are more effective to support decision-making, but their use requires decision-makers to specify the analysis boundaries, weight them and contextualise the problem as appropriate to achieve good results. In fact, the choices concerning the selection and combination of the indices should be customised according to the objective of each study and its priorities in relation to a specific urban context. Here, Marcus & Colding [19] note the existence of trade-offs between conflicting resilience principles (e.g., redundancy and efficiency). Despite this potential challenge, system-specific indices facilitate a context-based evaluation of urban resilience and, therefore, represent the focus of this paper.
3. Materials and Methods
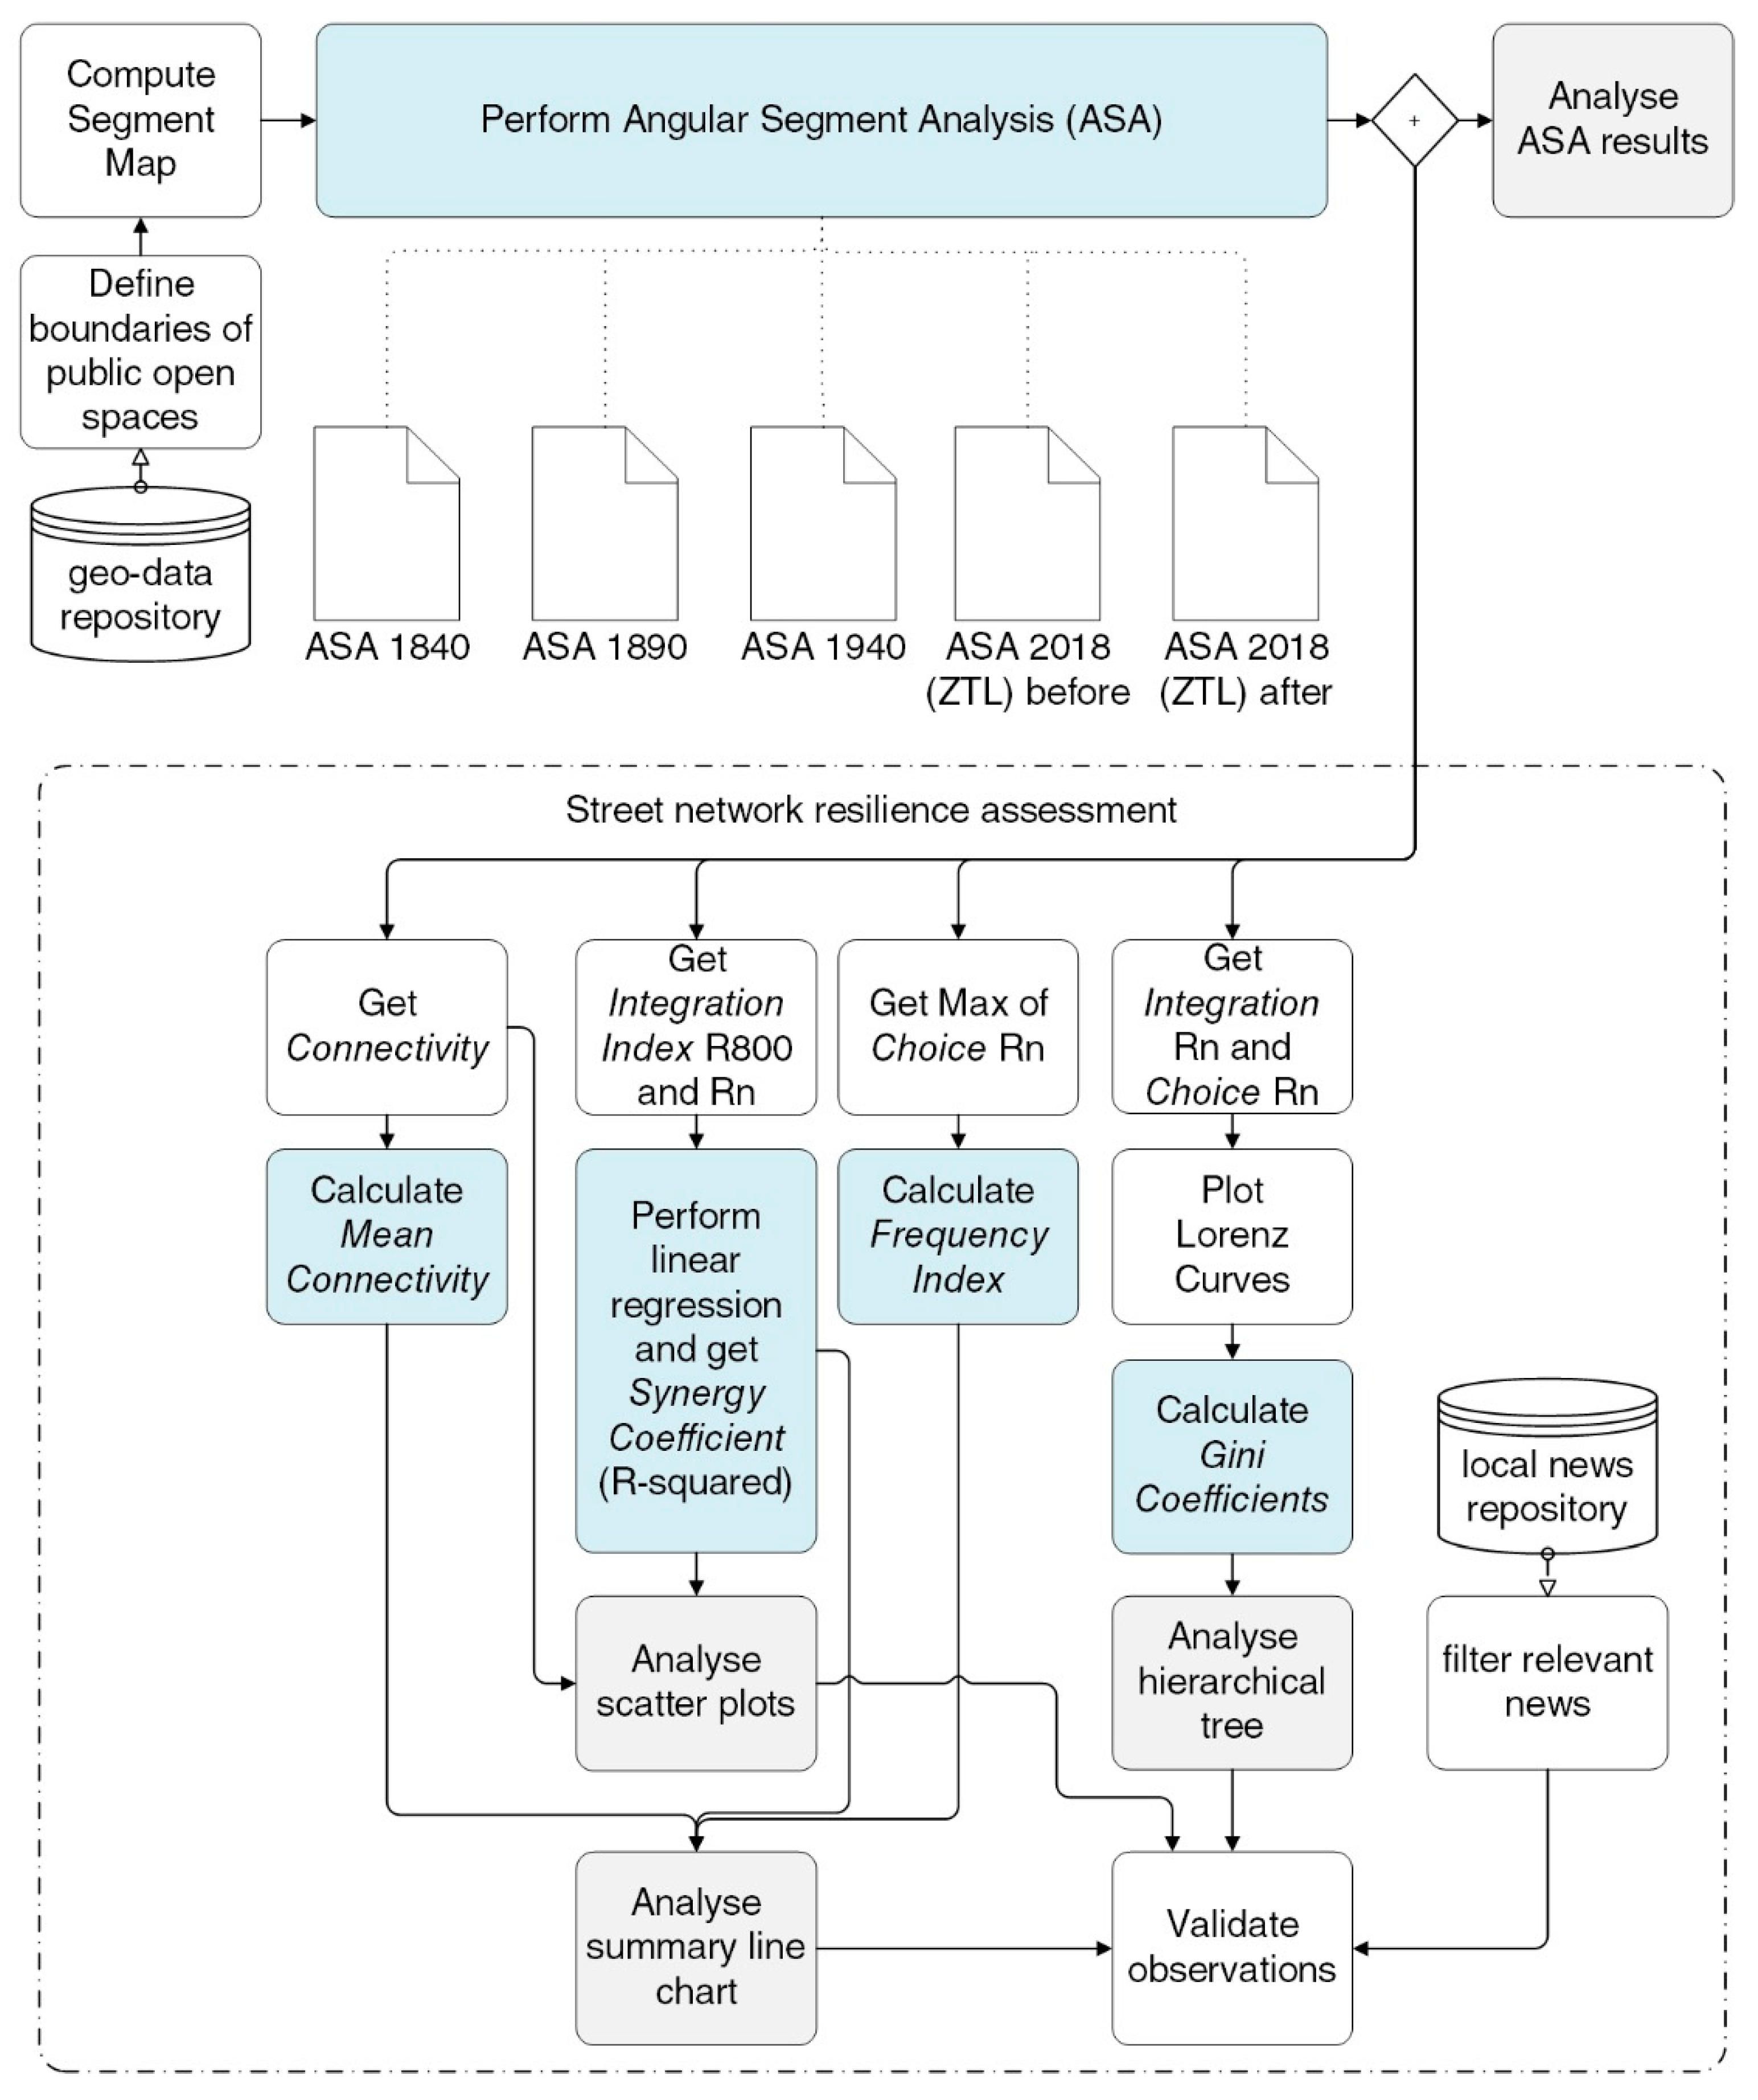
This paper conducts a qualitative validation of a method for the resilience analysis of urban street networks, based on Space Syntax analysis techniques. To this end, it uses information on two comparable—and yet, in some respects, different (see Section 5.1)—Italian bridge crashes. The impacts of the two bridge disasters are compared by simulating the effects of the sudden removal of one central node (i.e., the bridge) from the dual graph representation of the corresponding street network systems. As illustrated in Figure 1, the method encompasses two steps, namely a diachronic Angular Segment Analysis (details in Section 3.1) and, subsequently, a street network resilience assessment (details in Section 3.2) based on the retrieval of four main resilience indices (Section 4) for a selection of time steps. Here, we look at the grid transformations during the expansion of the two cities from 1840 to the present, as this allows identifying some of the preconditions of the faster and lengthier post-disaster recovery experienced by Bologna and Genoa, respectively. The diachronic approach allows for the integration of the dimension of time in the resilience assessment via the identification of tipping points in the urban evolution process, shifting street network configurations to more (or less) resilient configurations. Due to their representativeness and practical issues of data availability, the following dates were selected for the analysis: 1840, 1890, 1940 and 2018—before and after the bridge collapse. The geometric 2D inputs used for the study are closed polylines, which were traced in ®AutoCAD over official cartographic data or high-resolution images of historic town maps.
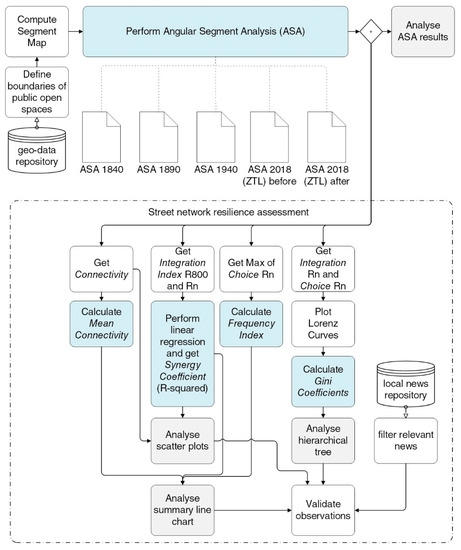
Figure 1.
Methodology flowchart with the analysis steps.
3.1. Angular Segment Analysis
An Angular Segment Analysis (ASA) was adopted because it highlights nuances in configurational metrics’ variations along street segments, and its outputs correlate better with empirical traffic data than those of an Axial Analysis [39]. The analysis process involved the following steps: (1) population of a closed boundary representing the freely accessible space of a city with axial lines [40]; (2) creation of a segment map after breaking the axial lines at their intersecting points and removing the short stubs; (3) ASA analysis performance and export of results in a Geographic Information System (GIS); (4) creation of colour-coded map visualisations in GIS using the standard Space Syntax colour gradient (low values in blue and high values in red) and consistent value classification methods (e.g., quantile and equal count). To produce results that align better with movement patterns during daytime, when tracing the boundary of the 2018 networks, the areas of the two cities limited to vehicular traffic (ZTL) were not included. This analysis method is largely scalable and reproducible [40]. Steps 1 to 3 were automated using DepthmapX [41], a mainstream Space Syntax analysis software, while the calculations were based on a “Tulip analysis 1024 bins”, setting “metric step” as the radius type. In the end, a set of maps displaying the distribution of two basic configurational indices (NACH and NAIN) was produced for every analysed year. These metrics, also known as Normalised Angular Choice and Normalised Angular Integration, measure through- and to-movement patterns, respectively. The use of normalised indices is needed to ensure a rigorous visual comparison of two network systems with a different number of street segments [42].
3.2. Street Network Resilience Assessment
After performing the ASA for each urban configuration, four resilience indices, namely Mean Connectivity, Frequency Index, Synergy Coefficient and Gini Coefficient, were retrieved (Section 4 outlines their meaning in detail and shows how to compute them) and jointly analysed as part of the proposed street network resilience assessment, which is illustrated in the bottom part of Figure 1. This required some data post-processing using statistical analysis methods, which were implemented using RStudio [43], as well as the confrontation of analytical observations with relevant information retrieved from documents, published by the press and traffic authorities of Genoa and Bologna in the months and years that followed the two bridge disasters.
4. Street Network Resilience Indices
Four street network resilience indices are proposed in this paper, by expanding the results from a previous research work [10]. The Space Syntax terminology is adopted in the explanation of the indices for consistency, although some correspondences exist with other mathematical metrics. As shown in Table 1, the indices used in the resilience assessment represent a selection of key aspects, linking properties of the road network topology to the following subset of resilience principles:

Table 1.
Road network resilience indicators.
- Connectivity: presence of road intersections supporting mutual interaction.
- Redundancy: availability of several path alternatives.
- Robustness: road system designed to contain the effect of localised failures.
- Independence: ability to continue operating after a disaster without the need for physical interventions.
- Efficiency: presence of a hierarchic distribution of accessibility levels.
- Diversity: presence of different types of roads with different functions and accessibility levels.
4.1. Mean Connectivity
Mean connectivity is a basic global parameter, which represents the average number of connections of the nodes (i.e., streets). It accounts for the capacity of a street network to cope with randomised failures and maintain its global relational state. Low values indicate the presence of a high number of obliged routes, while high values indicate the availability of several alternative backup routes.
4.2. Frequency Index
The Frequency Index is a local indicator, which accounts for the actual distribution of the shortest paths in a grid and measures how much it resembles a tree-like structure. According to Sharifi [27], an optimal compromise can be found somewhere between a tree- and a star-shaped network, at the threshold where the network efficiency saturates. This assumes that a resilient urban system should be able to offer alternative routes even if key links are broken and that a strong polarisation of flows within a small number of spatial elements, makes the grid more vulnerable to attacks. Therefore, this index increases as the resilience of the road network decreases. Accordingly, the case of maximum vulnerability is when the index is equal to 1, which happens when the entire road system depends on a single line shared by all the shortest paths.
4.3. Synergy Coefficient
Mathematically, the Synergy Coefficient measures the correlation between radius 800 m and radius infinity Integration. This indicates the extent to which the local configuration of a grid is a predictor of the global structure of the network [44], thus allowing for the appreciation of the cross-scale effects of localised perturbations. Because the Synergy Coefficient depicts the impedance of local street patterns when moving towards the city centre, it is also an indicator of the road network efficiency. This assumes that a resilient street network would make every location in a city easily accessible from all the others [45]. A high value of the index indicates that local streets are strongly anchored to the global road network and hence that local perturbations cannot significantly upset the functioning of a city. Conversely, a low value indicates a risk of losing access to urban services following a local failure.
4.4. Gini Coefficient
The Gini Coefficient, originally introduced to measure the inequality in the distribution of different variables [46], can be used as a global indicator of movement polarisation in a road network, assessing the extent to which the shortest paths are diffused or concentrated in the road network. It assumes that movement patterns are a by-product of the interaction of all spatial elements and that centrality is a resource generated by the grid itself. Using a gardening metaphor, inequalities are generated from the concentration of the “irrigation and fertilization benefit” provided in a city by human flow. The Gini Coefficient considers both the morphology and the dimension of a network, as both affect the distribution of the shortest paths in a grid. In fact, in a completely connected graph the number of routes connecting all origin-destination pairs is equal to the binomial coefficient (Cn,2), but the actual road segments hosting movement (i.e., those on the shortest paths) vary according to the specific grid configuration. A value of 0 expresses perfect equality, whereas a value of 1 indicates maximum inequality of movement distribution, and thus a vulnerable network.
This index corresponds to the Gini ratio, introduced in 1910 [46], which numerically summarises the information embedded in the corresponding Lorenz Curve (LC) [47]. It is retrieved after plotting an LC for a certain configurational metric, by calculating the ratio of the area between the line of perfect equality and the LC (Ac) over the area below the line of perfect equality (At). The LC was initially conceived to measure wealth distribution inequalities in different epochs, but here it is adopted to compare the relative performance of different street network patterns across time and space. An analogy is thus established between the measurement of wealth and movement distribution inequalities.
5. Results
5.1. Case Studies
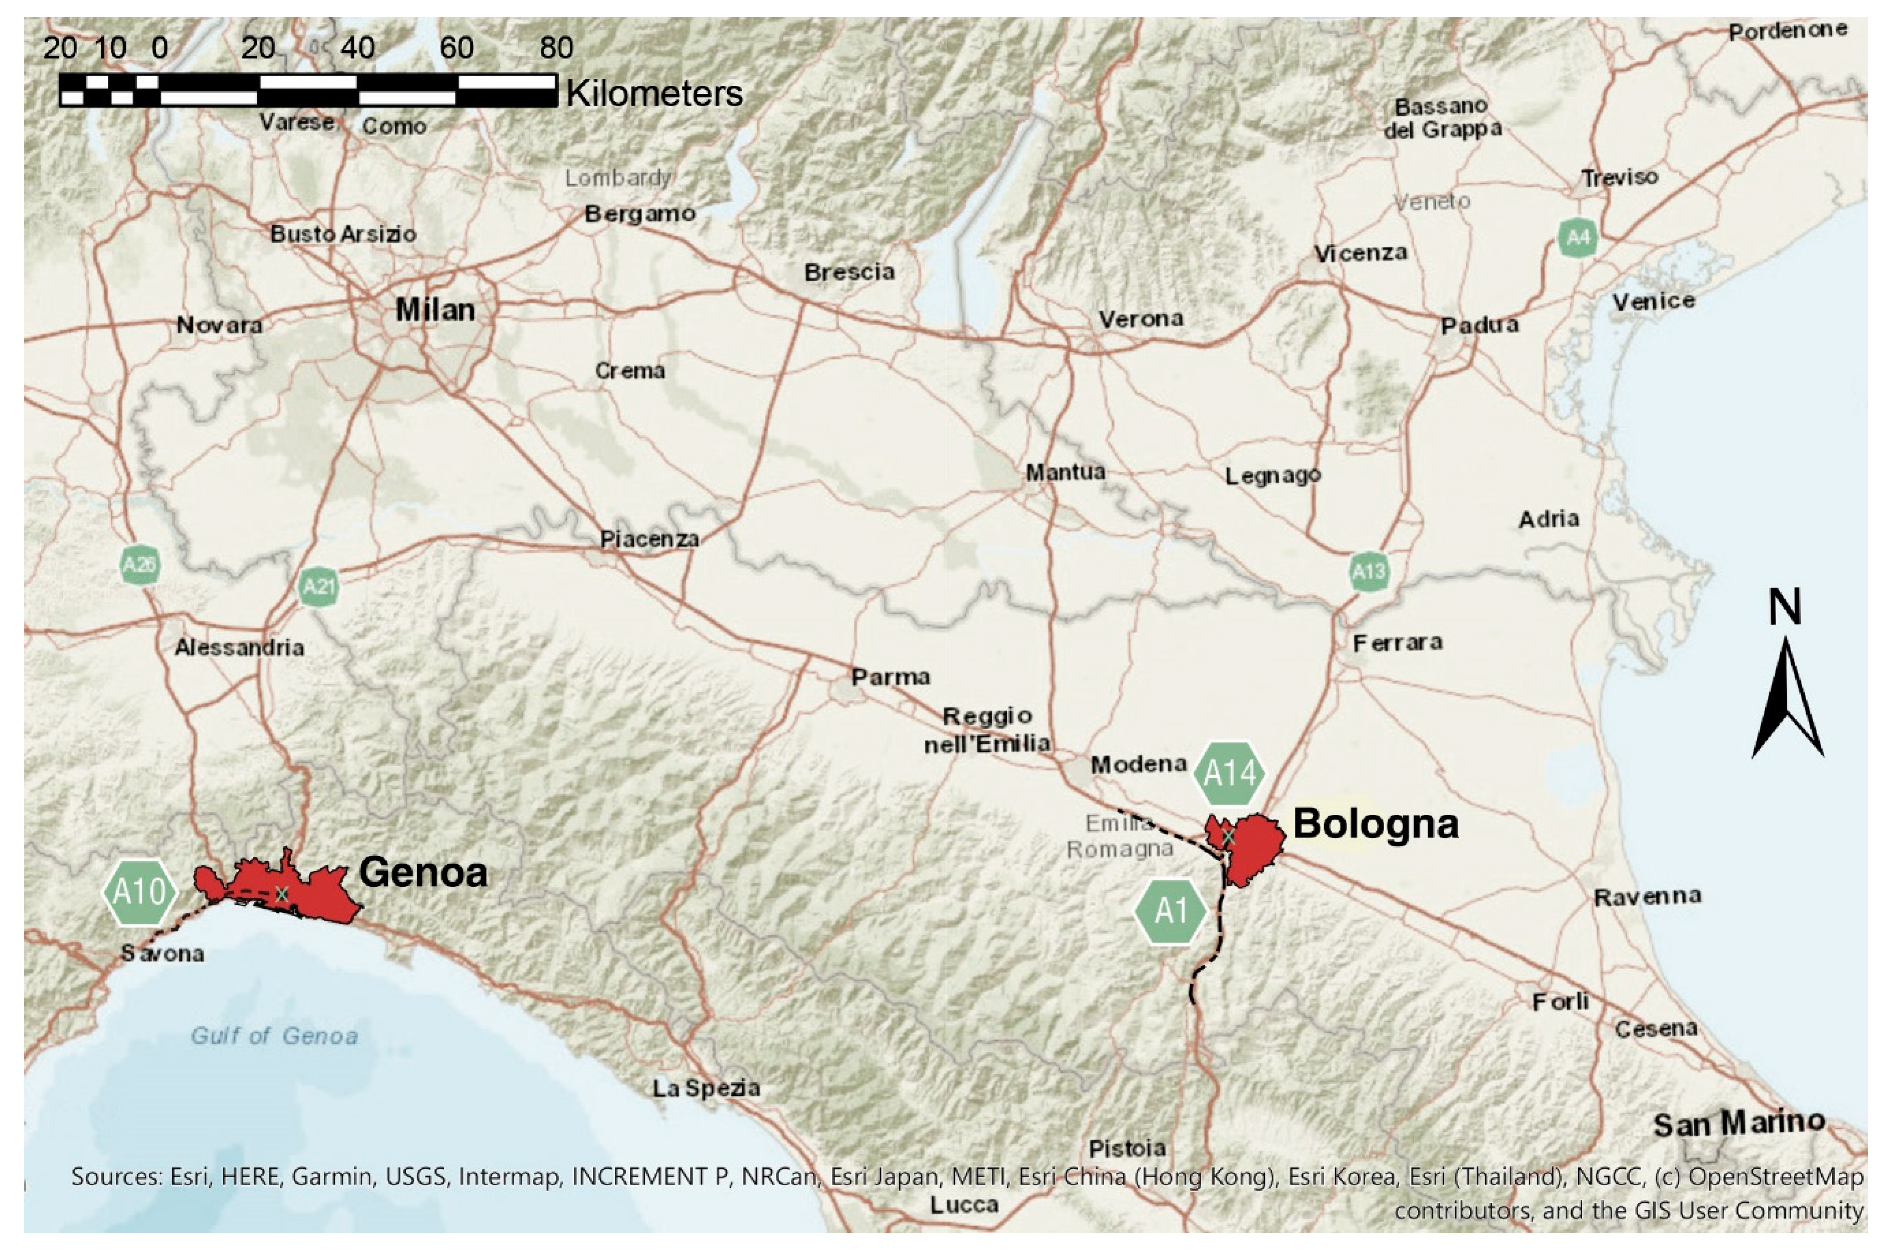
As shown in Figure 2, the research analyses the street network of the municipalities of Genoa and Bologna. These cities are both hubs of primary importance within the Italian transportation network, and in each of them the motorway is a key component of the road network structure. On 6 August 2018, an overpass of the motorway bypassing Bologna collapsed because of a large and sudden fire triggered by a disastrous car accident. Although fortuitous and favourable circumstances helped limiting the final death toll to two people, the disaster caused injuries to many, provoked the destruction of hundreds of vehicles, serious damages to buildings across a large area as well as lengthy disruptions of traffic, which led to the crisis of the North Italy motorway network. On August 14, only 200 kilometres away from the first disaster, the Polcevera bridge (also known as the Morandi bridge), which served the motorway passing through the metropolitan area of Genoa, collapsed due to causes that are yet to be fully clarified. The consequences of this crash were far more serious (43 victims were buried under the bridge’s ruins and over 500 people were evacuated from their houses). Once more, the disaster provoked a general crisis in the North Italy motorway network.
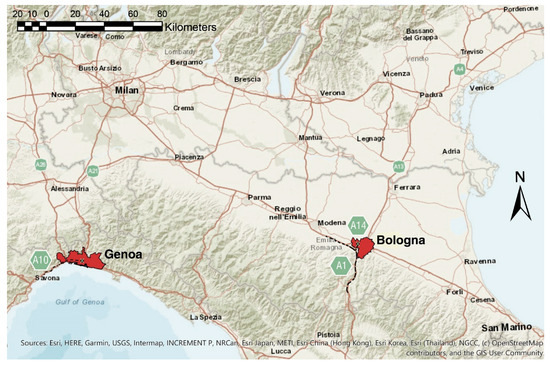
Figure 2.
North Italy motorway network and location of the two crashes, including the interrupted links. The areas of the two analysed municipalities are highlighted in red.
After the incident in Bologna, local newspapers reported the closure of the motorway link A1-A14 in both directions. The Italian ministry of transport advised long-distance travellers to deviate their routes far from the city to avoid traffic congestions. To cope with traffic issues at peak times, the municipality modified the timing of traffic lights in the area surrounding the collapsed bridge. These and similar measures stayed in place for two months, during the relatively short duration of the reconstruction works.
In Genoa, the disaster had a major impact on the circulation of people and vehicles, as traffic congestion and several incidents were reported in certain areas of the city for several months. There were also complications in the reconstruction of the new bridge, which was recently terminated. Again, public authorities redirected long-distance travellers away from Genoa’s city centre. The crash caused the local interruption of the A10 motorway in both directions, which cut in two separate halves the metropolitan area of Genoa, causing disruptions to airport travellers as well. Highly critical for traffic were the streets located between the Valpolcevera and the city centre and those between Genoa West and Sampierdarena [48]. Genoa’s road system was modified to face the emergency: the coastal road “Via Albareto” was re-engineered and widened to four lanes to host the vehicles moving from Genoa West towards the city centre, by borrowing parking lots and yellow stripe areas from the surrounding public space. Although temporary, this modification lasted for eight months [49], a timeframe in which the survival of many small economic activities was put at stake, due to the elimination of sidewalks and the increase in traffic speed following the redirection of vehicular flows.
Apart from the differences mentioned above, these two disasters present some peculiar similarities, which justify a configurational street network resilience analysis focusing on both of them:
- Bologna and Genoa are both medium sized cities, with 400,000 and 850,000 inhabitants, respectively.
- During the last century, both cities have grown around their walled historic centres, so as to integrate within a wider conurbation several minor settlements present in their surroundings.
- Both disasters have stricken one of the most congested spatial elements of the road network, namely a bridge ordinarily subjected to crowding due to a continuous and intense vehicular traffic.
- Both bridges belonged to a motorway passing through a metropolitan area.
- The collapse of both bridges provoked a larger crisis affecting the road network system at a national, regional and urban scale.
- In both cases a large part of the traffic flowing in the destroyed motorway sections was originated from vehicles moving from an origin to a destination within the urban area [50].
5.2. ASA Genoa
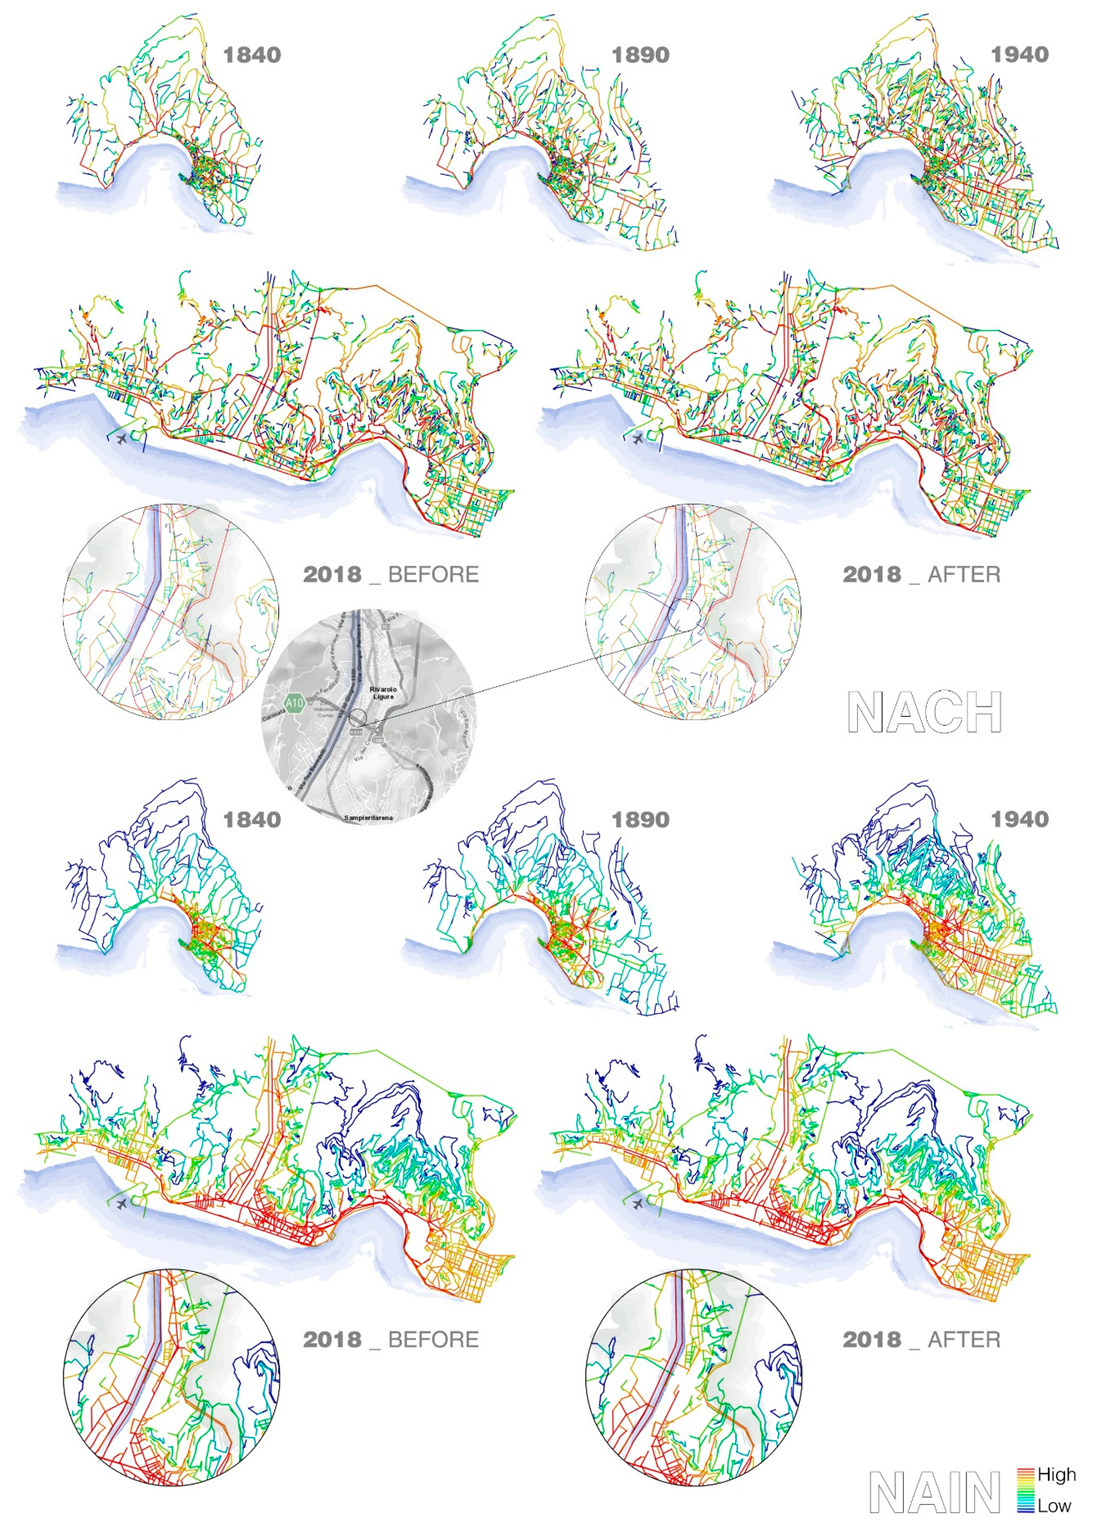
Figure 3 and Figure 4 show the results of the diachronic analysis of Genoa. The city has an articulated topography which has constrained urban development between the sea and the surrounding mountains. Its territory suffers from a structural hydrologic fragility and is marked by the presence of the Polcevera river. The maps show that Genoa was, until 1940, rather compact and well inter-connected. Then, it has rapidly grown westwards, so as to include various suburban nuclei. This expansion has marked the genesis of a wider urban conurbation forming a radically different urban system with a new road network structure.

Figure 3.
Genoa diachronic analysis, Normalised Angular Integration (NAIN) r800 m.
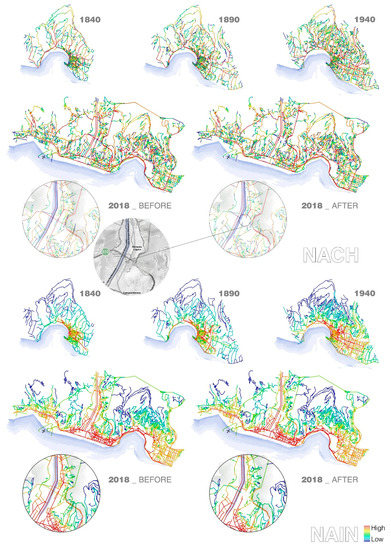
Figure 4.
Genoa diachronic analysis, Normalised Angular Choice (NACH) and NAIN radius n.
The modern configuration has caused the decentralisation of the city, whose centre has shifted from the historic core towards the west, somewhere between the old and the new parts of town. There, a few streets with a high value of both NACH and NAIN in the connection fabric have assumed a new central role. This is the case of the streets running along the port, parallel to the coast, or of those perpendicular to them, located under the collapsed Polcevera bridge (see zooms in Figure 4). As evidenced by Figure 3, which represents the distribution of NAIN r800 (radius = 800 m), in the modern town the historic centre retains merely a level of local centrality.
The distribution of NACH in the 2018 configuration of Genoa highlights the strategic role of the bridge in the road network, which forms a key link between two parts of the city that would otherwise be separated. It shows that the A10 motorway assumes a promiscuous function, as it serves both the heavy and intense traffic running along the Italian Tyrrhenian coast and a significant slice of Genoa’s internal traffic. Arguably, this can explain the heavy impact that the bridge collapse has had on its internal traffic. Additionally, the absence of obvious alternatives around the bridge, corresponding to the lack of paths of a similar hierarchical importance in the surroundings (see zooms in Figure 4), prevented a smooth redirection of traffic to suitable alternative routes.
The outputs of the analysis of the 2018 post-disaster situation align with the facts reported in the news about the high traffic pressure experienced in the already crowded coastal roads, which convinced the local authorities to order their widening to avoid major bottlenecks. A new set of temporary routes was also designed to reconnect Genoa international airport to the Eastern half of the A10, which leads from Genoa to the port of Livorno. Overall, the ASA indicates that Genoa’s road network system depends on a limited set of road segments for its functioning, which is in line with the facts reported in the local and national news. It highlights that the preconditions for the events that followed the disasters were created during the modern development of the city and by a lack of adequate risk management targeting road axes with the highest centrality values.
Nevertheless, in the medium-term, Genoa was able to face the transportation crisis that followed the crash of the Polcevera bridge better than expected, because other resilience mechanisms were activated. Local communities exploited alternative public transport systems in an autonomous manner. Amirfeiz et al. [50] report a rapid increase in the number of public transport tickets and passes sold in the city in the months following the disaster. This shows the resilience of the local population, which responded to the difficulties experienced with vehicular traffic by activating a process of self-organised redistribution of movement on other, arguably more virtuous, transport modes. This behavioural adaptability supported a better functioning of the urban system at a time of crisis, somehow compensating for the lack of resilience of the urban grid and thus adding to the general urban resilience of the city. Even though further investigations on these aspects exceed the scope of this study, a holistic synthesis of results should consider how changes in collective habits and behavioural patterns—as a form of social adaptation to changing transport conditions—essentially contribute to enhance urban resilience.
5.3. ASA Bologna
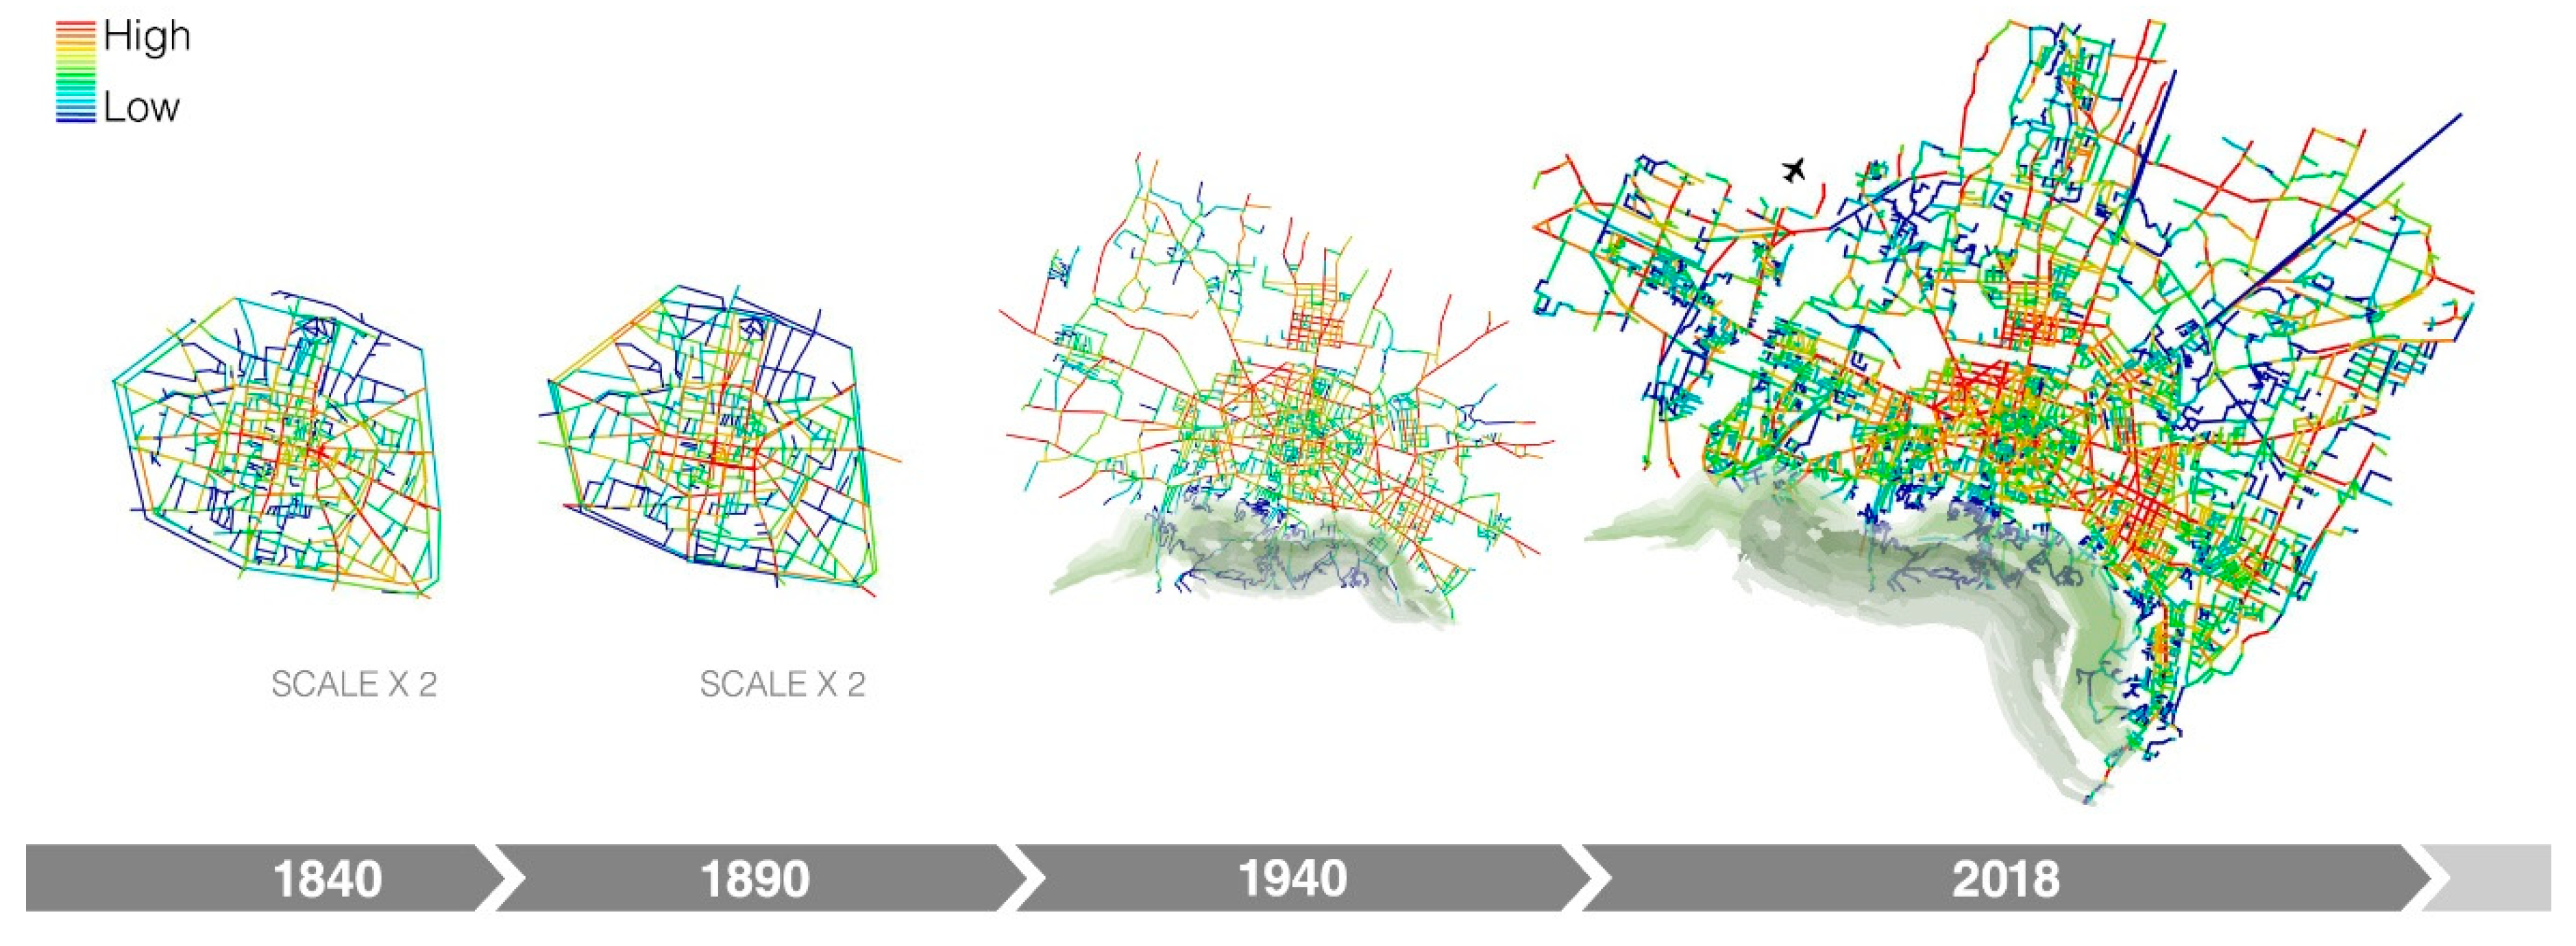
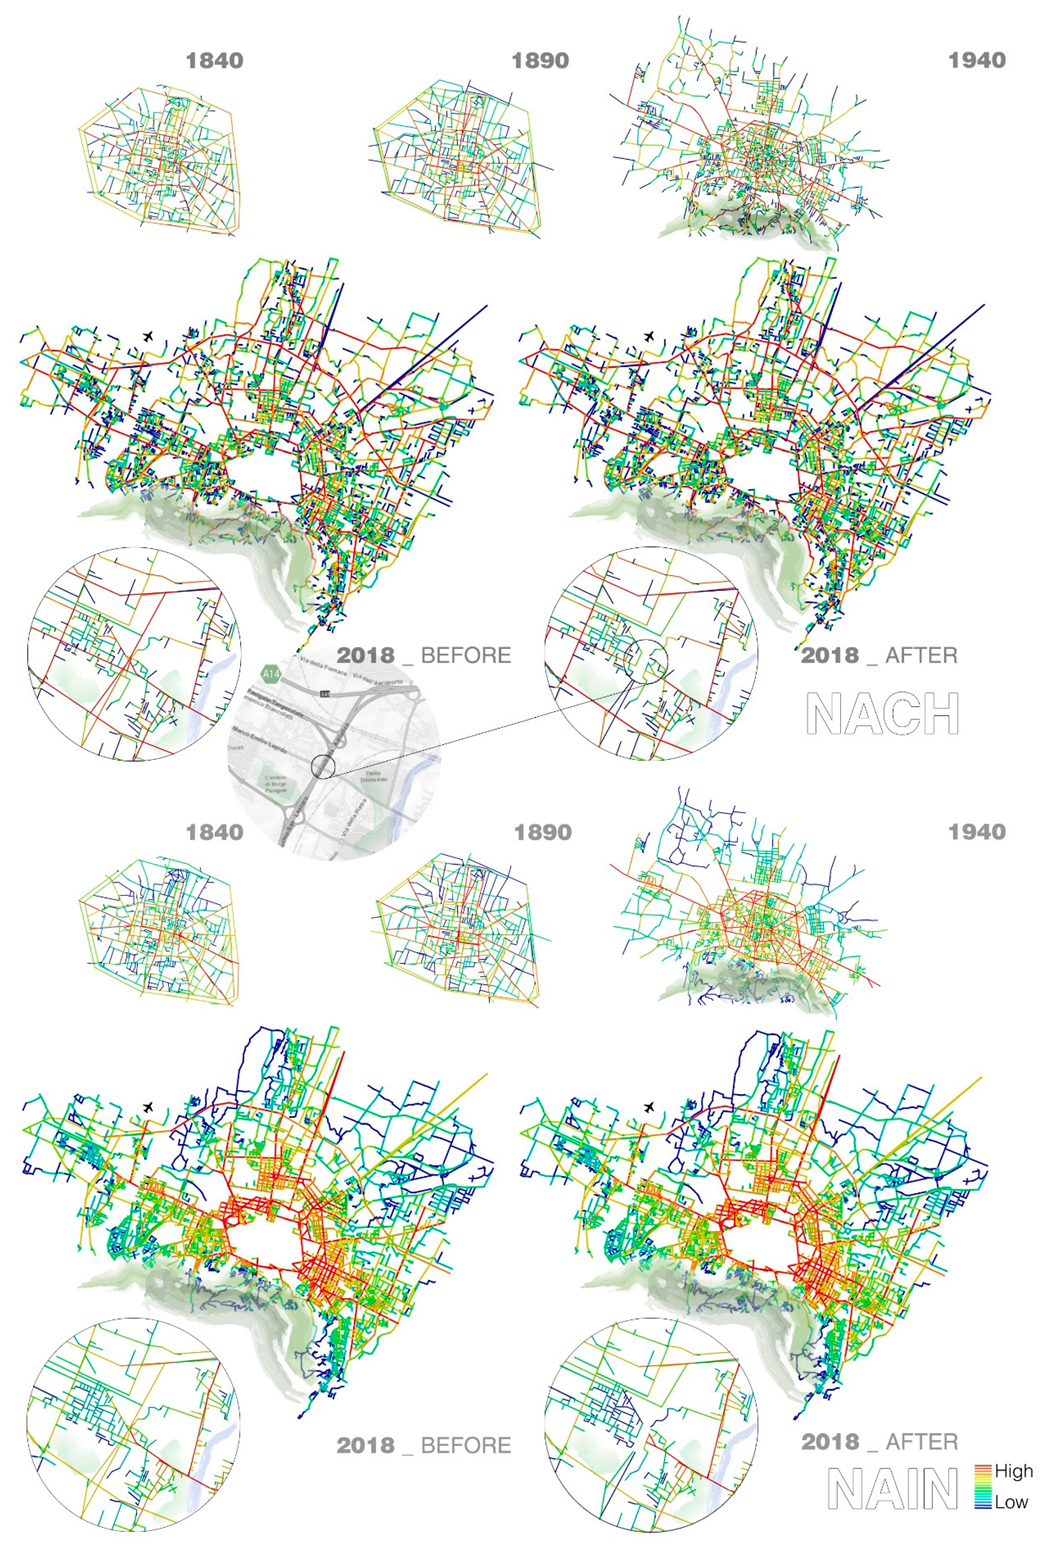
Figure 5 and Figure 6 show that Bologna grew significantly after World War II, undergoing a rapid urban development which led to a fusion with its suburban nuclei, initiated in the first decades of the 20th century. Bologna has evolved more coherently than Genoa, as, while expanding, it incremented the number of concentric rings and connected radial roads in line with the spokes-and-hub pattern of the historic city. This pattern is only interrupted in the southern part of the city, due to the presence of a hilly region at the feet of the Apennines. Figure 5, which illustrates the local distribution of NAIN, displays a result similar to that of the global (Rn) analysis displayed in Figure 6. This evidences that the historic centre of Bologna is not merely the repository of a local centrality, but rather the configurational core of the entire urban system. Overall, Bologna presents a good balance between the characteristics of Modularity [51], Diversity and Connectivity. In fact, the foreground network links clusters of strongly connected segments, which are weakly linked to the global network system. This way, the road network “modules” are both independent and accessible. From the analysis it is possible to conclude that Bologna has not been impacted by the collapse of the bridge (located on the west side of the outer ring) as brutally as Genoa—at least partially, because of the better spatial consistency of its road network. In fact, Figure 6 shows that the distribution of NAIN remained practically unaltered after the disaster, and consequently the accessibility and attractiveness of Bologna’s central locations was maintained after the crash.
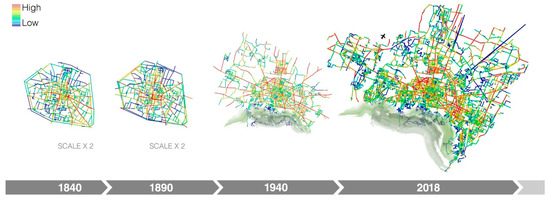
Figure 5.
Bologna diachronic analysis, NAIN r800 m.
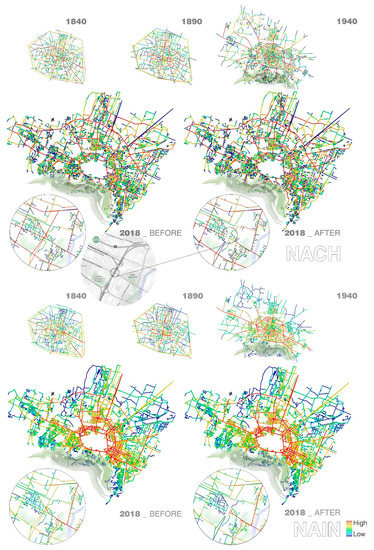
Figure 6.
Bologna diachronic analysis, NACH and NAIN radius n.
Figure 6 shows some variations in the global distribution of NACH, meaning that the impact of the disaster was higher on the through-movement pattern, due to the loss of an important link of the network’s foreground structure.
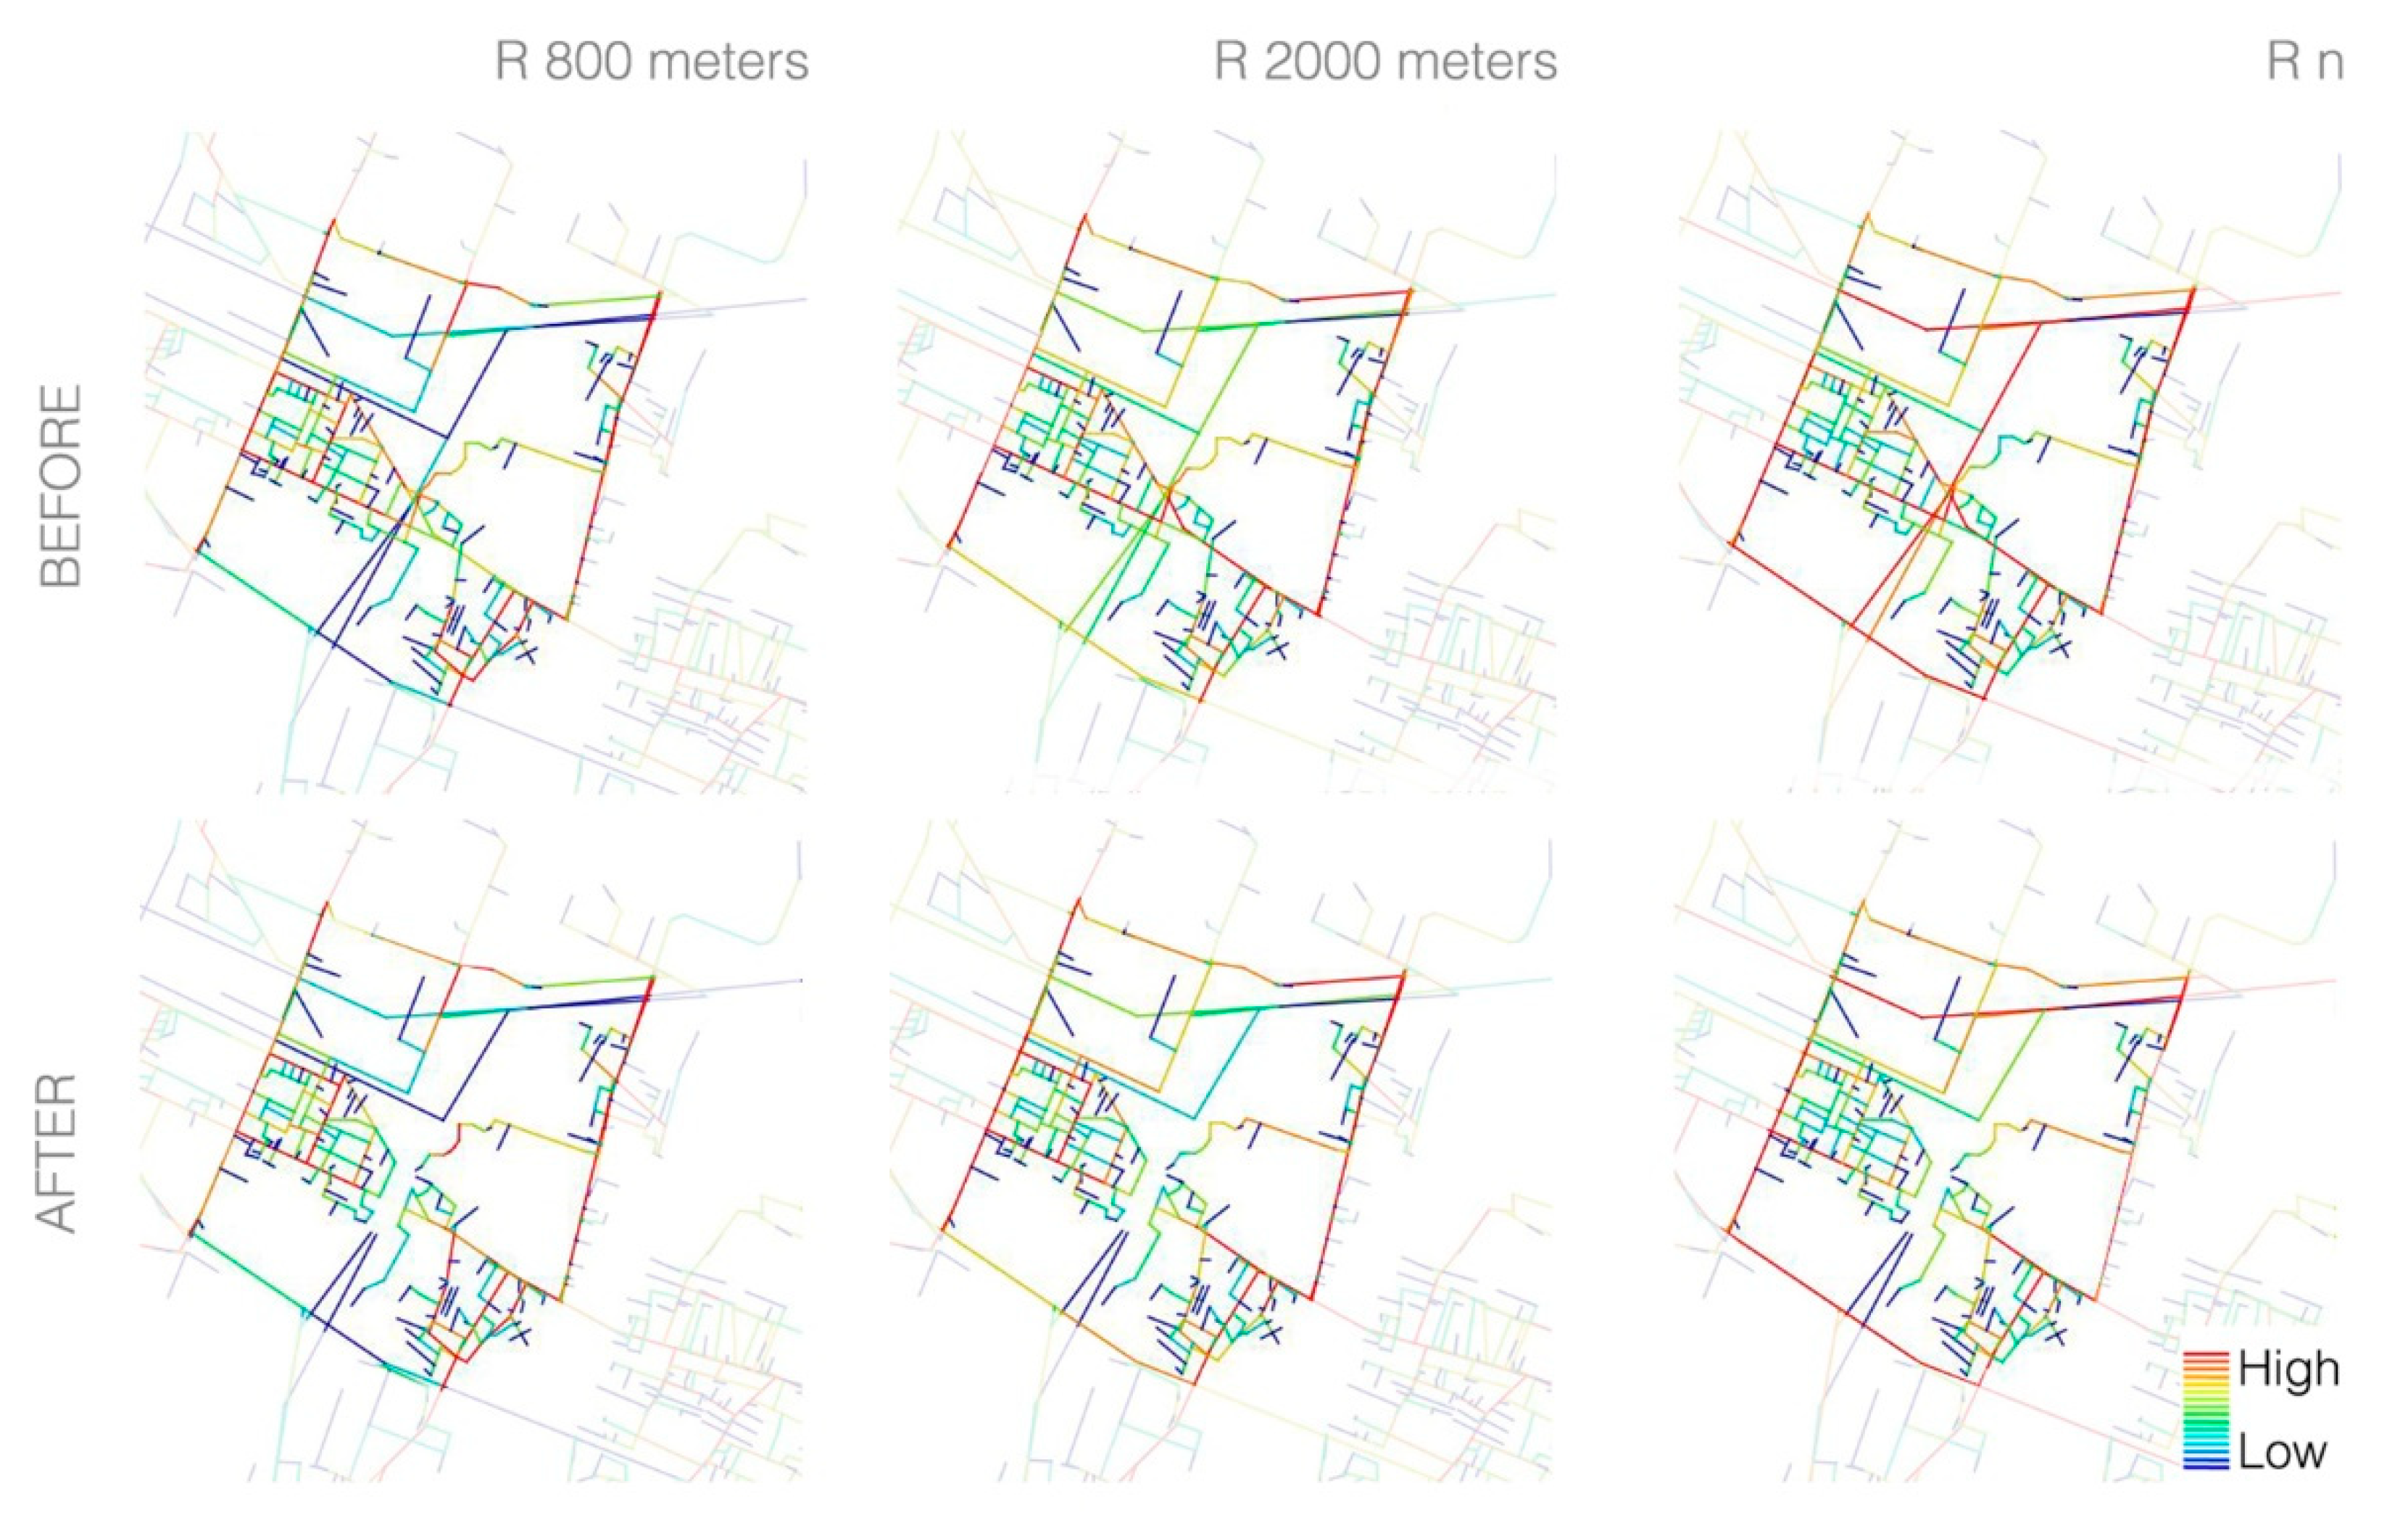
The multi-radius analysis presented in Figure 7 confirms that the collapse of the bridge impacted Bologna’s network globally but not locally. This was confirmed by the news reporting traffic congestions during long-distance journeys across the city [52]. Finally, Figure 7 shows that some slowdowns around the area could have been expected, as the flows of the impacted neighbourhood (Borgo Panigale) were naturally redirected towards its edges—despite the presence of a few roads of similar configurational importance in the immediate surroundings, which should have facilitated the management of global flows.
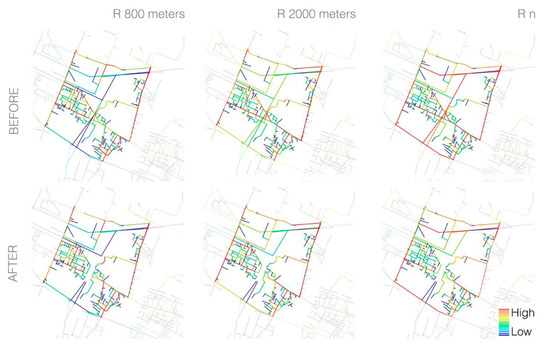
Figure 7.
Borgo Panigale before and after the bridge collapse, NACH different radii (800 m, 2000 m, n).
5.4. Resilience Assessment
This section presents, in order: (i) the plots of the regressions used to retrieve the Synergy Coefficient; (ii) a diachronic comparative analysis of the Mean Connectivity, Frequency and Synergy indices; and (iii) a hierarchical clustering based on the Gini coefficients.
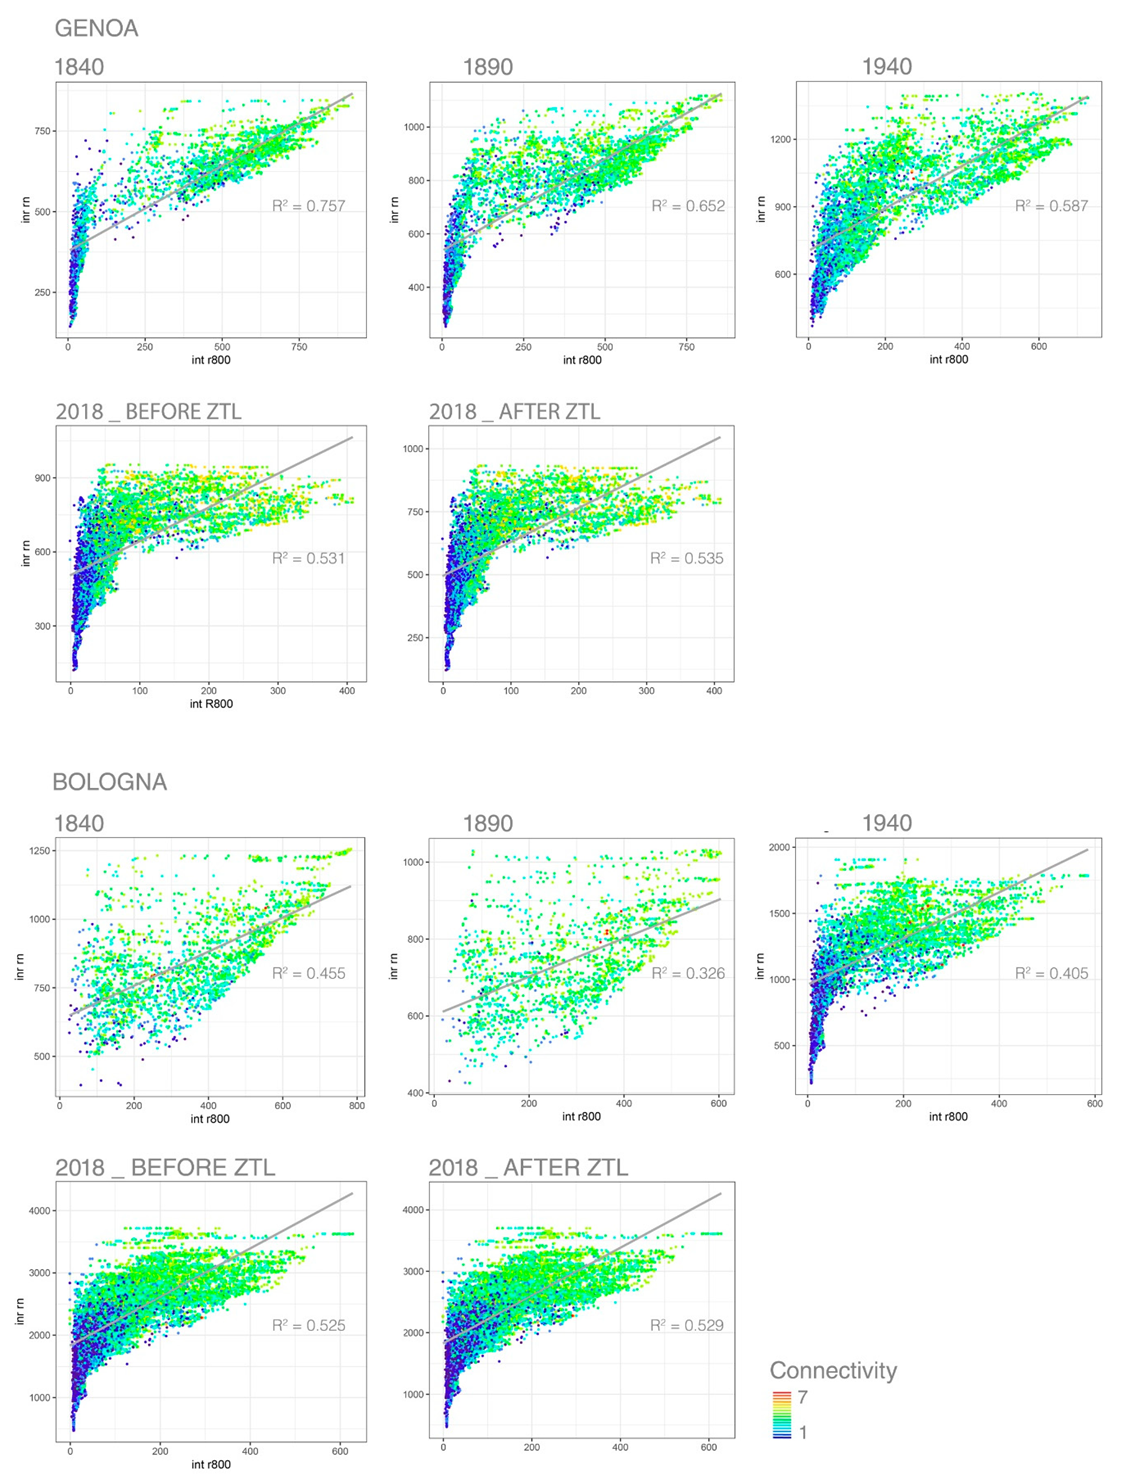
The Mean Connectivity and Frequency indices were calculated using simple arithmetic on the results of the ASA, whereas computing the Synergy and Gini coefficients required further processing of the analysis outputs in RStudio. A linear regression between the distribution of the local (R800 m) and global (Rn) Integration Indices of Genoa and Bologna was performed to retrieve the Synergy Coefficients. Figure 8 shows the resulting scatterplots, where points are coloured according to the Connectivity values of the corresponding road segments, together with the regression lines and the associated R2.
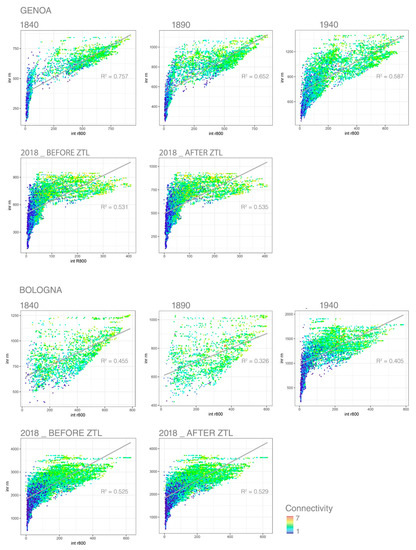
Figure 8.
Genoa and Bologna Synergy and Connectivity plots.
In most cases—interestingly, in both cities, and signally in Genoa—before the disaster, in 2018, the plots present a tail of scarcely locally integrated segments with low Connectivity values and a small number of central nodes with high ones, which suggests a scale-free behaviour of the road network systems [53]. This can explain the non-negligible impact that the failure of an important node had on both networks. According to the results of Nilsson & Gil [54], the scale-free hypothesis seems plausible, as both Genoa and Bologna present an organic street network structure.
The values of the four resilience indices, in each of the 14 analysed street network configurations, are reported in Table 2. This includes the Gini Coefficients relative to the global distribution of Choice and Integration in both cities, in each network configuration (including 2018 before and after the crash, with and without ZTL). These were automatically computed after plotting the Lorenz Curves of the corresponding ASA configurational indices in RStudio, using the R package ineq. [55].

Table 2.
Street network resilience indices.
To enable a comparative assessment of results, a line chart plot was produced (see Figure 9). This excludes the Gini Coefficients, because the differences among them are harder to appreciate using this data visualisation technique, and were thus separately studied via a Hierarchical Clustering (HC) analysis, which was performed using the stats v3.6.2 package in RStudio [56] (see Figure 10).

Figure 9.
Street network resilience line charts.
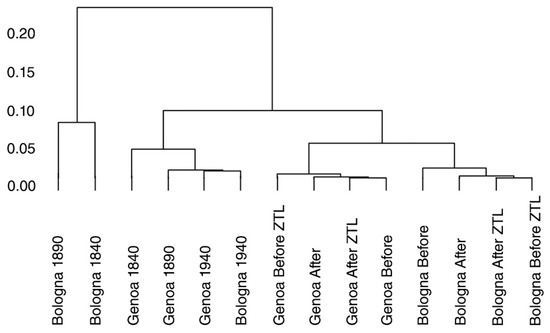
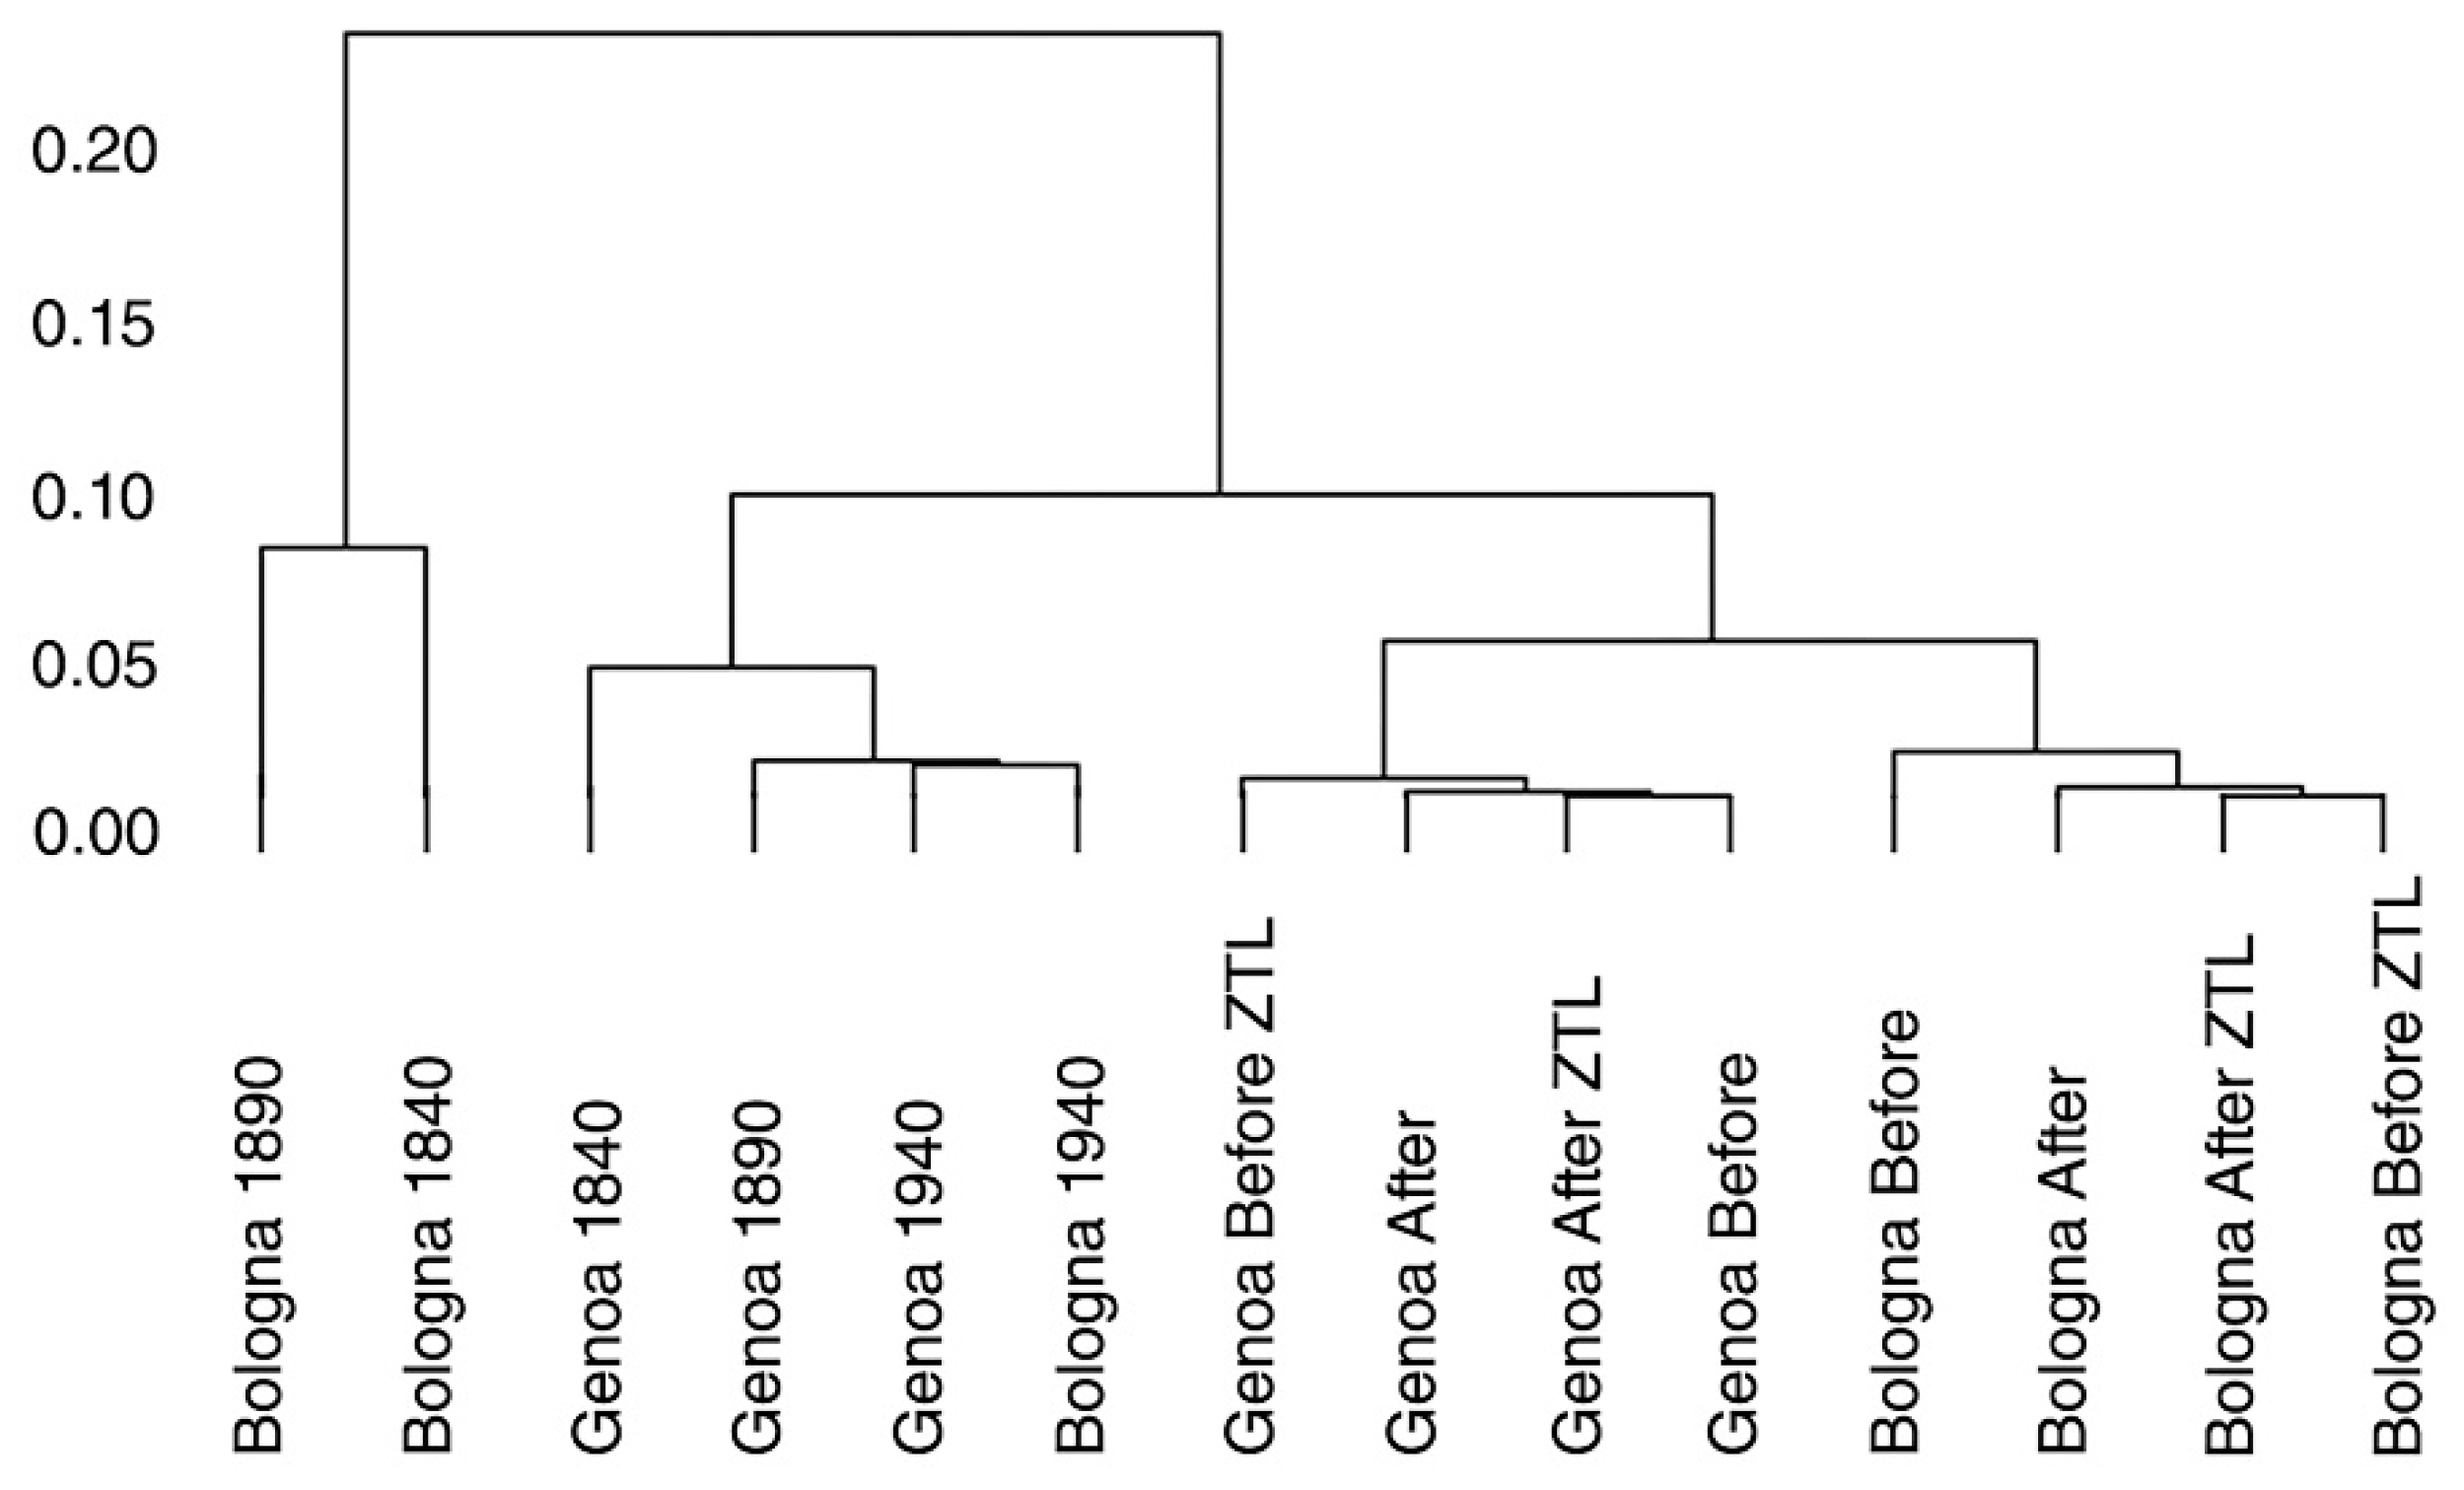
Figure 10.
Hierarchical tree based on two Gini coefficients (Choice Rn and Integration Rn).
Figure 9 shows that the spatial transformations undergone by the cities of Genoa and Bologna between 1940 and 2018 have substantially influenced the resilience of the two road networks.
First, a progressive decrease of Mean Connectivity is registered in both cities and reflects a lower redundancy of connections in the contemporary network systems.
Second, the Frequency Index increases with time in Genoa and Bologna, which evidences a rise in the number of vulnerable, tree-like road network elements. The phenomenon is more accentuated in Genoa, which registers a steep acceleration in this direction during its modern expansion: the sharp increase of the Frequency Index in the 40 s reflects a potential problem of crowding and highlights the emergence of a difficult transport situation, which is the likely effect of an immature urban growth. To prevent localised attacks from isolating important parts of the road system [27], Genoa’s street network would require additional links to reinforce the resilience of its (tree-like) branching roads, so as to create leaf-like network structures.
In Bologna, the slight increase of the Frequency Index after the bridge’s collapse suggests that the motorway plays an important role in linking different parts of the urban grid. There is, however, little evidence that this is the case for Genoa too, which calls into question the beneficial role—in configurational terms—of the A10 motorway as a supplement and support to the functioning of the urban grid.
Third, the positive trend of Bologna’s Synergy Coefficient reflects a shift towards a more hierarchically structured system. Conversely, Genoa suffered a progressive decrease of cross-scale spatial accessibility during its expansion process, which may allow us to identify it as a form of urban sprawl. Noticeably, despite their different trends, the two cities had almost the same Synergy Coefficient at the time of the disaster.
Figure 10 shows the result of the HC analysis used to compare the two retrieved Gini Coefficients (columns 2 and 3 of Table 2), by identifying groups of similar road network patterns in terms of movement distribution. The clusters are defined automatically by the algorithm, by computing and comparing, for each road network pair, the Euclidean distances between the Gini Coefficients, using the complete linkage method. The hierarchical tree or dendrogram resulting from this iterative pairing process confirms some of the observations made in Section 5.2 and Section 5.3. Specifically, the dendrogram shows that the bridge incident has impacted Genoa more than Bologna, especially during the hours when the ZTL was active, because the distance between the Before ZTL and After ZTL situations is higher in the former case, while in Bologna these two configurations are paired early. This distance is less accentuated in Genoa when the ZTL is not active. This correlates well with the documental evidence and confirms previous conclusions about Bologna experiencing a major change between 1890 and 1940, and Genoa undergoing a large transformation between 1940 and 2018. Additionally, the distance between the configuration of Bologna 1940 and Bologna 2018, in Figure 10, corresponds to the second wave of expansion of the city.
6. Discussion
Some key lessons can be learned from the analysis of Genoa and Bologna for feed-forward risk management and future urban planning and design practices (see Table 3). The implications seem twofold. From a methodological standpoint, the findings substantiate the reliability of the configurational approach for the analysis of urban settlements and, more specifically, as a tool for supporting and orienting their planning: results confirm that the configuration of the urban grid is a key determinant of the spatial morphology of cities and an important component of the resilience of urban form. On a more concrete note, other implications involve issues of urban form and structure, providing indications for their comprehension and guidelines for their planning. In the specific case studies, the results show that a localised failure of a key central node—in our case a bridge—can, under certain conditions, seriously impact the global functioning of a road network system. The seriousness of the flow alterations caused by the bridge crashes could have been anticipated by using the proposed analysis methods and tools, which could have supported decision-making both in the disaster preparedness (via scenario simulations) and response phases (in situation assessments).

Table 3.
Summary of practical implications.
The outputs of the case studies point out how the extent and course of such alterations are decisively influenced by the configuration of the urban grid, due to its capacity to adaptively react to external stresses and unpredictable changes. This involves the matter of street network resilience, and the paper provides specific guidelines and keywords for detecting, preserving, and enhancing it. The first keyword is redundancy, both in terms of local connections and available paths between any two spatial elements. The greater the richness of alternative routes, the lesser the risk that local disruptions might affect (or even wipe out) the accessibility of some urban areas, jeopardising the working of the whole system. The second one is synergy, intended as inner spatial coherence: the more narrowly the distribution of local Integration corresponds to the pattern of global Integration, the less a local alteration is likely to affect the functioning of the whole settlement, which results in a robust correlation of the local with the global distribution of to-movement.
A further requirement for urban resilience is the widespread diffusion of the shortest paths over many spatial elements. Should all the paths be polarised onto just a few street segments, those elements would become the Achilles’ heel of the whole road system, i.e., the points of highest vulnerability, as any perturbation could upset or even break the whole system, should it only disrupt them. This is dramatically confirmed by the paradigmatic case of a bridge, and in particular by that of the Polcevera bridge in Genoa. Configurational analysis techniques provide some parameters for reproducing such essential properties, and those indices were here proved to be reliable tools for appraising and measuring street network resilience.
In alternative or in addition to the proposed road network resilience indicators, further indices can be used to analyse aspects related to other resilience principles (e.g., self-organisation, memory, innovation, modularity, etc.), which were not specifically addressed in this study. The choice of a suitable set of resilience capacity indicators should in all cases match the characteristics of the analysed city and its stage of development. In this study, a comparative analysis focused on the same aspects of the road network system could be done because the two cities and their disasters were somehow comparable.
The necessity to read the results of this analysis within their context and in relation to a specific alteration is confirmed by the finding that, in Genoa, the self-organisation capacity of the population and the availability of other public transportation networks played an important role in compensating for a deficient road network system. Here, the virtuous response of the citizens to the road system crisis could not be accounted for in the street network analysis as it was partially related to a non-physical resilience factor, which should nonetheless should be factored in urban planning and design.
7. Conclusions
This study clarified how two road network systems in two apparently similar situations may differ in their response to a localised failure and reorganise. The information retrieved from local news matched the simulated outputs in both cities, which confirms the suitability of the proposed method to tackle aspects concerning the resilience of urban form across spatial scales and time, and qualitatively validates previous theoretical research on road network resilience modelling. However, ad-hoc empirical evidence and disaggregated data (e.g., flow data on certain street segments) were not used in this study and would represent an important resource to further test the method. To this end, GPS data and information repositories such as those of global street navigation services could be exploited.
Despite this limitation, the study: (i) shows the influence of the grid configuration on the capacity of the road system to cope with local failures; (ii) demonstrates the effectiveness/reliability of the proposed indices in measuring street network resilience; (iii) provides evidence that urbanisation processes can either add or detract from urban resilience. Therefore, the proposed method shows potential to support innovative PBP approaches and a better management of urban development processes, in addition to urban risk management.
The research exploited two recent dramatic occurrences to further the discussion on urban resilience, shedding light from a particular point of view on a highly complex issue, where different questions, areas of interest, disciplinary fields, methods and approaches converge, overlap and interlace; the results appear significant but far from conclusive, suggesting some useful research developments in the same direction.
While the scope of this paper is restricted to a few key topological qualities of urban street networks, future research could look at integrating the configurational and the geometric approaches (as suggested also by [19]), to study the interplay between resilience and urban form in an even more comprehensive manner.
Other promising avenues for research could come from the integration of configurational and social studies, by exploring the extent to which social habits and behavioural patterns modify and adapt to spatial changes, thus providing a settlement with an additional supply of urban resilience.
Author Contributions
This work is the outcome of a joint effort of the authors: conceptualization, V.C. and C.P.; methodology, V.C. and C.P.; software, C.P.; validation, V.C. and C.P.; formal analysis, C.P.; investigation, V.C. and C.P.; resources, V.C.; data curation, V.C. and C.P.; writing—original draft preparation, V.C. and C.P.; writing—review and editing, C.P.; visualization, C.P.; supervision, V.C. All authors have read and agreed to the published version of the manuscript.
Funding
This research was funded by the University of Pisa, Research Project PRA_2018_35 “Approcci eco-sostenibili per i sistemi idrici e la riqualificazione del territorio in ambito urbano.”
Conflicts of Interest
The authors declare no conflict of interest.
References
- United Nations, World Population Prospects 2019 Highlights, 2019. Available online: https://population.un.org/wpp/Publications/Files/WPP2019_Highlights.pdf (accessed on 11 February 2020).
- United Nations, The 2030 Agenda for Sustainable Development. New York: United Nations General Assembly, 2015. Available online: https://sustainabledevelopment.un.org/post2015/transformingourworld/publication (accessed on 11 February 2020).
- UNDRR, Sendai Framework for Disaster Risk Reduction, 2015. Available online: https://www.unisdr.org/we/coordinate/sendai-framework (accessed on 31 May 2019).
- Borsekova, K.; Nijkamp, P. Resilience and Urban Disasters: Surviving Cities; Edward Elgar Publishing: Cheltenham, UK, 2019. [Google Scholar]
- Cariolet, J.M.; Vuillet, M.; Diab, Y. Mapping urban resilience to disasters–A review. Sustain. Cities Soc. 2019, 51. [Google Scholar] [CrossRef]
- Botequilha-Leitão, A.; Díaz-Varela, E.R. Performance Based Planning of complex urban social-ecological systems: The quest for sustainability through the promotion of resilience. Sustain. Cities Soc. 2020, 56. [Google Scholar] [CrossRef]
- Pelorosso, R. Modeling and urban planning: A systematic review of performance-based approaches. Sustain. Cities Soc. 2020, 52. [Google Scholar] [CrossRef]
- Kato, S.; Ahern, J. ‘Learning by doing’: Adaptive planning as a strategy to address uncertainty in planning. J. Environ. Plan. Manag. 2008, 51, 543–559. [Google Scholar] [CrossRef]
- Hillier, B.; Hanson, J. The Social Logic of Space; Cambridge University Press: Cambridge, UK, 1984. [Google Scholar]
- Cutini, V. The city, when it trembles: Earthquake destructions, post-earthquake reconstructions and grid configuration. In Proceedings of the 9th International Space Syntax Symposium, Seoul, Korea, 31 October–3 November 2013; Sejong University Press: Seoul, Korea, 2013; pp. 102:1–102:17. [Google Scholar]
- Pezzica, C.; Cutini, V.; Bleil De Souza, C. Rapid configurational analysis using OSM data: Towards the use of Space Syntax to orient post-disaster decision making. In Proceedings of the 12th International Space Syntax Symposium, Beijing, China, 8–13 July 2019; Beijing JiaoTong University: Beijin, China, 2019; pp. 147.1–147.18. [Google Scholar]
- Chelleri, L. From the «Resilient city» to urban resilience. a review essay on understanding and integrating the resilience perspective for urban systems. Doc. d’Analisi Geogr. 2012, 58, 287–306. [Google Scholar] [CrossRef]
- Batty, M. The size, scale, and shape of cities. Science 2008, 319, 769–771. [Google Scholar] [CrossRef]
- Portugali, J. Complexity, Cognition and the City; Springer: Berlin/Heidelberg, Germany, 2011. [Google Scholar]
- Ribeiro, P.J.G.; Pena Jardim Gonçalves, L.A. Urban resilience: A conceptual framework. Sustain. Cities Soc. 2019, 50. [Google Scholar] [CrossRef]
- Elmqvist, T.; Barnett, G.; Wilkinson, C. Exploring urban sustainability and resilience. In Resilient Sustainable Cities; Pearson, L., Newton, P., Roberts, P., Eds.; Routledge: London, UK, 2014; pp. 31–40. [Google Scholar]
- Janssen, M.A.; Bodin, Ö.; Anderies, J.M.; Elmqvist, T.; Ernstson, H.; McAllister, R.R.J.; Olsson, P.; Ryan, P. Toward a network perspective of the study of resilience in social-ecological systems. Ecol. Soc. 2006, 11. [Google Scholar] [CrossRef]
- Elmqvist, T. Development: Sustainability and resilience differ. Nature 2017, 546, 352. [Google Scholar] [CrossRef]
- Marcus, L.; Colding, J. Toward an integrated theory of spatial morphology and resilient urban systems. Ecol. Soc. 2014, 19. [Google Scholar] [CrossRef]
- Masnavi, M.R.; Gharai, F.; Hajibandeh, M. Exploring urban resilience thinking for its application in urban planning: A review of literature. Int. J. Environ. Sci. Technol. 2019, 16, 567–582. [Google Scholar] [CrossRef]
- Sharifi, A.; Yamagata, Y. Resilient Urban Form: A Conceptual Framework. Lect. Notes Energy 2018, 65, 167–179. [Google Scholar] [CrossRef]
- Jacobs, J. The Death and Life of Great American Cities; Vintage bo.: New York, NY, USA, 1961. [Google Scholar]
- Chokhachian, A.; Perini, K.; Giulini, S.; Auer, T. Urban Performance and Density: Generative Study on Interdependencies of Urban Form and Environmental Measures. Sustain. Cities Soc. 2019, 53. [Google Scholar] [CrossRef]
- Feliciotti, A.; Romice, O.; Porta, S. Design for change: Five proxies for resilience in the urban form. Open House Int. 2016, 41, 23–30. [Google Scholar]
- Sharifi, A. Resilient urban forms: A macro-scale analysis. Cities 2019, 85, 1–14. [Google Scholar] [CrossRef]
- Sharifi, A. Urban form resilience: A meso-scale analysis. Cities 2019, 93, 238–252. [Google Scholar] [CrossRef]
- Sharifi, A. Resilient urban forms: A review of literature on streets and street network. Build. Environ. 2019, 147, 171–187. [Google Scholar] [CrossRef]
- Koch, D.; Marcus, L.; Steen, J.; Lee, I.H.; Kim, Y.O. The Effect of Spatial Configuration and Land Use Pattern on Land Price Formation. In Proceedings of the 7th International Space Syntax Symposium, Stockholm, Sweden, 8–11 June; KTH: Stockholm, Sweden, 2009; pp. 063:1–063:12. [Google Scholar]
- Kim, H.K.; Sohn, D.W. An analysis of the relationship between land use density of office buildings and urban street configuration: Case studies of two areas in Seoul by space syntax analysis. Cities 2002, 19, 409–418. [Google Scholar] [CrossRef]
- Lhomme, S.; Serre, D.; Diab, Y.; Laganier, R. Analyzing resilience of urban networks: A preliminary step towards more flood resilient cities. Nat. Hazards Earth Syst. Sci. 2013, 13, 221–230. [Google Scholar] [CrossRef]
- Porta, S.; Crucitti, P.; Latora, V. The Network Analysis of Urban Streets: A Primal Approach. Environ. Plan. B Plan. Des. 2006, 33, 705–725. [Google Scholar] [CrossRef]
- Porta, S.; Crucitti, P.; Latora, V. The network analysis of urban streets: A dual approach. Phys. A Stat. Mech. Appl. 2006, 369, 853–866. [Google Scholar] [CrossRef]
- Pezzica, C.; Cutini, V.; Bleil de Souza, C.; Santucci, A. Adapting analysis workflows to humanitarian needs: Different road network models and tools. In Advances in Science, Technology & Innovation. In Proceedings of the 5th International Symposium Formal Methods in Architecture (5FMA), Lisbon, Portugal, 13–16 October 2020; Springer Nature: Berlin, Germany, in press.
- Abshirini, E.; Koch, D. Resilience, space syntax and spatial interfaces: The case of river cities. A/Z ITU J. Fac. Archit. 2017, 14, 25–41. [Google Scholar] [CrossRef]
- Cutini, V.; Di Pinto, V. On the slopes of Vesuvius: Configuration as a thread between hazard and opportunity. In Proceedings of the 10th International Space Syntax Symposium, London, UK, 13–17 July 2015; Space Syntax Laboratory: London, UK, 2015; pp. 066:1–066:16. [Google Scholar]
- Carpenter, A. Disaster resilience and the social fabric of space. In Proceedings of the 9th International Space Syntax Symposium, Seoul, Korea, 31 October–3 November 2013; Sejong University Press: Seoul, Korea, 2013; pp. 105:1–105:14. [Google Scholar]
- Cutter, S.L. Resilience to What? Resilience for Whom? Geogr. J. 2016, 182, 110–113. [Google Scholar] [CrossRef]
- Schipper, E.L.; Langston, L. A Comparative Overview of Resilience Measurement Frameworks: Analysing Indicators and Approaches. Working Paper 422, Overseas Development Institute, July 2015. Available online: https://www.odi.org/sites/odi.org.uk/files/odi-assets/publications-opinion-files/9754.pdf (accessed on 21 May 2020).
- Turner, A. From Axial to Road-Centre Lines: A New Representation for Space Syntax and a New Model of Route Choice for Transport Network Analysis. Environ. Plan. B Plan. Des. 2007, 34, 539–555. [Google Scholar] [CrossRef]
- Batty, M.; Rana, S. The Automatic Definition and Generation of Axial Lines and Axial Maps. Environ. Plan. B Plan. Des. 2004, 31, 615–640. [Google Scholar] [CrossRef]
- Varoudis, T. depthmapX by Varoudis. Available online: https://varoudis.github.io/depthmapX/ (accessed on 21 May 2020).
- Hillier, B.; Yang, T.; Turner, A. Normalising least angle choice in Depthmap and how it opens up new perspectives on the global and local analysis of city space. J. Sp. Syntax 2012, 3, 155–193. [Google Scholar]
- RStudio Team. RStudio: Integrated Development for R.; RStudio, Inc.: Boston, MA, USA, 2015. [Google Scholar]
- Dalton, N.S.C. Synergy, Inteligibility and Revelation in Neighbourhood Places. Ph.D. Thesis, UCL (University Coll. London), London, UK, November 2011. [Google Scholar]
- Salat, S.; Bourdic, L. Urban Complexity, Efficiency and Resilience. In Energy Efficiency—A Bridge to Low Carbon Economy; Morvaj, Z., Ed.; IntechOpen: London, UK, 2012; pp. 25–44. [Google Scholar]
- Gini, C. Indice di concentrazione e di dipendenza. Bibl. dell’Economista 1910, XX, 1–151. [Google Scholar]
- Lorenz, M.O. Methods of Measuring the Concentration of Wealth. Publ. Am. Stat. Assoc. 1905, 9, 209. [Google Scholar] [CrossRef]
- Huffpost, Genova alla Prova del Traffico Dopo il Crollo del Ponte: Nel Primo Lunedì di Settembre Code e Rallentamenti | L’HuffPost, 2018. Available online: https://www.huffingtonpost.it/2018/09/03/genova-alla-prova-del-traffico-dopo-il-crollo-del-ponte-nel-primo-lunedi-di-settembre-code-e-rallentamenti_a_23515229/ (accessed on 21 May 2020).
- Genova24.it, Traffico, via Albareto torna a doppio senso di marcia: Tra oggi e domani i lavori di ripristino della viabilità—Genova 24,” 2019. Available online: https://www.genova24.it/2019/03/traffico-via-albareto-torna-a-doppio-senso-di-marcia-tra-oggi-e-domani-i-lavori-di-ripristino-della-viabilita-213872/ (accessed on 3 February 2020).
- Amirfeiz, M.; Ruggeri, M.; Cenzuales, V. Ponte Morandi, Gronda e Ferrovia: Una Riflessione | CityRailways. Available online: https://cityrailways.com/ponte-morandi-gronda-e-ferrovia/ (accessed on 21 May 2020).
- Webb, C.; Bodin, Ö. A network perspective on modularity and control of flow in robust systems—Stockholm Resilience Centre. In Complexity Theory for a Sustainable Future; Norberg, J., Cumming, G., Eds.; Columbia Press: New York, NY, USA, 2008; pp. 85–118. [Google Scholar]
- Bologna Today, Incidente Bologna, Deviazione Chilometrica Durante i Lavori per il Ponte Tangenziale. Available online: http://www.bolognatoday.it/cronaca/incidente-bologna-deviazione-tangenziale-priolo-distanze.html (accessed on 21 May 2020).
- Barabási, A.-L. Linked: How Everything is Connected to Everything Else and What it Means for Business, Science, and Everyday Life, 2nd ed.; Basic Books: New York, NY, USA, 2014; pp. 1–294. [Google Scholar]
- Nilsson, L.; Gil, J. The Signature of Organic Urban Growth. In The Mathematics of Urban Morphology. Modeling and Simulation in Science, Engineering and Technology; D’Acci, L., Ed.; Springer: Cham, Switzerland, 2019; pp. 93–121. [Google Scholar] [CrossRef]
- Zeileis, A.; Kleiber, C. R package ineq. Measuring Inequality, Concentration, and Poverty. Comprehensive R Archive Network (CRAN), 2014. Available online: https://cran.r-project.org/web/packages/ineq/index.html (accessed on 21 May 2020).
- R-core, Stats Package | R Documentation. Available online: https://www.rdocumentation.org/packages/stats/versions/3.6.2 (accessed on 21 May 2020).
© 2020 by the authors. Licensee MDPI, Basel, Switzerland. This article is an open access article distributed under the terms and conditions of the Creative Commons Attribution (CC BY) license (http://creativecommons.org/licenses/by/4.0/).

