Characteristics and Determinants of Domestic Food Waste: A Representative Diary Study across Germany


Abstract
1. Introduction
2. Materials and Methods
2.1. Data Set
- place of residence within the federal state
- size category of municipality
- age of head of household
- net income of household
- household size
- employment of head of household
- formal education
- number of children in the household
- living circumstances
2.2. Extrapolation
2.3. Statistical Analysis
- household lifecycle stages,
- age of the head of the household,
- household size (number of persons),
- size category of municipality, and
- level of education
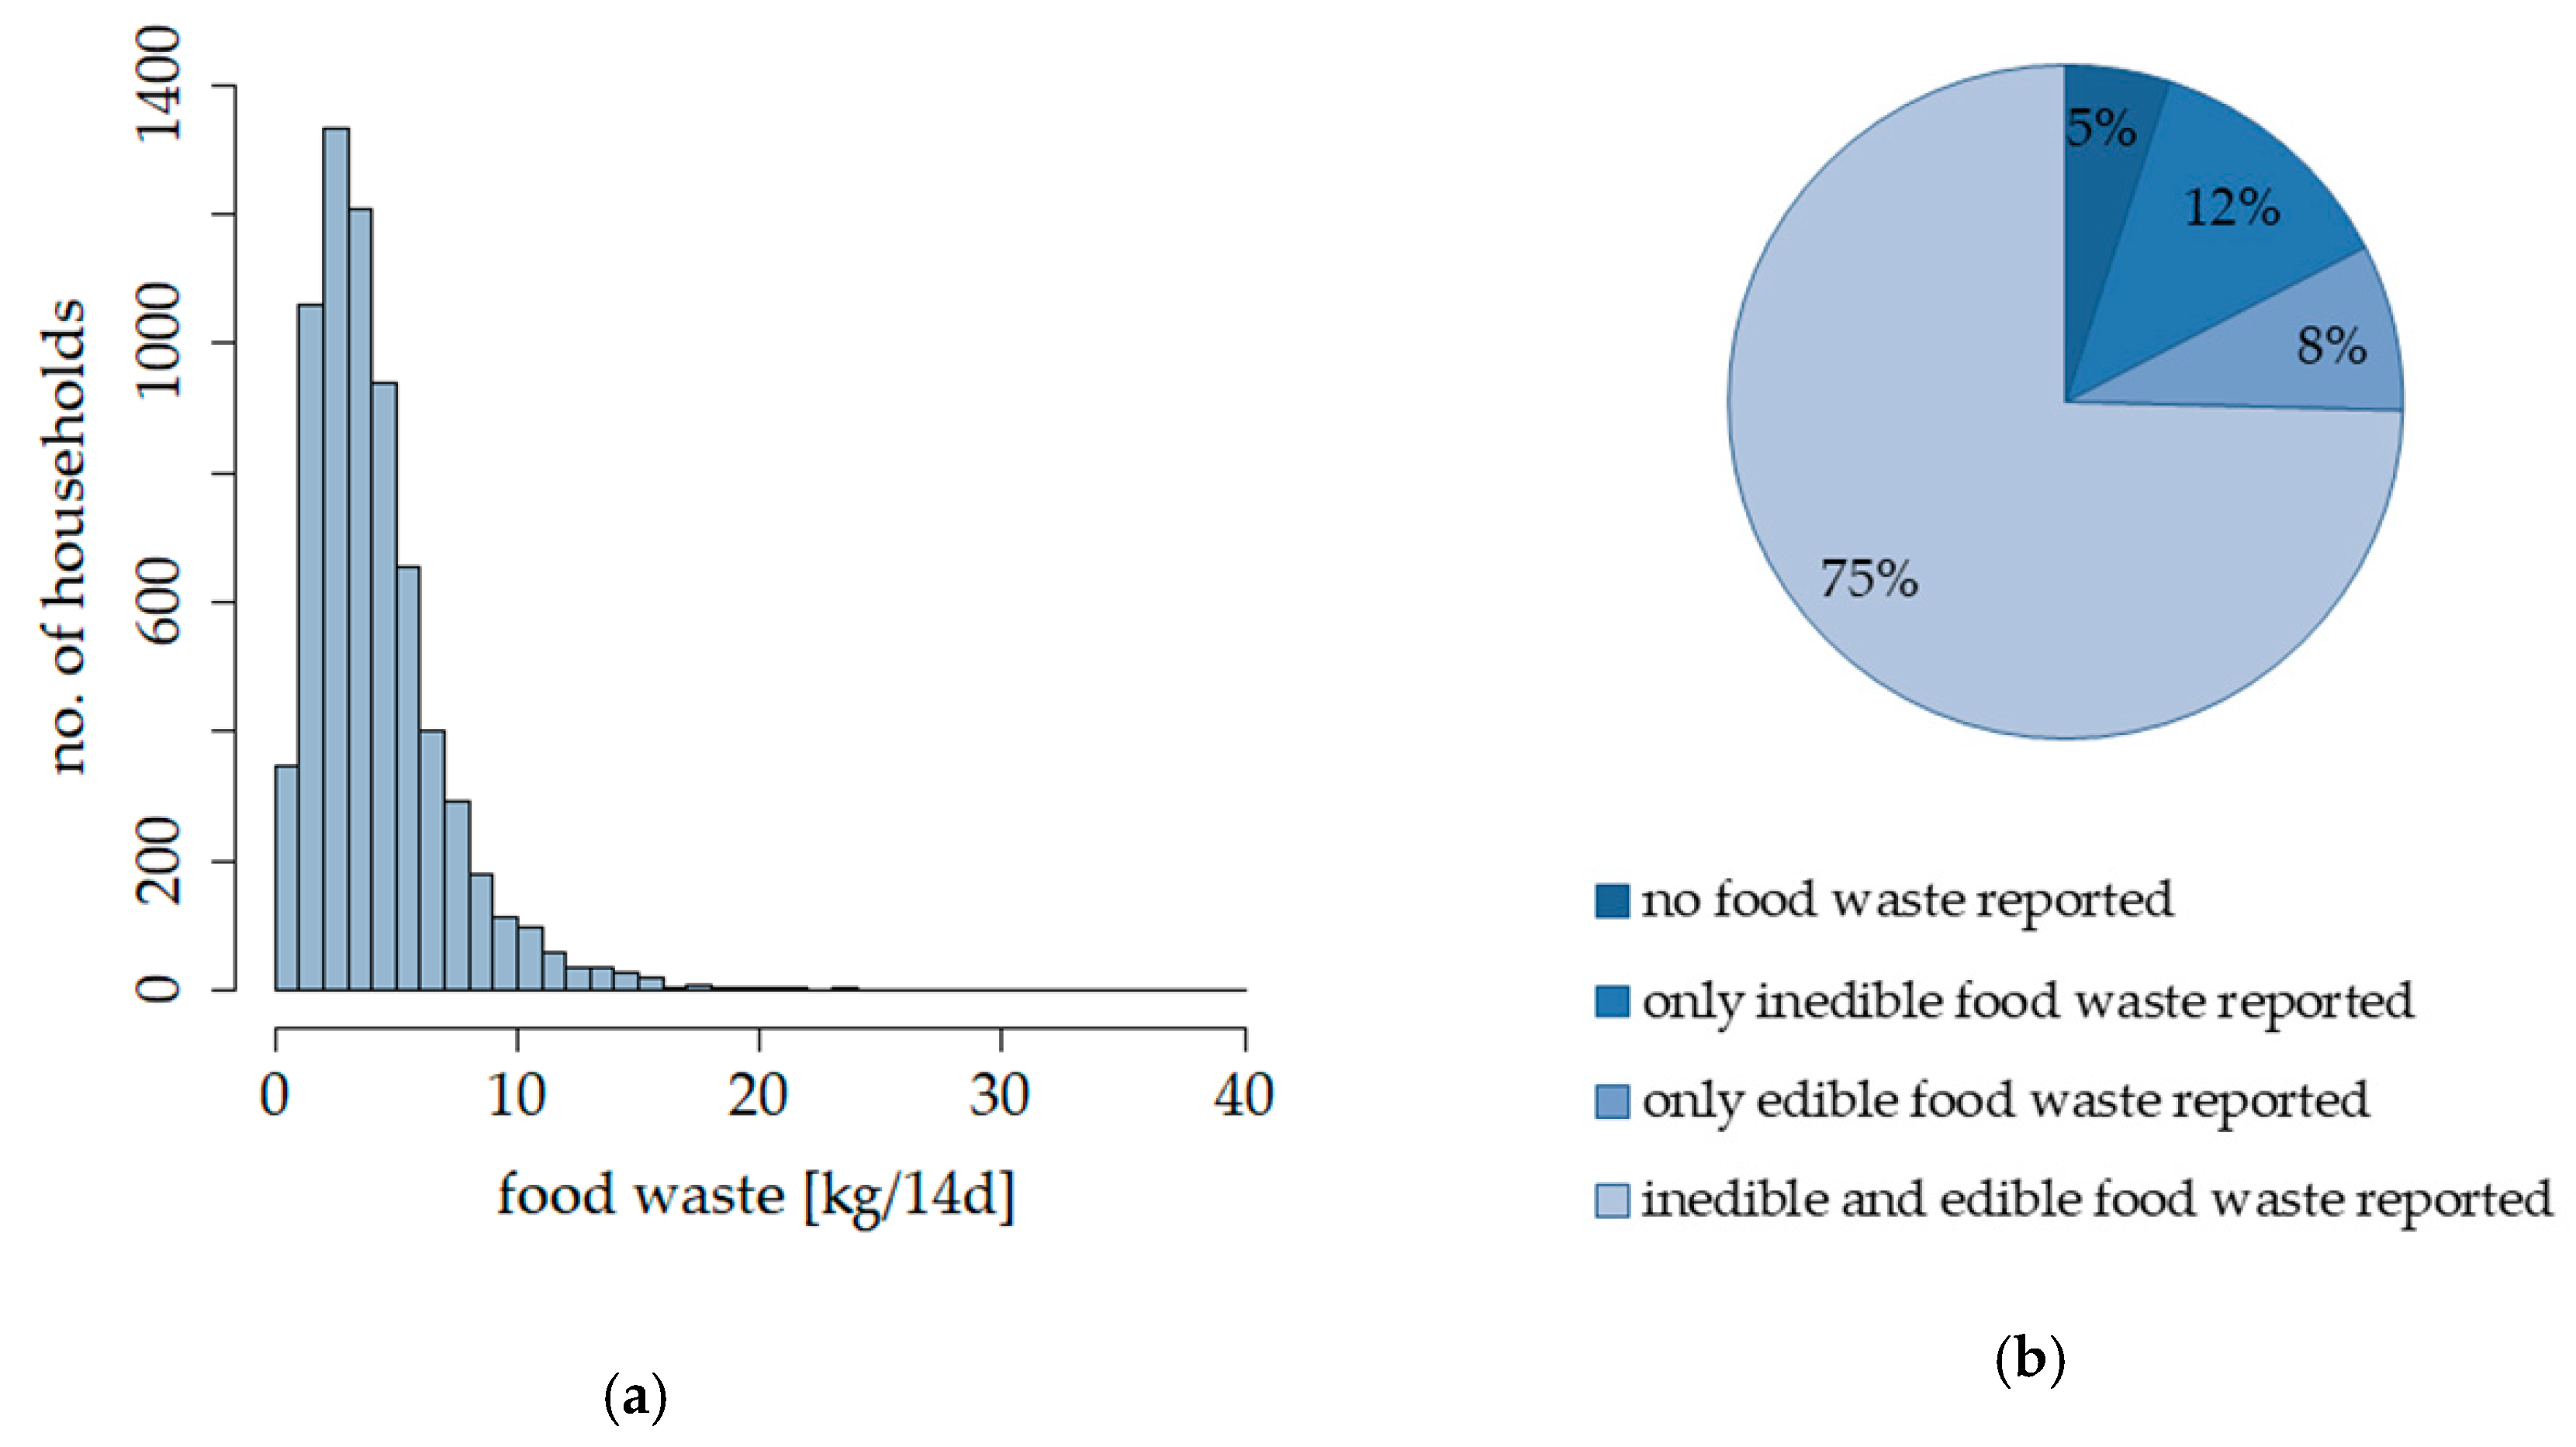
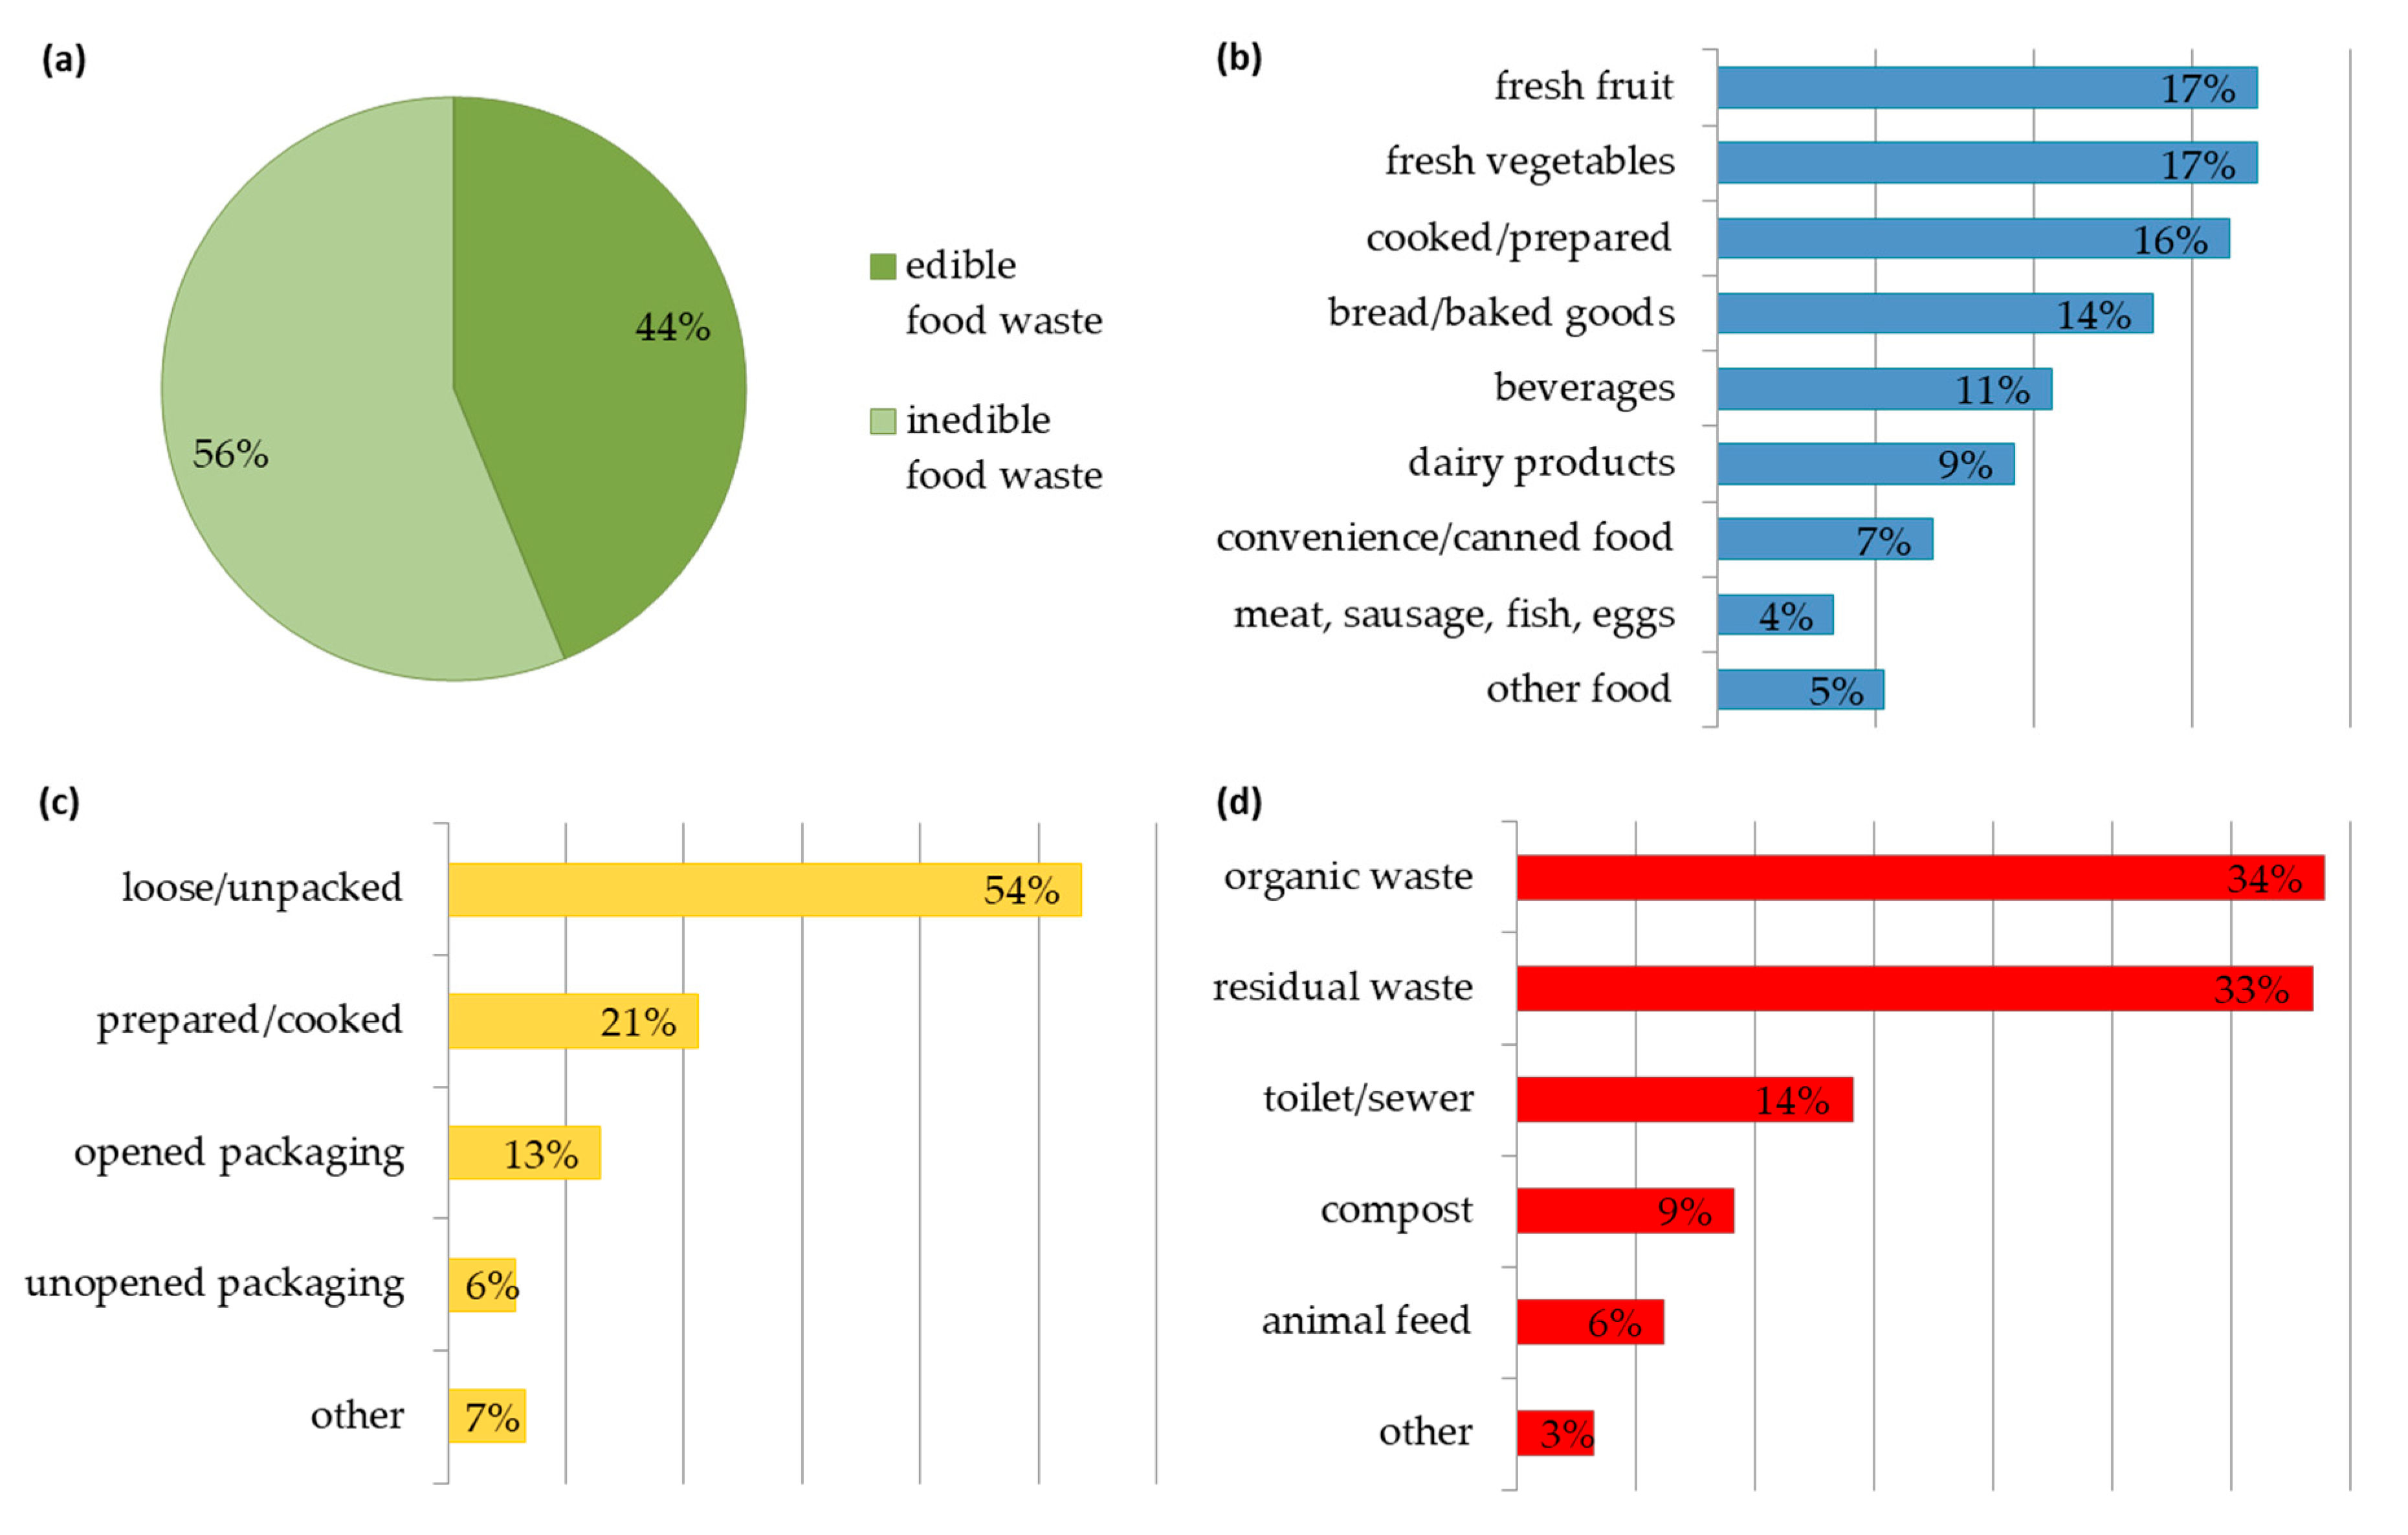
3. Results
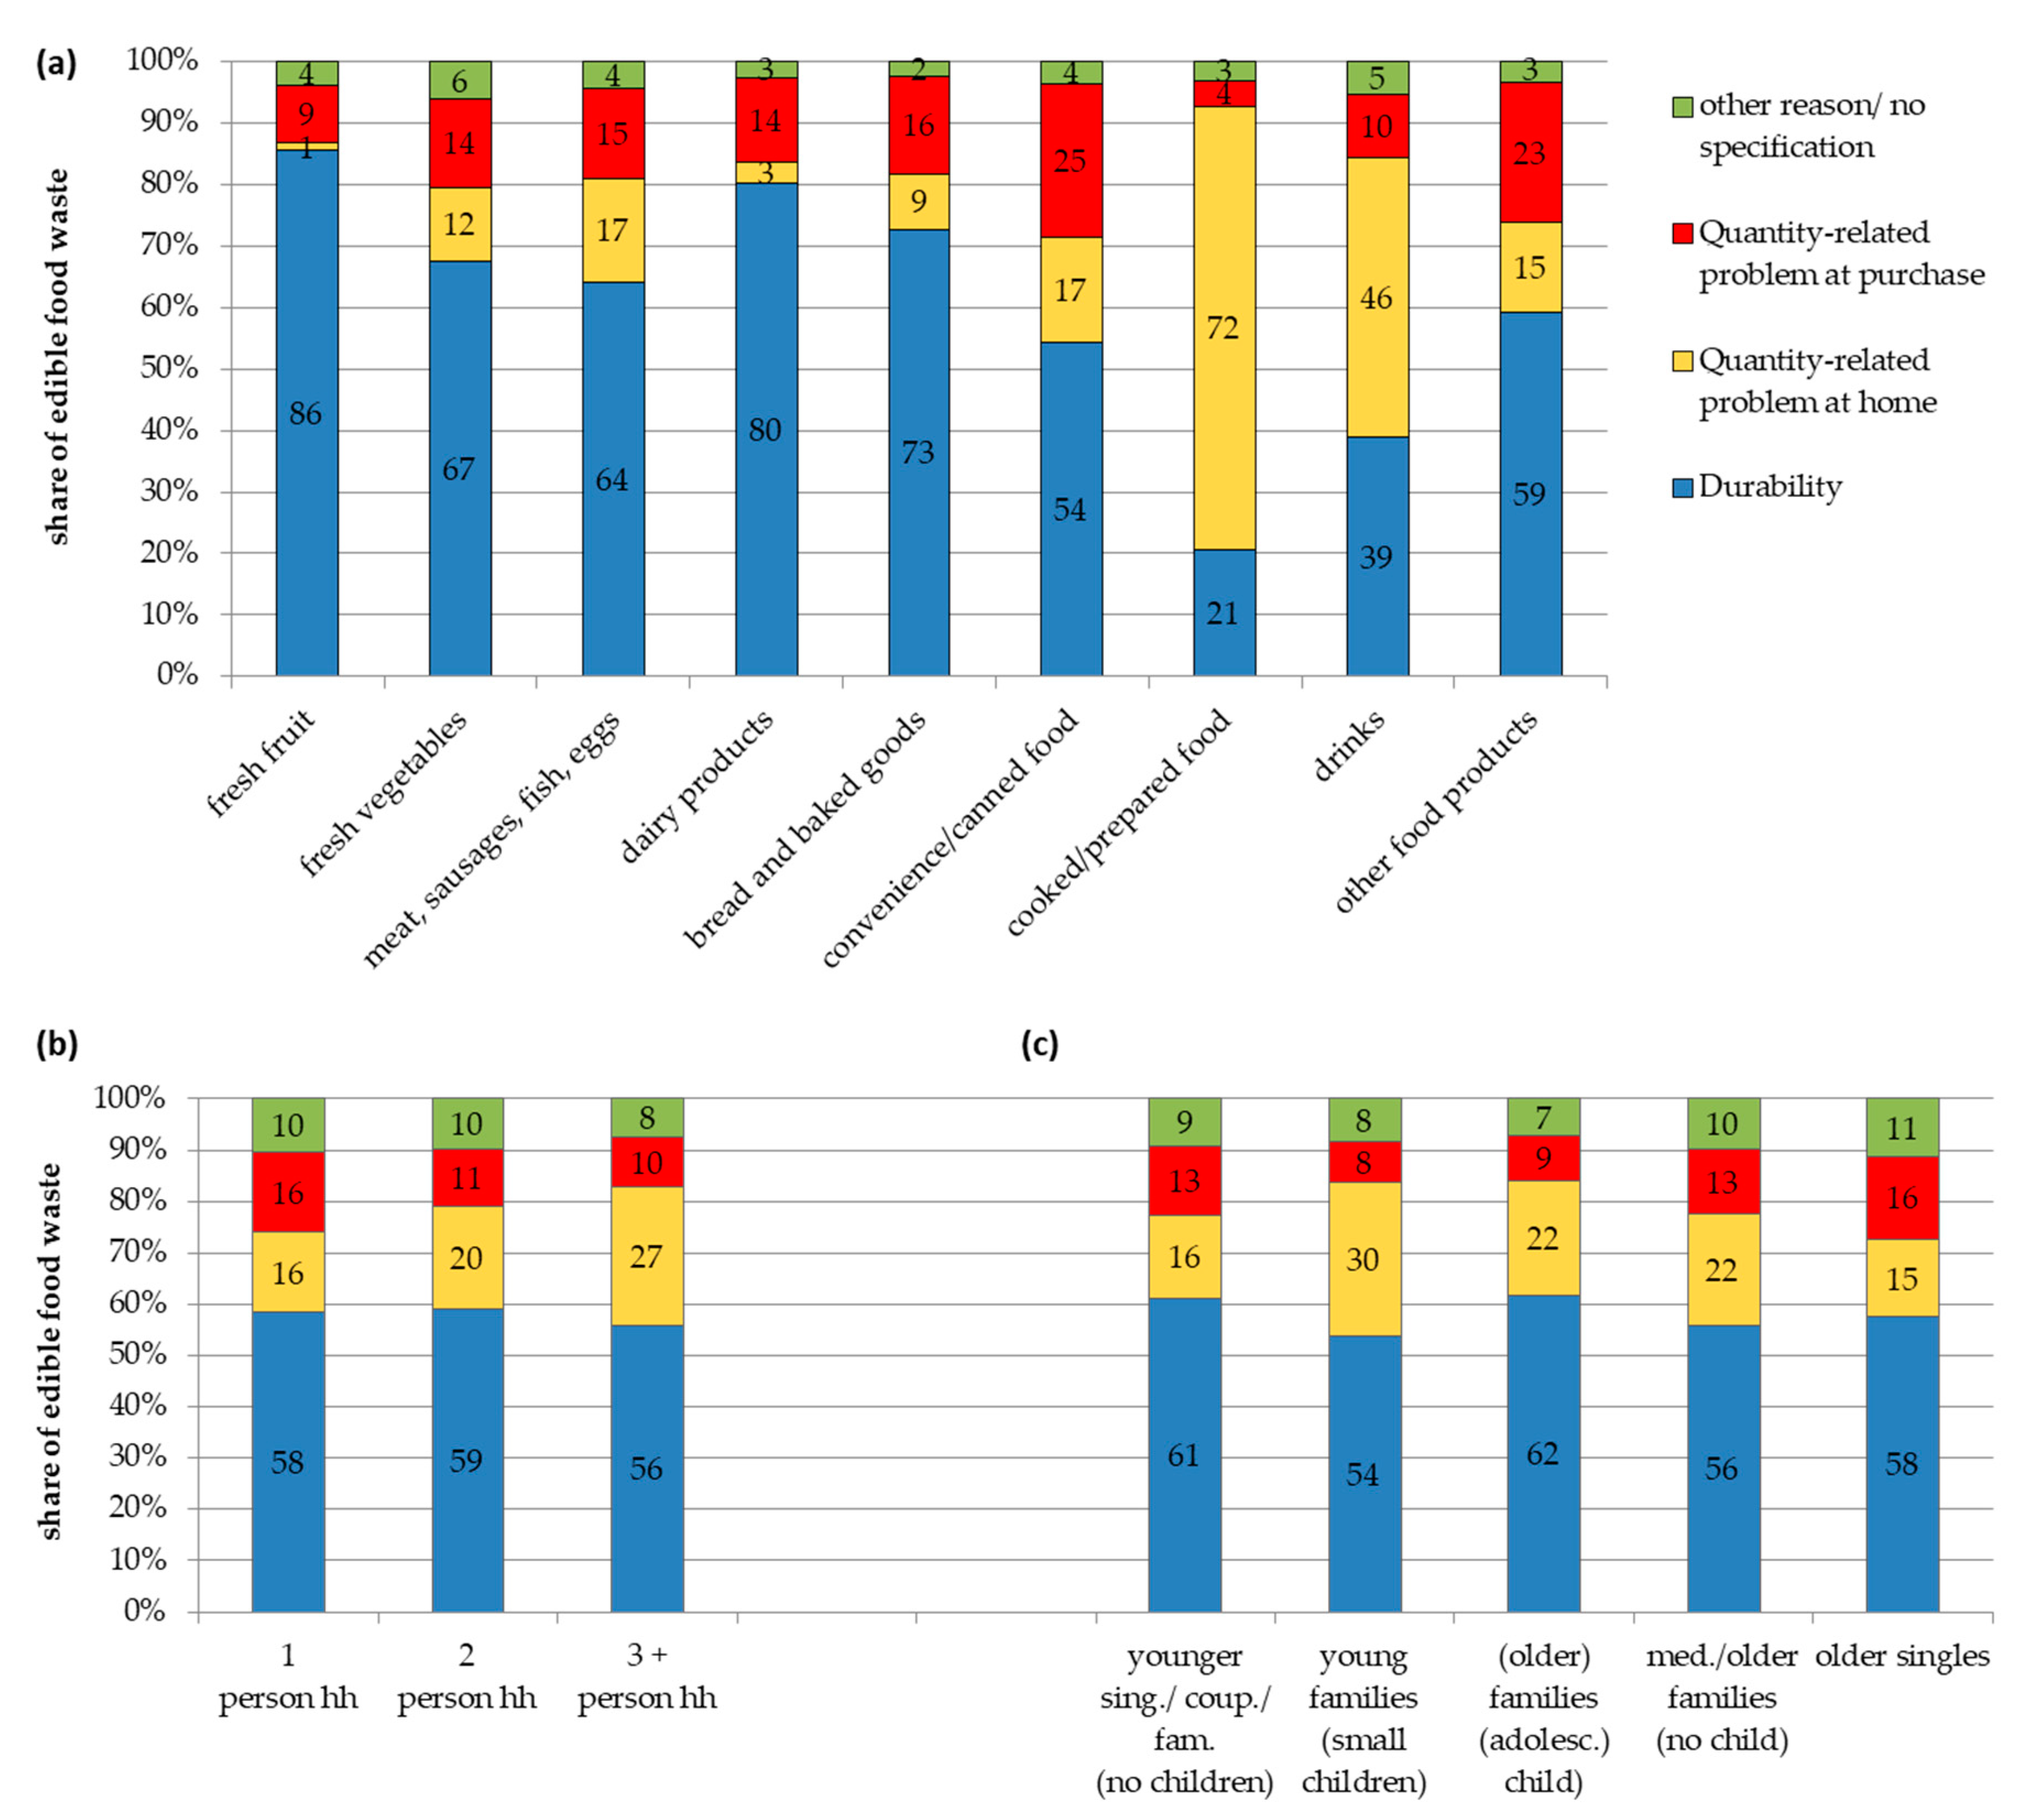
3.1. Reasons of Disposal in Relation to Socio-Demographic and Food Characteristics
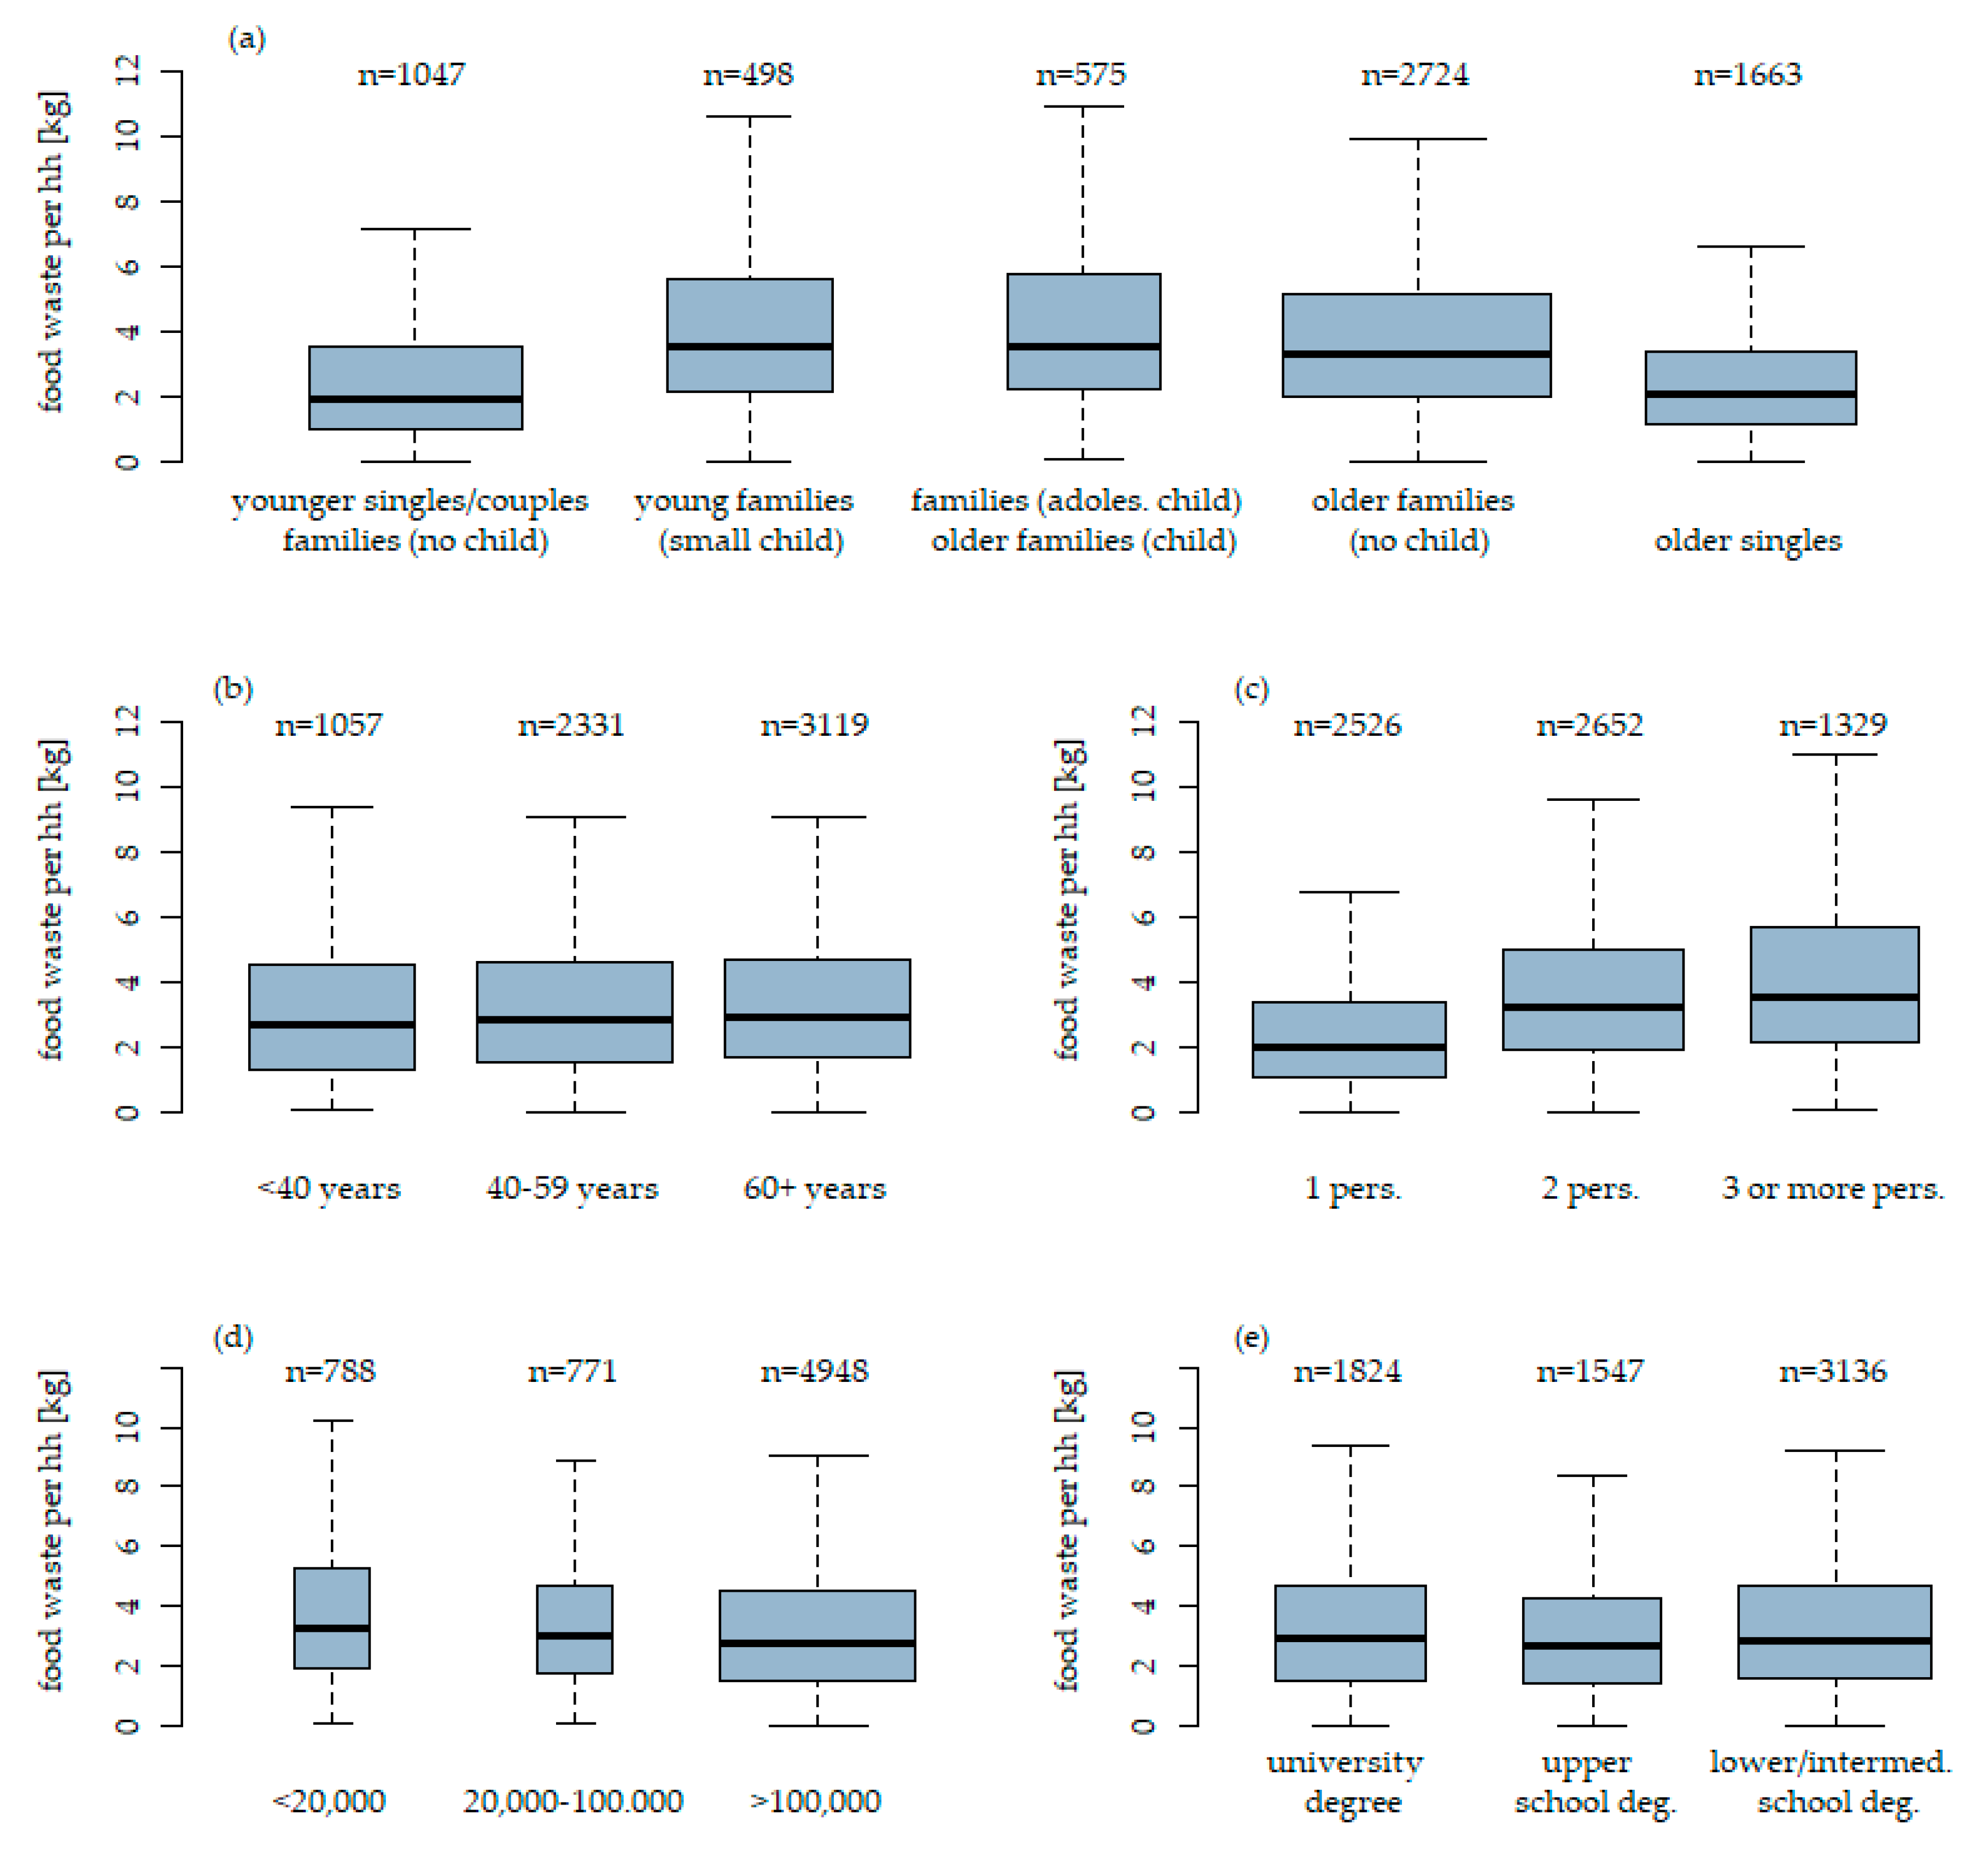
3.2. Differences in Food Waste Amounts between Socio-Demographic Household Characteristics
3.3. Multiple Dependencies between Waste and Household Characteristics
4. Discussion
4.1. Design and Realization of the Survey
4.2. Product Characteristics
4.3. Disposal Reasons
4.4. Socio-Demographic Characteristics
4.5. Prediction of Food Waste Amounts through Socio-Demographic Variables
5. Conclusions
Supplementary Materials
Author Contributions
Funding
Acknowledgments
Conflicts of Interest
Appendix A. Specifications of Surveyed Socio-Demographic Characteristics

| Socio-Demographic Characteristic | Characteristic Values | Group Number |
|---|---|---|
| lifecycle stages | younger singles/young families and couples without children | 1 |
| younger families with small and school children | 2 | |
| families with adolescent children/older families with children | 3 | |
| medium aged and older families without children | 4 | |
| older singles | 5 | |
| age of head of household | <40 years | 1 |
| 40–59 years | 2 | |
| 60+ years | 3 | |
| household size | 1 person | 1 |
| 2 persons | 2 | |
| 3+ persons | 3 | |
| number of inhabitants of municipality | <20,000 inhabitants | 1 |
| 20,000–100,000 inhabitants | 2 | |
| >100,000 inhabitants | 3 | |
| level of education | university degree | 1 |
| upper school degree | 2 | |
| lower and intermediate school degree | 3 |
| Lifecycle Stages | Further Specifications | Group Number |
|---|---|---|
| younger singles | 49 years or less | 1 |
| young families and couples without children | head of household 34 years or less | |
| younger families with small children | head of household 44 years or less; oldest child 6 years or less | 2 |
| younger families with school children | head of household 44 years or less; oldest child between 6 and 14 years | |
| families with adolescent children | head of household 44 years or less; oldest child between 15 and 19 years | 3 |
| older families with children | head of household 45 years or more; children between 0 and 19 years | |
| medium aged families without children | head of household between 35 and 49 years; no child below 20 years in hh | 4 |
| older families without children | head of household 50 years or more; no child below 20 years in hh | |
| older singles | 50 years or more | 5 |
References
- United Nations. Resolution adopted by the General Assembly on 25 September 2015-70/1. Transforming our World: The 2030 Agenda for Sustainable Development; United Nations: New York, NY, USA, 2015. [Google Scholar]
- Gustavsson, J.; Cederberg, C.; Sonesson, U.; Van Otterdijk, R.; Meybeck, A. Global Food Losses and Food—Extent, Causes and Prevention; FAO: Rome, Italy, 2011. [Google Scholar]
- Xue, L.; Liu, G.; Parfitt, J.; Liu, X.; Van Herpen, E.; Stenmarck, Å.; O’Connor, C.; Östergren, K.; Cheng, S. Missing Food, Missing Data? A Critical Review of Global Food Losses and Food Waste Data. Environ. Sci. Technol. 2017, 51, 6618–6633. [Google Scholar] [CrossRef] [PubMed]
- Atwater, W.O. Methods and Results of Investigations on the Chemistry and Economy of Food; Bulletin No. 21; US Department of Agriculture: Washington, DC, USA, 1895.
- Schmidt, T.; Schneider, F.; Leverenz, D.; Hafner, G. Lebensmittelabfälle in Deutschland—Baseline 2015; Johann Heinrich von Thünen-Institut: Braunschweig, Germany, 2019. [Google Scholar]
- European Commission. Commission Delegated Decision (EU) 2019/1597 of 3 May 2019 supplementing Directive 2008/98/EC of the European Parliament and of the Council as Regards a Common Methodology and Minimum Quality Requirements for the Uniform Measurement of Levels of Food Waste. Off. J. Eur. Union 2019, 248, 77–85. [Google Scholar]
- Sonesson, U.; Anteson, F.; Davis, J.; Sjödén, P.-O. Home transport and Wastage: Environmentally relevant Household Activities in the Life Cycle of Food. AMBIO 2005, 34, 371–375. [Google Scholar] [CrossRef]
- Jean-Baptiste, N.; Michener, L.; Wilson, R. Using a Food Waste Diary to Impact Food Waste Reduction in Sydney´s Eastern Suburbs. In Proceedings of the 3rd international Conference “Waste—The Social Context”, Edmonton, AB, Canada, 8–11 May 2011. [Google Scholar]
- Koivupuro, H.K.; Hartikainen, H.; Silvennoinen, K.; Katajajuuri, J.M.; Heikintalo, N.; Reinikainen, A.; Jalkanen, L. Influence of socio-demographical, behavioural and attitudinal factors on the amount of avoidable food waste generated in Finnish households. Int. J. Consum. Stud. 2012, 36, 183–191. [Google Scholar] [CrossRef]
- Wenlock, R.W.; Buss, D.H.; Derry, B.J.; Dixon, E.J. Household Food Wastage in Britain. Br. J. Nutr. 1980, 43, 53–70. [Google Scholar] [CrossRef] [PubMed]
- Langley, J.; Yoxall, A.; Heppell, G.; Rodriguez, E.M.; Bradbury, S.; Lewis, R.; Luxmoore, J.; Hodzic, A.; Rowson, J. Food for thought?—A UK pilot study testing a methodology for compositional domestic food waste analysis. Waste Manag. Res. 2010, 28, 220–227. [Google Scholar] [CrossRef]
- Hoj, S.B. Metrics and Measurement Methods for the Monitoring and Evaluation of Household Food Waste Prevention Interventions. Master’s Thesis, University of South Australia, Adelaide, Australia, 2012. [Google Scholar]
- Giordano, C.; Alboni, F.; Falasconi, L. Quantities, Determinants, and Awareness of Households’ Food Waste in Italy: A Comparison between Diary and Questionnaires Quantities. Sustainability 2019, 11, 3381. [Google Scholar] [CrossRef]
- Leverenz, D.; Moussawel, S.; Maurer, C.; Hafner, G.; Schneider, F.; Schmidt, T.; Kranert, M. Quantifying the prevention potential of avoidable food waste in households using a self-reporting approach. Resour. Conserv. Recycl. 2019, 150, 104417. [Google Scholar] [CrossRef]
- Quested, T.E.; Palmer, G.; Moreno, L.C.; McDermott, C.; Schumacher, K. Comparing diaries and waste compositional analysis for measuring food waste in the home. J. Clean. Prod. 2020, 121263. [Google Scholar] [CrossRef]
- GfK SE. Systematische Erfassung von Lebensmittelabfällen der Privaten Haushalte in Deutschland. Schlussbericht zur Studie; GfK SE: Nürnberg, Germany, 2017. [Google Scholar]
- Statista. Available online: https://de.statista.com/statistik/kategorien/kategorie/8/themen/63/branche/demographie/ (accessed on 11 May 2020).
- Jörissen, J.; Priefer, C.; Bräutigam, K.R. Food Waste Generation at Household Level: Results of a Survey among Employees of Two European Research Centers in Italy and Germany. Sustainability 2015, 7, 2695–2715. [Google Scholar] [CrossRef]
- Falasconi, L.; Cicatiello, C.; Franco, S.; Segrè, A.; Setti, M.; Vittuari, M. Such a Shame! A Study on Self-Perception of Household Food Waste. Sustainability 2019, 11, 270. [Google Scholar] [CrossRef]
- Grasso, A.C.; Olthof, M.R.; Boevé, A.J.; van Dooren, C.; Lähteenmäki, L.; Brouwer, I.A. Socio-Demographic Predictors of Food Waste Behavior in Denmark and Spain. Sustainability 2019, 11, 3244. [Google Scholar] [CrossRef]
- Edjabou, M.E.; Petersen, C.; Scheutz, C.; Astrup, T.F. Food waste from Danish households: Generation and composition. Waste Manag. 2016, 52, 256–268. [Google Scholar] [CrossRef]
- The Netherlands Nutrition Centre (Voedingscentrum). Supplementary Memorandum: Food Waste in Dutch Households in 2016; The Netherlands Nutrition Centre Foundation (Stichting Voedingscentrum Nederland): The Hague, The Netherlands, 2017. [Google Scholar]
- Giordano, C.; Piras, S.; Boschini, M.; Falasconi, L. Are questionnaires a reliable method to measure food waste? A pilot study on Italian households. Br. Food J. 2018, 120, 2885–2897. [Google Scholar] [CrossRef]
- Gaiani, S.; Caldeira, S.; Adorno, V.; Segrè, A.; Vittuari, M. Food wasters: Profiling consumers’ attitude to waste food in Italy. Waste Manag. 2018, 72, 17–24. [Google Scholar] [CrossRef] [PubMed]
- Schmidt, T.; Baumgardt, S.; Blumenthal, A.; Burdick, B.; Claupein, E.; Dirksmeyer, W.; Hafner, G.; Klockgether, K.; Koch, F.; Leverenz, D.; et al. Wege zur Reduzierung von Lebensmittelabfällen—Pathways to Reduce Food Waste (REFOWAS): Maßnahmen, Bewertungsrahmen und Analysewerkzeuge Sowie Zukunftsfähige Ansätze für Einen Nachhaltigen Umgang Mit Lebensmitteln Unter Einbindung Sozio-Ökologischer Innovationen; Johann Heinrich von Thünen-Institut: Braunschweig, Germany, 2019. [Google Scholar] [CrossRef]
- van Dooren, C.; Janmaat, O.; Snoek, J.; Schrijnen, M. Measuring food waste in Dutch households: A synthesis of three studies. Waste Manag. 2019, 94, 153–164. [Google Scholar] [CrossRef]
- Lebersorger, S.; Schneider, F. Discussion on the methodology for determining food waste in household waste composition studies. Waste Manag. 2011, 31, 1924–1933. [Google Scholar] [CrossRef] [PubMed]
- Parizeau, K.; von Massow, M.; Martin, R. Household-level dynamics of food waste production and related beliefs, attitudes, and behaviours in Guelph, Ontario. Waste Manag. 2015, 35, 207–217. [Google Scholar] [CrossRef] [PubMed]
- WRAP. The Food We Waste; WRAP: Bunbury, UK, 2008; ISBN 1-84405-383-0. [Google Scholar]
- Secondi, L.; Principato, L.; Laureti, T. Household food waste behaviour in EU-27 countries: A multilevel analysis. Food Policy 2015, 56, 25–40. [Google Scholar] [CrossRef]
- Stancu, V.; Haugaard, P.; Lähteenmäki, L. Determinants of consumer food waste behaviour: Two routes to food waste. Appetite 2016, 96, 7–17. [Google Scholar] [CrossRef]
- Visschers, V.H.M.; Wickli, N.; Siegrist, M. Sorting out food waste behaviour: A survey on the motivators and barriers of self-reported amounts of food waste in households. J. Environ. Psychol. 2016, 45, 66–78. [Google Scholar] [CrossRef]
- Tucker, C.A.; Farrelly, T. Household food waste: The implications of consumer choice in food from purchase to disposal. Local Environ. 2016, 21, 682–706. [Google Scholar] [CrossRef]
- Neff, R.A.; Spiker, M.L.; Truant, P.L. Wasted Food: U.S. Consumers’ Reported Awareness, Attitudes, and Behaviors. PLoS ONE 2015, 10, e0127881. [Google Scholar] [CrossRef] [PubMed]
- Schneider, F.; Obersteiner, G. Food waste in residual waste of households—Regional and socio-economic differences. In Proceedings of the Eleventh International Waste Management and Landfill Symposium, Margherita di Pula, Cagliari, Sardinia, Italy, 1–5 October 2007. [Google Scholar]
- Cecere, G.; Mancinelli, S.; Mazzanti, M. Waste prevention and social preferences: The role of intrinsic and extrinsic motivations. Ecol. Econ. 2014, 107, 163–176. [Google Scholar] [CrossRef]
- De Hooge, I.E.; Oostindjer, M.; Aschemann-Witzel, J.; Normann, A.; Mueller Loose, S.; Lengard Almli, V. This apple is too ugly for me! Food Qual. Prefer. 2017, 56, 80–92. [Google Scholar] [CrossRef]
- Diaz-Ruiz, R.; Costa-Font, M.; Gil, J.M. Moving ahead from food-related behaviours: An alternative approach to understand household food waste generation. J. Clean. Prod. 2018, 172, 1140–1151. [Google Scholar] [CrossRef]
- Ganglbauer, E.; Fitzpatrick, G.; Comber, R. Negotiating food waste. ACM Trans. Comput. Hum. Interact. 2013, 20, 1–25. [Google Scholar] [CrossRef]


| Characteristics of Wasted Food | Socio-demographic Characteristics of Sample Household 1 |
|---|---|
| Food waste masses per waste act | Household size |
| Product group | Household lifecycle stage |
| Disposal route | Age of head of household |
| Food condition at disposal | Size category of municipality |
| Disposal reason |
| Groups and Characteristic Values | Avg. Mass of Food Waste (kg/14d) | p-Values (ANOVA) | Group Differences (Tukey-Kramer) 1 | Adjusted r² (Linear Regression) |
|---|---|---|---|---|
| household lifecycle stage | ||||
| younger singles/young families and couples without children | 2.55 | 2 × 10⁻¹⁶ | a | 0.086 |
| younger families with small and school children | 4.17 | b | ||
| families with adolescent children/older families with children | 4.24 | b | ||
| older families without children | 3.97 | b | ||
| older singles | 2.56 | a | ||
| age of head of household | ||||
| <40 | 3.20 | 0.00214 | a | 0.002 |
| 40–59 | 3.35 | ab | ||
| 60+ | 3.54 | b | ||
| household size | ||||
| 1 person | 2.52 | <2 × 10⁻¹⁶ | a | 0.088 |
| 2 persons | 3.86 | b | ||
| 3+ persons | 4.25 | c | ||
| size category of municipality | ||||
| <20,000 | 3.86 | 2.32 × 10⁻⁹ | a | 0.006 |
| 20,000–100,000 | 3.62 | a | ||
| >100,000 | 3.32 | b | ||
| level of education | ||||
| university degree | 3.46 | 0.00286 | a | 0.001 |
| upper school degree | 3.31 | a | ||
| lower and intermediate school degree | 3.45 | a | ||
© 2020 by the authors. Licensee MDPI, Basel, Switzerland. This article is an open access article distributed under the terms and conditions of the Creative Commons Attribution (CC BY) license (http://creativecommons.org/licenses/by/4.0/).
Share and Cite
Herzberg, R.; Schmidt, T.G.; Schneider, F. Characteristics and Determinants of Domestic Food Waste: A Representative Diary Study across Germany. Sustainability 2020, 12, 4702. https://doi.org/10.3390/su12114702
Herzberg R, Schmidt TG, Schneider F. Characteristics and Determinants of Domestic Food Waste: A Representative Diary Study across Germany. Sustainability. 2020; 12(11):4702. https://doi.org/10.3390/su12114702
Chicago/Turabian StyleHerzberg, Ronja, Thomas G. Schmidt, and Felicitas Schneider. 2020. "Characteristics and Determinants of Domestic Food Waste: A Representative Diary Study across Germany" Sustainability 12, no. 11: 4702. https://doi.org/10.3390/su12114702
APA StyleHerzberg, R., Schmidt, T. G., & Schneider, F. (2020). Characteristics and Determinants of Domestic Food Waste: A Representative Diary Study across Germany. Sustainability, 12(11), 4702. https://doi.org/10.3390/su12114702