4.2. Smallholder Farmers
Addressing fertilizer supply constraints and perhaps farmers’ liquidity constraints would also ensure that many smallholder farmers start using fertilizer, thereby improving agricultural productivity. As some of the low application rates among users may be ascribed to a lack of knowledge of best practices, extension programs aimed at improving fertilizer use may lead to positive change in fertilizer application rates. These targeted awareness programs would need to prioritize such provinces as Sofala, Nampula, and Zambeza, where application rates are the lowest, despite having tremendous agricultural potential. This is important because research has shown that awareness about the benefits of using fertilizer, skills in using fertilizer, and liquidity constraints play a key role in influencing smallholder farmers’ decision to use fertilizer. Duflo et al. [
13] found that the proportion of farmers who used fertilizer in Kenya increased when farmers were given the option to purchase fertilizer immediately after harvest, when the farmers had money and maize; hence, farmers faced lower liquidity constraints at the time they made the decision to purchase fertilizer.
As the factors that are associated with fertilizer use (see
Table 1) include that being female is correlated with non-use of fertilizers, and that membership to farmers organizations is associated with a higher use of fertilizer, this supports the view that female smallholder farmers need more support in fertilizer access. The program by the government, including farmers organizations, should have elements of equity to ensure that smallholder female farmers are included in smallholder input support programs. The results also imply that increasing smallholder farmers’ awareness of fertilizer benefits combined with information about output prices could increase smallholder farmers’ demand for fertilizer if they could afford to purchase fertilizer.
Given that a sizable share of smallholder farmers were resource-poor (66.8% were asset-poor, see
Table 1), access to credit could play a key role in increasing smallholder farmers’ demand for fertilizer. Although the share of farmers with access to credit was low (only 0.6% of smallholder farmers had access to credit), fertilizer users (5.4%) had more access to credit than non-users (0.5%). Although increased access to credit can increase fertilizer use by smallholder farmers, interventions that directly reduce fertilizer prices could be more effective in increasing demand for fertilizer, given that fertilizer price is among the key determinants of smallholder farmers’ demand for fertilizer, especially among resource-poor smallholder farmers, who are the majority. Farmers are going to be reluctant to use fertilizer if it is not profitable.
Furthermore, increasing smallholder farmers’ participation in output markets could also trigger increased smallholder farmers’ demand for fertilizer given low market participation. The authors’ calculations using data from IAI 2015 demonstrate that 14.8% of maize growers sold their maize production, but maize market participation was higher among fertilizer users (20%) than among non-users (14.6%). The availability of market information could increase smallholder farmers’ participation in output markets. Although there were no differences between fertilizer users and non-users, the proportion of a smallholder farmers who owned a cellphone in the 2014/2015 agricultural season stood at 57.2%. This large share of smallholder farmers with access to cellphones suggests that cellphones could be used as a venue through which input and output market information—and other crop management information—could be passed on to smallholder farmers, contributing positively to increased smallholder farmers’ demand for fertilizers.
However, the availability of market information should be complemented with better road networks (especially those linking areas with high agricultural potential to major consumption hubs). According to Zavale and Macamo [
14], this may be explained by the fact that transport costs are among the principal constraints to smallholder farmers’ input and output market access and participation. This is important especially because most roads in Mozambique are unpaved, for instance, data from the National Road Administration (ANE) show that as at 2017, of the roughly 30,500 km, 74.2% was classified as unpaved, implying that only 35.7% was paved, thereby underscoring the fact that transport infrastructure is wanting. With 38.1% and 36.3% unpaved road extensions in northern Mozambique and central Mozambique, respectively, these are the regions accounting for the largest share of the total extension of unpaved roads in the country. Moreover, of the 30,700 km of the total classified roads in 2013, 48.2% was classified as being in unsatisfactory condition [
14]. The largest share of the total extension of roads in unsatisfactory conditions was in central Mozambique (39.9%) and northern Mozambique (35.9%), in that order. The poor road conditions in these two regions are a source of high transaction costs, which create barriers for smallholder farmers’ participation in output markets as well as input markets [
14].
Table 1 suggests that fertilizer users are more resource-endowed than non-users. The proportion of households who were asset-poor is greater for smallholder farmers who did not use fertilizer than those who used fertilizer. Besides, smallholder farmers who used fertilizer cultivated larger land areas and had more animals compared with those who did not use fertilizers (2.1 ha versus 1.4 ha for cultivated land and 1.8 Tropical Livestock Units (TLU) versus 0.9 TLU for animal ownership). This suggests that cash liquidity could be a major factor constraining smallholder farmers’ decision to use fertilizer, in particular, and other yield-enhancing agricultural inputs, in general. Data from IAI 2015 show that usage of improved maize seed was considerably higher among fertilizer users compared with fertilizer non-users (4.4% versus 23.9%). Proportions of smallholder farmers who used pesticide (1.7% versus 46.5%) and manure (1.1% versus 19.6%) were also considerably higher among farmers who used fertilizer than among farmers who did not use fertilizer. This could be an indication of the complementarity between fertilizer and improved seed and potential negative association between liquidity constraint and the adoption of yield-enhancing agricultural inputs.
Fertilizer use appears to be associated with cultivation of traditional cash crops (tobacco, cotton, sugarcane).
Table 1 illustrates that the proportion of smallholder farmers who grew tobacco was considerably higher among fertilizer users than fertilizer non-users (42.2% versus 0.6%). This finding could suggest that smallholder farmers apply fertilizer predominantly in traditional cash crops as opposed to food crops. It is also consistent with findings reported in the literature [
12,
15] suggesting that fertilizer is predominantly used by smallholder farmers who grow tobacco and sugarcane. Benson, Cunguara, and Mogues [
12] documented that 90% of fertilizer consumed in Mozambique goes to tobacco and sugarcane fields. Furthermore, anecdotal evidence suggests that smallholder farmers who receive yield-enhancing agricultural input—including fertilizer—on credit as part of the contract farming with large-scale cash crop private companies use part of the received fertilizer to apply to food crops.
Smallholder farmers who used fertilizer had larger maize production and allocated more land to maize compared to those who did not use fertilizer (794 kg versus 347 kg for maize production and 0.8 ha versus 0.6 ha for cultivated land under maize). Maize productivity was also higher among smallholder farmers who used fertilizer than those who did not use fertilizer (99.9 kg per adult equivalent versus 207.5 kg per adult equivalent and 929.7 kg ha−1 versus 1766.4 kg ha−1). It is worth pointing out that fertilizer use should be complemented with other yield-enhancing agricultural input, especially improved seed.
Smallholder farmers who use fertilizer acquire their fertilizer predominantly from wholesalers, retailers, and medium- and small-scale agro-dealers, who are usually located in their villages. Data from IAI 2015 show that 66% of smallholder farmers who used fertilizer purchased it and that 24.1% received it as credit. Among those smallholder farmers who purchased fertilizer, 39.4% purchased it in the villages where they live and 33% purchased it in the districts where they live. This suggests that a considerable share of smallholder farmers purchase fertilizer relatively close to where they live, which is consistent with findings from Nagarajan, Fernando, Leonardo, Matias, and Goncalvez [
15] showing that the distance traveled by smallholder farmers to acquire fertilizer from agro-dealers reduced on average from 179 km in 2006 to 30 km in 2015, equivalent to a 83.2% decline. In addition to purchases of fertilizer from wholesalers, retailers, and agro-dealers, another channel through which smallholder farmers obtain fertilizer is contract farming. Some smallholder farmers under contract farming receive fertilizer from large-scale cash crop private companies, especially tobacco, sugarcane, and cotton. Sources of fertilizer acquired by these large-scale cash crop private companies include direct imports of fertilizer, domestic fertilizer wholesalers, and domestic fertilizer blending plants; direct imports of fertilizer account for the largest share, followed by fertilizer wholesalers.
4.3. Wholesalers and Retailers
Smallholder farmers purchase fertilizers from wholesalers, retailers, and agro-dealers, as illustrated in
Figure 2. Agro-dealers acquire fertilizers from wholesalers, retailers, and domestic fertilizer blending plants, while wholesalers and retailers obtain fertilizer from fertilizer importers and also from domestic fertilizer blending plants. Fertilizer wholesalers are integrated into retailing distribution concentrated especially in areas where tobacco and sugarcane are produced by large-scale enterprises; hence, “fertilizer wholesalers” refers to wholesalers and retailers hereinafter. The exact number of wholesalers was not available. In addition to fertilizer, wholesalers have other agricultural inputs (such as improved seeds, herbicides, farming tools, etc.) in their portfolio. These other agricultural inputs account for larger sales share than that of fertilizer. We are not aware of the exact number of wholesalers, but Benson, Cunguara, and Mogues [
12], and Chemonics and IFDC [
16] documented that the wholesale market segment is dominated by one firm—AgriFocus—suggesting high concentration of this market segment.
According to Benson, Cunguara, and Mogues [
12], a considerably large share of fertilizer consumed in Mozambique comes from international markets, and the main ports through which fertilizer is brought into Mozambique are Beira in Sofala province and Nacala in Nampula province. These ports are also used to deliver fertilizer to the neighboring landlocked countries (Malawi, Zambia, and Zimbabwe). Shipments of fertilizer arriving in Mozambique but in transit to these neighboring landlocked countries are not sold in Mozambique. As argued by Chemonics and IFDC [
16], Mozambique should position itself to take advantage of the economies of scale stemming from the large-scale fertilizer shipments going to neighboring landlocked countries by acquiring part of those shipments, especially given that fertilizer is shipped in bulk from importing countries. This is because fertilizer importers in Mozambique order low-volume shipments from international markets, especially South Africa, leading to higher ocean transport costs (vessel rental). Ocean freight costs are exacerbated because vessels bringing fertilizer to Mozambique ports usually return empty to their origins (mainly South Africa) due to the low export of other commodities from Mozambique to international markets, especially South Africa. Mozambique is a small market for South African fertilizer. According to DAFF [
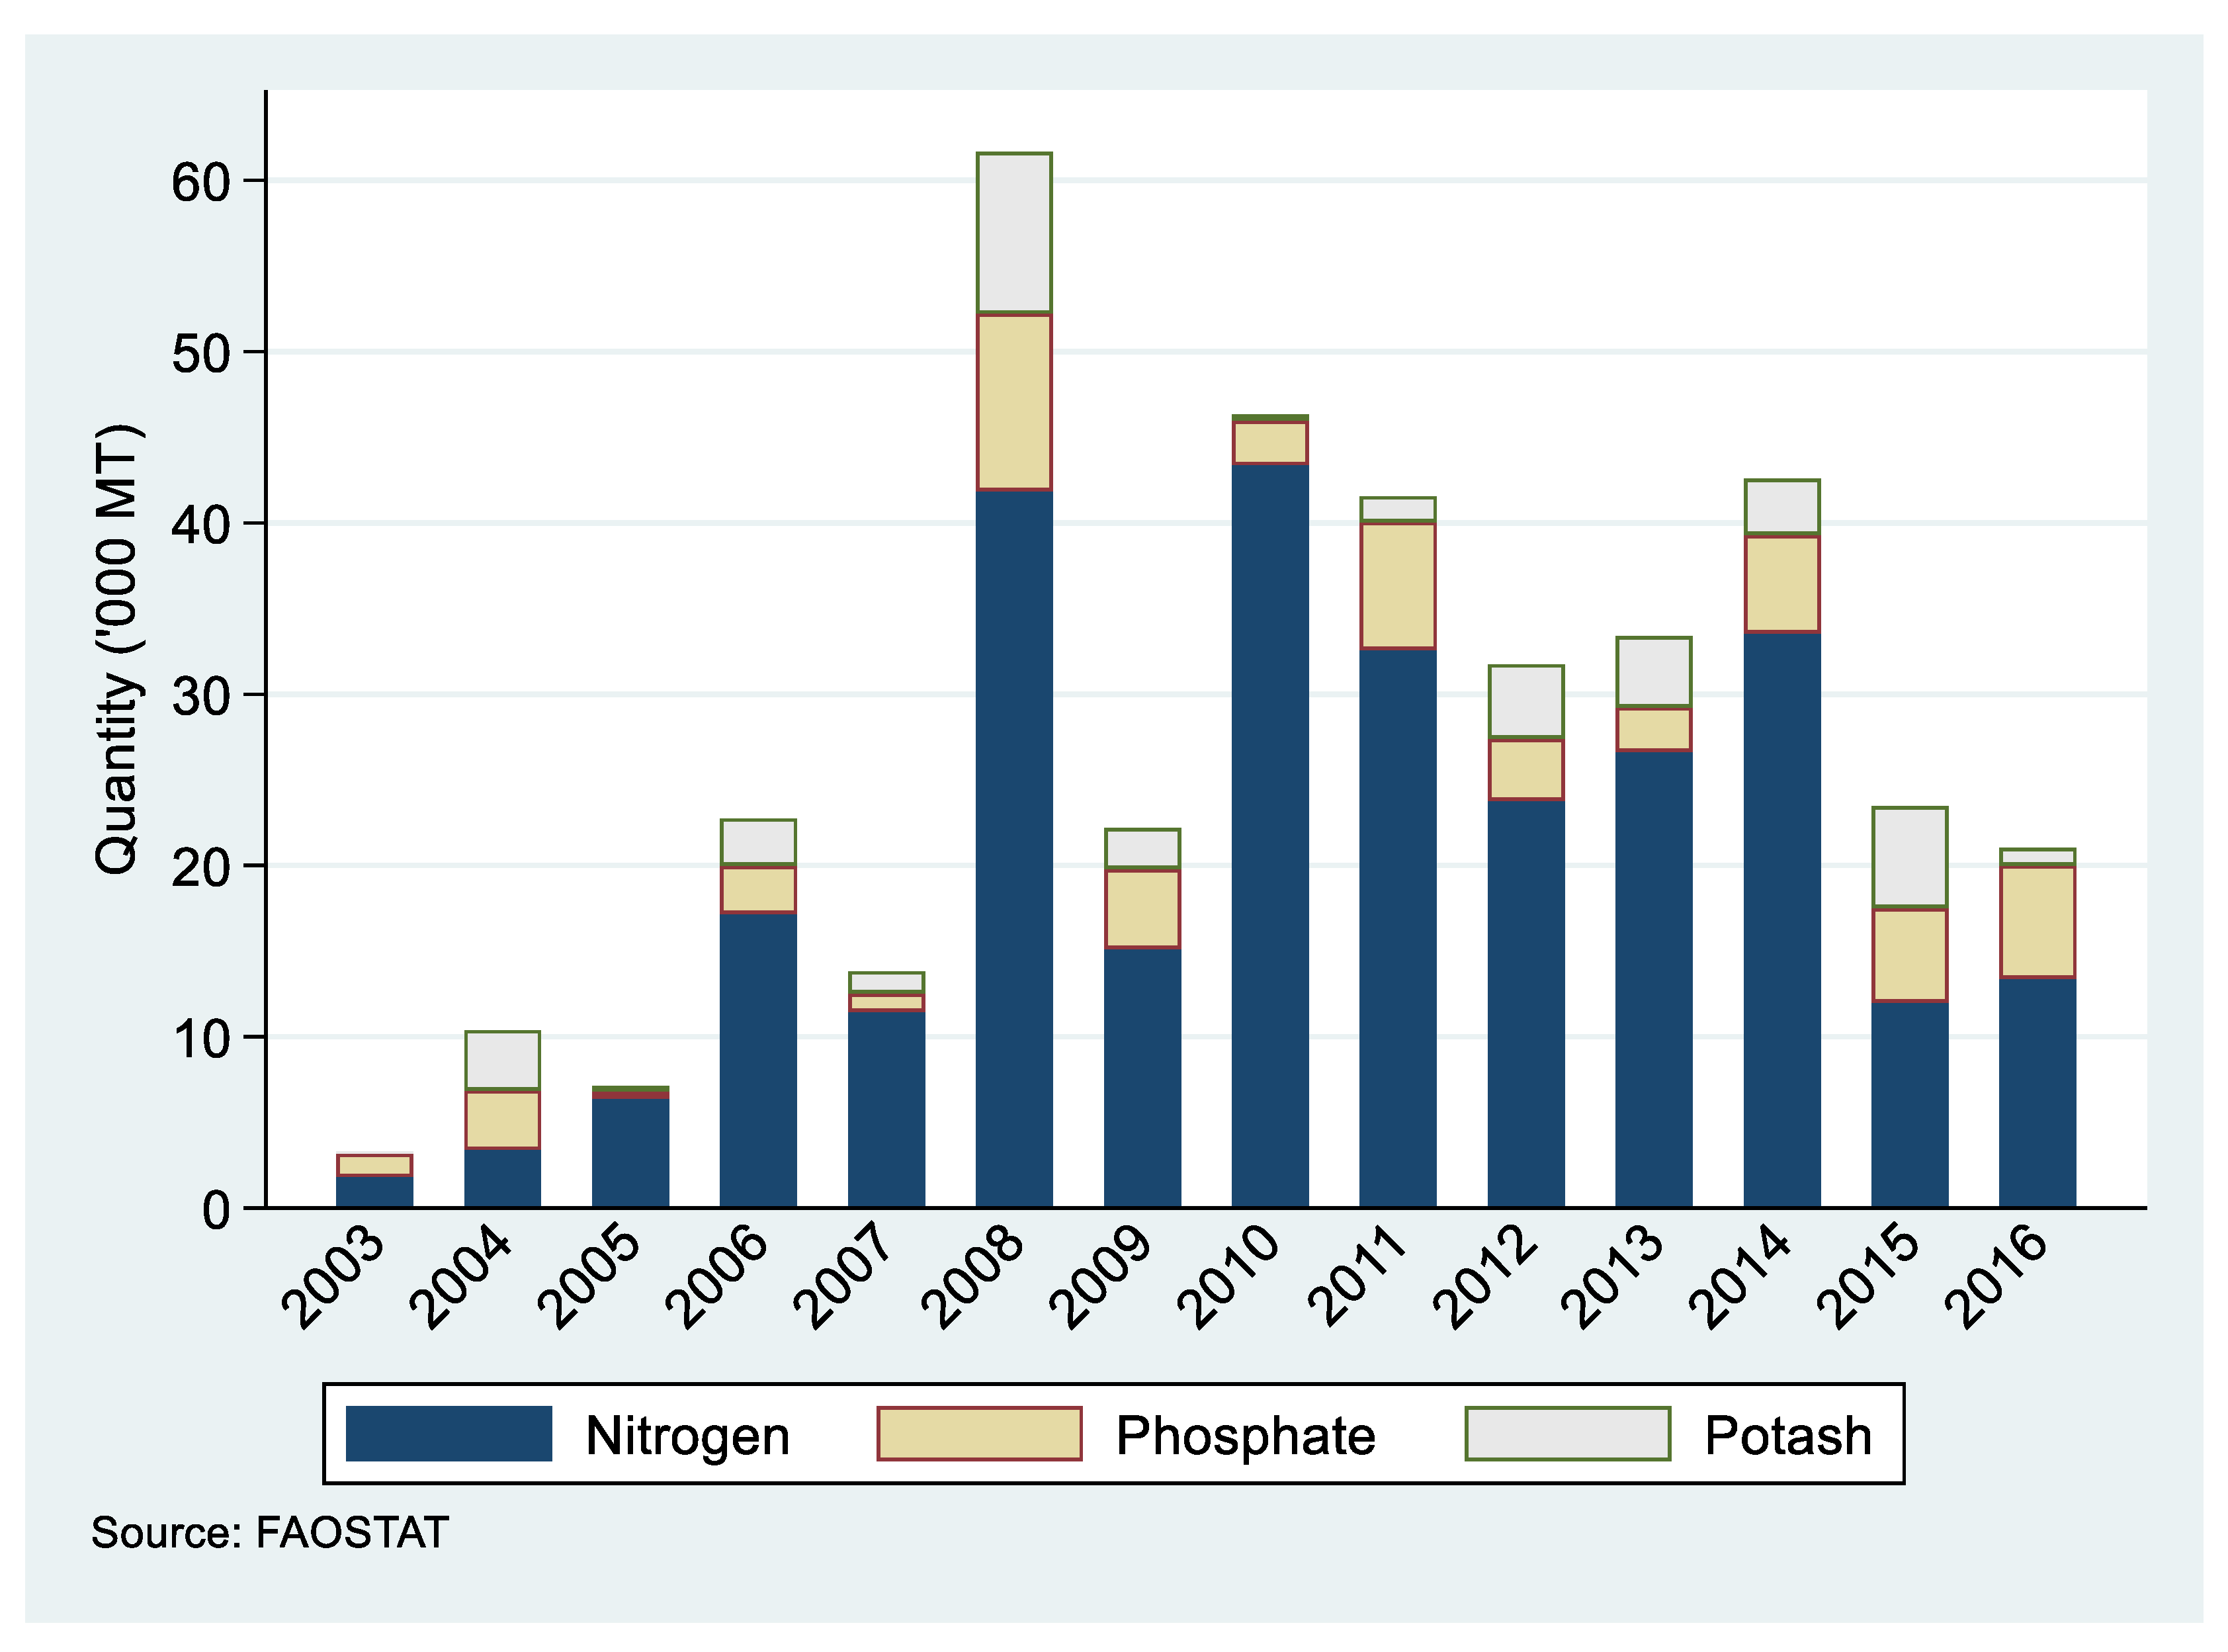
17], exports of NPK from South Africa to Mozambique amounted to about 22,000 MT over the period 2007 to 2016, representing only 1.8% of the total South Africa exports to southern African countries (DAFF stands for South Africa Department of Agriculture, Forestry and Fisheries).
Transport costs are exacerbated because upon arrival in Nacala and Beira ports, fertilizer is transported on poor road networks to be delivered to fertilizer wholesalers, leading ultimately to higher fertilizer prices in retail markets. In addition, handling fees in Nacala and Beira ports are relatively high, contributing to higher fertilizer prices. Chemonics and IFDC [
16] estimated an average fertilizer price (NPK 12:24:12) of USD 546 MT
−1 in Sofala province, of which free-on-board (FOB) fertilizer price (including cost of fertilizer bagging) accounted for 58.7%, transport costs (ocean freight plus truck cost from port to wholesalers’ warehouse) accounted for 23.1%, and margins accounted for 7.3%. Excluding FOB share, Benson, Cunguara, and Mogues [
12] and IFDC [
18] estimated that transport cost accounted for about 45% of the fertilizer price in Sofala province. Although this transport share for Mozambique is comparable to that for Tanzania, estimated at 43% by Cameron et al. [
19], it is considerably high by international standard.
This high transport share of retail fertilizer price suggests that if smallholder farmers’ demand for fertilizer is to be driven up, given that price is an important determinant of fertilizer demand, especially for asset-poor smallholder farmers, efforts should be put in place to reduce transport costs at various stages (both truck and ocean freights) and port handling fees, leading to reduced retail fertilizer prices. High fertilizer prices paid by smallholder farmers could constrain smallholder farmers’ returns on fertilizer, making smallholder farmers reluctant to adopt fertilizer because fertilizer application would not be profitable.
4.4. Agro-Dealers
Agro-dealers play a key role in fertilizer marketing in Mozambique, linking on one hand fertilizer wholesalers to smallholder farmers and on the other hand fertilizer blending plants to smallholder farmers, given that neither wholesalers nor fertilizer blending plants have distribution networks in rural areas, especially in areas with high agricultural potential. According to Nagarajan, Fernando, Leonardo, Matias, and Goncalvez [
15], four types of agro-dealers are found in Nampula and Sofala provinces: very small-scale agro-dealers with gross sales less than USD 1000 per cropping season; small-scale agro-dealers with gross sales ranging from USD 1000 to USD 5000; medium-scale agro-dealers with sales ranging from USD 5000 to USD 10,000; and large-scale agro-dealers with sales greater than USD 10,000. We believe that this classification of agro-dealers can be generalized to the country. The majority of the agro-dealers are very small to small in terms of scale of business operation.
Very small and small-scale agro-dealers usually operate seasonally, are located far from main road networks but relatively close to smallholder farmers, sell fertilizer directly to smallholder farmers, and source their fertilizer from wholesalers located in district and provincial headquarters. Medium-scale agro-dealers are usually located in district headquarters or close to large towns, acquire their fertilizer from wholesalers and sell fertilizer to very small- and small-scale agro-dealers. Finally, large-scale agro-dealers are located in district headquarters and large towns, sell fertilizer to all other types of agro-dealers and obtain their fertilizer from directly from wholesalers (and fertilizer importers).
Nagarajan, Fernando, Leonardo, Matias and Goncalvez [
15] document that depending on the volume intended to purchase, agro-dealers source fertilizer from importers, wholesalers, and domestic fertilizer blending plants located in closest large towns (usually as far as 75–90 km). In central Mozambique, some agro-dealers sometimes travel to Zimbabwe and Malawi to acquire agricultural inputs especially fertilizer. Furthermore, these authors reported that the average distance between agro-dealers and smallholder farmers dropped from 180 km in 2006 to 150 km in 2014 in four provinces (Nampula, Zambezia, Manica and Sofala). This finding suggests that the distribution of agro-dealer is still thin; having a more concentrated network of agro-dealers would make fertilizer more available to farmers, which in turn could lead to increased smallholder farmers if agro-dealers put in place demonstration plots and provide credit to smallholder farmers to trigger smallholder farmers’ interest in using fertilizer.
Nagarajan, Fernando, Leonardo, Matias and Goncalvez [
15] found that a higher concentration of agro-dealers is in areas with more intensive growing of vegetables, tobacco and soybeans in Nampula, Zambezia, Manica and Sofala provinces due to higher demand for fertilizer among growers of these crops than among growers of food crops including maize. This is consistent with findings reported earlier showing that the proportion of farmers who use fertilizer is higher among farmers who grow cash crops. As a business diversification strategy due largely to seasonality of smallholder farmers’ demand for fertilizer, agro-dealers have other agricultural inputs, in addition to fertilizer, in their business portfolio, and are engaged in the marketing of agricultural outputs, especially grains, grown by smallholder farmers. A considerable share of agro-dealers also sell other groceries in their shop premises.
Findings from Benson, Cunguara and Mogues [
12], and Nagarajan, Fernando, Leonardo, Matias and Goncalvez [
15] illustrate that in an attempt to drive smallholder farmers’ demand for fertilizer, agro-dealers provided credit to smallholder farmers and have demonstration plots. This agro-dealers’ strategy has been somehow effective as agro-dealers’ sales of especially fertilizer and improved seeds have increased. These findings reinforce the importance of smallholder farmers’ awareness of the benefits of yield-enhancing agricultural inputs including fertilizer.
Like smallholder farmers, agro-dealers also face finance constraints because a considerable share of agro-dealers obtain credit from domestic fertilizer blending companies and wholesalers from whom they purchase agricultural inputs including fertilizer. Access to finance through commercial banks is challenging in Mozambique due to four main factors: (i) prohibitively high interest rates charged by commercial banks, (ii) smallholder farmers’ and agro-dealers’ lack of collateral, iii) commercial banks’ aversion to give credit to the agricultural sector due to high riskiness of the sector, and iv) high default rates. Authors’ calculations using data from the Mozambique Central Bank show that annual interest rate for lending money from commercial banks for one-year maturity in Mozambique averaged 21.8% over the period 2008 to 2017, ranging between 18.8% and 28.3%. Given this high interest rate for lending money, MADER in collaboration with the Mozambique Central Bank and other financial institutions should find mechanisms to provide credit line at discounted interest rate and matching funds to agro-dealers who in turn could provide credit lines also at discounted rates to smallholder farmers. This should be complemented with higher amounts of credit going to the agricultural sector. Data from the Mozambique Central Bank illustrates that the share of the total credit accounted for by the agriculture sector dropped from 9.4% in 2008 to 2.9% in 2014. It then increased to 3.5% in 2017.
In additional to Commercial Banks, another channel through which agro-dealers access finance includes African Fertilizer Agribusiness Partnership (AFAP), a non-profit organization aimed at building capacity of African small and medium enterprises (SME) which supply yield-enhancing agricultural inputs and increasing smallholder farmers’ use of fertilizers, ultimately contributing to agricultural productivity. According to and Nagarajan, Fernando, Leonardo, Matias and Goncalvez [
15], ACB [
20], AFAP has helped: (i) reduce the cost of accessing finance by agro-dealers through guarantee facility schemes, (ii) strengthen linkages between agro-dealers, wholesalers, and fertilizer blending companies, and (iii) improve the agro-dealer network in Mozambique (ACB stands for African Center for Biodiversity.).
4.5. Domestic Fertilizer Manufacturers
Domestic fertilizer blending plants supply fertilizer to both wholesalers and large-scale cash crop companies. There are four fertilizer blending plants in Mozambique: Mozambique Fertilizer Company (MOZFERT), Greenbelt, Export Trading Group (ETG), and Omnia. All these fertilizer blending plants are located in central Mozambique due to two main reasons. First, central Mozambique is the major producing region in the country in terms of cultivated area, suggesting potentially higher fertilizer demand. Data from IAI 2015 show that central Mozambique was the region with the highest share of smallholder farmers who used fertilizer in the 2014/2015 agricultural season (6.2% in central versus 2.5% in northern versus 2.2% in southern). These data also indicate that central Mozambique contributed to 48.8% of the total cultivated area in the 2014/2015 agricultural season; this region also accounted for 56.9% of the total cultivated area under maize and 60.4% of the total maize production in the same agricultural season. According to these data, the share of smallholder farmers who grew maize was higher in central Mozambique (82.3%) than in northern Mozambique (79.1%) and southern Mozambique (53%).
Second, central Mozambique is a strategic location to enable Mozambique fertilizer blending companies to capture relatively higher fertilizer demand requirements from landlocked neighboring countries (Malawi, Zambia, and Zimbabwe) for two main related reasons: (i) proximity to all those three landlocked neighboring countries and (ii) the good road network connecting Mozambique (from Beira port in Sofala province) to those three neighboring countries. Indeed, fertilizer blending companies in Mozambique supply fertilizer to Malawi, Zambia, and Zimbabwe. However, Mozambique fertilizer blending companies have to be more efficient in supplying fertilizer to those landlocked neighboring countries because those countries are also key markets sourcing fertilizer from South Africa fertilizer companies. According to DAFF [
17], volumes of NPK exported from South Africa to Zambia and Zimbabwe amounted to 472,587 MT and 425,755 MT, respectively, over the period 2007 to 2016; with annual averages of 47,259 MT for Zambia and 42,576 MT for Zimbabwe over the same period. Zambia with 39.3% and Zimbabwe with 35.4% were the top two main destinations of NPK exported from South Africa to Southern Africa countries over the period 2007 to 2016, followed by Malawi.
Nonetheless, it is worth noting that between 2007 and 2016, exports of NPK from South Africa to Zambia and to Zimbabwe experienced downward trends, dropping from 64,140 MT in 2007 to 18,637 MT in 2016 in the case of Zambia and from 71,952 MT in 2007 to 2422 MT in 2016 in the case of Zimbabwe. These downward trends of exports from South Africa to both Zambia and Zimbabwe could suggest that Mozambique fertilizer blending companies are taking up part of the market share that used to be taken by South African fertilizer companies by increasing fertilizer exports from Mozambique to Zambia, Zimbabwe, and Malawi. However, further investigation of this issue needs to be conducted to make a well-founded statement.
Consumption of fertilizer is considerably lower in Mozambique than in other neighboring countries. Authors’ calculations using data from FAOSTAT show that annual consumption of fertilizer averaged 27,198 MT in Mozambique over the period 2002 to 2016; compared with 86,213 MT in Tanzania, 105,448 MT in Zimbabwe, 108,505 MT in Malawi, and 134,725 MT in Zambia. Furthermore, only 3.8% of the about 4,000,000 smallholder farmers used fertilizer in Mozambique. This low consumption of fertilizer in Mozambique represents an unlocked demand potential if smallholder farmers’ demand for fertilizer is driven up by mainly increasing smallholder farmers’ awareness to the benefits of fertilizer application (both yield gains and profitability) through demonstration plots and releasing finance constraints through credit schemes complemented with strengthened output market information. These are not the only demand drivers but they are demand drivers that can be directly influenced by domestic blending companies; hence, domestic fertilizer blending companies can take advantage of this potential increased smallholder farmers’ demand for fertilizer to ultimately increase fertilizer blending companies’ business operations.
Given the high price of fertilizer paid by smallholder farmers, large reserves of natural gas and phosphates in Mozambique constitute another unlocked potential to be exploited by domestic fertilizer blending companies to make fertilizer more accessible and affordable to smallholder farmers. Biggs [
21] and MIREME [
22] documented that Mozambique’s reserves of natural gas estimated at about 250,000,000,000,000 cubic feet (2.5
14 ft
3) and coal estimated at about 25,000,000,000 MT (2.5
10 MT) are among the largest in the world. Natural gas can be used to produce fertilizer (ammonia and urea) at a relatively low cost, making nitrogen fertilizer more affordable to smallholder farmers. In an effort to unlock this potential, the GoM signed an agreement in 2017 with the Norwegian giant fertilizer Yara International—one of the world’s largest fertilizer companies—to build a plant, estimated at about two billion USD, in Cabo Delgado to produce nitrogen fertilizer from natural gas.
Furthermore, Pekkala et al. [
23], Van Straaten [
24], and Wanzala and Groot [
25] documented that Mozambique holds high-quality and large deposits of phosphates, especially in Nampula province, estimated at about 155,000,000 MT of apatite ore, making it the largest deposit in central and eastern Africa. These deposits could also be used to produce phosphate fertilizer at a relatively low cost, and the GoM is still looking for potential investors to build a phosphate fertilizer plant in northern Mozambique. On the other hand, Rocha et al. [
26] reported that direct application of rock phosphate (40.7% of P2O5) could be used as a corrective for acid soils with phosphorus deficiency because rock phosphate was more effective than triple super phosphate, a processed phosphate fertilizer, in supplying phosphorus and corresponding yield gains in pigeon pea production in Zambezia province.
Given that one blend of fertilizer cannot fit all soil types and crops, soil analysis would be an effective mechanism through which soil types and crops could be matched with specific blend fertilizers. Hence, soil testing results and corresponding fertilizer recommendations by soil type and crop would be value-added information for domestic fertilizer blending plants to produce blend fertilizers for specific soils and crops. This would make fertilizer blending companies more relevant for smallholder farmers. However, these fertilizer recommendations for specific soil types and crops for the entire country are not currently available. Institutions that could play a key role in the mapping of fertilizer recommendation for specific soils and crops include the Mozambique Agricultural Research Institute (IIAM) under the MADER and higher education institutions—distributed throughout the countries—such as Eduardo Mondlane University’s Faculty of Agronomy and Forestry Engineering (UEM-FAEF), Gaza and Manica High Polytechnic Institutes (ISPG and ISPM, respectively), Lurio University’s Faculty of Agricultural Sciences, and Zambeze University’s Faculty of Agricultural Sciences.
However, these institutions are in need of investments in capacity building (both human resource and physical infrastructure, including laboratories for soil analysis) to effectively contribute to this process. On this front, a good practice includes the triparty agreement among MADER, ISPM, and African Fertilizer Agribusiness Partnership (AFAP) under which AFAP upgraded ISPM laboratories located in Manica province to carry out soil analyses to draw fertilizer recommendations for specific soils and crops. This agreement has generated fruitful results, as Greenbelt is producing fertilizer blends based on soil-specific fertilizer recommendations, but this experience should be scaled up because so far limited soil mapping to inform blending has been done. Given that countrywide coverage is needed, as stated in the National Fertilizer Strategy of 2012, taking advantage of the four IIAM Zonal Centers—namely the Southern Zonal Center located in Gaza province, Central Zonal Center in Manica province, Northeastern Zonal Center in Nampula province, and Northwestern Zonal Center in Niassa province—complemented with infrastructure and human capacities from other higher education institutions would be crucial to efficiently generate countrywide soil mapping to inform fertilizer blending.
4.6. Lessons Learned from Voucher Subsidy Programs in Mozambique
Some smallholder farmers receive fertilizer through voucher subsidy programs. Carter et al. [
27] reported that the GoM—with assistance from International Fertilizer Development Center (IFDC) and funding from European Union (EU) and Food and Agriculture Organization of the United Nations (FAO)—piloted a voucher subsidy program for maize and rice smallholder farmers in the 2009/2010 agricultural season. This voucher subsidy program targeted 25,000 farmers (15,000 maize producers and 10,000 rice producers), who were required to co-pay 27% of the total market value of the input package in the case of maize and local private agro-dealers from whom voucher coupons could be redeemed.
Four main lessons emerged from a randomized trial conducted by Carter, Laajaj, and Yang [
27] to assess the impact of paper-based voucher coupons, with maize as the targeted crop. First, on one hand, only 50% of farmers who gained access to voucher coupons ended up picking up the coupons from the extension agents who distributed the coupons, suggesting relatively low uptake of coupons among potential beneficiaries. On the other hand, 83% of farmers who picked the voucher coupons redeemed them at participating agro-dealers, but only 57% used the fertilizer from the redeemed voucher package for their maize production (the targeted crop for the voucher coupons). Moreover, among farmers who redeemed their coupons but did not use the redeemed fertilizer on their maize production, 67% allocated the fertilizer to other crops (especially tobacco and horticulture) and 4% sold the fertilizer to other farmers. This suggests that achieving effective targeting could be complex when implementing subsidy voucher programs.
Second, among those who did not pick up the voucher coupons despite being entitled to them, 46% reported lacking the required co-payment (27% of the market value of the voucher coupon) as the reason for not picking up. This emphasizes the importance of liquidity constraints faced by smallholder farmers to increase their access to yield-enhancing agricultural inputs. Third, comparing farmers who gained access to voucher coupons with those who did not gain access, the impact of the voucher coupons was modest but statistically significant. Gaining accessing to voucher coupons increased applications of fertilizer by 14.8 kg and of improved maize seed by 3.1 kg. This low impact of voucher coupons on the target farmers is associated with the low uptake of vouchers among those who were entitled to them (as discussed above).
Fourth, compared with the impact on the target farmers, the impact of voucher coupons on input usage among farmers who picked up the coupons and used them on the targeted crop was much greater (with statistical significance as well): 68.3 kg for fertilizer application and 14.4 kg for improved maize seed application. This suggests that with effective targeting, voucher coupons could bring about sizable increases in uses of fertilizer and improved seed among smallholder farmers, potentially driving up smallholder farmers’ demand for fertilizer if fertilizer application proves to be profitable among farmers who benefited from the voucher coupons.
After experimenting with the paper-based voucher coupons for several years, the GoM embarked on an electronic voucher (e-voucher) scheme in recent years. According to de Vletter [
28], starting in the 2015/2016 agricultural season, FAO, in partnership with the GoM and EU, launched the first e-voucher scheme aimed at increasing access to agricultural inputs (seeds, fertilizers, pesticides, and inoculants). Like in the case of paper-based voucher coupons, the e-voucher scheme targeted about 25,000 farmers, who were required to co-pay for the total market value of subsidized input package. These 25,000 beneficiaries of the e-voucher scheme represent less than 1% of the total number of smallholder farmers; suggesting that the e-voucher scheme is relatively small in scale, especially when compared with neighboring countries—such as Malawi, Zambia, and Tanzania—that launched expensive fertilizer subsidy programs at national scale. de Vletter [
28] documented that e-voucher beneficiaries redeemed 569 MT of fertilizer (301 MT of NPK and 268 MT of urea) in the 2016/2017 agricultural season in Mozambique. By contrast, Jayne et al. [
29] pointed out that the annual volumes of fertilizer distributed under input subsidy programs in 2014 amounted to 208,000 MT in Malawi, 208,000 MT in Zambia, and 112,000 MT in Tanzania.
Based on the assessment made by de Vletter [
28], three main lessons could be learned from the e-voucher program implemented in Manica and Sofala provinces covering about 90% of the total beneficiaries. First, unlike the paper-based vouchers, for which 83% of beneficiaries who picked their paper-based vouchers redeemed the vouchers, only 59.5% of farmers who received e-vouchers actually redeemed their e-vouchers by making co-payments to obtain the input package. However, it is worth noting that the proportion of farmers who redeemed their e-vouchers was higher among farmers receiving package A with total market value of MZN 3000 than among those receiving package B with total market value of MZN 7000 (44.1% versus 74.3%). This could be related to higher liquidity constraints among farmers benefiting from package A (subsistence farmers) than among those benefiting from package B (emerging farmers).
Second, the number of e-vouchers redeemed increased by about three-fold, from 6099 in the 2015/2016 agricultural season to 16,776 in the 2016/2017 agricultural season. During the same period, it is worth noting that the share of the package B—more expensive and sophisticated—in the total number of redeemed e-vouchers also increased from 45.2% to 51.1%. This rapid increase in the number of farmers who redeemed their e-vouchers, coupled with increased share of farmers benefiting from package B, could be related to increased awareness of the benefits of fertilizer and better knowledge of its use, as a considerable share of beneficiary farmers also participate in farmers’ field schools (FFS) with demonstration plots organized by FAO and fertilizer agro-dealers.
Third, the number of agro-dealers from whom beneficiaries can redeem their e-vouchers increased from 9 in the 2015/2016 agricultural season to 15 in the 2016/2017 agricultural season. The average number of beneficiary farmers served by each agro-dealer increased from 678 to 1118 during the same period. In addition to selling directly to farmers, agro-dealers participating in the e-voucher scheme usually have a network of retailers who are regularly supplied with yield-enhancing agricultural inputs on either credit or consignment basis so that beneficiary farmers can redeem their e-vouchers with those retailers who are located relatively closer to farmers. With the rapid expansion of the e-voucher scheme, some retailers who were previously agents of those agro-dealers have become independent agro-dealers themselves, participating directly in the e-voucher program. This has resulted in increased competition among agro-dealers and reduced the distance between fertilizer suppliers and farmers.

 ,
, 


