On the Use of Historical Flights for the Urban Growth Analysis of Cities Through Time: The Case Study of Avila (Spain)


 ,
,  and
and 
Abstract
1. Introduction
2. Study Area and Datasets
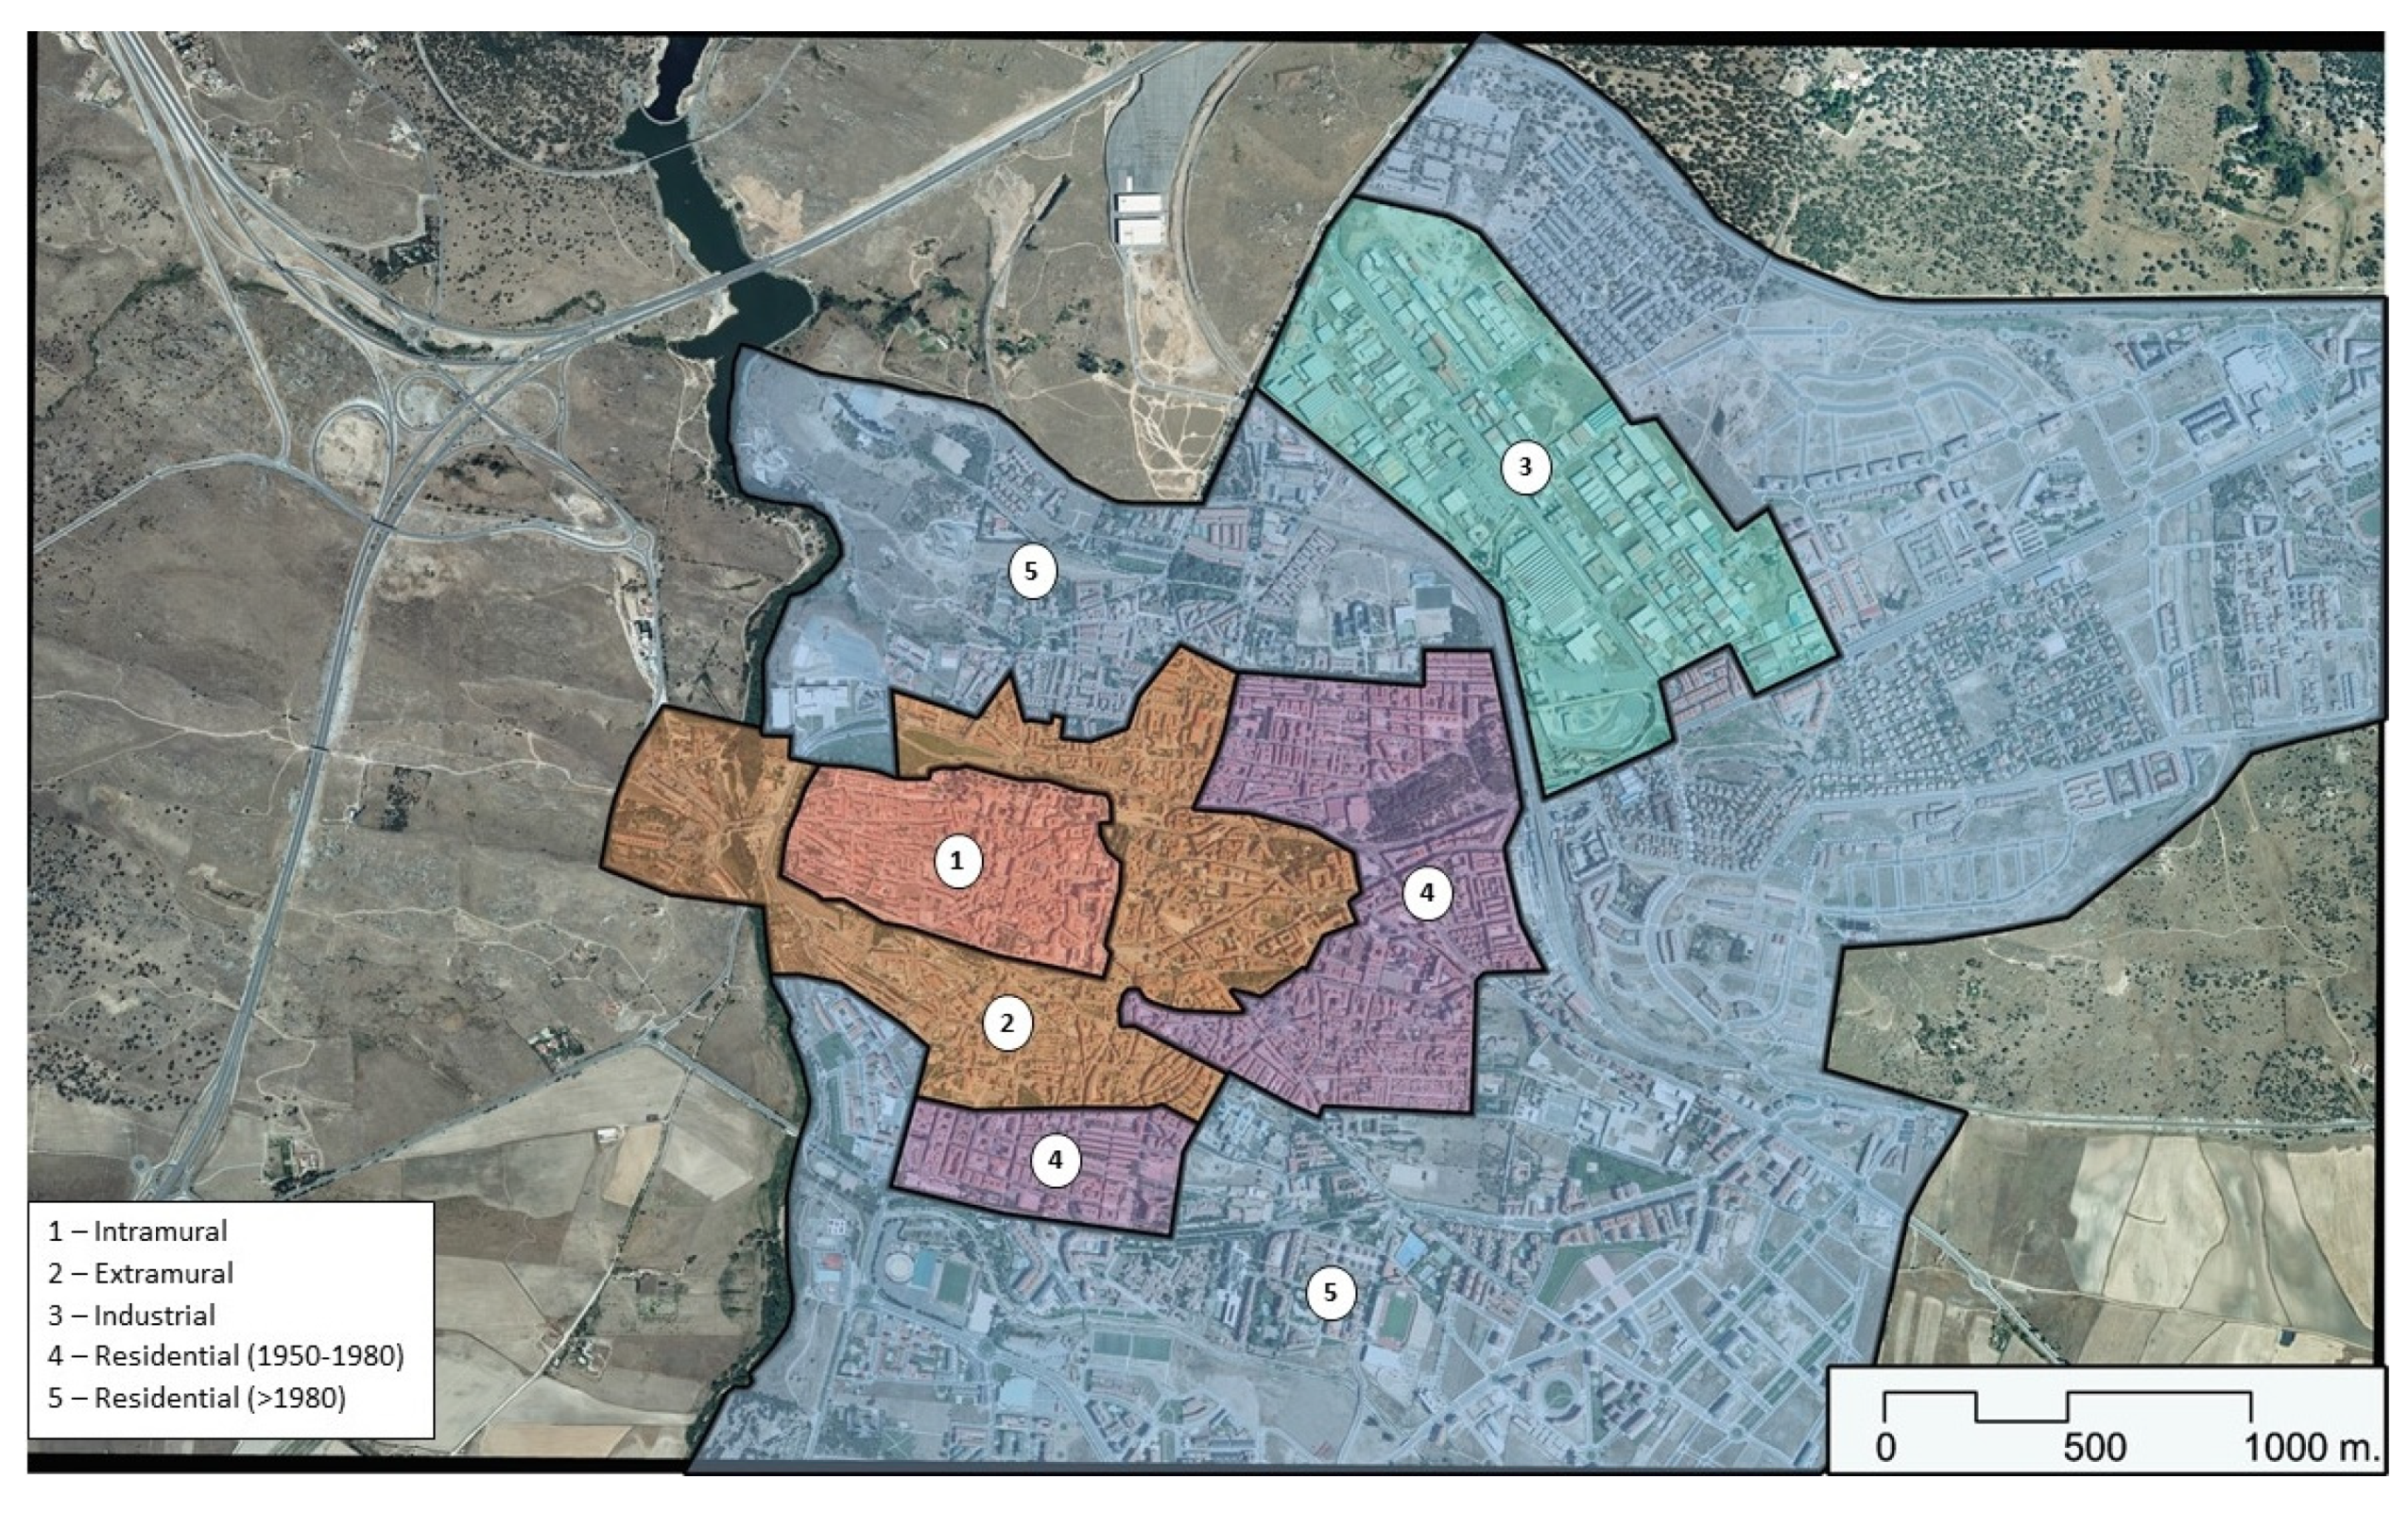
2.1. Study Area
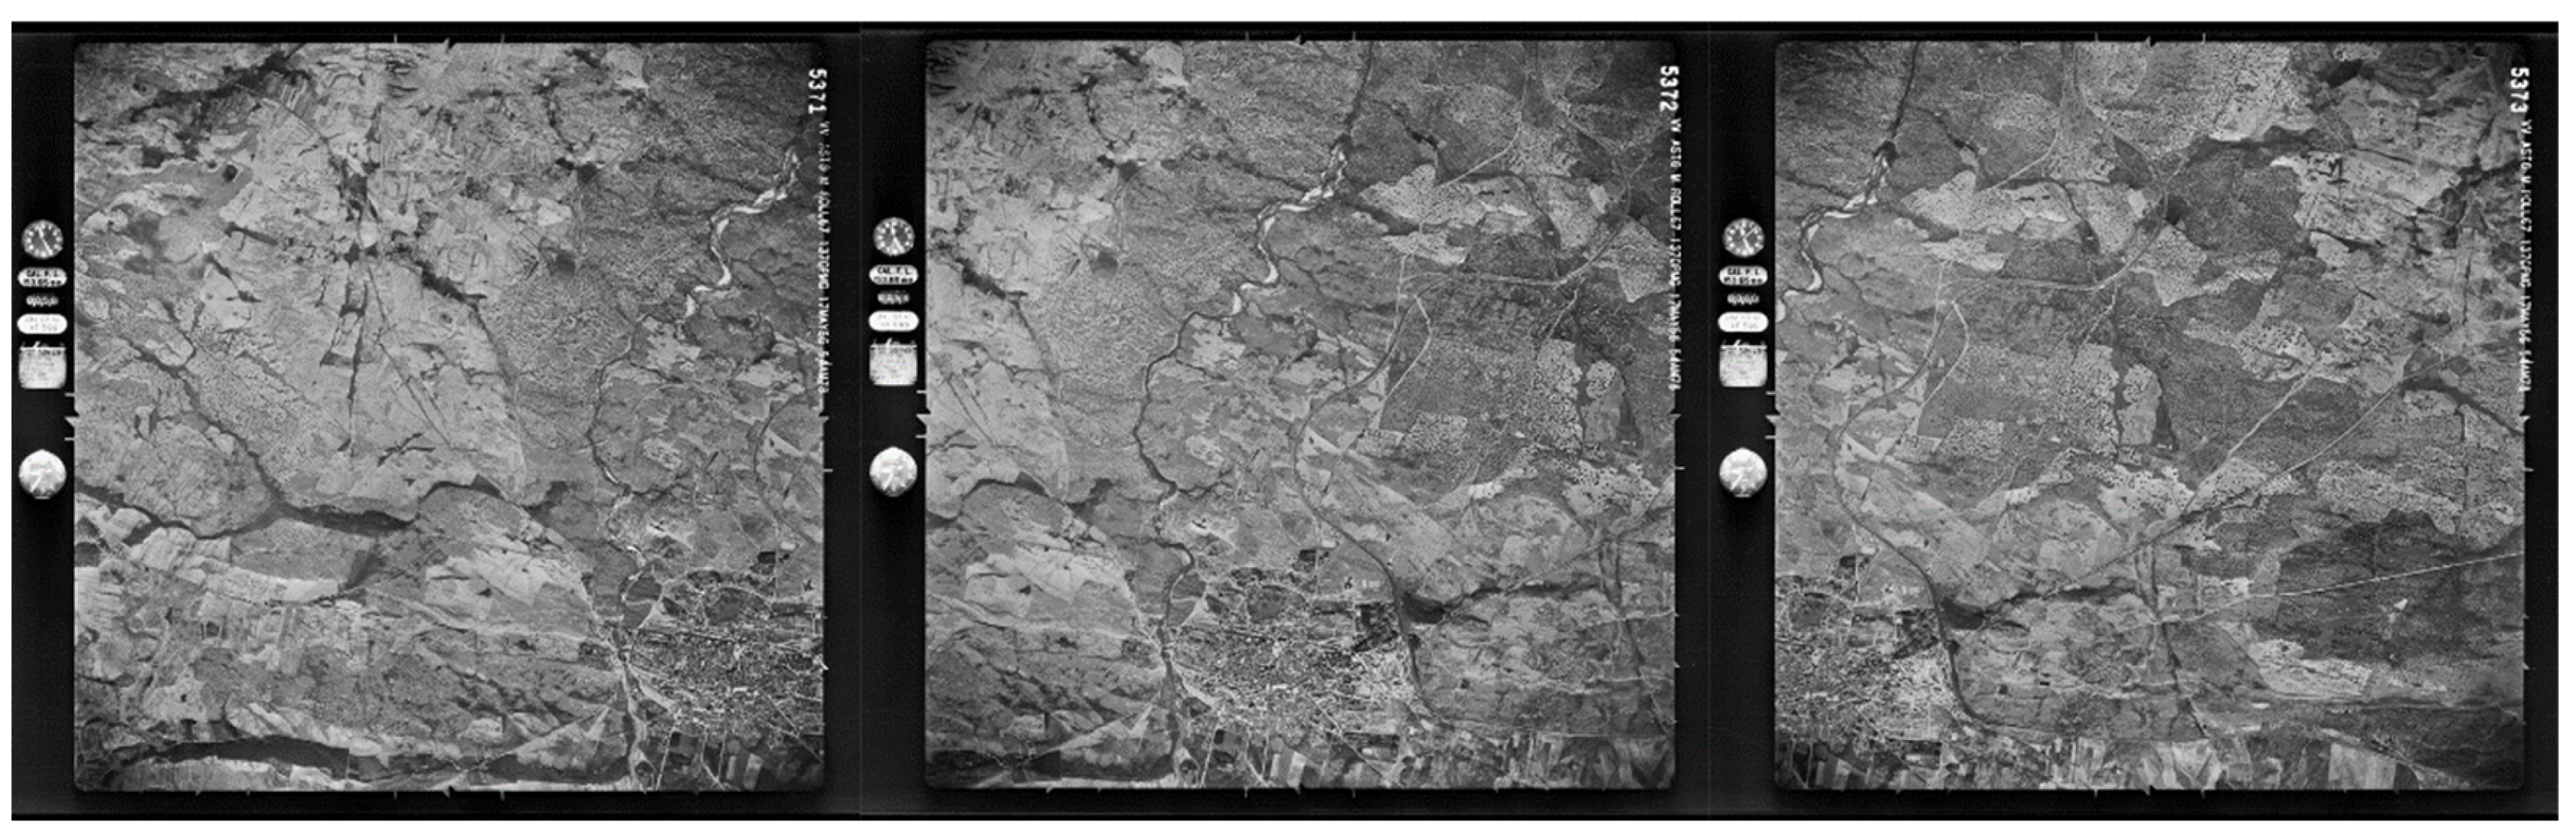
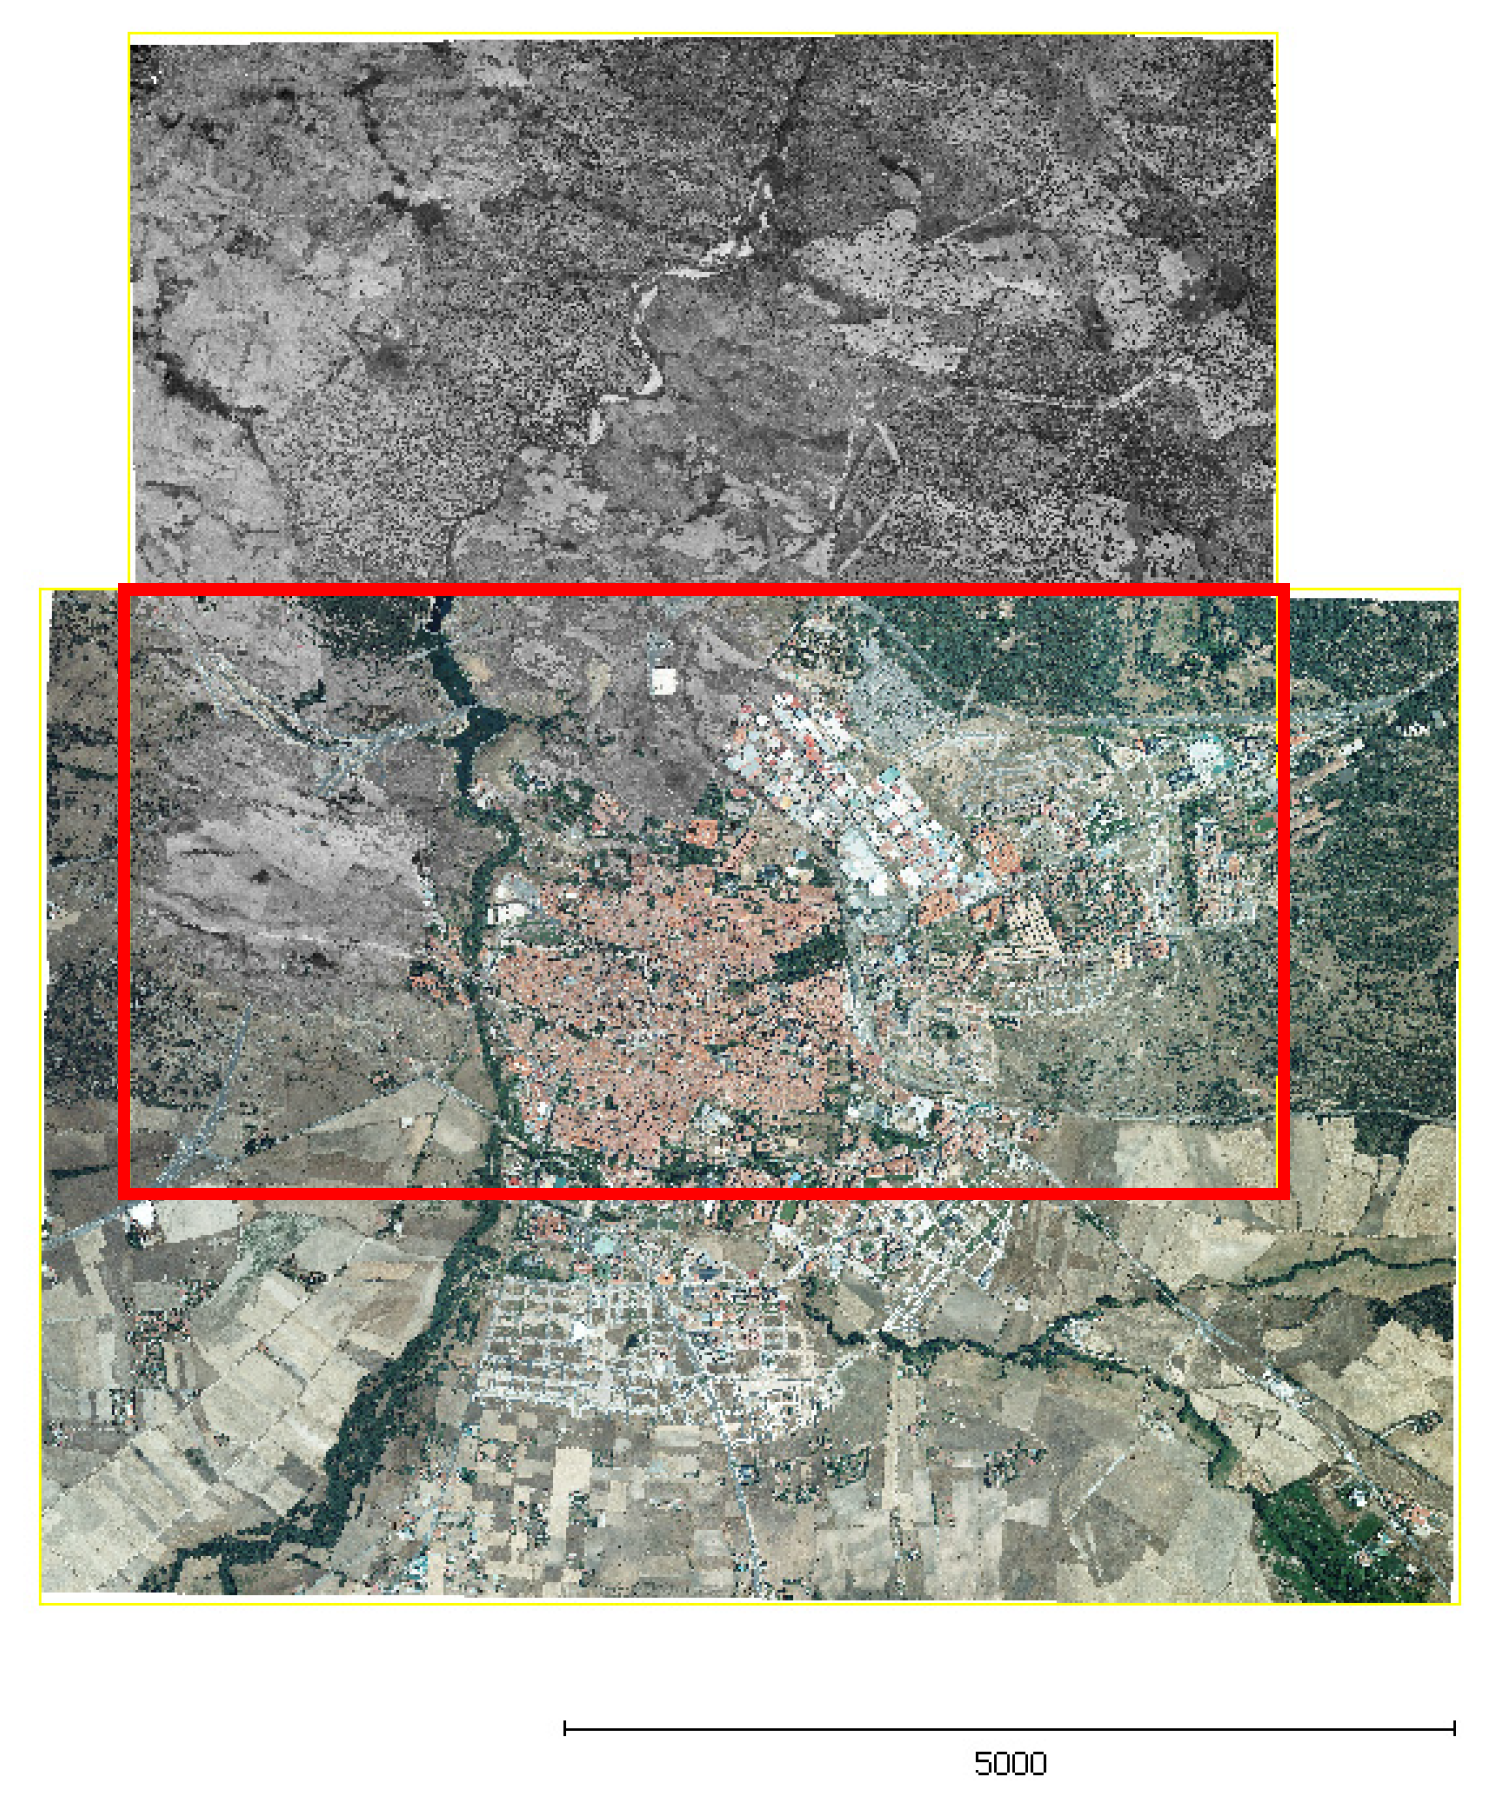
2.2. Historical American flight
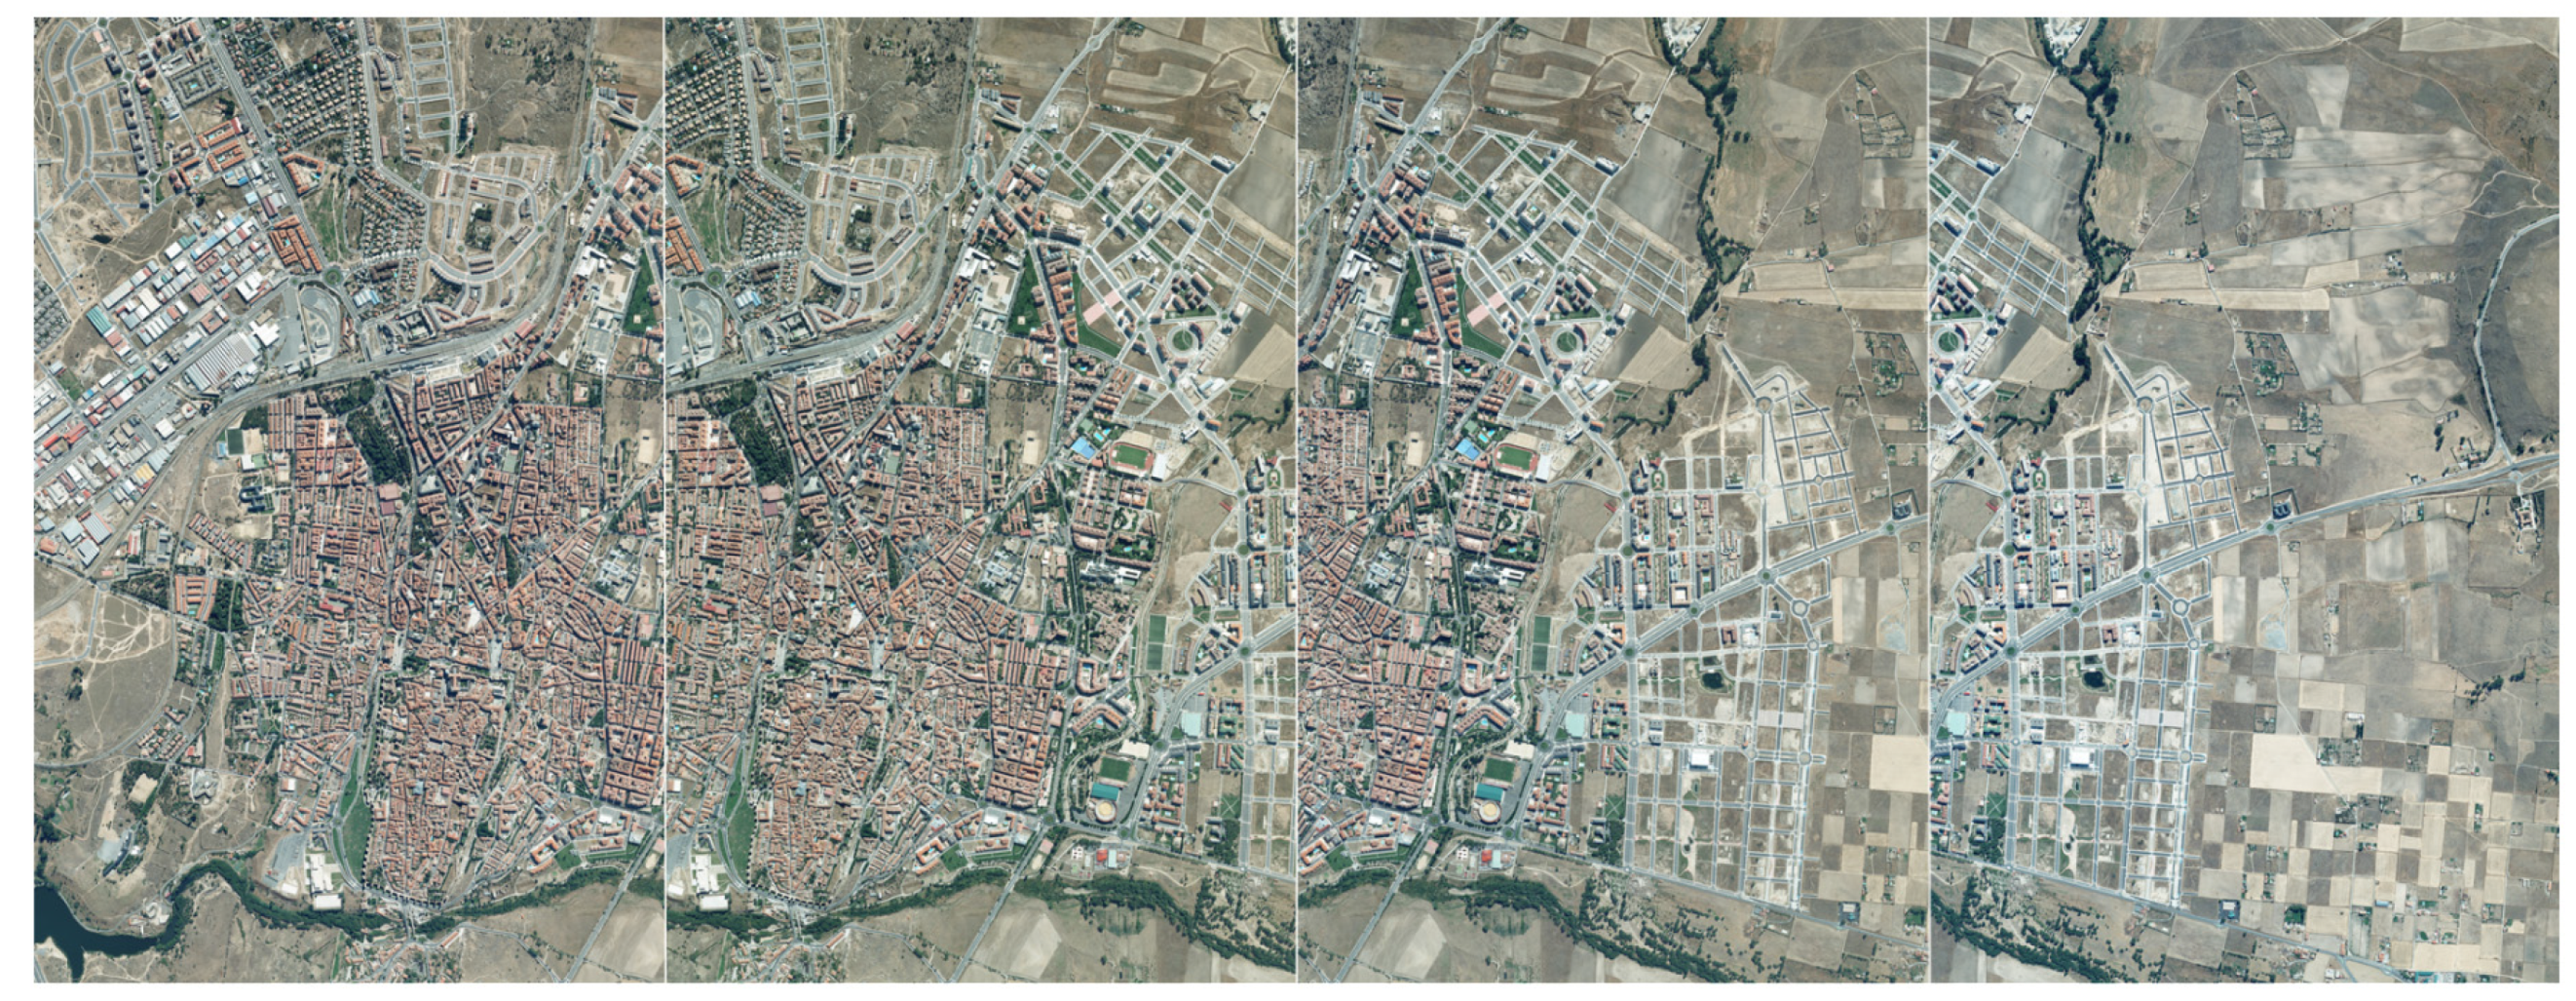
2.3. PNOA Flight
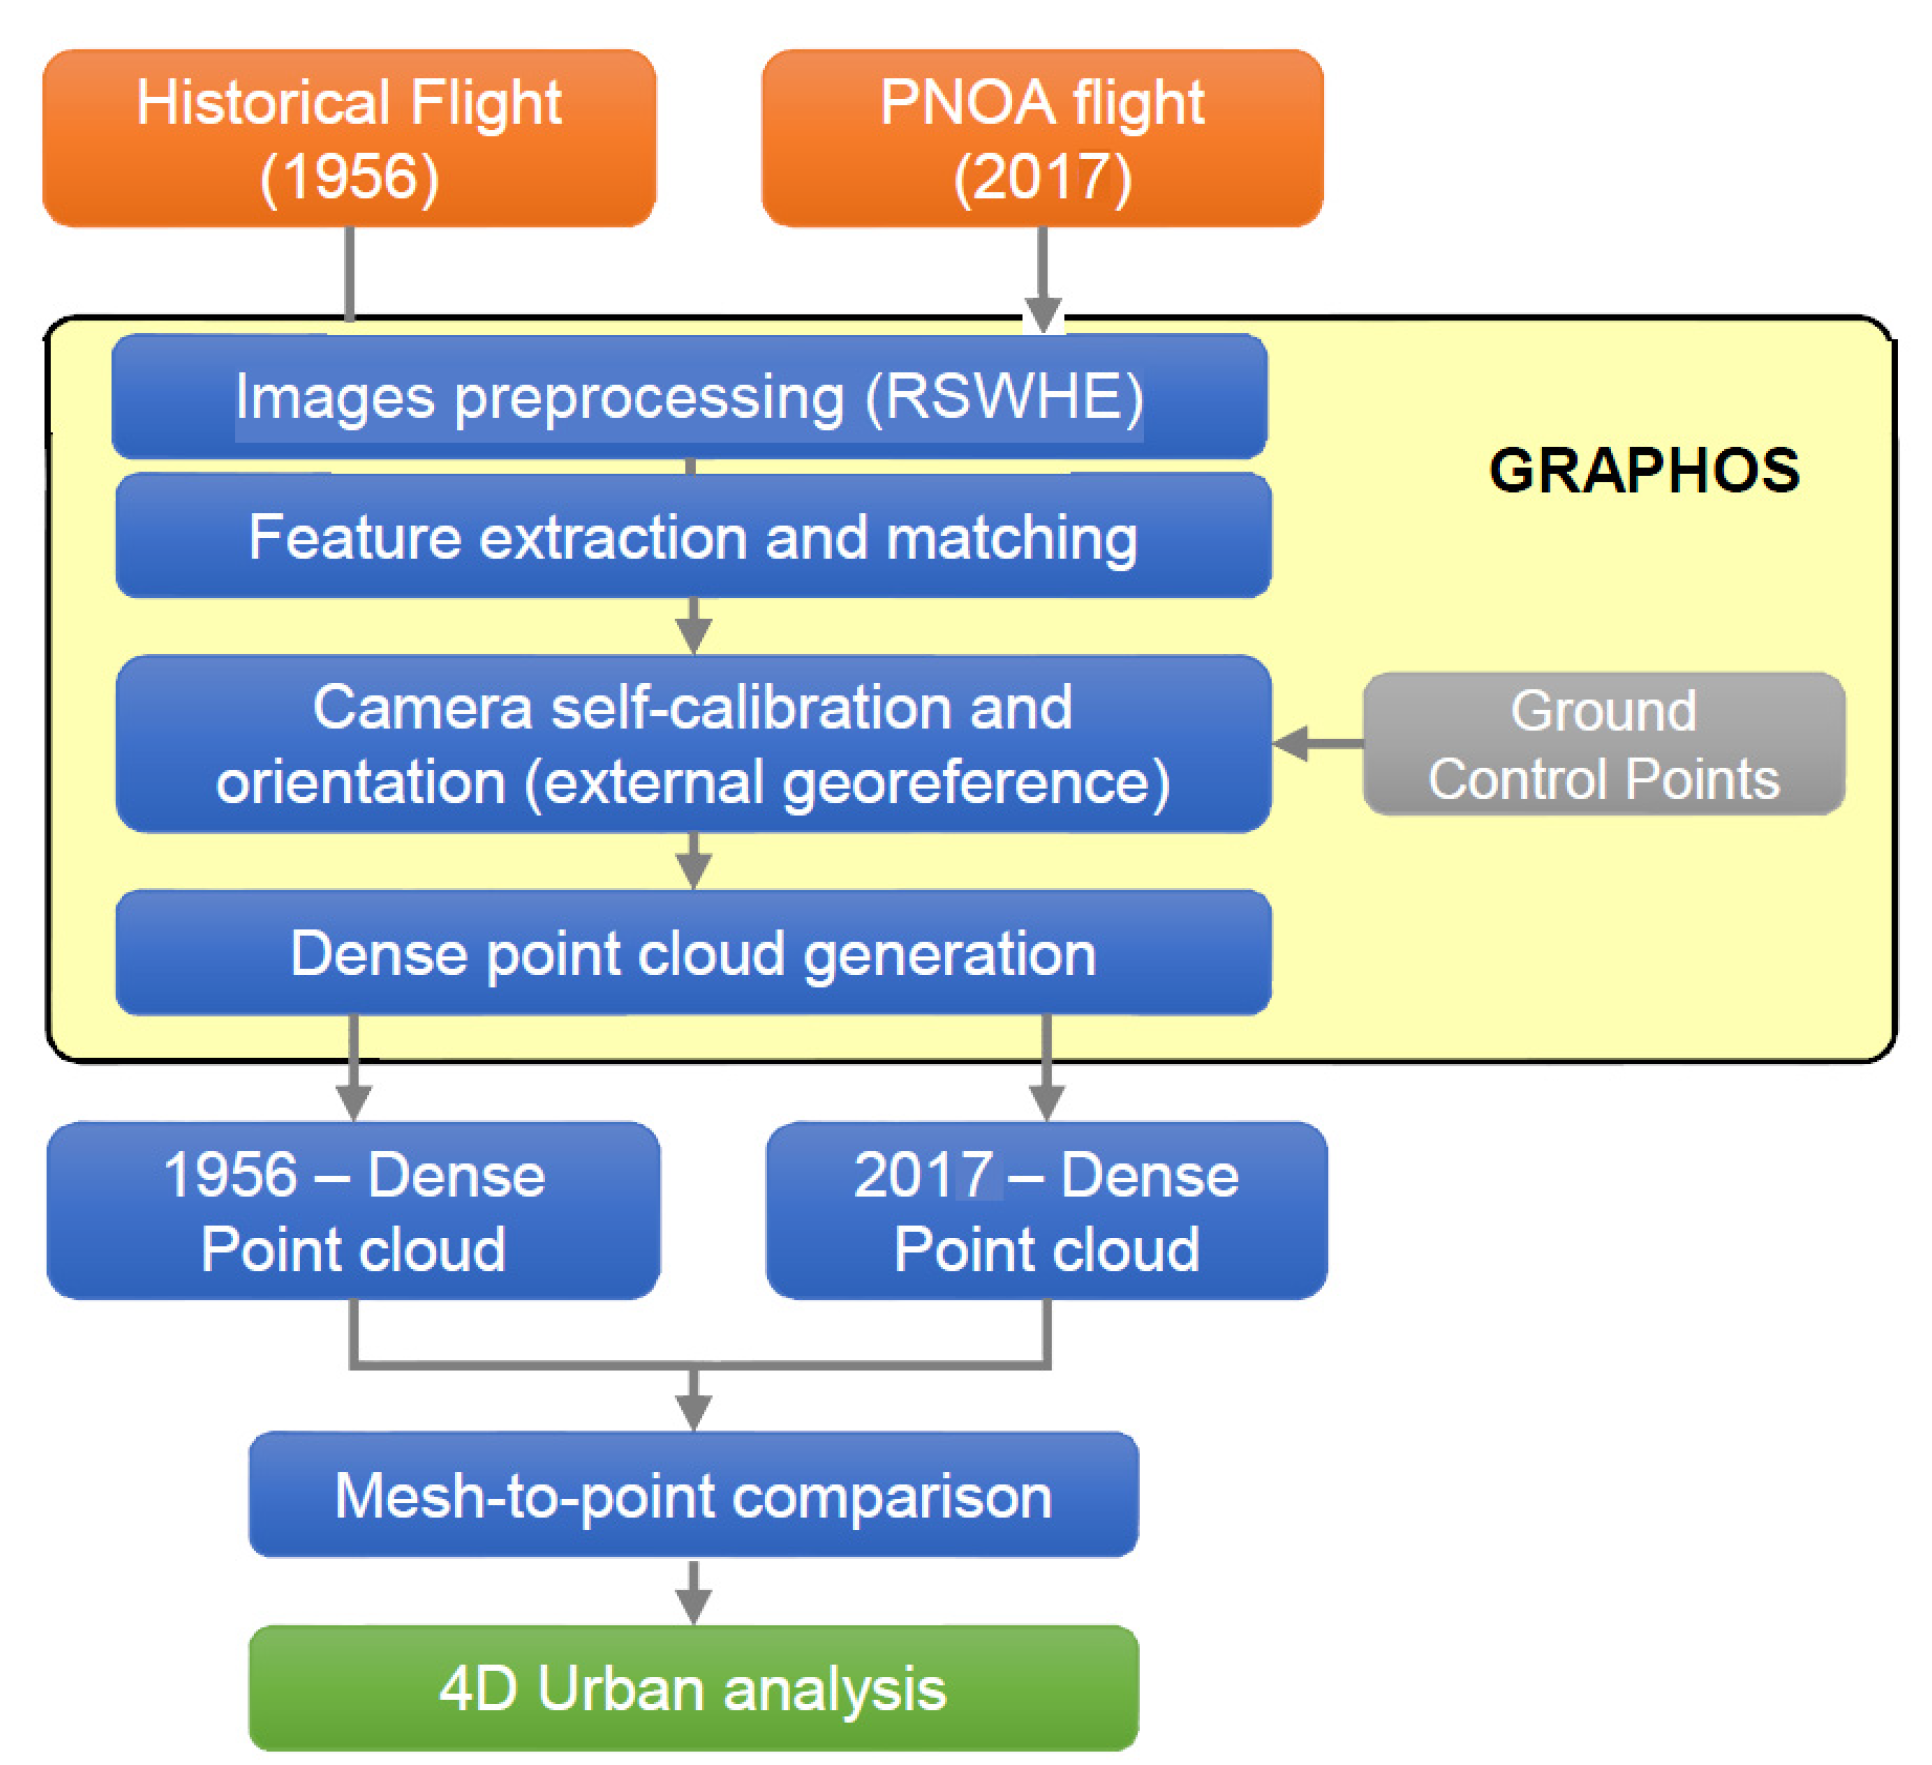
3. Methodology
3.1. Preprocessing of Images
3.2. Feature Extraction and Matching
3.3. Camera Orientation and Self-Calibration
3.4. Dense Point Cloud Generation
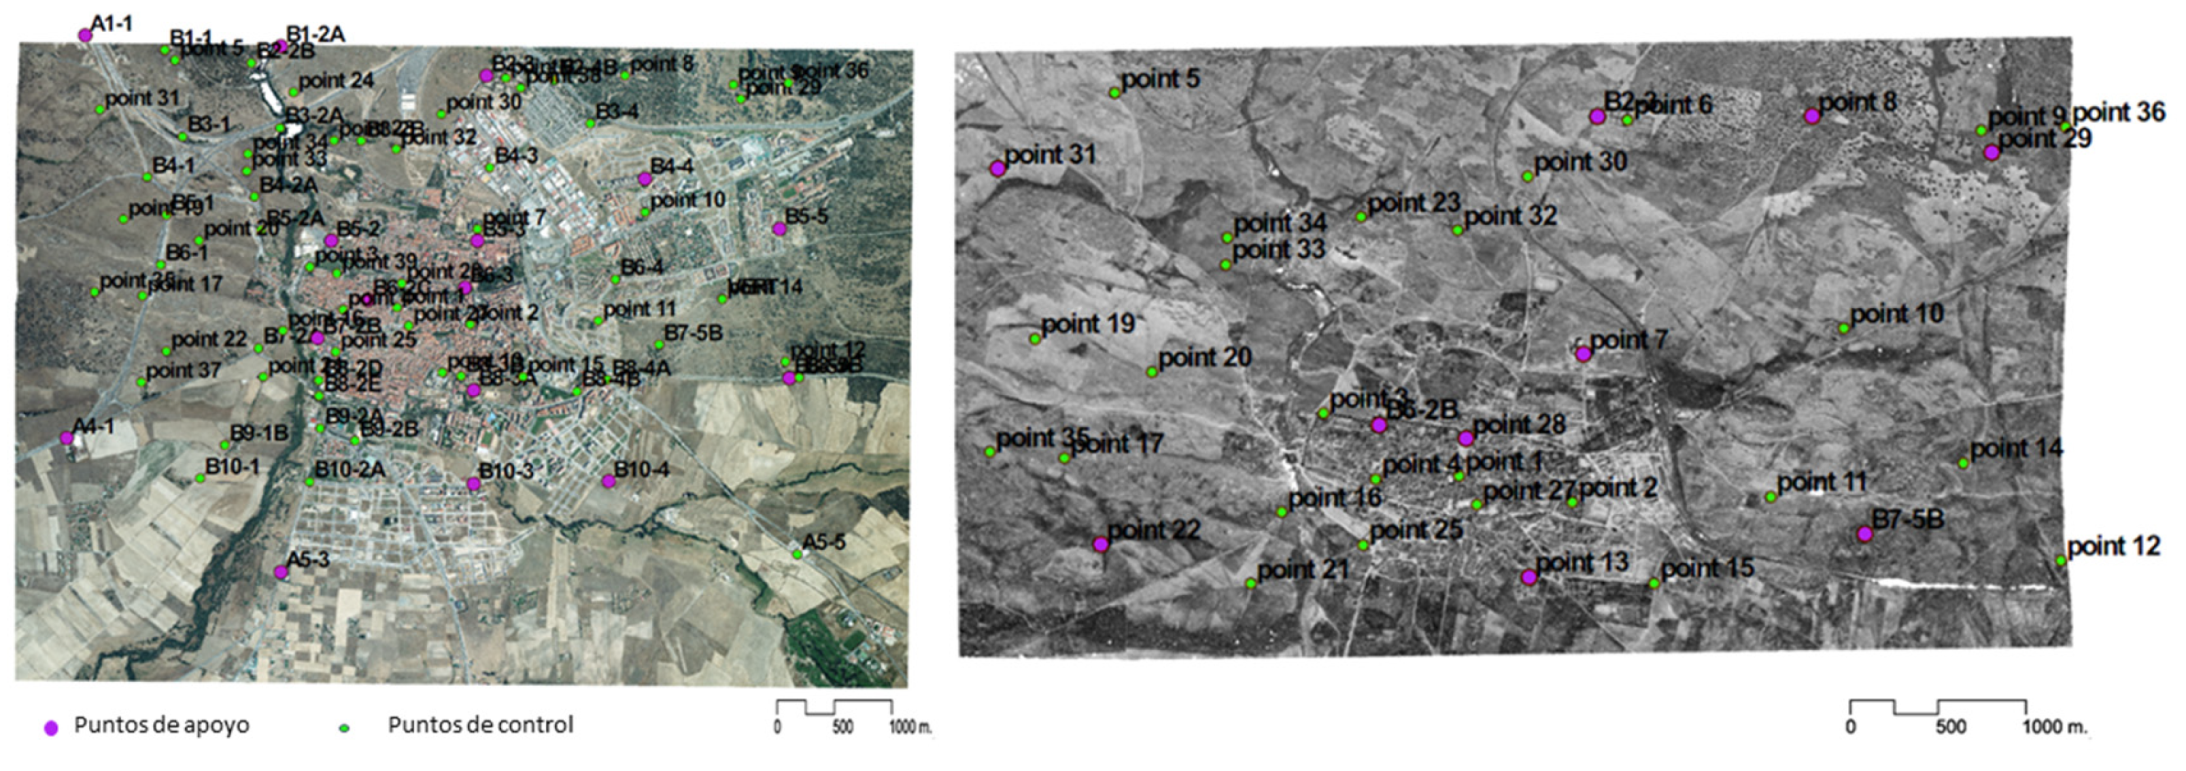
3.5. Accuracy Assessment
4. Experimental Results
4.1. Suitability Assessment
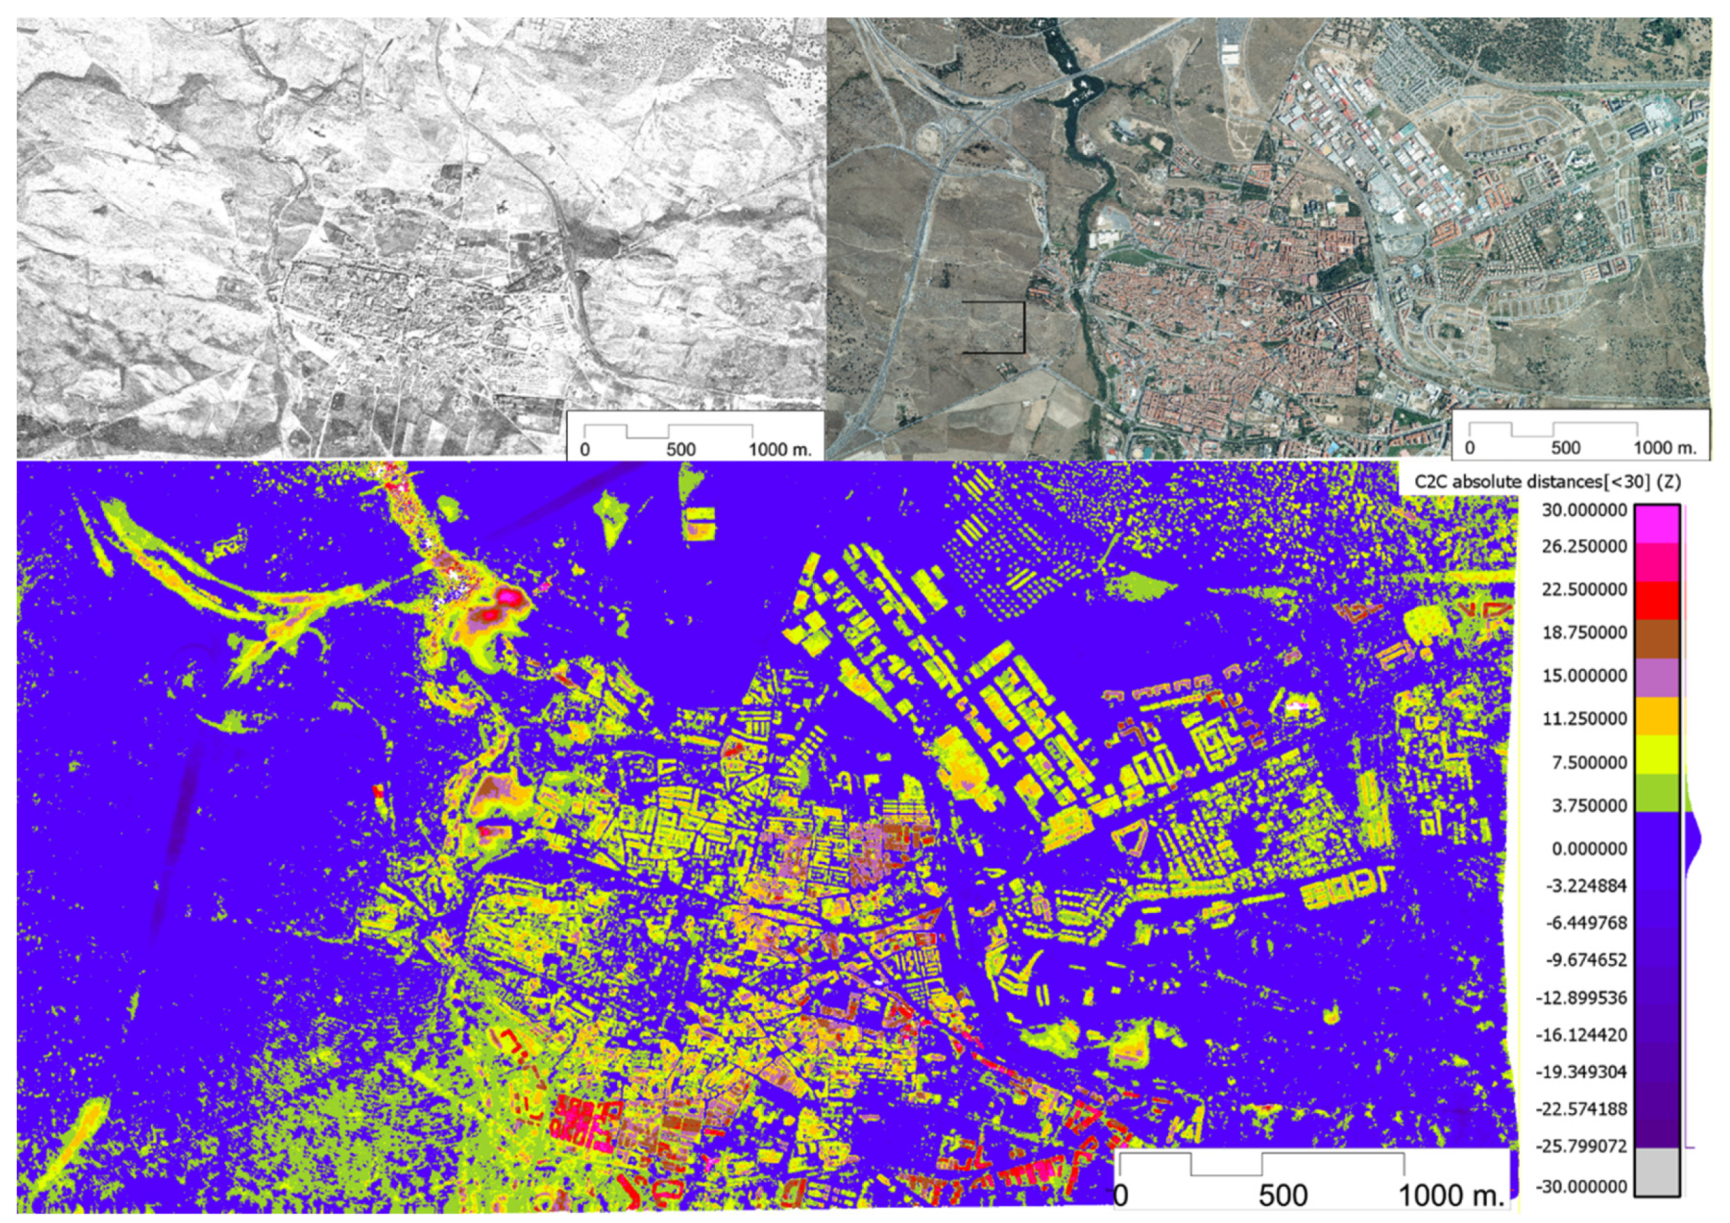
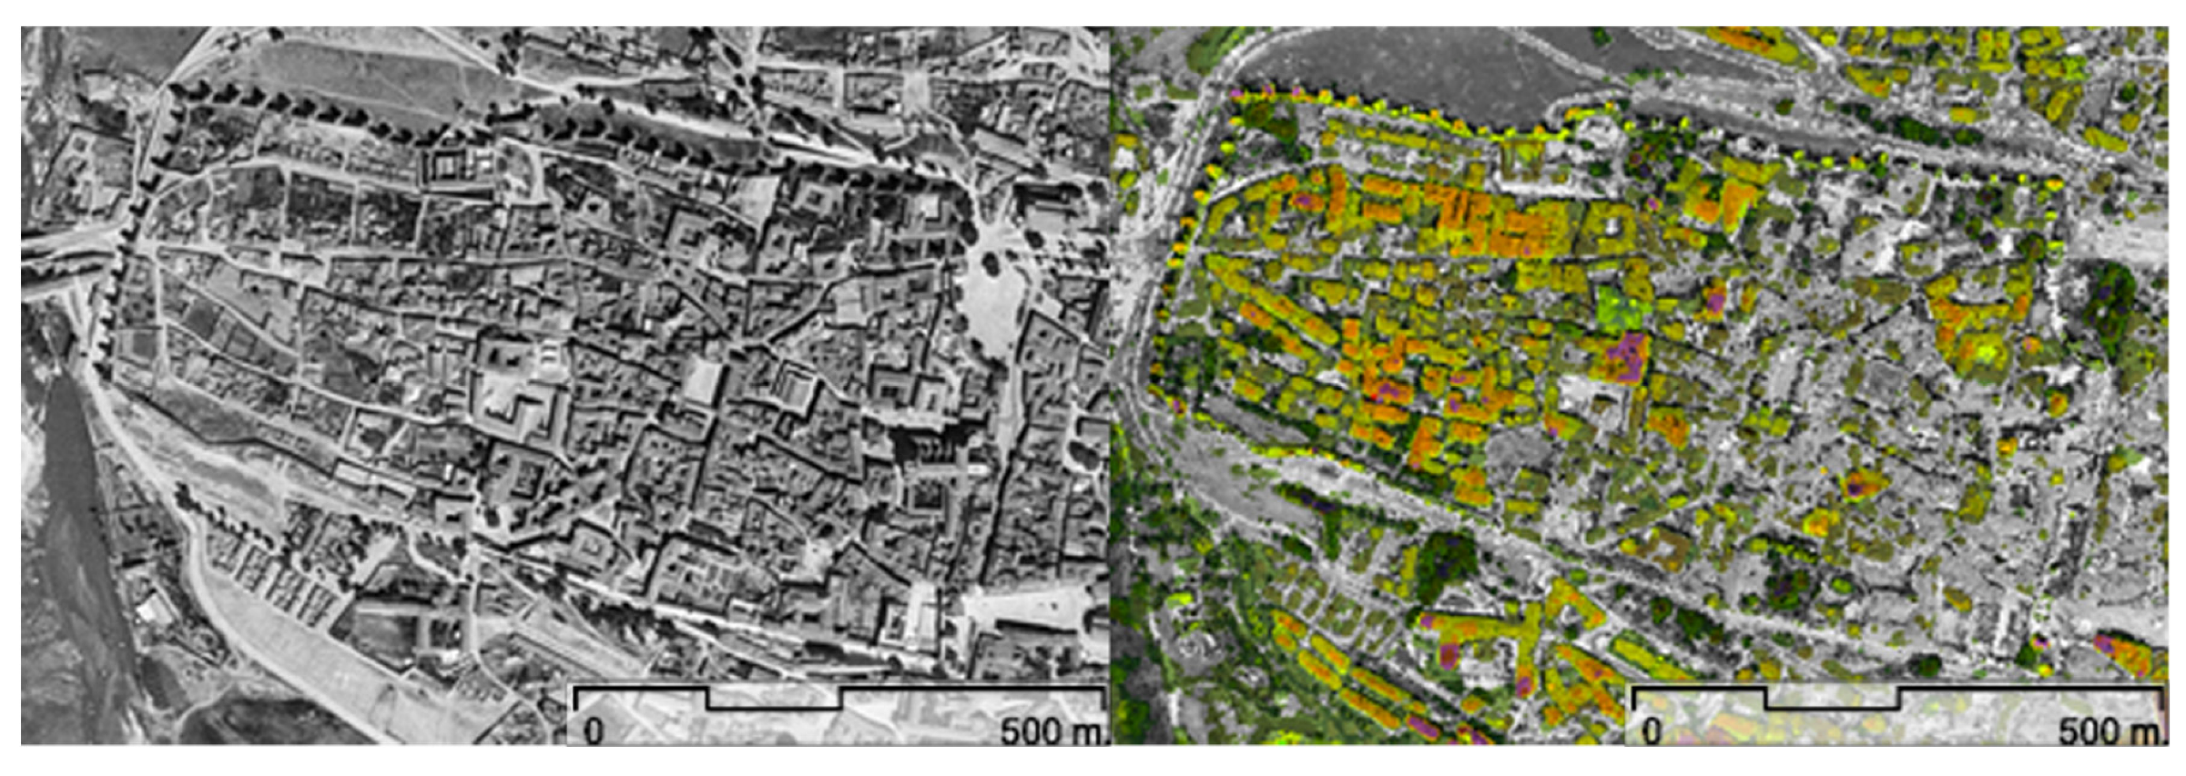
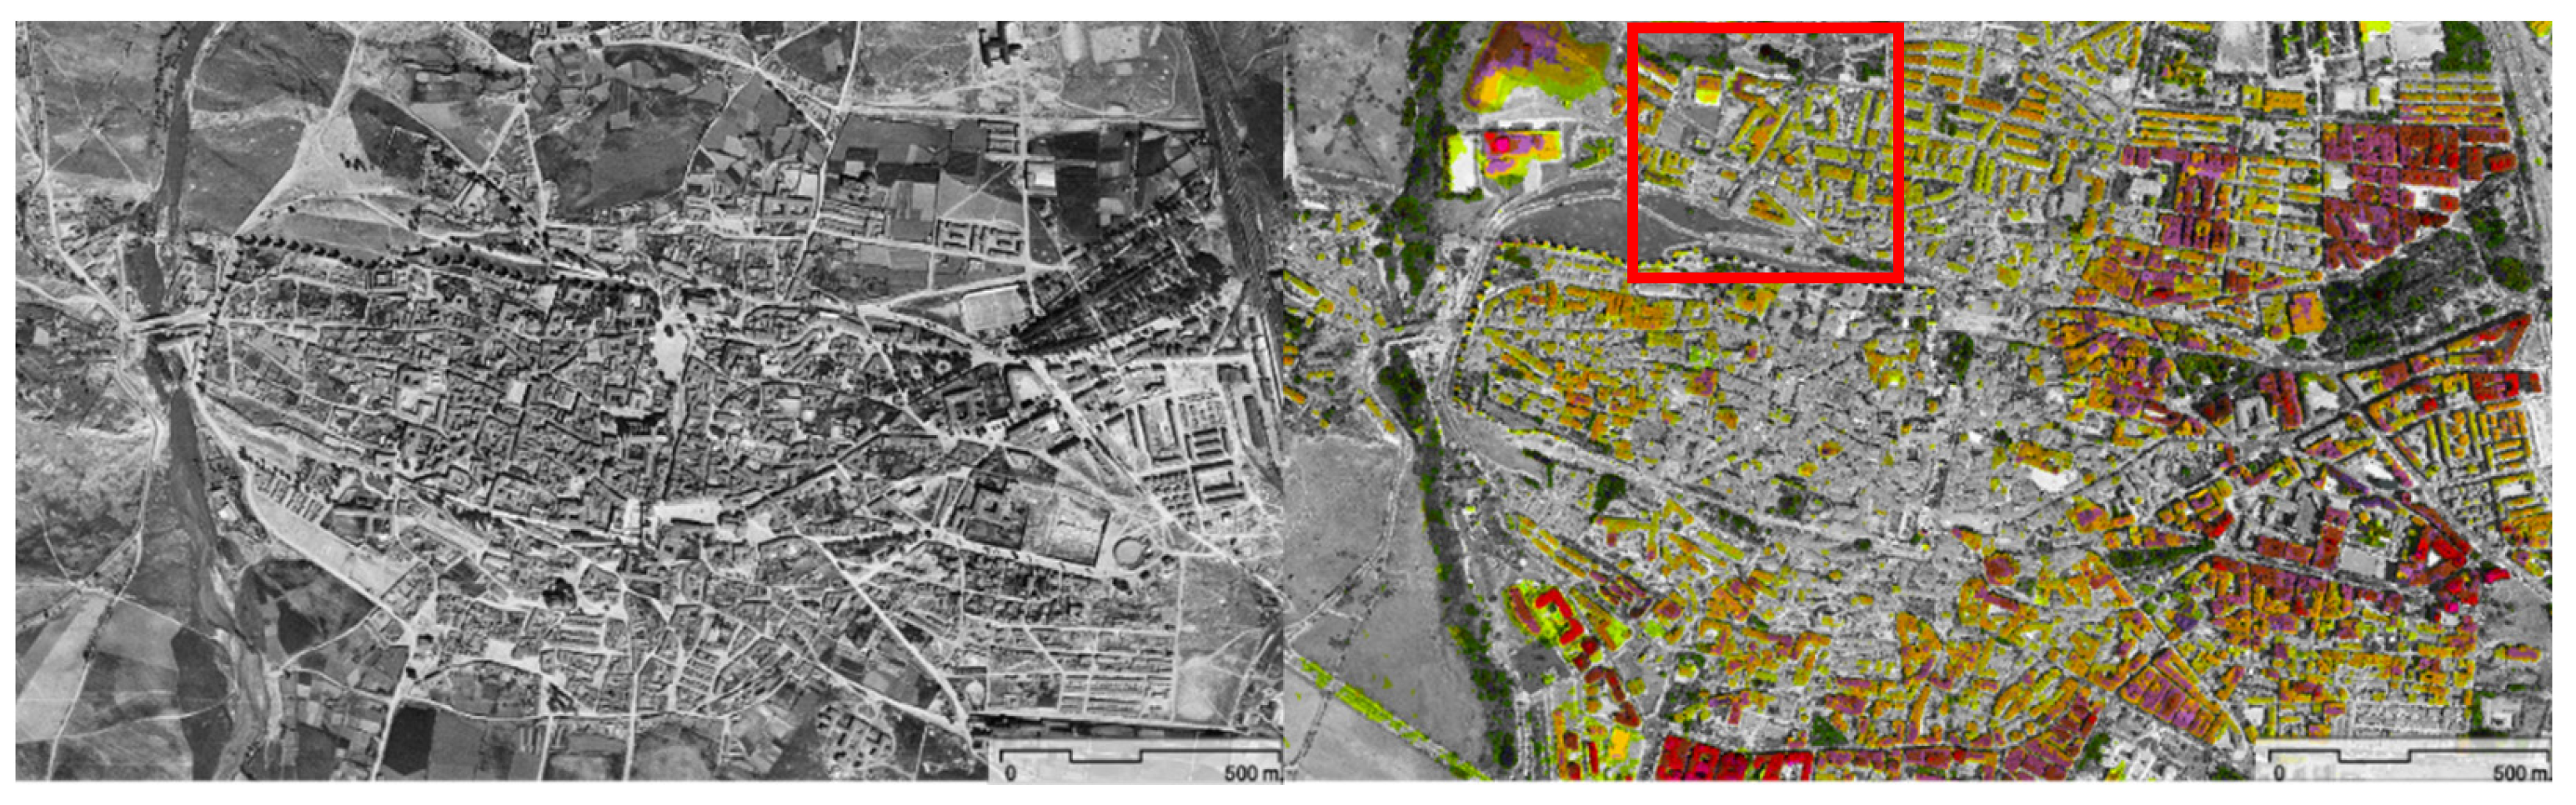
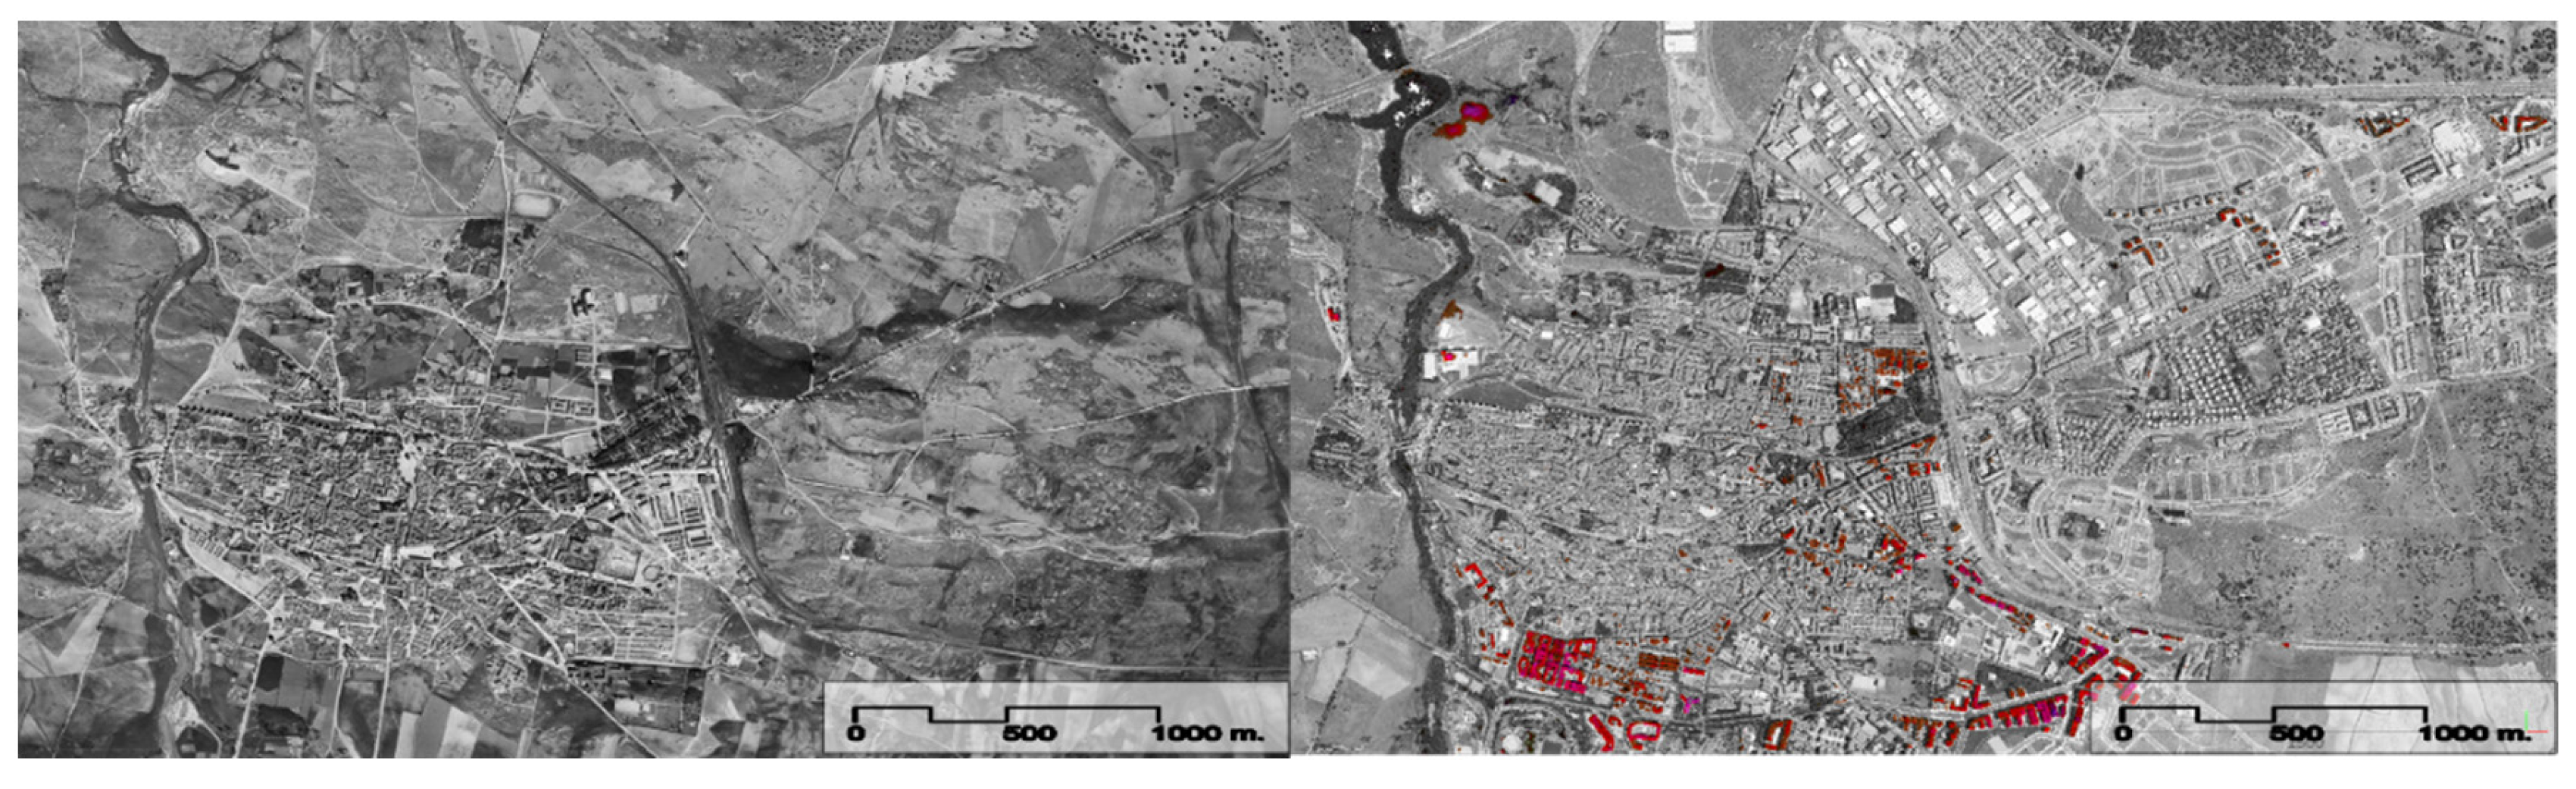
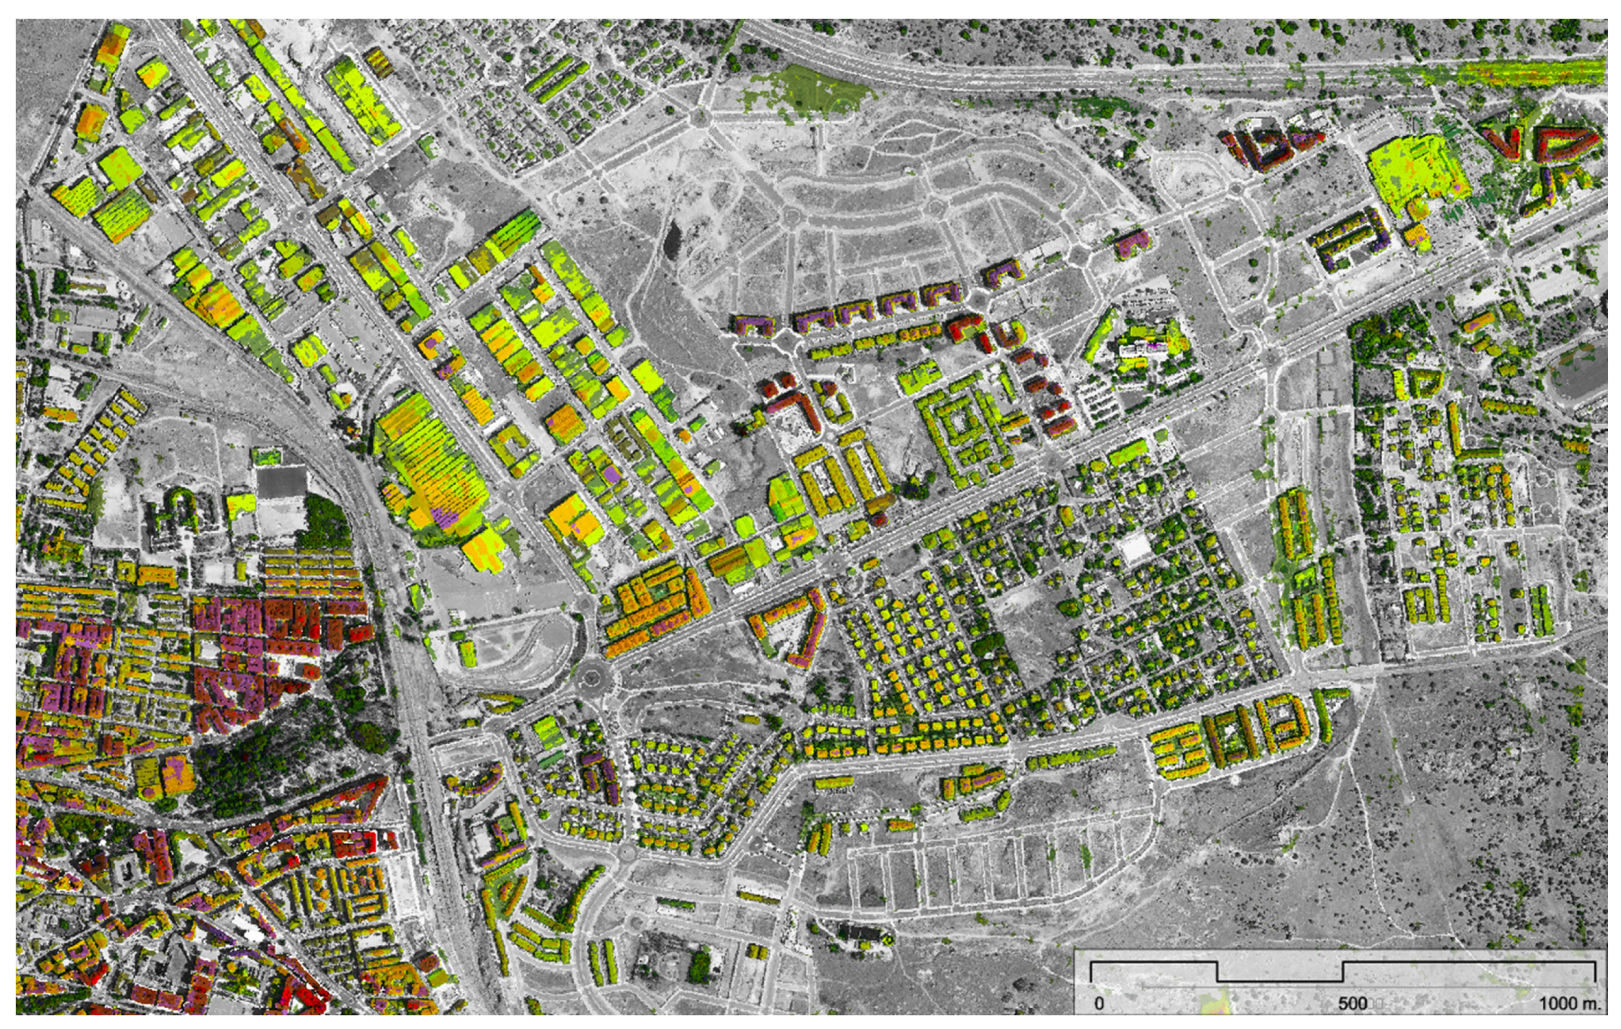
4.2. Urban Growth Analysis
5. Conclusions
Author Contributions
Funding
Acknowledgments
Conflicts of Interest
References
- Noguera, J.E. La Ordenación Urbanística: Conceptos, Instrumentos Y Prácticas; Iniciativa Digital Politècnica, Universitat Politècnica de Catalunya: Catalonia, Spain, 2011. [Google Scholar]
- Deng, W.; Peng, Z.; Tang, Y.T. A quick assessment method to evaluate sustainability of urban built environment: Case studies of four large-sized Chinese cities. Cities 2019, 89, 57–69. [Google Scholar] [CrossRef]
- El-Hallaq, M.A.; Alastal, A.I.; Salha, R.A. Enhancing Sustainable Development through Web Based 3D Smart City Model Using GIS and BIM. Case Study: Sheikh Hamad City. J. Geogr. Inf. Syst. 2019, 11, 321–330. [Google Scholar] [CrossRef][Green Version]
- He, J.; Li, C.; Huang, J.; Liu, D.; Yu, Y. Modeling Urban Spatial Expansion Considering Population Migration Interaction in Ezhou, Central China. J. Urban. Plan. Dev. 2019, 145, 05019003. [Google Scholar] [CrossRef]
- Yang, L.; van Dam, K.H.; Majumdar, A.; Anvari, B.; Ochieng, W.Y.; Zhang, L. Integrated design of transport infrastructure and public spaces considering human behavior: A review of state-of-the-art methods and tools. Front. Archit. Res. 2019, 8, 429–435. [Google Scholar] [CrossRef]
- Aldieri, L.; Grafström, J.; Sundström, K.; Vinci, C.P. Wind Power and Job Creation. Sustainability 2020, 12, 45. [Google Scholar] [CrossRef]
- Burger, M.; Meijers, E. Form Follows Function? Linking Morphological and Functional Polycentricity. Urban. Stud. 2012, 49, 1127–1149. [Google Scholar] [CrossRef]
- Yue, W.; Qiu, S.; Xu, H.; Xu, L.; Zhang, L. Polycentric urban development and urban thermal environment: A case of Hangzhou, China. Landsc. Urban Plan. 2019, 189, 58–70. [Google Scholar] [CrossRef]
- Granqvist, K.; Sarjamo, S.; Mäntysalo, R. Polycentricity as spatial imaginary: The case of Helsinki City Plan. Eur. Plan. Stud. 2019, 27, 739–758. [Google Scholar] [CrossRef]
- Yu, L.; Yu, T.; Wu, Y.; Wu, G. Rethinking the Identification of Urban Centers from the Perspective of Function Distribution: A Framework Based on Point-of-Interest Data. Sustainability 2019, 11, 5663. [Google Scholar] [CrossRef]
- Jiménez Ariza, S.L.; Martínez, J.A.; Muñoz, A.F.; Quijano, J.P.; Rodríguez, J.P.; Camacho, L.A.; Díaz-Granados, M. A multicriteria planning framework to locate and select Sustainable Urban Drainage Systems (SUDS) in consolidated urban areas. Sustainability 2019, 11, 2312. [Google Scholar] [CrossRef]
- Xu, M.; He, C.; Liu, Z.; Dou, Y. How did urban land expand in China between 1992 and 2015? A multi-scale landscape analysis. PLoS ONE 2016, 11, 1–19. [Google Scholar] [CrossRef] [PubMed]
- Dennis, M.; Barlow, D.; Cavan, G.; Cook, P.A.; Gilchrist, A.; Handley, J.; Lindley, S. Mapping urban green infrastructure: A novel landscape-based approach to incorporating land use and land cover in the mapping of human-dominated systems. Land 2018, 7, 17. [Google Scholar] [CrossRef]
- Peng, F.; Wong, M.S.; Nichol, J.E.; Chan, P.W. Historical GIS data and changes in urban morphological parameters for the analysis of urban heat islands in Hong Kong. Int. Arch. Photogramm. Remote Sens. Spat. Inf. Sci. 2018, 41, 55–62. [Google Scholar]
- Deng, J.S.; Wang, K.; Hong, Y.; Qi, J.G. Spatio-temporal dynamics and evolution of land use change and landscape pattern in response to rapid urbanization. Landsc. Urban Plan. 2009, 92, 187–198. [Google Scholar] [CrossRef]
- Tucci, M.; Giordano, A.; Ronza, R.W. Using spatial analysis and geovisualization to reveal urban changes: Milan, Italy, 1737–2005. Cartographica 2010, 45, 47–63. [Google Scholar] [CrossRef]
- Patias, P.; Kaimaris, D.; Stylianidis, E. Change Detection in Historical City Centers Using Multi-Source Data: The Case of Historical Center of Nicosia-Cyprus. In Proceedings of the 23rd International CIPA Conference, Prague, Czech Republic; 2011. Available online: https://www.researchgate.net/publication/228448480_Change_Detection_in_Historical_City_Centers_Using_Multi-Source_Data_The_Case_of_Historical_Center_of_Nicosia-Cyprus (accessed on 13 April 2017).
- Kraus, K. Photogrammetry, Volume 1: Fundamentals and Standard Processes; Fred. Dümmlers Verlag, Bonn, Publisher: Bonn, Germany, 1993. [Google Scholar]
- Schindler, K. An overview and comparison of smooth labeling methods for land-cover classification. IEEE Trans. Geosci. Remote Sens. 2012, 50, 4534–4545. [Google Scholar] [CrossRef]
- Barrile, V.; Pozzoli, A.; Bilotta, G.; Fotia, A. Innovative techniques of photogrammetry for 3D modeling. Appl. Geomat. 2019, 11, 353–369. [Google Scholar] [CrossRef]
- González-Aguilera, D.; López-Fernández, L.; Rodriguez-Gonzalvez, P.; Guerrero, D.; Hernandez-Lopez, D.; Remondino, F.; Menna, F.; Nocerino, E.; Toschi, I.; Ballabeni, A.; et al. Development of an all-purpose free photogrammetric tool. Int. Arch. Photogramm. Remote Sens. Spat. Inf. Sci. 2016, 41, 31–38. [Google Scholar] [CrossRef]
- Bitelli, G.; Girelli, V.A.; Marziali, M.; Zanutta, A. Use of Historical Images for the Documentation and the Metrical Study of Cultural Heritage by Means of Digital Photogrammetric Techniques. In Proceedings of the XXI International CIPA Symposium, Athens, Greece, 1–6 October 2007. [Google Scholar]
- Kalisperakis, I.; Rova, M.; Petsa, E.; Karras, G.E. On Multi-image Reconstruction from Historic Photographs. In Proceedings of the XIX CIPA International Symposium Proceedings, Antalya, Turkey, 30 September–4 October 2003; pp. 216–219. [Google Scholar]
- Styliadis, A.D. Historical photography-based computer-aided architectural design: Demolished buildings information modeling with reverse engineering functionality. Autom. Constr. 2008, 18, 51–69. [Google Scholar] [CrossRef]
- Georgoula, O.; Stamnas, A.; Patias, P.; Georgiadis, C.; Fragkoulidou, V. Historical coastal urban landscapes digital documentation and temporal study with 2D/3D modeling functionality: The case of Thessaloniki, Greece. J. Cult. Herit. 2013, 14, 396–402. [Google Scholar] [CrossRef]
- Rodríguez-Gonzálvez, P.; Guerra Campo, Á.; Muñoz-Nieto, Á.L.; Sánchez-Aparicio, L.J.; González-Aguilera, D. Diachronic Reconstruction and Visualization of Lost Cultural Heritage Sites. ISPRS Int. J. Geo-Inf. 2019, 8, 61. [Google Scholar]
- Bitelli, G.; Dellapasqua, M.; Girelli, V.A.; Sbaraglia, S.; Tinia, M.A. Historical photogrammetry and terrestrial laser scanning for the 3D virtual reconstruction of destroyed structures: A case study in Italy. Int. Arch. Photogramm. Remote Sens. Spat. Inf. Sci 2017, 42, 113. [Google Scholar] [CrossRef]
- Adami, A. 4D City Transformations by Time Series of Aerial Images. In 6th International Workshop on 3D Virtual Reconstruction and Visualization of Complex Architectures, 3D-ARCH 2015; Publisher: Twente, The Netherlands, 2015; Volume 40, pp. 339–344. [Google Scholar]
- Nocerino, E.; Menna, F.; Remondino, F. Multi-temporal analysis of landscapes and urban areas. Int. Arch. Photogramm. Remote Sens. Spat. Inf. Sci. 2012, 39, B4. [Google Scholar] [CrossRef]
- Redecker, A.P. Historical aerial photographs and digital photogrammetry for impact analyses on derelict land sites in human settlement areas. Int. Arch. Photogramm. Remote Sens. Spat. Inf. Sci. 2008, 37, 5–10. [Google Scholar]
- Vera, J.A.; Lorenzo, E.; Rodríguez, S.; Sánchez, C.; Blanco, V.; Nafría, D.; Rodríguez., O. El Vuelo Americano de 1956 en la Cuenca del Segura: Proceso de Elaboración de Ortofotografía Digital en Las Zonas de Albacete Y Alicante; Personal communication: Murcia, Spain, 2011. [Google Scholar]
- PNOA. 2016. Available online: http://pnoa.ign.es/ (accessed on 28 March 2020).
- Gonzalez-Aguilera, D.; López-Fernández, L.; Rodriguez-Gonzalvez, P.; Hernandez-Lopez, D.; Guerrero, D.; Remondino, F.; Gaiani, M. GRAPHOS–open-source software for photogrammetric applications. Photogramm. Rec. 2018, 33, 11–29. [Google Scholar] [CrossRef]
- Kim, M.; Chung, M.G. Recursively separated and weighted histogram equalization for brightness preservation and contrast enhancement. IEEE Trans. Consum. Electron. 2008, 54, 1389–1397. [Google Scholar] [CrossRef]
- Gesto-Diaz, M.; Tombari, F.; Gonzalez-Aguilera, D.; Lopez-Fernandez, L.; Rodriguez-Gonzalvez, P. Feature matching evaluation for multimodal correspondence. ISPRS J. Photogramm. Remote Sens. 2017, 129, 179–188. [Google Scholar] [CrossRef]
- Lowe, D.G. Object Recognition from Local Scale-invariant Features. In Proceedings of the seventh IEEE international conference on computer vision; 1999; 2, pp. 1150–1157. Available online: http://www.w3.org/1999/xlink (accessed on 13 April 2017).
- Moisan, L.; Stival, B.A. Probabilistic criterion to detect rigid point matches between two images and estimate the fundamental matrix. Int. J. Comput. Vis. 2004, 57, 201–218. [Google Scholar] [CrossRef]
- Fischler, M.A.; Bolles, R.C. Random sample consensus: A paradigm for model fitting with applications to image analysis and automated cartography. Commun. ACM 1981, 24, 381–395. [Google Scholar] [CrossRef]
- Deseilligny, M.P.; Clery, I. Apero, an open source bundle adjustment software for automatic calibration and orientation of set of images. Int. Arch. Photogramm. Remote Sens. Spat. Inf. Sci. 2011, XXXVIII-5/W16, 269–276. [Google Scholar] [CrossRef]
- Hartley, R.; Zisserman, A. Multiple View Geometry in Computer Vision; Cambridge University Press: Cambridge, UK, 2003. [Google Scholar]
- González-Aguilera, D.; Rodríguez-Gonzálvez, P.; Gómez-Lahoz, J. An automatic procedure for co-registration of terrestrial laser scanners and digital cameras. Isprs J. Photogramm. Remote Sens. 2009, 64, 308–316. [Google Scholar] [CrossRef]
- Hirschmuller, H. Accurate and Efficient Stereo Processing by Semi-global Matching and Mutual Information. In Proceedings of the 2005 IEEE Computer Society Conference on Computer Vision and Pattern Recognition (CVPR’05), San Diego, CA, USA, 20–25 June 2005; Volume 2, pp. 807–814. [Google Scholar]
- Pierrot-Deseilligny, M.; Rupnik, E.; Girod, L.; Belvaux, J.; Maillet, G.; Deveau, M.; Choqueux, G. MicMac, Apero, Pastis and Other Beverages in a Nutshell. ENSG Ecole Nationale des Sciences Géographiques: Champs-Sur-Marne, France; IGN: San Francisco, CA, USA, 2015. [Google Scholar]
- Furukawa, Y.; Ponce, J. Accurate, dense, and robust multiview stereopsis. Ieee Trans. Pattern Anal. Mach. Intell. 2009, 32, 1362–1376. [Google Scholar] [CrossRef] [PubMed]
- Luhmann, T.; Robson, S.; Kyle, S.; Hartley, I. Close Range Photogrammetry: Principles, Techniques and Applications; Whittles: Dunbeath, UK, 2007. [Google Scholar]
- Kazhdan, M.; Bolitho, M.; Hoppe, H. Poisson Surface Reconstruction. In Proceedings of the Fourth Eurographics Symposium on Geometry Processing; Publisher: Geneve, Switzerland, 2006; pp. 61–71. [Google Scholar]
- Rodríguez-Gonzálvez, P.; Nocerino, E.; Menna, F.; Minto, S.; Remondino, F. 3D surveying & modeling of underground passages in WWI fortifications. Int. Arch. Photogramm. Remote Sens. Spat. Inf. Sci. 2015, 40, 17. [Google Scholar]
- Rodríguez-Gonzálvez, P.; Garcia-Gago, J.; Gomez-Lahoz, J.; González-Aguilera, D. Confronting passive and active sensors with non-Gaussian statistics. Sensors 2014, 14, 13759–13777. [Google Scholar] [CrossRef]
- Höhle, J. The assessment of the absolute planimetric accuracy of airborne lasers canning. Int. Arch. Photogramm. Remote Sens. Spat. Inf. Sci. 2011, XXXVIII-5/W12, 145–150. [Google Scholar]
- Das, K.R.; Imon, A.H.M.R. A brief review of tests for normality. Am. J. Theor. Appl. Stat. 2016, 5, 5–12. [Google Scholar]
- Nocerino, E.; Menna, F.; Remondino, F.; Toschi, I.; Rodríguez-Gonzálvez, P. Investigation of Indoor and Outdoor Performance of Two Portable Mobile Mapping Systems. In Videometrics, Range Imaging, and Applications XIV; International Society for Optics and Photonics: Munich, Germany, 2017; p. 10332. [Google Scholar]
- Alvarez, J.A.P.; Herrera, V.M.; del Pozo, J.A.M.; de Tena, M.T. Multi-temporal archaeological analyses of alluvial landscapes using the photogrammetric restitution of historical flights: A case study of Medellin (Badajoz, Spain). Archaeol. Sci. 2013, 40, 349–364. [Google Scholar] [CrossRef]
- Pinto, A.T.; Gonçalves, J.A.; Beja, P.; Pradinho Honrado, J. From archived historical aerial imagery to informative orthophotos: A framework for retrieving the past in long-term socioecological research. Remote Sens. 2019, 11, 1388. [Google Scholar] [CrossRef]


| American Flight (1956–57) | PNOA Flight (2017) | |
|---|---|---|
| Number of images | 3 | 21 |
| Camera | Fairchild T-11 | VEXCEL-Ultracam-XP |
| Image format | 22.8 cm × 22.8 cm | 10.4 × 68.4 mm17310 × 11310 pixels |
| Pixel size | 21 microns | 6 microns |
| Focal length | 153.55 mm | 100.5 mm |
| Spectral resolution | 1 channel (grayscale) | 4 channels (RGB & NIR) |
| Radiometric resolution | 8 bits | 12 bits |
| Approximate scale | 1:33,000 | 1:25,000 |
| Approximate GSD | 0.60 m | 0.25 m |
| Flight height | 5,500 m | 3,780 m |
| Nº of Images | Nº Keypoints | 3D Point Cloud | Covered Area | |
|---|---|---|---|---|
| PNOA (2017) | 21 | 2,448,413 | 66,956,900 | 44.6 km2 |
| American flight (1956) | 3 | 110,130 | 7,166,366 | 21.5 km2 |
| Gaussian Estimation (m) | Robust Estimation (m) | ||||||||
|---|---|---|---|---|---|---|---|---|---|
| Number | X | Y | Z | 3D | X | Y | Z | 3D | |
| Control points | 16 | 0.00 ± 0.15 | 0.00 ± 0.09 | 0.00 ± 0.14 | 0.19 | 0.01 ± 0.10 | 0.01 ± 0.09 | -0.01 ± 0.14 | 0.16 |
| Check points | 25 | 0.00 ± 0.21 | 0.09 ± 0.13 | -0.05 ± 0.22 | 0.27 | 0.04 ± 0.14 | 0.09 ± 0.11 | -0.05 ± 0.20 | 0.20 |
| Gaussian Estimation (m) | Robust Estimation (m) | ||||||||
|---|---|---|---|---|---|---|---|---|---|
| Number | X | Y | Z | 3D | X | Y | Z | 3D | |
| Control points | 10 | 0.01 ± 0.47 | -0.04 ± 0.53 | -0.07 ± 0.62 | 0.85 | -0.13 ± 0.48 | -0.04 ± 0.53 | -0.20 ± 0.61 | 0.81 |
| Check points | 26 | 0.81 ± 1.79 | -0.31 ± 1.82 | -0.61 ± 2.02 | 3.15 | 0.75 ± 1.71 | -0.47 ± 1.74 | -0.70 ± 2.02 | 2.87 |
| MAD | NMAD | IPR 90 | |
|---|---|---|---|
| Control points | ±0.311 | ±0.461 | 0.856 |
| Check points | ±0.908 | ±1.345 | 4.507 |
© 2020 by the authors. Licensee MDPI, Basel, Switzerland. This article is an open access article distributed under the terms and conditions of the Creative Commons Attribution (CC BY) license (http://creativecommons.org/licenses/by/4.0/).
Share and Cite
Picon-Cabrera, I.; Garcia-Gago, J.M.; Sanchez-Aparicio, L.J.; Rodriguez-Gonzalvez, P.; Gonzalez-Aguilera, D. On the Use of Historical Flights for the Urban Growth Analysis of Cities Through Time: The Case Study of Avila (Spain). Sustainability 2020, 12, 4673. https://doi.org/10.3390/su12114673
Picon-Cabrera I, Garcia-Gago JM, Sanchez-Aparicio LJ, Rodriguez-Gonzalvez P, Gonzalez-Aguilera D. On the Use of Historical Flights for the Urban Growth Analysis of Cities Through Time: The Case Study of Avila (Spain). Sustainability. 2020; 12(11):4673. https://doi.org/10.3390/su12114673
Chicago/Turabian StylePicon-Cabrera, Inmaculada, Jesus Maria Garcia-Gago, Luis Javier Sanchez-Aparicio, Pablo Rodriguez-Gonzalvez, and Diego Gonzalez-Aguilera. 2020. "On the Use of Historical Flights for the Urban Growth Analysis of Cities Through Time: The Case Study of Avila (Spain)" Sustainability 12, no. 11: 4673. https://doi.org/10.3390/su12114673
APA StylePicon-Cabrera, I., Garcia-Gago, J. M., Sanchez-Aparicio, L. J., Rodriguez-Gonzalvez, P., & Gonzalez-Aguilera, D. (2020). On the Use of Historical Flights for the Urban Growth Analysis of Cities Through Time: The Case Study of Avila (Spain). Sustainability, 12(11), 4673. https://doi.org/10.3390/su12114673