Article

Cumulative Environmental Impacts in the Gwich’in Cultural Landscape

1
School of Environmental Studies, University of Victoria, Victoria, BC V8W 2Y2, Canada
2
Fort McPherson, NT X0E 0J0, Canada
*
Author to whom correspondence should be addressed.
Sustainability 2020, 12(11), 4667; https://doi.org/10.3390/su12114667
Submission received: 3 April 2020 / Revised: 21 May 2020 / Accepted: 27 May 2020 / Published: 8 June 2020

Abstract

:
Environmental changes are impacting northern environments and human communities. Cumulative impact assessments are vital to understanding the combined effects of regional industrial developments and natural disturbances that affect humans and ecosystems. A gap in cumulative impacts literature includes methods to evaluate impacts in cultural landscapes. In this study, we utilized spatial overlay analysis to assess cumulative environmental impacts in the cultural landscape of northern Canada’s Gwich’in Settlement Region. In three analyses, we quantified and mapped: (1) Cultural feature density, (2) cumulative environmental disturbance, and (3) potential overlap between disturbances and cultural features. Our first analysis depicts the extent and pattern of cultural relationships with regional landscapes and illustrates the Gwich’in cultural landscape, with widespread harvesting trails, named places, traditional use areas, and archaeological sites found in highest densities near important waterways. Our second analysis suggests that spatial overlay can track multiple disturbances, illustrating diffuse, lower intensity cumulative environmental impacts. The final analysis shows that overlaying disturbance and cultural feature data provides a novel way to investigate cumulative impacts in a cultural landscape, indicating relatively low levels of potential overlap between Gwich’in cultural features and disturbances. These methods provide one way to investigate cumulative impacts, relevant for well- documented cultural landscapes.

1. Introduction

The combined effects of intensified natural and anthropogenic disturbances are altering the structure and function of global ecosystems [1,2], with the potential to significantly impact the land-based livelihoods of many Indigenous groups [3,4]. In the Arctic, where the climate is warming more rapidly than anywhere else on Earth [5] and industrial development is expanding [6,7], changes to local livelihoods may be particularly severe [8,9]. Alongside the impacts of climate change to permafrost, vegetation, and hydrological conditions [10,11,12], northern regions are experiencing development projects like oil and gas exploration and extraction, mining, and road construction [13,14,15].
Incremental, compounding disturbances that can cause landscape and ecosystem change are often defined as cumulative impacts [16,17]. Over the past few decades, considerable effort has been devoted to assessing the cumulative impacts of natural and anthropogenic disturbances through studies examining existing or potential impacts of a specific development project [18,19], or the broader scale impacts of multiple stressors on regional ecosystems [1,20]. Accounting for cumulative environmental impacts is important because they can severely impair water quality, terrain stability, and animal habitat, and interact in unexpected ways [21,22,23,24].
Cumulative impacts can also affect culturally significant landscape features. Indigenous cultures across the circumpolar north rely on foods harvested from the land, and maintain strong connections with local landscapes through cultural features [25,26]. In northern ecosystems, cultural features and activities are so widespread that most regions are best described as cultural landscapes [27,28]. In this paper, we define cultural features as tangible and intangible landscape features that are important for subsistence harvesting (i.e., hunting, trapping, fishing, gathering) and well-being, and/or that are culturally important for land management and political, spiritual, religious, or educational reasons.
Since the early 1990s, there have been repeated calls for environmental assessments and cumulative impact studies that include impacts to the land use, livelihoods, and cultural traditions of Indigenous peoples [29]. Despite multiple studies pointing to this gap and calling for the increased inclusion and recognition of cultural values and subsistence resources in cumulative impact assessments [27,30,31,32], most cumulative impacts research has focused primarily on ecological changes following disturbance (i.e., [1,17,33]). Some studies have worked to address these gaps through collaborative approaches and methods that recognize cultural locations as valued ecosystem components [20,28,30]. Despite these efforts, there are few quantitative, data-driven, regional analyses examining cumulative impacts affecting a variety of cultural features alongside ecological landscape components [20,34].
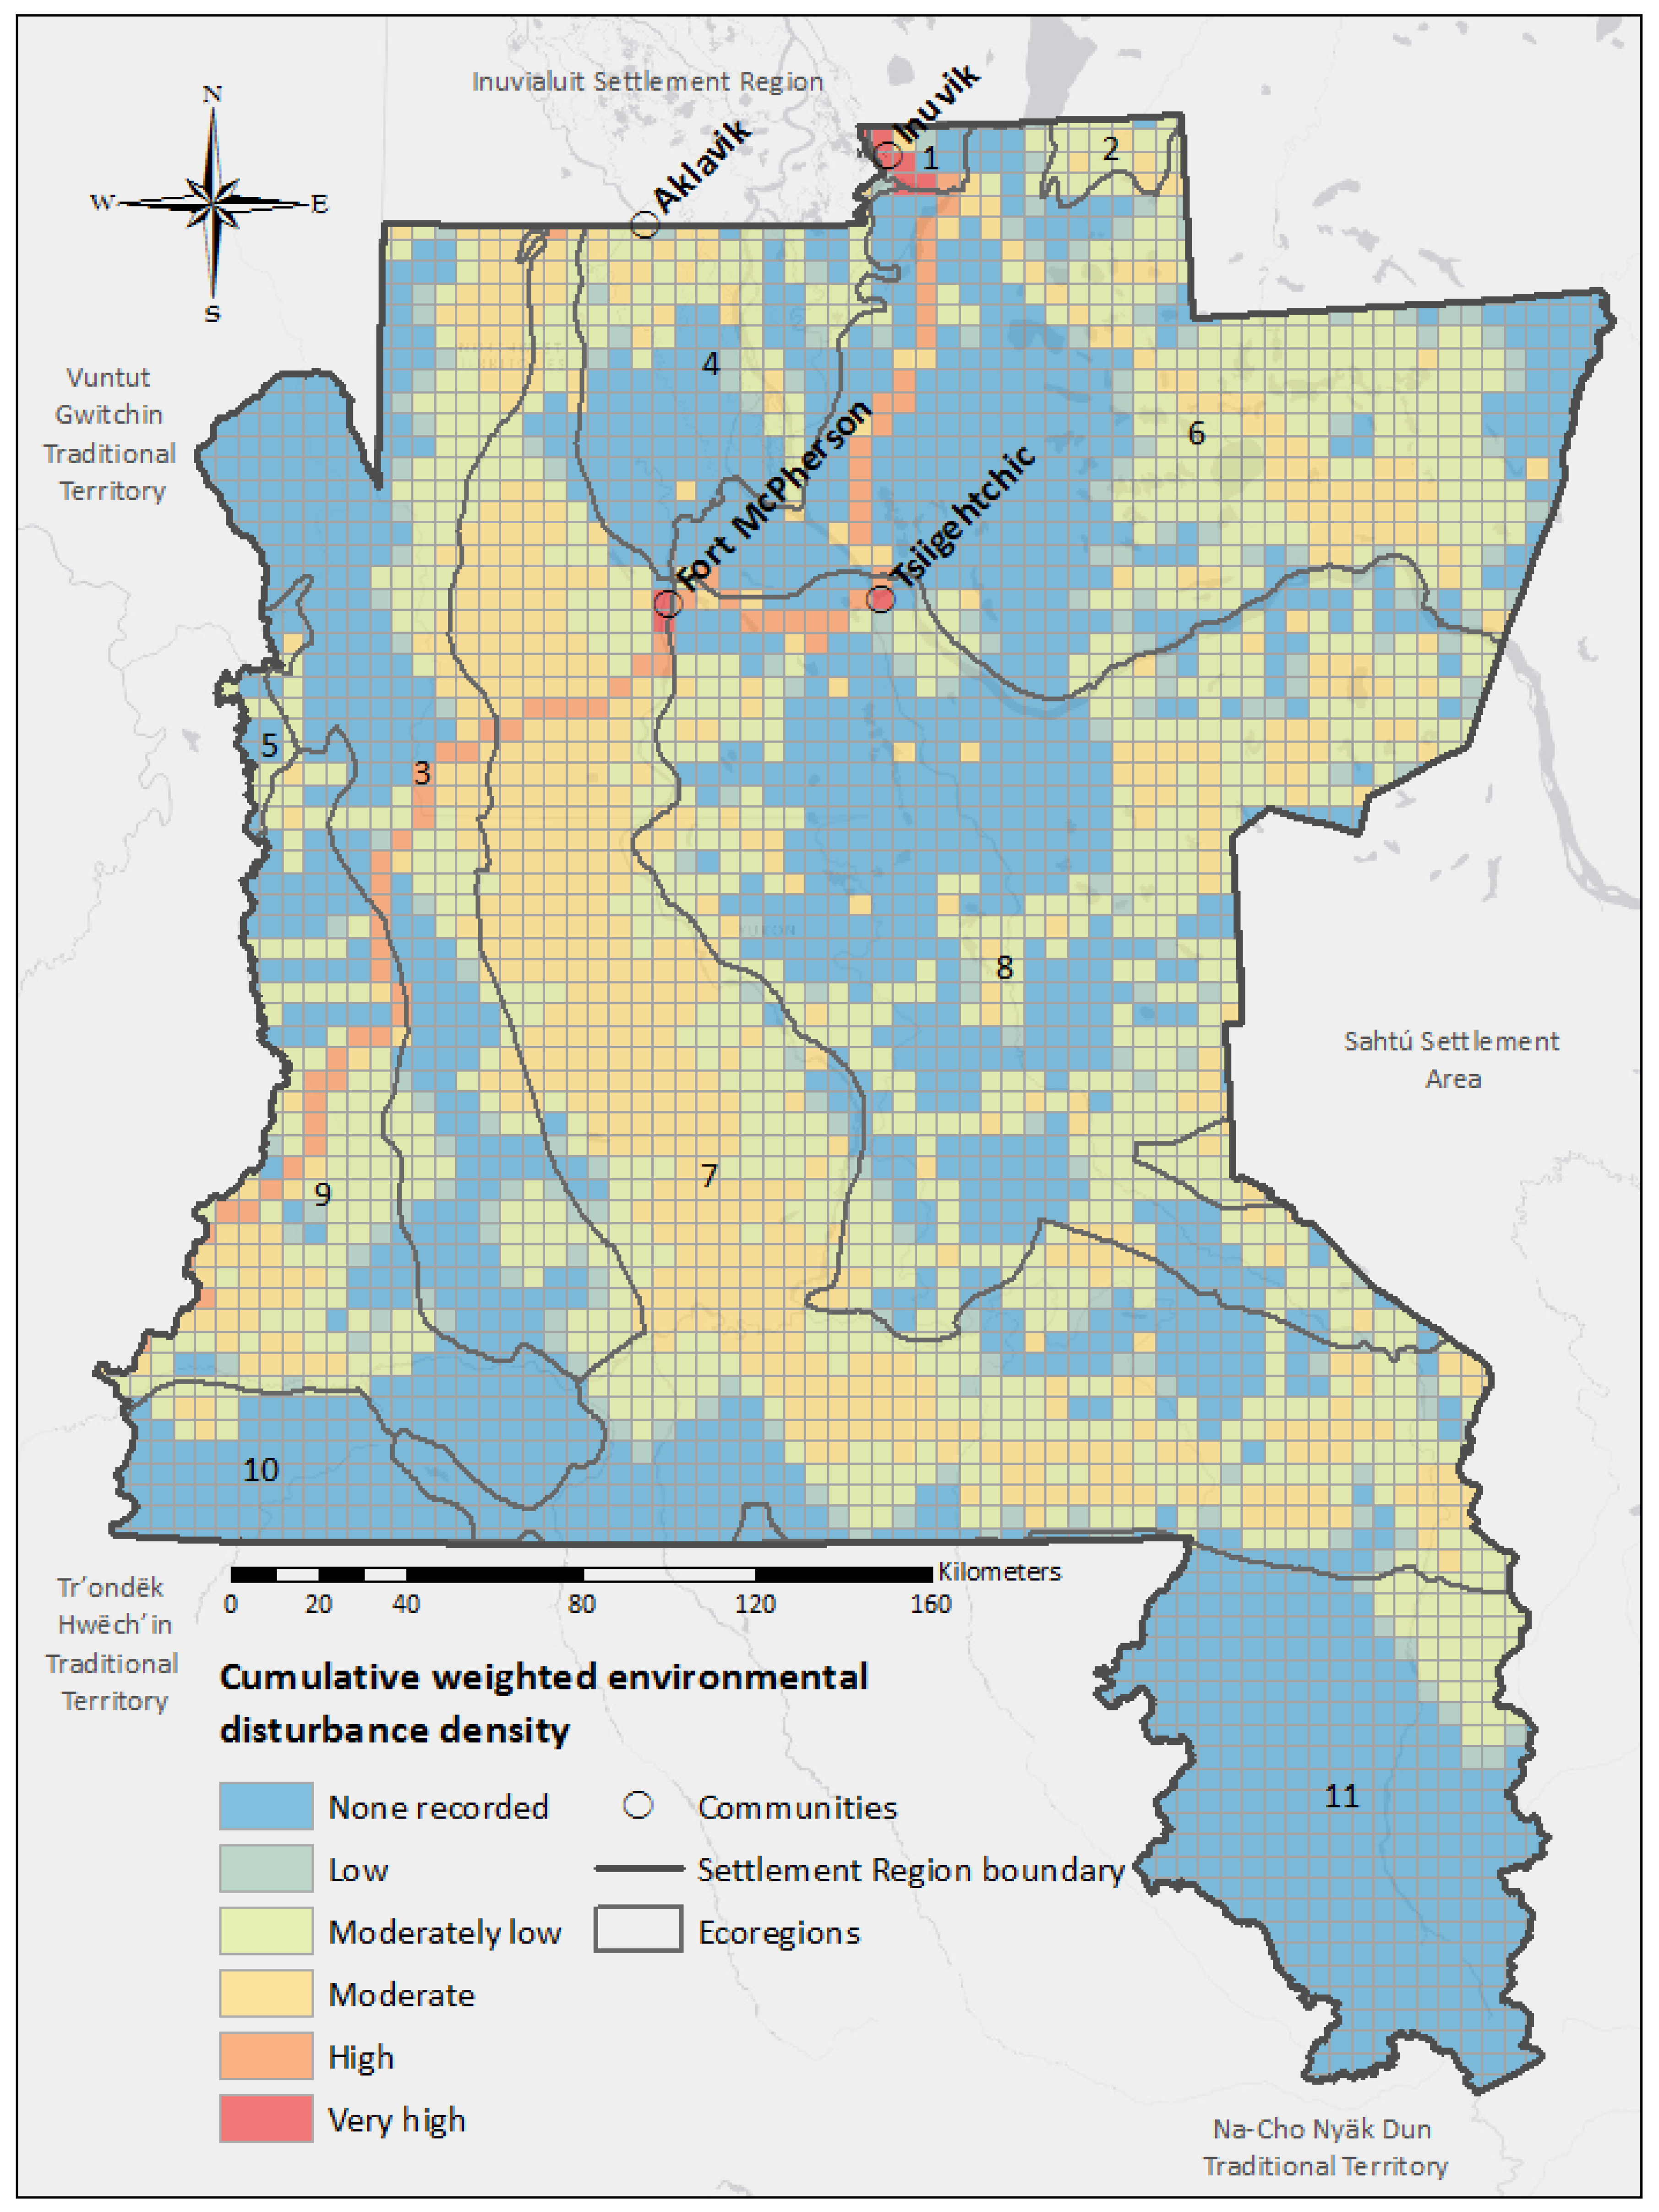
In this study, we explore the potential of spatial overlay analysis to quantify and map the potential overlap between environmental disturbances and cultural features in the Gwich’in Settlement Region (GSR). Areas of overlap identify places where cumulative impacts may damage, destroy, or alter cultural features, and impact cultural practices like subsistence harvesting and travel. Our analysis provides a snapshot of regional cumulative environmental impacts occurring in the Gwich’in Settlement Region, and details a planning tool that can be used by cultural and natural resource managers in the midst of rapid, regional changes.

Gwich’in Territory

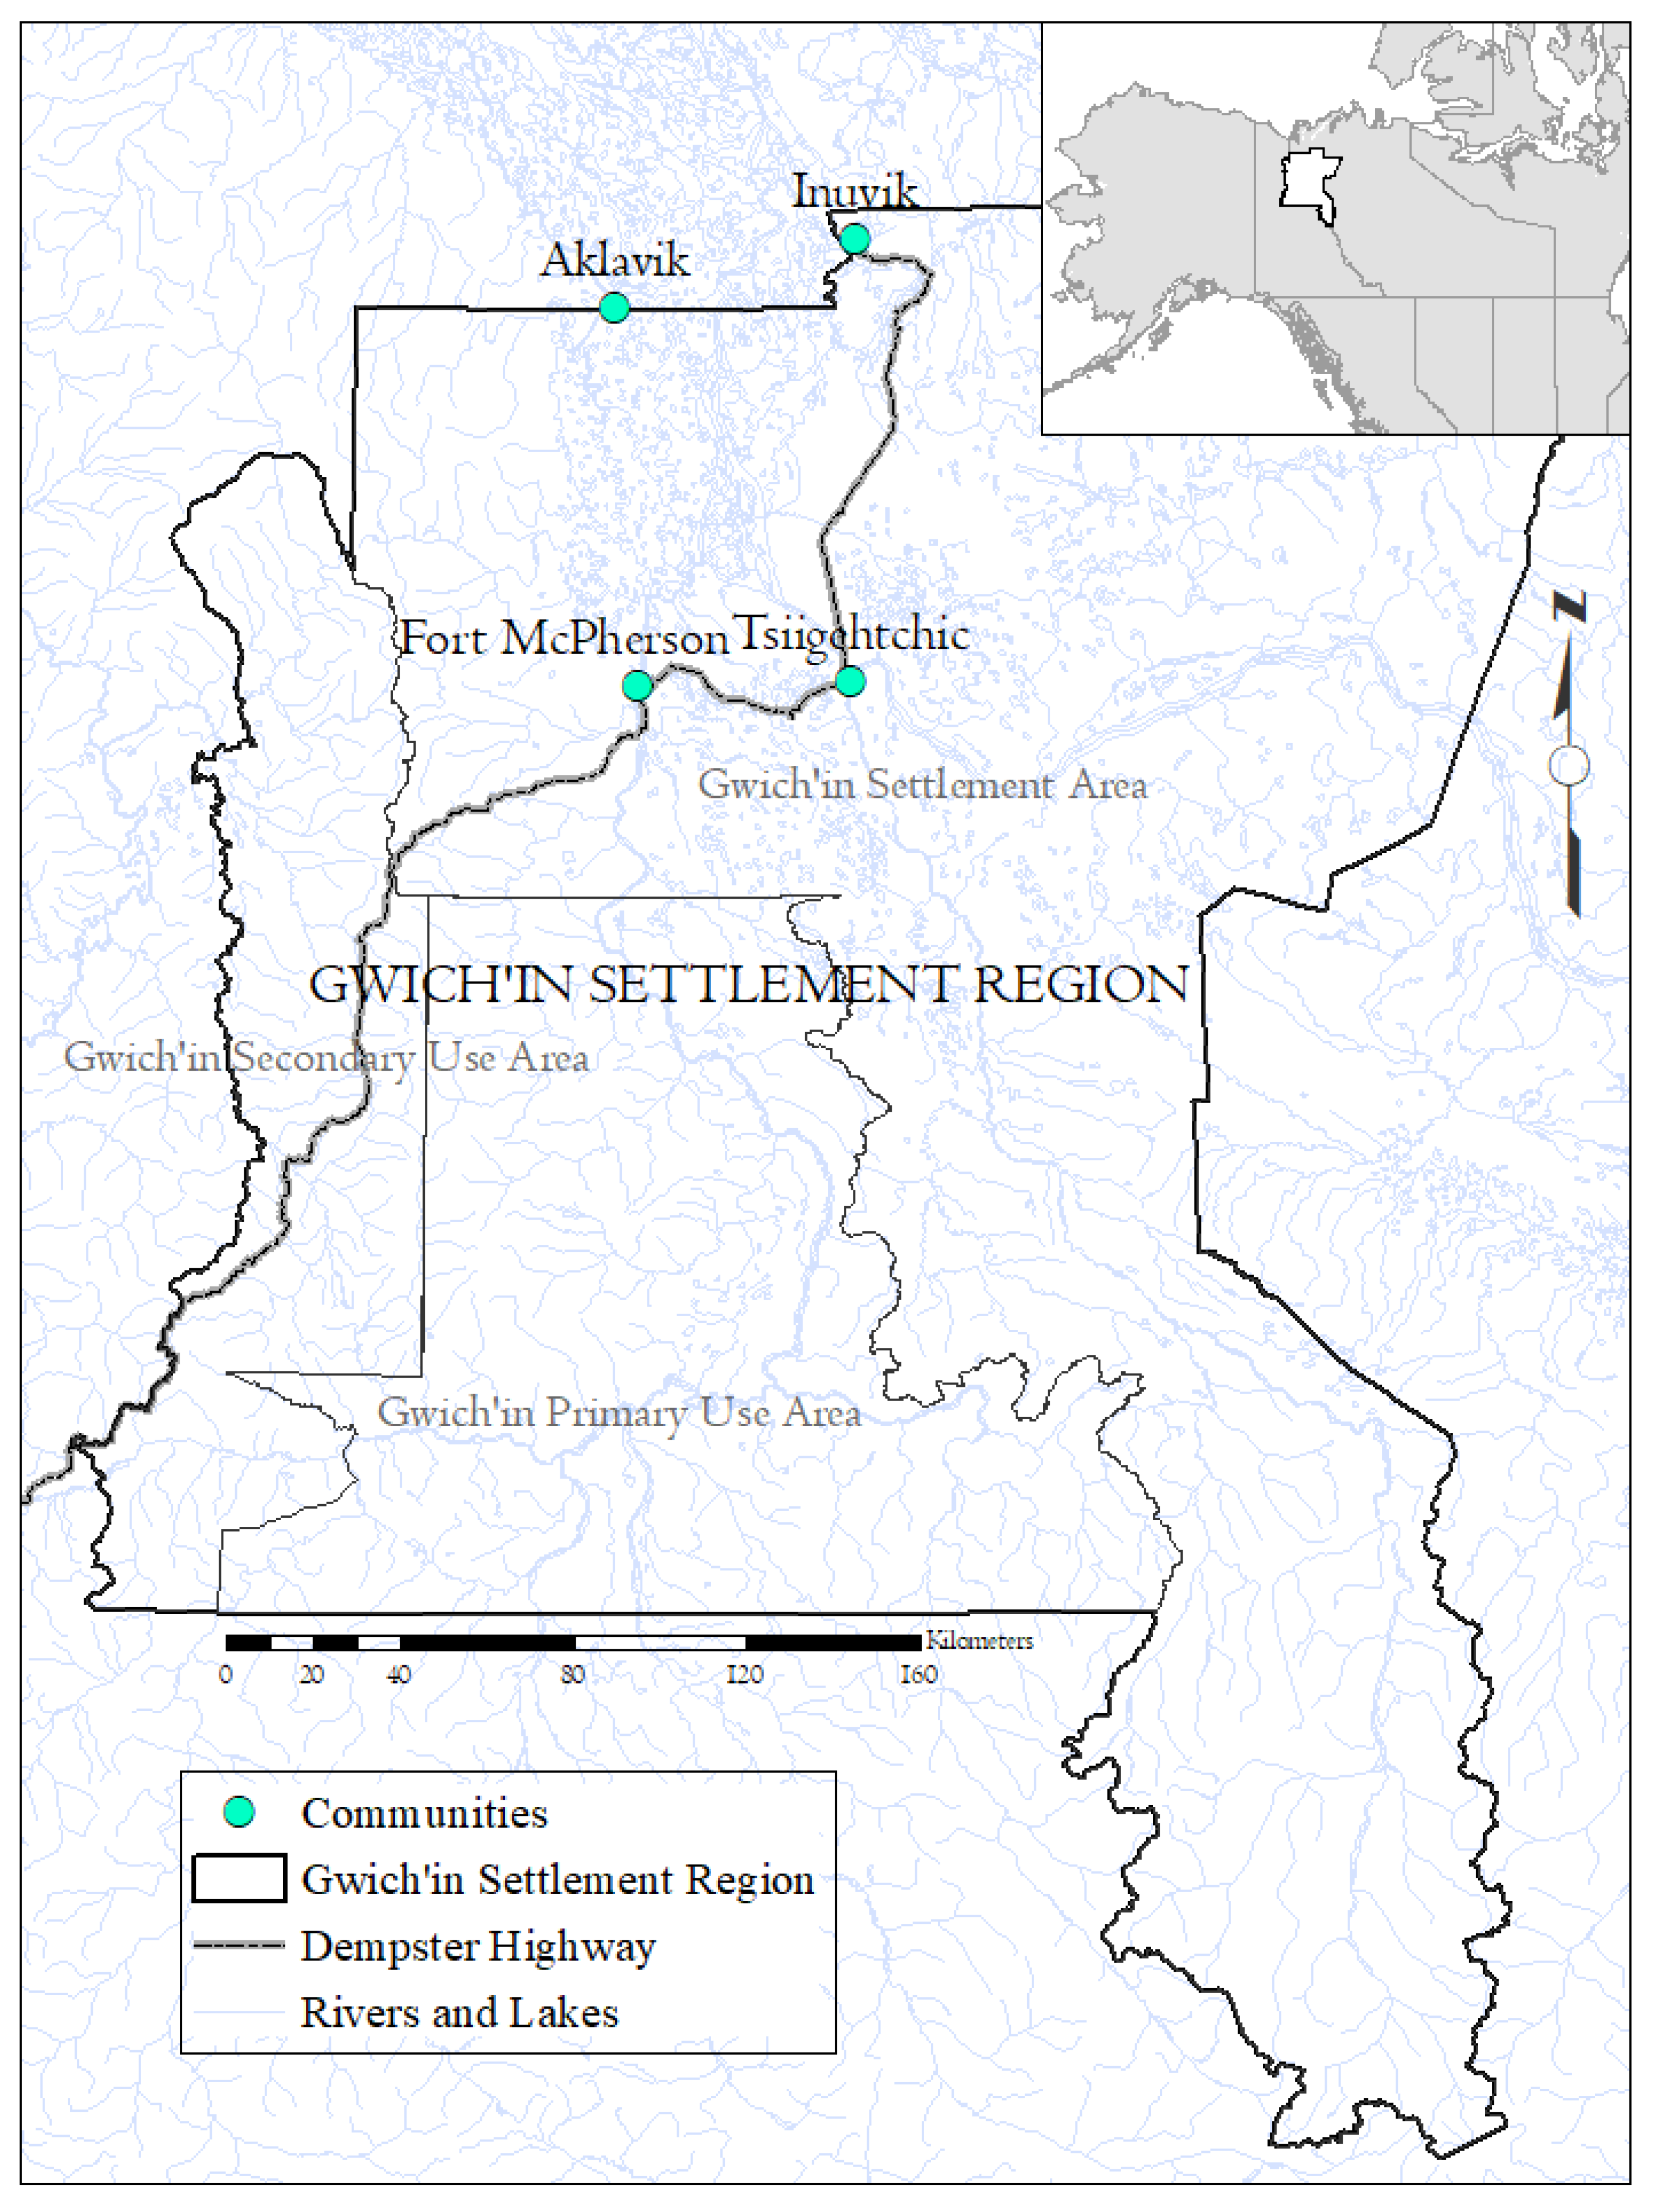
Our study area is the Gwich’in Settlement Region, the portion of Gwich’in First Nation territory that is located in the northwestern Northwest Territories and the eastern reaches of Yukon Territory, Canada. This 90,379 km2 area is divided into three sub-regions: The 56,935 km2 Gwich’in Settlement Area (GSA) in the Northwest Territories, and the 21,988 km2 Primary Use Area and 11,456 km2 Secondary Use Area in Yukon Territory (Figure 1) [35]. The Primary and Secondary Use Areas overlap with the traditional territories of the Tr’ondëk Hwëch’in, Vuntut Gwitchin, and Na-Cho Nyäk Dun First Nations [35]. The four Gwich’in cultural groups in the GSR include the Ehdiitat Gwich’in of Aklavik, the Nihtat Gwich’in in Inuvik, the Teetł’it Gwich’in of Teetł’it Zheh/Fort McPherson, and the Gwichya Gwich’in in Tsiigehtchic [35].
Physically, this interior subarctic area lies near the tree line, hosting forest, woodland, upland tundra, and barren alpine areas, alongside thousands of rivers, lakes, and wetlands [36]. The ecosystems in the GSR support diverse plant and animal communities [37], and are interconnected by river systems including the Mackenzie (Nagwichoonjik), Peel (Teetł’it Gwinjik), and Arctic Red (Tsiigehnjik). The Gwich’in travel by land and water throughout these territories, maintaining traditions of fishing, hunting, trapping, and gathering food and medicines from the land [37,38]. The land and water are vital to Gwich’in culture, and individual and community well-being [37,39]. Connections between people and place in Gwich’in territory have been well documented by mapping projects such as the Dene Mapping Project [40] and numerous initiatives led by the Gwich’in Tribal Council Department of Cultural Heritage (i.e., [41]).

2. Materials and Methods

This research explored the potential of regional scale spatial overlay analysis to assess the cumulative impacts of environmental disturbances in the Gwich’in Settlement Region. To accomplish this, we conducted three spatial overlay analyses using ArcGIS software (version 10.3.1). We quantified and mapped: (a) The density of four categories of cultural features, (b) the magnitude of cumulative impacts from seven types of environmental disturbances, and (c) the potential overlap between cultural features and environmental disturbances. Cultural features and cumulative impacts were quantified by dividing the GSR into a grid of 3810 planning units (PUs) (Figure 2). The majority of PUs were 25 km2 in size, but a number of smaller PUs were located along the edges of the study area. We chose the PU size of 25 km2 to be consistent with past analyses [20], and to display our data at a scale conducive to visualization.
Community consultation was also key to this project. This consultation included collaboration with regional organizations, community meetings to share results, and interviews with four regional cultural heritage experts (a mix of Gwich’in and non-Gwich’in professionals) who provided key guidance about this project, such as the appropriate representation of cultural features [42]. Interview participants provided their informed consent before each interview, and the research was conducted with ethical approval from the University of Victoria’s Human Research Ethics Board (Protocol Number 17-194) and in accordance with a Traditional Knowledge Research Agreement with the Gwich’in Tribal Council Department of Cultural Heritage. We were also fortunate to have staff members of the Gwich’in Land Use Planning Board and Gwich’in Renewable Resources Board review this manuscript.

2.1. Documented Cultural Feature Density

To quantify the density and distribution of cultural features in the GSR, we created an index of cultural feature intensity (CFI) (Figure 3). This index is based on the assumption that the density of tangible and intangible cultural features can be used as an indicator of the intensity of cultural use in a given landscape unit. Data on four categories of cultural features (historic harvesting trails, named places, traditional land use areas, and archaeological sites) were obtained from several sources (Table 1).
To ensure that point, polygon, and polyline data had a similar influence on the CFI, we used the procedures outlined below. Each cultural feature mapped as a point in a PU received a score of 1. The cultural feature intensity of polygon data was calculated by dividing the total area of polygon within each PU by the area of the PU that the polygon was located within. The cultural feature intensity for polyline data was determined by dividing the total length of polylines within each PU by the length of one side of a PU (5000 m). Despite a lack of recorded cultural features within some PUs, we assumed that all PUs had a baseline of cultural activity, evidenced by oral and written history that describes the importance of the entire landscape for Gwich’in cultural use [28,37,48]. To reflect this baseline of cultural activity, we set the minimum value of the CFI in each PU to 1 by adding 1 to the CFI in each PU. We then scaled the CFI values from 0–100, to have the same scale as the environmental disturbance scores. To determine the total CFI in each PU, the scores from each category of cultural feature were summed within each PU (Figure 3).
To visualize the distribution and density of cultural features, we mapped the CFI in each PU of the GSR grid. We then grouped PUs into five classes (light, moderate, high, very high, and extreme) based on their CFI, using the ArcGIS geometric interval classification [49] (see Figure 4). We used the geometric interval classification because it is designed to represent continuous data [49]. We named the lowest CFI class of PUs “light” instead of “low” or “very low” because we feel that this terminology better represents the baseline of cultural activity in the GSR.

2.2. Cumulative Weighted Environmental Disturbance

The cumulative impact of disturbances on the terrestrial environment in the GSR was estimated by compiling spatial data on seven types of environmental disturbance. Most of these disturbances are the direct result of anthropogenic activity, but one disturbance (retrogressive thaw slumps) is a form of permafrost degradation that is intensifying in response to climate change [50,51].
Environmental disturbance data were acquired from various sources (Table 2). The spatial distribution of these disturbances is displayed in Figure S1. Drilling mud sumps (pits holding buried drilling fluids and waste from mining exploration) were represented as point data. The area of sumps in each PU was estimated by multiplying the number of sumps by the average area of sumps (2.2 ha) estimated using aerial imagery of the Inuvialuit Settlement Region [20,52]. Polyline data on seismic cut lines (right of ways cut to conduct seismic testing for oil and gas exploration) were buffered to create polygons extending 3.5 m on each side of the line, based on the average width of seismic lines in the Inuvialuit Settlement Region [20,52]. Polyline data for the Dempster Highway right of way were buffered 10m on each side to represent the average width of the highway. Community infrastructure in Aklavik, Fort McPherson, Inuvik, and Tsiigehtchic was represented by polygon data. Gravel quarries were represented as polygon data in the Northwest Territories, and point data in Yukon Territory. The spatial extent of Yukon quarries was estimated using the average size of quarries in the Northwest Territories (7.2 ha). Data on the right of way for the Mackenzie Valley Fibre Link (MVFL) (a fiber-optic cable running through the Mackenzie Valley) were buffered by 3 m per side to reflect the area of land cleared [53,54]. The area of retrogressive thaw slumps per PU was estimated using a map of slump density across northwestern Canada [50]. In this dataset, the density of slumps is represented categorically (low (1–5), medium (6–14), or high (≥15)) across a grid of 225 km2 cells [55]. Following Tyson et al. (2016) [20], we assumed that low density cells contained 3 slumps, medium density contained 10, and high density contained 20. We estimated the average area of slumps within each 225 km2 cell by multiplying the average number of slumps per cell by the average slump area (3.02 ha) reported by Segal et al. (2016) [55]. We then intersected the 225 km2 cells with our grid to calculate the average area of slump within each 25 km2 PU.
To quantify the impacts of these disturbances, we calculated a disturbance score for each PU that was based on disturbance weights that integrated estimates of disturbance severity, recovery, and area (Table 2). Although there is no unilateral approach to weighted analyses, they can be utilized in cumulative impacts research to account for differing effects and magnitudes of disturbance [20,77]. In our analysis, we used the weighting approach outlined by Tyson et al. (2016) [20], where disturbance weights were obtained by multiplying a severity score by a recovery score for each disturbance type. Severity scores characterize a disturbance’s impact on vegetation structure, soils, and ground temperature, and range from 1 (minimal ecological alteration) to 10 (complete land transformation). Ecosystem recovery scores range from 0 to 1, and denote the length of time a disturbance is likely to persist on the land. Disturbances persisting for more than 50 years received a score of 1 (i.e., community infrastructure), whereas disturbances that were likely to experience significant recovery of vegetation structure and ecological processes within 50 years received a score ranging from 0.1 to 0.9 (i.e., seismic lines) [20]. Disturbance weights range from 1.2 (lower severity and faster recovery, i.e., seismic lines) to 10 (higher severity and limited recovery, i.e., community infrastructure). With the exception of the fiber-optic cable and gravel quarries, we used the weights created for the Inuvialuit Settlement Region by Tyson et al. (2016) [20].
Following Tyson et al. (2016) [20], we used the disturbance weights to calculate and map a disturbance score in each PU. This was achieved by summing the weighted areas of each disturbance (the percentage of PU affected by each disturbance, multiplied by the disturbance weight) using the following formula:
Disturbance   Score = D i s t = 1 n ( D i s t u r b a n c e   A r e a P l a n n i n g   U n i t   A r e a 100 )   D i s t u r b a n c e   W e i g h t
The resultant disturbance scores were then scaled between 0 and 100, so they had the same scale as the cultural feature intensity. After these scaled disturbance scores were calculated in each PU, we used the ArcGIS geometric interval classification to group PUs into six ranges (none recorded, low, moderately low, moderate, high, and very high) based on their cumulative weighted disturbance density (see Figure 5). We labeled the PUs with lower disturbance densities as “low” and “moderately low” instead of “very low” and “low” to avoid mislabeling PUs which might contain disturbances not included in our analysis that are causing ecological impacts.

2.3. Potential Overlap between Cultural Features and Disturbances

To quantify and map areas of overlap and potential impact between environmental disturbances and cultural features, we multiplied the scaled cultural feature intensity by the scaled disturbance score in each PU. Throughout this paper, we refer to these values as overlap scores. Overlap scores are a relative measure of overlap between disturbances and culturally significant landscape features, and can be used to identify areas where disturbances may alter, damage, or destroy ecological and cultural features. Overlap scores were classified into six categories (baseline—none recorded, low, moderately low, moderate, high, and very high) using the ArcGIS geometric interval classification scheme (see Figure 6). We chose to label these categories the same as the disturbance density categories, both for consistency and to avoid mislabeling PUs that may contain cultural or ecological impacts not included in our analysis.
Following mapping, we assessed the relative influence of disturbance types and cultural feature categories on overlap scores. To do this, we grouped our data into the five overlap score ranges that depicted potential overlap between cultural features and disturbances, and calculated the total disturbance score and CFI from all of the PUs in each range. To understand the influence of each disturbance type or cultural feature category on the overlap score in each range, we calculated the percentage contribution of each disturbance type and cultural feature category to the total disturbance score or CFI in each overlap score range.

3. Results

3.1. Documented Cultural Feature Density

The intensity of cultural features displayed in Figure 4 shows that the Gwich’in Settlement Region is highly culturally salient. The vast majority of PUs (88%) contained cultural features (Table 3). Twenty-eight percent of all PUs contained one category of cultural feature, while the majority (60%) contained overlap between two to four cultural feature categories (Table 3).
Most PUs had moderate to high CFIs. Planning units with very high and extreme CFI value ranges accounted for 21% of the CFI across all PUs. The average CFI score in these PUs was 13.50 and 41.19 per PU (Table 4). These PUs were located along rivers like the Peel (Teetł’it Gwinjik) and Mackenzie (Nagwichoonjik), and throughout the Mackenzie River Delta (Ehdiitat) (Figure 4). Planning units with CFI values in the moderate and high categories made up 58% of all PUs, and had average CFIs of 1.48 and 4.21 per PU (Table 4). Most of these PUs were located adjacent to water bodies and throughout the Great Bear Lake Plain and Fort McPherson Plain ecoregions (Figure 4). Twenty-one percent of all PUs were grouped in the light CFI class and had an average CFI of 0.47 per PU (Table 4). The highest concentrations of these PUs were located in the Mackenzie Mountain and southern Peel Plateau ecoregions, with smaller concentrations found throughout the Great Bear Lake Plain and Fort McPherson Plain ecoregions and around the edges of the GSR (Figure 4).

3.2. Cumulative Weighted Environmental Disturbance

Our analysis shows that relatively low levels of environmental disturbance are present across the GSR (Figure 5). Approximately half (55%) of the PUs contained recorded disturbances, but the majority of these contained one disturbance type (76% of disturbed PUs) (Table 5). A smaller number of PUs contained two or more disturbance types, and no PUs included all seven of the disturbance types that we examined (Table 5).
PUs with no recorded disturbances were common in most ecoregions (Figure 5), and the low and moderately low disturbance score ranges contained the majority of disturbed PUs (63%) (Table 6). PUs with low or moderately low disturbance levels had average disturbance scores of 0.004 and 0.05 per PU (Table 6). These PUs tended to contain small areas of seismic lines and thaw slumps, and were found in all of the ecoregions in the study area (Figure 5). Moderately disturbed PUs comprised 33% of disturbed PUs and had an average disturbance score of 0.21 per PU (Table 6). These PUs contained clusters of overlap between larger seismic lines and thaw slumps with other disturbance types, and were located primarily in the Richardson Mountains, Peel Plateau, and Eagle Plains ecoregions (Figure 5). Seventy PUs had high disturbance scores and were clustered close to the Dempster Highway, where gravel quarries, thaw slumps, and seismic lines frequently overlapped (Figure 5). These PUs had an average disturbance score of 2.35 (Table 6), and comprised 3% of disturbed PUs. Ten PUs with very high disturbance levels were located near Fort McPherson, Inuvik, and Tsiigehtchic, where community infrastructure frequently overlapped with the Dempster Highway (Figure 5). These PUs had average disturbance scores of 32.78, and were present in 0.5% of PUs containing recorded disturbances (Table 6). For reference, a very high disturbance score is roughly equivalent to the impacts which would result from half of the PU being covered by a thaw slump. A moderate disturbance score is roughly equivalent to the impacts stemming from 1/70 of the PU being covered in seismic lines.

3.3. Potential Overlap between Cultural Features and Disturbances

The map shown in Figure 6 indicates that there is a moderate amount of potential overlap between environmental disturbances and cultural features in the GSR. Overall, 54% of PUs contained both disturbances and cultural features (Table 7). Of these PUs, most had low to moderate overlap scores (98%), and only a few had high or very high scores (2%) (Table 7). PUs with potential overlap between disturbances and cultural features were located throughout the GSR, with moderate to very high overlap score ranges primarily located near the Peel River (Teetł’it Gwinjik), Dempster Highway, Fort McPherson, Inuvik, and Tsiigehtchic (Figure 6).
Decomposing overlap scores shows that some disturbances and cultural features had a larger impact on overlap scores than others. Thaw slumps and seismic lines were responsible for over 80% of the impact in the low and moderately low overlap score ranges, the Dempster highway was responsible for 46% of the impact in the moderate range, and community infrastructure caused 49% and 91% of the impact in the high and very high overlap score ranges (Table 8). Historic harvesting trails accounted for over 60% of the cultural feature intensity in each overlap score range (Table 9).

4. Discussion

Cultural landscapes have been described as areas defined by intricate relationships between humans and the land, including longstanding land use and spiritual connections [78,79,80]. Our analysis shows that the Gwich’in Settlement Region represents a cultural landscape characterized by features linked to oral traditions and multigenerational land use [28]. In this region, relationships between people and place are essential aspects of Gwich’in well-being, livelihood, and identity that are embedded in the cultural features that define this landscape [38,
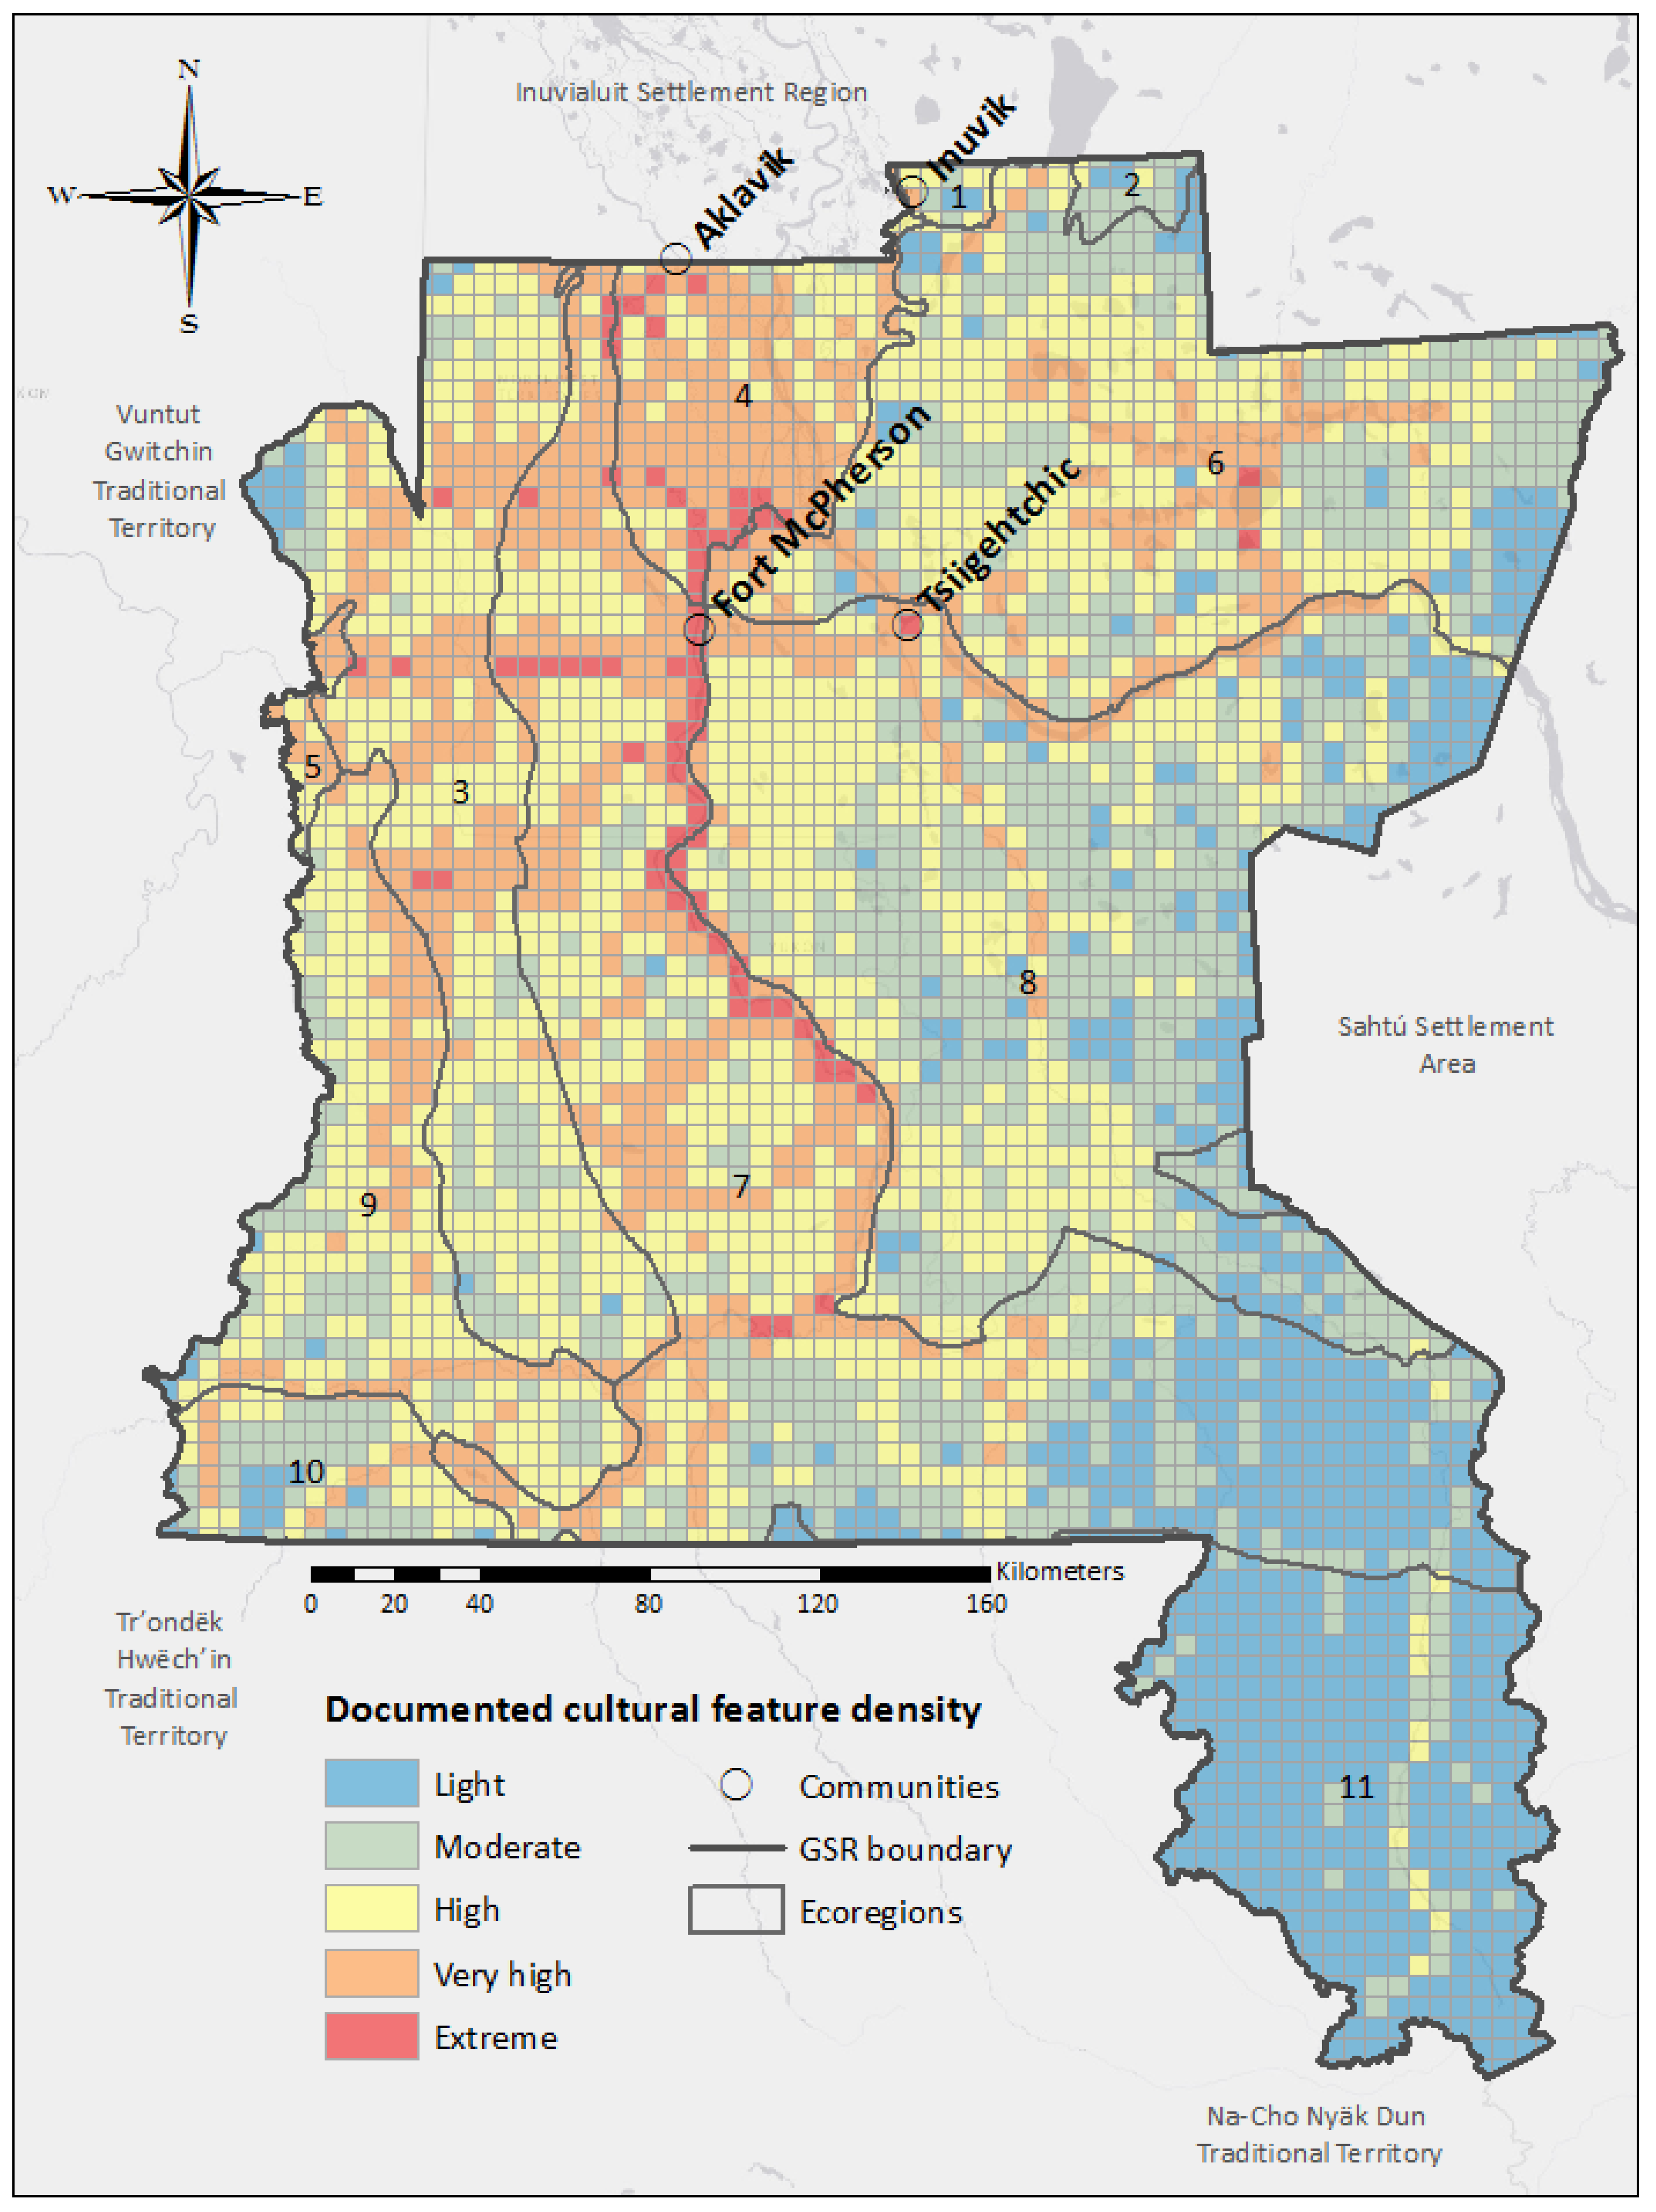
81]. We found that we could discern broad-scale patterns that characterize cultural landscapes by overlaying cultural feature data. For example, Figure 4 shows that the most intensive cultural use in the GSR occurs near waterways like the Peel River (Teetł’it Gwinjik), Mackenzie River (Nagwichoonjik), the Mackenzie River Delta (Ehdiitat), and Travaillant Lake (Khaii Luk), showcasing the prominence of these features in Gwich’in livelihoods. This finding is consistent with the ethnographic literature, which highlights the importance of rivers for travel, harvesting, identity, and language in Gwich’in culture, and for Indigenous peoples around the world [25,82,83].
Our maps also show some areas of the GSR, including the Mackenzie Mountains and the headwaters of the Arctic Red River (Tsiigehnjik), with no cultural features recorded in the spatial data we utilized. This may be because difficult travel conditions in these areas limited their use [84]. However, it is also likely that these areas experienced more widespread use prior to European contact in the mid-1800s, which isn’t captured by the spatial data we analyzed [28]. These areas also border the territory of Indigenous groups like the Sahtú Dene, who have highlighted place names, trails, and harvesting areas near the headwaters of the Arctic Red River (Tsiigehnjik) [85]. With further field studies and traditional knowledge research, additional cultural features could be identified in these areas.
The widespread density of cultural features in the Gwich’in Settlement Region, combined with the extent of disturbances across this area, highlights the need for methods to assess the cumulative impacts of disturbance on the cultural and ecological landscape. While social and cultural components are included in cumulative impact assessments in some regions, they are typically less prevalent than biological components in the available literature [32,34]. This is concerning because omitting some features underrepresents the extent of the cultural landscape, running the risk that decisions will be made with incomplete information that distorts the magnitude of impacts [27,86]. Because of this, additional tools are needed to include cultural features in cumulative impact assessments [32].
The methods for overlaying cultural features and disturbances outlined in this paper provide a unique and straightforward approach that can be used as a first step to a more comprehensive consideration of the cultural landscape in cumulative impact assessments. Overlay analysis has been used to assess the risks from specific environmental disturbances to socio-culturally important locations around the world [87,88,89]. Map overlays have also been described as a tool to examine cultural impacts in Environmental Impact Assessments, or to analyze cumulative environmental impacts [16,90]. Our approach builds on, yet is distinct from, these efforts because it is driven by both detailed ecological data and local knowledge of relationships between people, land, and water.
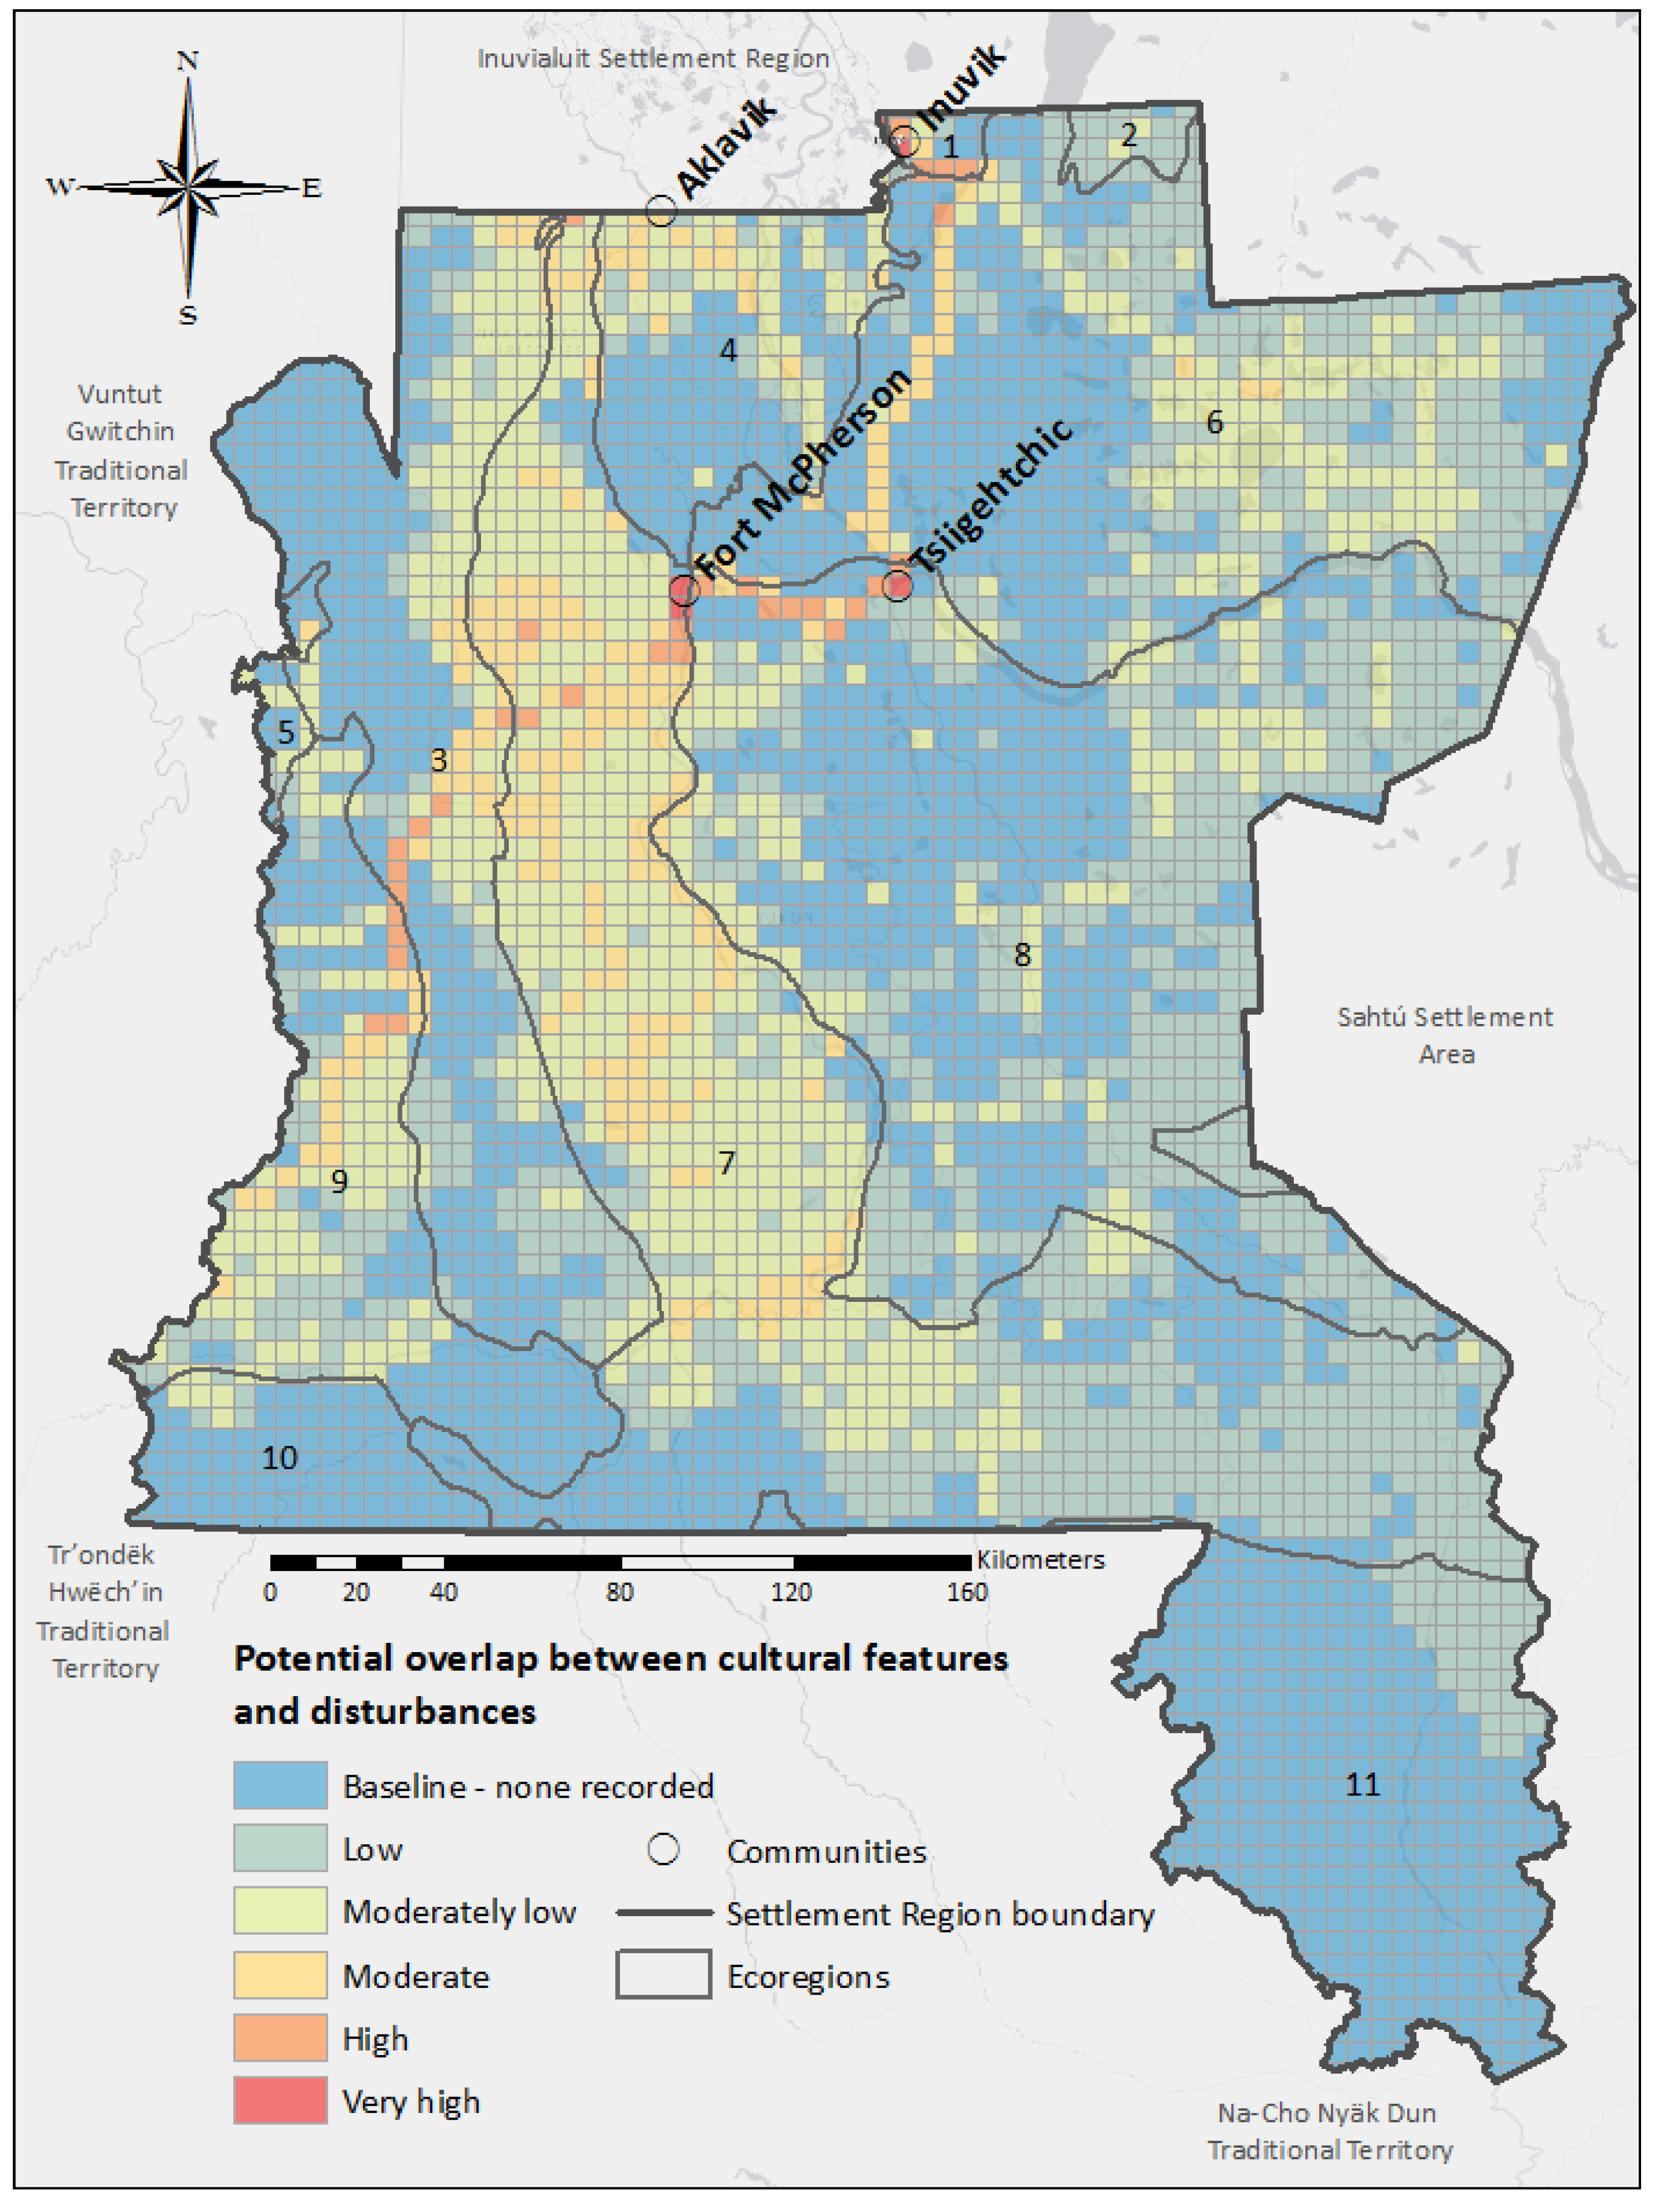
Our overlay analysis illustrates regional scale patterns of cumulative environmental impacts in the cultural landscape that would not be evident by focusing on a single disturbance type or cultural feature category [91,92]. The map displayed in Figure 6 shows that the highest amounts of potential overlap and impact between cultural features and disturbances occur along sections of the Dempster Highway that intersect with community infrastructure, areas of the Peel Plateau containing thaw slumps and seismic lines, and along the Peel River (Teetł’it Gwinjik), which contains dense concentrations of cultural features. It is particularly noteworthy that the majority of planning units in the Peel Plateau ecoregion contained both cultural features and disturbances such as thaw slumps. This highlights the fact that this region is experiencing particularly intensive, rapid geomorphological change in a culturally important area [23,51,93].
The overlay methods described here have the potential to inform cultural heritage and land use management, as well as regional environmental monitoring. For example, broad-scale overlay analysis can be used to determine where to conduct fieldwork for cultural heritage managers, who make decisions about vast cultural landscapes impacted by environmental disturbance [28]. Examining potential overlap between cultural features and disturbances could also be used to assess impacts to valued ecosystem components [16,94]. In northern regions, these methods could contribute to co-management decision making about a culturally important species like caribou, by combining information on caribou harvesting areas [95] and relevant disturbance data like roads [96]. In terms of environmental monitoring, significant efforts are being directed at land-based monitoring which utilizes traditional knowledge and/or scientific methods to document changes of interest to community members and researchers [97,98]. The methods described here could augment these initiatives by identifying areas where rapid environmental change may impact cultural features, which should be prioritized for monitoring [28,99].
Expert consultation is an important aspect of cumulative impact assessment [16,100], and our experience indicates it is particularly important when examining cumulative impacts in cultural landscapes. In this project, local collaboration, expert consultation, and community visits provided vital direction. The Gwich’in have a long history of engaging in mapping projects [40,82,93], and their collaboration in this project ensured that Gwich’in knowledge and data were used appropriately and that mapping was undertaken respectfully. Interviewing and consulting community members, professionals invested in the region, and Gwich’in organizations also shaped the way that we conceptualized and represented cultural features [42]. For instance, our interviewees were clear that creating a rigorous weighting scheme for cultural features would be challenging and could not be completed by a small number of people. Community visits also ensured that we could update organizations and community members to gain feedback and share results.
Alongside potential applications of these methods, there are challenges associated with mapping cultural landscapes. For instance, demarcating cultural locations on a map may fail to fully represent the knowledge, relationships, and collective memories associated with tangible and intangible cultural features [101,102]. Maps are a powerful means to convey information [103], and to ensure that knowledge is not misrepresented or distorted in the mapping process, it is vital that cultural mapping projects that are warranted in an area are conducted in a culturally appropriate manner. For example, certain locations (i.e., sacred sites, harvesting locations) are confidential and cannot be presented in the public domain [104]. To protect culturally sensitive places and confidential information, our mapping analysis presents our results in aggregate form, ensuring that confidential cultural features are not identifiable. While maps from our analysis do not display discernible cultural feature locations, there may be concerns in other projects about releasing spatial data representing cultural features to individuals outside the community to analyze. In these cases, funding and training (if necessary) should be provided to the interested communities to conduct or be engaged in the analyses.
Additional challenges associated with the approach outlined here relate to data availability and type. Acquiring high quality, up to date data is a well-documented challenge [89,105]. Although there is a wealth of spatial data representing cultural features in the GSR, limited data may be a significant constraint in other regions. This obstacle is magnified by the pace of ecological change in some regions [106,
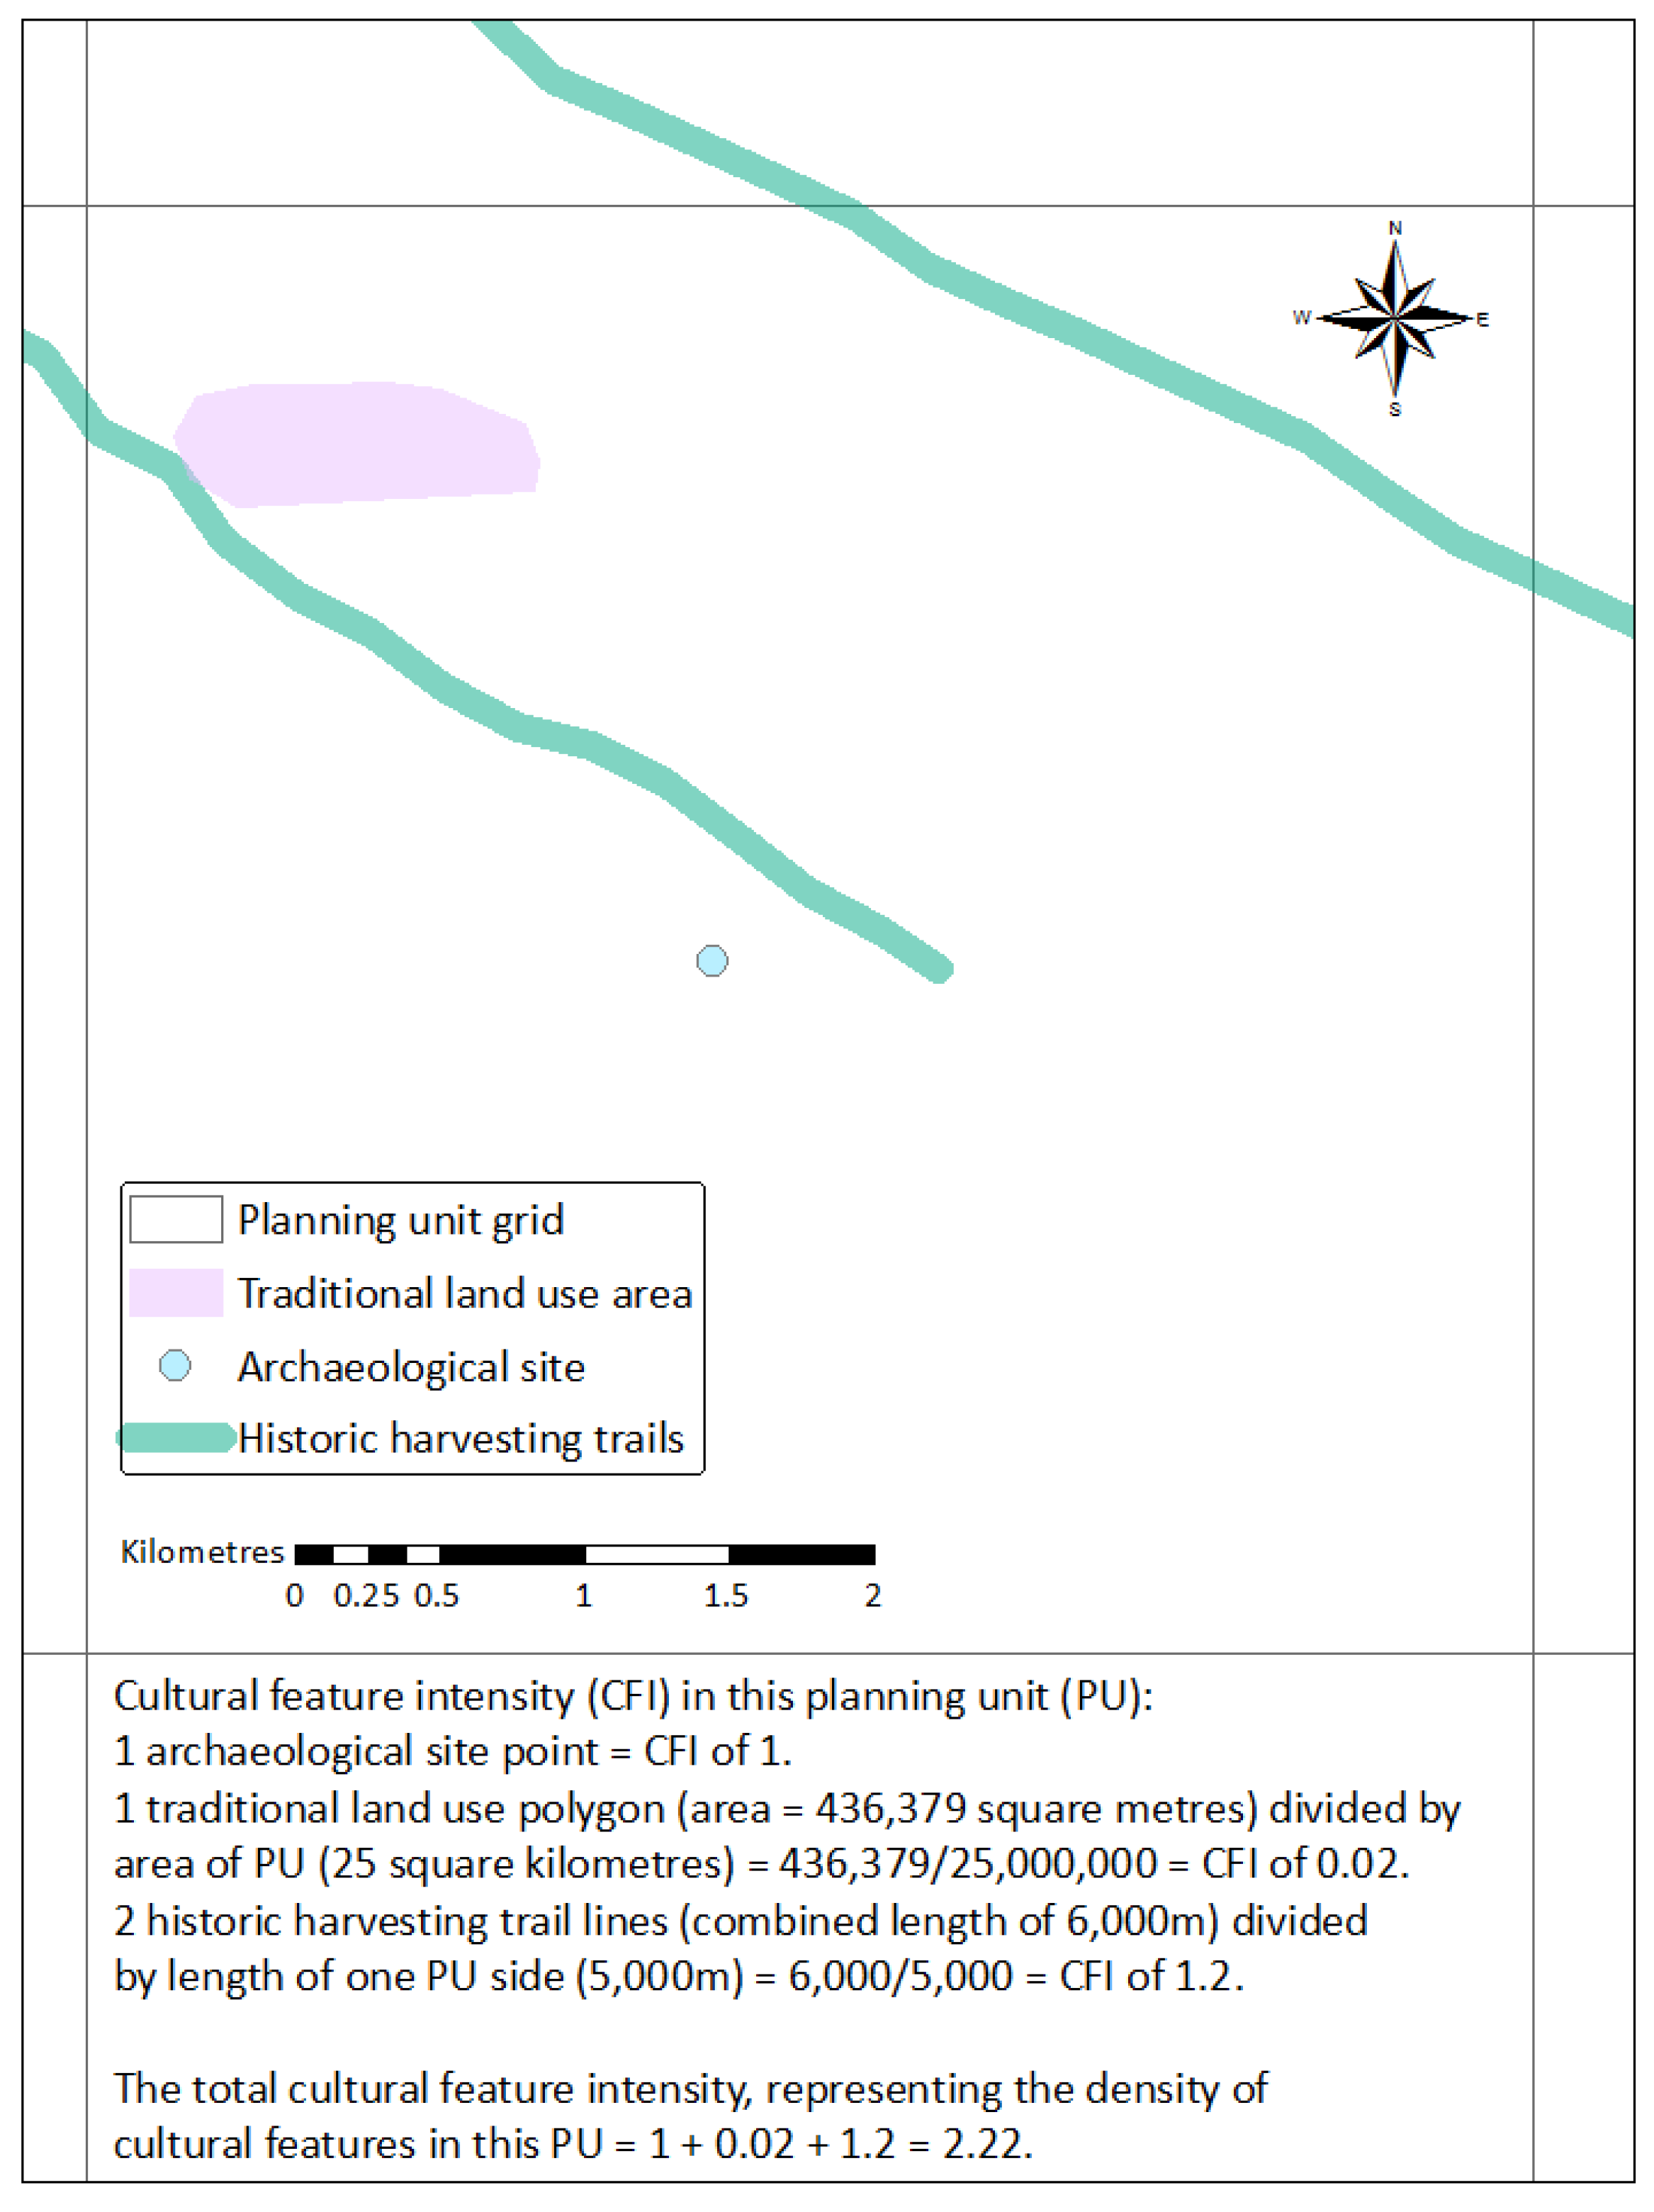
107], which can quickly make spatial data outdated. Utilizing different types of data (i.e., point, line, polygon) can also pose a challenge to this kind of synthesis. In our analysis, while the methods used to calculate the cultural feature intensity index differed between data types and likely affected the absolute values of the index, we are confident that the overall pattern inherent in the data was not affected by our approach to mapping.
Another drawback of our overlay method is that it highlights potential, rather than known, impacts. As such, we recommend that overlay analysis is deployed as an initial step that is followed up with finer-scale spatial analysis and the inclusion of impacts that are not mapped. Finer scale analysis may be important for land managers and researchers who want to examine a particular area in maximum detail. For instance, the potential overlap between cultural features and disturbances in the Peel Plateau ecoregion illustrated by our analysis could lead cultural heritage managers to conduct a more intensive analysis of this specific area to better guide the assessment of impacts to cultural features or implementation of potential protective measures. Finer scale analyses could also more effectively include both positive and negative impacts of disturbances. In our regional-scale analysis, we made the simplifying assumption that disturbances causing ecological damage and overlapping with cultural features led to negative outcomes. However, many disturbances also include positive aspects. Community infrastructure has obvious positive attributes, and attendees at our community meetings discussed benefits like economic gain and travel corridors associated with seismic lines. Related to this, it is important to account for the cultural and environmental impacts of disturbances beyond overlap that are not mapped. As one example, future analyses should include social impacts of development that often accompany industrial camps and housing created for temporary workers [108,109]. Additionally, future analyses should include environmental changes such as community members’ observations of increased air temperatures [110]. While increased air temperatures do not directly manifest on the land, they impact disturbances like thaw slumps [51] and cultural activities like drying fish [110].

5. Conclusions

This paper outlines a method of spatial overlay analysis designed to quantify and map cultural features, cumulative environmental disturbance, and the potential overlap between these landscape features. When combined, these methods provide a means to recognize regional scale patterns of cultural use and characterize cumulative environmental impacts in a cultural landscape. Our analysis illustrates the nature of the cultural landscape in the Gwich’in Settlement Region, which contains expansive cultural features and is impacted by widespread but relatively low-intensity disturbances. Overlaying cultural feature and disturbance data revealed low to moderate overlap between disturbances and cultural features. To understand the implications of ongoing environmental change, cultural features must be included in cumulative impact assessments. The methods described here provide a straightforward step to addressing the exclusion of the cultural landscape in most cumulative impact assessments. Our analysis focuses on the cultural landscape at the regional scale, but with appropriate data and local consultation, our methods could also be deployed across a range of scales relevant to land use and cultural heritage managers.

Supplementary Materials

The following are available online at https://www.mdpi.com/2071-1050/12/11/4667/s1, Figure S1: Map of the environmental disturbance data that were used in our analysis across ecoregions in the Gwich’in Settlement Region: 1. Tuktoyaktuk Coastal Plain, 2. Dease Arm Plain, 3. British-Richardson Mountains, 4. Mackenzie Delta, 5. Old Crow Basin, 6. Great Bear Lake Plain, 7. Peel River Plateau, 8. Fort McPherson Plain, 9. Eagle Plains, 10. North Ogilvie Mountains, 11. Mackenzie Mountains.

Author Contributions

Conceptualization, T.A.P. and T.C.L.; methodology, T.A.P. and T.C.L.; formal analysis, T.A.P.; investigation, T.A.P.; resources, T.C.L.; data curation, T.A.P.; writing—original draft preparation, T.A.P.; writing—review and editing, T.A.P., T.C.L., and Gwich’in Tribal Council Department of Cultural Heritage; visualization, T.A.P.; supervision, T.C.L; project administration, T.C.L.; funding acquisition, T.A.P. and T.C.L. All authors have read and agreed to the published version of the manuscript.

Funding

This research was funded by the Social Sciences and Humanities Research Council of Canada through the Tracking Change project (grant number 895-2015-1024), and by the Northern Scientific Training Program.

Acknowledgments

The authors want to thank the interview participants that we consulted for this project: Amy Amos, Sharon Snowshoe, Ingrid Kritsch, and Thomas Andrews. Mahsi’ choo to the Prince of Wales Northern Heritage Centre and Yukon Archaeology for providing data on archaeological sites, to the regional organizations who provided logistical support and helped with interview participant selection, as well as the community members of Aklavik, Fort McPherson, Inuvik, Tsiigehtchic, and Yellowknife for their warm welcomes. Thank you to Natalie Ban for your critical feedback about this article in thesis form, to Emma Hodgson for your collaboration during the fieldwork portion of the project, to Brenda Parlee, Elaine Maloney, Tracy Howlett, Zizhao (Finn) Wang, Abby D’Souza, and everyone else with the Tracking Change team at the University of Alberta for your support, and to the members of the Arctic Landscape Ecology Lab at the University of Victoria for your feedback and camaraderie. We would also like to thank the three anonymous reviewers whose suggestions improved this manuscript.

Conflicts of Interest

The authors declare no conflict of interest. The funders had no role in the design of the study; in the collection, analyses, or interpretation of data; in the writing of the manuscript, or in the decision to publish the results.

References

  1. Nitschke, C.R. The cumulative effects of resource development on biodiversity and ecological integrity in the Peace-Moberly region of Northeast British Columbia, Canada. Biodivers. Conserv. 2008, 17, 1715–1740. [Google Scholar] [CrossRef]
  2. Alberti, M. The Effects of Urban Patterns on Ecosystem Function. Int. Reg. Sci. Rev. 2005, 28, 168–192. [Google Scholar] [CrossRef]
  3. Inman, D.; Smis, S.; De Andrade, E.K.D. Fragmentation, harmonization and the users’ perspective: The Munduruku peoples’ view on land and the developing standards on indigenous peoples’ land rights. In Fragmentation and Integration in Human Rights Law; Brems, E., Ouald-Chaib, S., Eds.; Edward Elgar Publishing: Cheltenham, UK, 2018; pp. 60–85. [Google Scholar]
  4. Smith, R.-A.J.; Rhiney, K. Climate (in) justice, vulnerability and livelihoods in the Caribbean: The case of the indigenous Caribs in northeastern St. Vincent. Geoforum 2016, 73, 22–31. [Google Scholar] [CrossRef]
  5. AMAP. AMAP Climate Change Update 2019: An Update to Key Findings of Snow, Water, Ice and Permafrost in the Arctic (SWIPA) 2017; Arctic Monitoring and Assessment Programme (AMAP): Tromsø, Norway, 2019. [Google Scholar]
  6. Forbes, B.C. Cultural Resilience of Social-ecological Systems in the Nenets and Yamal-Nenets Autonomous Okrugs, Russia: A Focus on Reindeer Nomads of the Tundra. Ecol. Soc. 2013, 18, 36. [Google Scholar] [CrossRef] [Green Version]
  7. Dabros, A.; Pyper, M.; Castilla, G. Seismic lines in the boreal and arctic ecosystems of North America: Environmental impacts, challenges, and opportunities. Environ. Rev. 2018, 26, 214–229. [Google Scholar] [CrossRef] [Green Version]
  8. Huntington, H.P.; Quakenbush, L.T.; Nelson, M. Evaluating the Effects of Climate Change on Indigenous Marine Mammal Hunting in Northern and Western Alaska Using Traditional Knowledge. Front. Mar. Sci. 2017, 4, 319. [Google Scholar] [CrossRef] [Green Version]
  9. Parlee, B.L.; Sandlos, J.; Natcher, D. Undermining subsistence: Barren-ground caribou in a “tragedy of open access”. Sci. Adv. 2018, 4, e1701611. [Google Scholar] [CrossRef] [Green Version]
  10. Kokelj, S.; Palmer, M.J.; Lantz, T.C.; Burn, C.R. Ground Temperatures and Permafrost Warming from Forest to Tundra, Tuktoyaktuk Coastlands and Anderson Plain, NWT, Canada. Permafr. Periglac. Process. 2017, 28, 543–551. [Google Scholar] [CrossRef]
  11. Myers-Smith, I.H.; Forbes, B.C.; Wilmking, M.; Hallinger, M.; Lantz, T.; Blok, D.; Tape, K.D.; Macias-Fauria, M.; Sass-Klaassen, U.; Lévesque, E.; et al. Shrub expansion in tundra ecosystems: Dynamics, impacts and research priorities. Environ. Res. Lett. 2011, 6. [Google Scholar] [CrossRef] [Green Version]
  12. Ye, B.; Yang, D.; Zhang, T.; Zhang, Y.; Zhou, Z. Hydrological process change with air temperature over the Lena Basin in Siberia. In Proceedings of the Cold Regions Hydrology in a Changing Climate Conference, Melbourne, Australia, July 2011; pp. 33–38. [Google Scholar]
  13. Cameron, E.A.; Lantz, T.C. Drivers of tall shrub proliferation adjacent to the Dempster Highway, Northwest Territories, Canada. Environ. Res. Lett. 2016, 11, 045006. [Google Scholar] [CrossRef] [Green Version]
  14. Raynolds, M.K.; Walker, D.A.; Ambrosius, K.J.; Brown, J.; Everett, K.R.; Kanevskiy, M.; Kofinas, G.P.; Romanovsky, V.; Shur, Y.; Webber, P.J. Cumulative geoecological effects of 62 years of infrastructure and climate change in ice-rich permafrost landscapes, Prudhoe Bay Oilfield, Alaska. Glob. Chang. Boil. 2014, 20, 1211–1224. [Google Scholar] [CrossRef] [PubMed]
  15. Holroyd, P.; Retzer, H. A Peak into the Future: Potential Landscape Impacts of Gas Development in Northern Canada; Pembina Institute: Alberta, AB, Canada, 2005. [Google Scholar]
  16. Hegmann, G.; Cocklin, C.; Creasey, R.; Dupuis, S.; Kennedy, A.; Kingsley, L.; Ross, W.; Spaling, H.; Stalker, D. Cumulative Effects Assessment Practitioners Guide; AXYS Environmental Consulting Ltd. and the CEA Working Group for the Canadian Environmental Assessment Agency: Hull, QC, Cananda, 1999. [Google Scholar]
  17. Johnston, C.A. Cumulative impacts to wetlands. Wetlands 1994, 14, 49–55. [Google Scholar] [CrossRef]
  18. Franks, D.; Brereton, D.; Moran, C.J. Managing the cumulative impacts of coal mining on regional communities and environments in Australia. Impact Assess. Proj. Apprais. 2010, 28, 299–312. [Google Scholar] [CrossRef]
  19. Noble, B.; Liu, J.; Hackett, P. The Contribution of Project Environmental Assessment to Assessing and Managing Cumulative Effects: Individually and Collectively Insignificant? Environ. Manag. 2016, 59, 531–545. [Google Scholar] [CrossRef] [PubMed]
  20. Tyson, W.; Lantz, T.C.; Ban, N.C. Cumulative Effects of Environmental Change on Culturally Significant Ecosystems in the Inuvialuit Settlement Region + Supplementary Appendices 1 to 3 (See Article Tools). Arctic 2016, 69, 391. [Google Scholar] [CrossRef]
  21. Johnson, C.J.; Boyce, M.S.; Case, R.L.; Cluff, H.D.; Gau, R.J.; Gunn, A.; Mulders, R. Cumulative effects of human developments on Arctic wildlife. Wildl. Monogr. 2005, 160, 1–36. [Google Scholar]
  22. Sandlos, J.; Keeling, A. Toxic Legacies, Slow Violence, and Environmental Injustice at Giant Mine, Northwest Territories. North. Rev. 2016, 42, 7–21. [Google Scholar] [CrossRef] [Green Version]
  23. Kokelj, S.; Tunnicliffe, J.; Lacelle, D.; Lantz, T.; Chin, K.; Fraser, R. Increased precipitation drives mega slump development and destabilization of ice-rich permafrost terrain, northwestern Canada. Glob. Planet. Chang. 2015, 129, 56–68. [Google Scholar] [CrossRef] [Green Version]
  24. Brown, C.J.; Saunders, M.; Possingham, H.P.; Richardson, A.J. Interactions between global and local stressors of ecosystems determine management effectiveness in cumulative impact mapping. Divers. Distrib. 2013, 20, 538–546. [Google Scholar] [CrossRef] [Green Version]
  25. Klubnikin, K.; Annett, C.; Cherkasova, M.; Shishin, M.; Fotieva, I. The sacred and the scientific: Traditional ecological knowledge in Siberian river conservation. Ecol. Appl. 2000, 10, 1296–1306. [Google Scholar] [CrossRef]
  26. Parlee, B.; Furgal, C. Well-being and environmental change in the arctic: A synthesis of selected research from Canada’s International Polar Year program. Clim. Chang. 2012, 115, 13–34. [Google Scholar] [CrossRef]
  27. Ehrlich, A. Cumulative cultural effects and reasonably foreseeable future developments in the Upper Thelon Basin, Canada. Impact Assess. Proj. Apprais. 2010, 28, 279–286. [Google Scholar] [CrossRef]
  28. Andrews, T.D.; Kokelj, S.V.; MacKay, G.; Buysse, J.; Kritsch, I.; Andre, A.; Lantz, T. Permafrost thaw and Aboriginal cultural landscapes in the Gwich’in Region, Canada. APT Bull. J. Preserv. Technol. 2016, 47, 15–22. [Google Scholar]
  29. Sallenave, J. Giving traditional ecological knowledge its rightful place in environmental impact assessment. North Perspect. 1994, 22, 16–19. [Google Scholar]
  30. Parlee, B.L.; Geertsema, K.; Willier, A. Social-Ecological Thresholds in a Changing Boreal Landscape: Insights from Cree Knowledge of the Lesser Slave Lake Region of Alberta, Canada. Ecol. Soc. 2012, 17, 20. [Google Scholar] [CrossRef] [Green Version]
  31. Mantyka-Pringle, C.S.; Jardine, T.D.; Bradford, L.; Bharadwaj, L.A.; Kythreotis, A.P.; Fresque-Baxter, J.; Kelly, E.; Somers, G.; Doig, L.E.; Jones, P.; et al. Bridging science and traditional knowledge to assess cumulative impacts of stressors on ecosystem health. Environ. Int. 2017, 102, 125–137. [Google Scholar] [CrossRef] [PubMed] [Green Version]
  32. Willow, A.J. Cultural cumulative effects: Communicating energy extraction’s true costs. Anthr. Today 2017, 33, 21–26. [Google Scholar] [CrossRef]
  33. Gunn, A.; Johnson, C.; Nishi, J.; Daniel, C.; Russell, D.; Carlson, M.; Adamczewski, J. Understanding the Cumulative Effects of Human Activities on Barren-Ground Caribou. In Cumulative Effects in Wildlife Management; Krausman, P.R., Harris, L.K., Eds.; CRC Press: Boca Raton, FL, USA, 2011; pp. 113–133. [Google Scholar]
  34. Mitchell, R.E.; Parkins, J. The Challenge of Developing Social Indicators for Cumulative Effects Assessment and Land Use Planning. Ecol. Soc. 2011, 16, 29. [Google Scholar] [CrossRef] [Green Version]
  35. Gwich’in Land Use Planning Board. Final Draft (April 2018)-Nan Geenjit Gwitr’it T’agwàa’in Working for the Lan-Gwich’in Land Use Plan; Gwich’in Land Use Planning Board: Inuvik, NT, Canada, 2018. [Google Scholar]
  36. Ecological Stratification Working Group. A National Ecological Framework for Canada; Agriculture and Agri-Food Canada, Research Branch, Centre for Land and Biological Resources Research and Environment Canada, State of the Environment Directorate, Ecozone Analysis Branch: Ottawa, ON, Canada; Hull, QC, Canada, 1995. [Google Scholar]
  37. Andre, A. Nan t’aih nakwits’inahtsih (the Land Gives Us Strength): The Medicine Plants Used by Gwich’in People of Canada’s Western Arctic to Maintain Good Health and Well Being. Master’s Thesis, University of Victoria, Victoria, BC, Canada, 2006. [Google Scholar]
  38. Wishart, R.P. ‘We ate lots of fish back then’: The forgotten importance of fishing in Gwich’in country. Polar Rec. 2013, 50, 343–353. [Google Scholar] [CrossRef]
  39. Parlee, B.; Berkes, F.; Gwich’In, T. Health of the Land, Health of the People: A Case Study on Gwich’in Berry Harvesting in Northern Canada. EcoHealth 2005, 2, 127–137. [Google Scholar] [CrossRef]
  40. Asch, M.; Andrews, T.D.; Smith, S. The Dene mapping project on land use and occupancy: An introduction. In Anthropology in Praxis; Spaulding, P., Ed.; Department of Anthropology, University of Calgary: Calgary, AB, Canada, 1986; pp. 36–43. [Google Scholar]
  41. The Gwich’in Place Names and Story Atlas-about. Available online: http://atlas.gwichin.ca/index.html?module=gwichin.module.about (accessed on 29 June 2017).
  42. Proverbs, T.A. Social-Ecological Change in Gwich’in Territory: Cumulative Impacts in the Cultural Landscape, and Determinants of Access to Fish. Master’s Thesis, University of Victoria, Victoria, BC, Canada, August 2019. [Google Scholar]
  43. Alexie, E.D. ‘Nakhwanh Gwich’in Khehłok Iidilii-We Are Our Own People’ Teetł’it Gwich’in Practices of Indigeneity: Connection to Land, Traditional Self-Governance, and Elements of Self Determination. Master’s Thesis, University of Victoria, Victoria, BC, Canada, 2015. [Google Scholar]
  44. ArcMap Extensions-data Classification. Available online: https://desktop.arcgis.com/en/arcmap/10.4/extensions/geostatistical-analyst/data-classification.htm (accessed on 6 May 2019).
  45. Lantz, T.C.; Kokelj, S.V. Increasing rates of retrogressive thaw slump activity in the Mackenzie Delta region, N.W.T., Canada. Geophys. Res. Lett. 2008, 35. [Google Scholar] [CrossRef]
  46. Segal, R.; Lantz, T.C.; Kokelj, S.V. Acceleration of thaw slump activity in glaciated landscapes of the Western Canadian Arctic. Environ. Res. Lett. 2016, 11, 34025. [Google Scholar] [CrossRef]
  47. Mackenzie Valley Air Photo Project; Indian and Northern Affairs Canada, Natural Resources Canada, Environment Canada: Yellowknife, NT, Canada, 2004.
  48. Hagen, W. Issuance of Type a Land Use Permit-Mackenzie Valley Fibre Optic Project; Mackenzie Valley Land and Water Board: Yellowknife, NT, Canada, 2014. [Google Scholar]
  49. Stantec Consulting Ltd. Mackenzie Valley Fibre Link: Project Description Report; Mackenzie Valley Land and Water Board: Yellowknife, NT, Canada, 2014. [Google Scholar]
  50. Segal, R.A.; Kokelj, S.V.; Lantz, T.C.; Durkee, K.; Gervais, S.; Mahon, E.; Snijders, M.; Buysse, J.; Schwarz, S. Broad-Scale Mapping of Terrain Impacted by Retrogressive Thaw Slumping in Northwestern Canada; Northwest Territories Geological Survey: Yellowknife, NT, Canada, 2016. [Google Scholar]
  51. Murray, C.C.; Agbayani, S.; Alidina, H.M.; Ban, N.C. Advancing marine cumulative effects mapping: An update in Canada’s Pacific waters. Mar. Policy 2015, 58, 71–77. [Google Scholar] [CrossRef]
  52. Dene Trails; GTC Department of Cultural Heritage digital archive: Fort McPherson, NT, Canada, 2016.
  53. Gwich’in Place Names; GTC Department of Cultural Heritage Digital Archive: Fort McPherson, NT, Canada, 2016.
  54. Gwich’in Traditional Land Use and Traditional Ecological Knowledge; GTC Department of Cultural Heritage Digital Archive: Fort McPherson, NT, Canada, 2016.
  55. Northwest Territories Archaeological Sites; Government of Northwest Territories: Yellowknife, NT, Canada, 2016.
  56. Yukon Archaeological Sites; Yukon Government Department of Tourism and Culture: Whitehorse, YT, Canada, 2017.
  57. Thienpont, J.R.; Kokelj, S.V.; Korosi, J.B.; Cheng, E.S.; Desjardins, C.; Kimpe, L.E.; Blais, J.M.; Pisaric, M.; Smol, J.P. Exploratory Hydrocarbon Drilling Impacts to Arctic Lake Ecosystems. PLoS ONE 2013, 8, e78875. [Google Scholar] [CrossRef] [Green Version]
  58. Kokelj, S.; Lacelle, D.; Lantz, T.C.; Tunnicliffe, J.; Malone, L.; Clark, I.D.; Chin, K.S. Thawing of massive ground ice in mega slumps drives increases in stream sediment and solute flux across a range of watershed scales. J. Geophys. Res. Earth Surf. 2013, 118, 681–692. [Google Scholar] [CrossRef]
  59. Northwest Territories Digital Atlas: Oil and Gas Regime-Seismic; World Wildlife Fund Canada: Toronto, ON, Canada, 2002.
  60. Oil and Gas Seismic Lines (1961–2014); Yukon Highways and Public Works: Whitehorse, YT, Canada, 2014.
  61. Kemper, J.T.; Macdonald, S.E. Directional change in upland tundra plant communities 20-30 years after seismic exploration in the Canadian low-arctic. J. Veg. Sci. 2009, 20, 557–567. [Google Scholar] [CrossRef]
  62. Williams, T.J.; Quinton, W.L.; Baltzer, J.L. Linear disturbances on discontinuous permafrost: Implications for thaw-induced changes to land cover and drainage patterns. Environ. Res. Lett. 2013, 8, 025006. [Google Scholar] [CrossRef]
  63. Northwest Territories Digital Atlas: Transportation-Roads; World Wildlife Fund Canada: Toronto, ON, Canada, 2002.
  64. Myers-Smith, I.H.; Arnesen, B.K.; Thompson, R.; Chapin, F.S. Cumulative impacts on Alaskan arctic tundra of a quarter century of road dust. Écoscience 2006, 13, 503–510. [Google Scholar] [CrossRef]
  65. Gill, H.K.; Lantz, T.C.; O’Neill, H.B.; Kokelj, S.; Lantzx, T.C. Cumulative Impacts and Feedbacks of a Gravel Road on Shrub Tundra Ecosystems in the Peel Plateau, Northwest Territories, Canada. Arctic Antarct. Alp. Res. 2014, 46, 947–961. [Google Scholar] [CrossRef] [Green Version]
  66. Northwest Territories Digital Atlas: Oil and Gas Regime-Wells; World Wildlife Fund Canada: Toronto, ON, Canada, 2002.
  67. Yukon Oil and Gas Well Locations; Yukon Government Oil and Gas Management Branch: Whitehorse, YT, Canada, 2014.
  68. Johnstone, J.F.; Kokelj, S.V. Environmental Conditions and Vegetation Recovery at Abandoned Drilling Mud Sumps in the Mackenzie Delta Region, Northwest Territories, Canada. Arctic 2009, 61, 199–211. [Google Scholar] [CrossRef] [Green Version]
  69. Kokelj, S.; Riseborough, D.; Coutts, R.; Kanigan, J. Permafrost and terrain conditions at northern drilling-mud sumps: Impacts of vegetation and climate change and the management implications. Cold Reg. Sci. Technol. 2010, 64, 46–56. [Google Scholar] [CrossRef]
  70. Mackenzie Valley Fibre Link Route; Mackenzie Valley Land and Water Board: Yellowknife, NT, Canada, 2014.
  71. Gravel Pit-25k; Geomatics Yukon: Whitehorse, YT, Canada, 2014.
  72. Northwest Territories Gravel Quarries; Northwest Territories Cumulative Impacts Monitoring Program, Government of the Northwest Territories Centre for Geomatics: Yellowknife, NT, Canada, 2015.
  73. Harper, K.A.; Kershaw, G.P. Natural Revegetation on Borrow Pits and Vehicle Tracks in Shrub Tundra, 48 Years Following Construction of the CANOL No. 1 Pipeline, N.W.T., Canada. Arct. Alp. Res. 1996, 28, 163. [Google Scholar] [CrossRef] [Green Version]
  74. Forbes, B.C. Tundra Disturbance Studies, III: Short-term Effects of Aeolian Sand and Dust, Yamal Region, Northwest Siberia. Environ. Conserv. 1995, 22, 335–344. [Google Scholar] [CrossRef]
  75. Koronatova, N.; Milyaeva, E.V. Plant community succession in post-mined quarries in the northern-taiga zone of West Siberia. Contemp. Probl. Ecol. 2011, 4, 513–518. [Google Scholar] [CrossRef]
  76. Northwest Territories Community Boundaries; Northwest Territories Cumulative Impacts Monitoring Program, Government of the Northwest Territories Centre for Geomatics: Yellowknife, NT, Canada, 2015.
  77. Johansson, M.; Christensen, T.R.; Akerman, H.J.; Callaghan, T.V. What Determines the Current Presence or Absence of Permafrost in the Torneträsk Region, a Sub-arctic Landscape in Northern Sweden? AMBIO J. Hum. Environ. 2006, 35, 190–197. [Google Scholar] [CrossRef] [Green Version]
  78. UNESCO: World Heritage Convention. Available online: https://whc.unesco.org/en/culturallandscape/ (accessed on 5 March 2018).
  79. Cuerrier, A.; Turner, N.J.; Gomes, T.C.; Garibaldi, A.; Downing, A. Cultural Keystone Places: Conservation and Restoration in Cultural Landscapes. J. Ethnobiol. 2015, 35, 427–448. [Google Scholar] [CrossRef]
  80. Andrews, T.D.; Buggey, S. Canadian Aboriginal cultural landscapes in praxis. In Managing Cultural Landscapes; Taylor, K., Lennon, J.L., Eds.; Routledge: Milton Park, UK, 2012; pp. 253–271. [Google Scholar]
  81. Kuhnlein, H.V.; McDonald, M.; Spigelski, D.; Vittrekwa, E.; Erasmus, B. Gwich’in traditional food for health: Phase 1. In Indigenous Peoples’ Food Systems: The Many Dimensions of Culture, Diversity and Environment for Nutrition and Health; Kuhnlein, H.V., Erasmus, B., Spigelski, D., Eds.; Food and Agriculture Organization of the United Nations, and Centre for Indigenous Peoples’ Nutrition and Environment: Rome, Italy, 2009; pp. 45–58. [Google Scholar]
  82. Aporta, C.; Kritsch, I.; Andre, A.; Benson, K.; Snowshoe, S.; Firth, W.; Carry, D. The Gwich’in atlas: Place names, maps, and narratives. In Developments in the Theory and Practice of Cybercartography: Applications and Indigenous Mapping, 2nd ed.; Taylor, D.R.F., Lauriault, T.P., Eds.; Elsevier Science: Amsterdam, The Netherlands, 2014; pp. 229–244. [Google Scholar]
  83. Manorom, K.; Baird, I.; Shoemaker, B. The World Bank, Hydropower-based Poverty Alleviation and Indigenous Peoples: On-the-Ground Realities in the Xe Bang Fai River Basin of Laos. Forum Dev. Stud. 2017, 44, 1–26. [Google Scholar] [CrossRef]
  84. Benson, K. Headwaters of the Arctic Red River Phase III: Heritage and Cultural Assessment; Gwich’in Social & Cultural Institute: Fort McPherson, NT, Canada, 2008. [Google Scholar]
  85. Sahtu Heritage Places and Sites Joint Working Group. Rakekee Gok’e Godi: Places We Take Care of. Report of the Sahtu Heritage Places and Sites Joint Working Group; Sahtu Heritage Places and Sites Joint Working Group: Yellowknife, NT, Canada, 2000. [Google Scholar]
  86. McCormack, P.A. Walking the Land: Aboriginal Trails, Cultural Landscapes, and Archaeological Studies for Impact Assessment. Archaeologies 2017, 13, 110–135. [Google Scholar] [CrossRef]
  87. Wang, J.-J. Flood risk maps to cultural heritage: Measures and process. J. Cult. Heritage 2015, 16, 210–220. [Google Scholar] [CrossRef]
  88. Tarragüel, A.A.; Krol, B.; Van Westen, C. Analysing the possible impact of landslides and avalanches on cultural heritage in Upper Svaneti, Georgia. J. Cult. Herit. 2012, 13, 453–461. [Google Scholar] [CrossRef]
  89. Szlafsztein, C.F.; Sterr, H. A GIS-based vulnerability assessment of coastal natural hazards, state of Pará, Brazil. J. Coast. Conserv. 2007, 11, 53–66. [Google Scholar] [CrossRef]
  90. US Council on Environmental Quality. Considering Cumulative Effects under the National Environmental Policy Act; US Council on Environmental Quality: Washington, DC, USA, 1997. [Google Scholar]
  91. Jones, F.C. Cumulative effects assessment: Theoretical underpinnings and big problems. Environ. Rev. 2016, 24, 187–204. [Google Scholar] [CrossRef]
  92. Noble, B. Strategic approaches to regional cumulative effects assessmet: A case study of the Great Sand Hills, Canada. Impact Assess. Proj. Apprais. 2008, 26, 78–90. [Google Scholar] [CrossRef]
  93. Gill, H.; Lantz, T. A Community-Based Approach to Mapping Gwich’in Observations of Environmental Changes in the Lower Peel River Watershed, NT. J. Ethnobiol. 2014, 34, 294–314. [Google Scholar] [CrossRef] [Green Version]
  94. Mackenzie Valley Environmental Impact Review Board. Environmental Impact Assessment Guidelines; Mackenzie Valley Environmental Impact Review Board: Yellowknife, NT, Canada, 2004. [Google Scholar]
  95. Berkes, F.; Kofinas, G.P.; Chapin, F.S. Conservation, community, and livelihoods: Sustaining, renewing, and adapting cultural connections to the land. In Principles of Ecosystem Stewardship: Resilience-Based Natural Resource Management in a Changing World; Folke, C., Kofinas, G.P., Chapin, F.S., Eds.; Springer: New York, NY, USA, 2009; pp. 129–147. [Google Scholar]
  96. Nellemann, C.; Cameron, R.D. Cumulative impacts of an evolving oil-field complex on the distribution of calving caribou. Can. J. Zool. 1998, 76, 1425–1430. [Google Scholar] [CrossRef]
  97. Johnson, N.; Alessa, L.; Behe, C.; Danielsen, F.; Gearheard, S.; Gofman-Wallingford, V.; Kliskey, A.; Krümmel, E.-M.; Lynch, A.; Mustonen, T.; et al. The Contributions of Community-Based Monitoring and Traditional Knowledge to Arctic Observing Networks: Reflections on the State of the Field. Arctic 2015, 68, 28–40. [Google Scholar] [CrossRef] [Green Version]
  98. Kouril, D.; Furgal, C.; Whillans, T. Trends and key elements in community-based monitoring: A systematic review of the literature with an emphasis on Arctic and Subarctic regions. Environ. Rev. 2016, 24, 151–163. [Google Scholar] [CrossRef] [Green Version]
  99. Lewkowicz, A.G.; Way, R.G. Extremes of summer climate trigger thousands of thermokarst landslides in a High Arctic environment. Nat. Commun. 2019, 10, 1329. [Google Scholar] [CrossRef] [PubMed] [Green Version]
  100. Smit, B.; Spaling, H. Methods for cumulative effects assessment. Environ. Impact Assess. Rev. 1995, 15, 81–106. [Google Scholar] [CrossRef]
  101. Darvill, R.; Lindo, Z. Quantifying and mapping ecosystem service use across stakeholder groups: Implications for conservation with priorities for cultural values. Ecosyst. Serv. 2015, 13, 153–161. [Google Scholar] [CrossRef]
  102. Chambers, K.J.; Corbett, J.; Keller, C.P.; Wood, C.J. Indigenous Knowledge, Mapping, and GIS: A Diffusion of Innovation Perspective. Cartogr. Int. J. Geogr. Inf. Geovisualization 2004, 39, 19–31. [Google Scholar] [CrossRef]
  103. Chapin, M.; Lamb, Z.; Threlkeld, B. Mapping Indigenous Lands. Annu. Rev. Anthr. 2005, 34, 619–638. [Google Scholar] [CrossRef] [Green Version]
  104. Honda-McNeil, J.; Parsons, D. Best Practices Handbook for Traditional Use Studies; Government of Alberta, Aboriginal Affairs and Northern Development: Edmonton, AB, Canada, 2003. [Google Scholar]
  105. Sipe, N.; Dale, P. Challenges in using geographic information systems (GIS) to understand and control malaria in Indonesia. Malar. J. 2003, 2, 36. [Google Scholar] [CrossRef] [PubMed] [Green Version]
  106. Post, E.; Forchhammer, M.C.; Bret-Harte, M.S.; Callaghan, T.V.; Christensen, T.R.; Elberling, B.; Fox, A.D.; Gilg, O.; Hik, D.S.; Hoye, T.T.; et al. Ecological Dynamics Across the Arctic Associated with Recent Climate Change. Science 2009, 325, 1355–1358. [Google Scholar] [CrossRef] [PubMed] [Green Version]
  107. Séjourné, A.; Costard, F.; Fedorov, A.; Gargani, J.; Skorve, J.; Massé, M.; Mège, D. Evolution of the banks of thermokarst lakes in Central Yakutia (Central Siberia) due to retrogressive thaw slump activity controlled by insolation. Geomorphology 2015, 241, 31–40. [Google Scholar] [CrossRef]
  108. National Inquiry into Missing and Murdered Indigenous Women and Girls. Reclaiming Power and Place: The Final Report of the National Inquiry into Missing and Murdered Indigenous Women and Girls, Volume 1a; National Inquiry into Missing and Murdered Indigenous Women and Girls: Toronto, ON, Canada, 2019. [Google Scholar]
  109. Komarek, T.M. Crime and natural resource booms: Evidence from unconventional natural gas production. Ann. Reg. Sci. 2018, 61, 113–137. [Google Scholar] [CrossRef] [Green Version]
  110. Proverbs, T.A.; Lantz, T.C.; Lord, S.; Amos, A.; Gwich’in Tribal Council Department of Cultural Heritage; Ban, N.C. Social-Ecological Determinants of Access to Fish and Well-Being in Four Gwich’in Communities in Canada’s Northwest Territories. Hum. Ecol. 2020. [Google Scholar] [CrossRef]
Figure 1. Map of the Gwich’in Settlement Region, showing the Gwich’in Settlement Area, Primary Use Area, Secondary Use Area, and communities of Aklavik, Fort McPherson, Inuvik, and Tsiigehtchic.
Sustainability 12 04667 g001
Figure 2. The grid of 3810 planning units in the Gwich’in Settlement Region used to assess documented cultural feature density, cumulative weighted environmental disturbance, and the potential overlap between environmental disturbances and cultural features.
Sustainability 12 04667 g002
Figure 3. Example of the method used to calculate the cultural feature intensity (CFI) in each planning unit before CFI values were scaled from 0–100. The planning unit in this example was modified from a planning unit in the analysis for illustrative purposes by omitting some cultural features. The planning unit above contains one cultural feature point, one polygon of area 436,379 m2, and two lines of combined length 6000 m. The summed cultural feature intensity for the planning unit is 2.22 [1 (archaeological site point) + 0.02 (traditional land use area polygon; 436,379 m2 polygon divided by 25 km2 planning unit) + 1.2 (historic harvesting trail polylines; 6000 m line divided by 5000 m planning unit side length)].
Sustainability 12 04667 g003
Figure 4. Map of the density of documented cultural features per planning unit across ecoregions in the Gwich’in Settlement Region: 1. Tuktoyaktuk Coastal Plain, 2. Dease Arm Plain, 3. British-Richardson Mountains, 4. Mackenzie Delta, 5. Old Crow Basin, 6. Great Bear Lake Plain, 7. Peel River Plateau, 8. Fort McPherson Plain, 9. Eagle Plains, 10. North Ogilvie Mountains, 11. Mackenzie Mountains. Based on their cultural feature intensity (CFI) index, planning units were grouped into five classes representing the density of cultural features they contained: Light (CFI = 0.4–0.8), moderate (CFI = 0.8–2), high (CFI = 2–8), very high (CFI = 8–27), and extreme (CFI = 27–100).
Sustainability 12 04667 g004
Figure 5. Map of weighted environmental disturbance scores per planning unit across ecoregions in the Gwich’in Settlement Region: 1. Tuktoyaktuk Coastal Plain, 2. Dease Arm Plain, 3. British-Richardson Mountains, 4. Mackenzie Delta, 5. Old Crow Basin, 6. Great Bear Lake Plain, 7. Peel River Plateau, 8. Fort McPherson Plain, 9. Eagle Plains, 10. North Ogilvie Mountains, 11. Mackenzie Mountains. Based on their disturbance score, planning units were grouped into six classes representing their cumulative weighted environmental disturbance density: No recorded disturbances (scores = 0), low (scores = >0–0.01), moderately low (scores = 0.01–0.1), moderate (scores = 0.1–1), high (scores = 1–10), and very high (scores = 10–100) disturbance scores.
Sustainability 12 04667 g005
Figure 6. Map of the overlap score conveying the degree of potential overlap among cultural features and environmental disturbances across ecoregions in the Gwich’in Settlement Region: 1. Tuktoyaktuk Coastal Plain, 2. Dease Arm Plain, 3. British-Richardson Mountains, 4. Mackenzie Delta, 5. Old Crow Basin, 6. Great Bear Lake Plain, 7. Peel River Plateau, 8. Fort McPherson Plain, 9. Eagle Plains, 10. North Ogilvie Mountains, 11. Mackenzie Mountains. Based on their overlap score, planning units were grouped into six classes representing the potential severity of cultural and ecological impacts resulting from the amount of overlap between environmental disturbances and cultural features within them: Baseline—no potential overlap recorded (scores = 0), low (scores = >0–0.2), moderately low (scores = 0.2–2), moderate (scores = 2–20), high (scores = 20–200), and very high (scores = 200–2003). Planning units with higher overlap scores represent areas with potentially greater impacts to ecological and cultural features.
Sustainability 12 04667 g006
Table 1. Cultural features data, sources, and information about the contents of each data layer.
Data LayerData TypeLayer ContentsData Sources
Historic harvesting trailsPolylineHarvesting trails used by Dene and Metis trappers in the 1970s in the Gwich’in Settlement Region (GSR) area. Documented in the 1970s on physical maps with one third of active harvesters, and digitized in the 1980s.Gwich’in Tribal Council Department of Cultural Heritage (DCH) (2016a) [43]
Named placesPoint, polygon, polylinePlace names (approximately 900) in the GSR area. Documented from projects conducted by the DCH and others.DCH (2016b) [44]
Traditional land use locationsPoint, polygon, polylineOral history and traditional land use information about wildlife, vegetation, climate, water, trails, and camps. Documented from projects by the DCH and others.DCH (2016c) [45]
Archaeological sitesPointDocumented archaeological sites in the GSR (likely only a fraction of existing sites). Includes features such as camp locations, burial grounds, portages, trading posts, traplines, and lookouts. Documented from multiple projects.Prince of Wales Northern Heritage Centre (2016); Yukon Archaeology Program (2017) [46,47]
Table 2. Environmental disturbance data, weights, disturbance information, and data sources. Table modified from Tyson et al. (2016) [20].
Data LayerRecovery ScoreSeverity ScoreWeightData SourceImpacts of DisturbanceLiterature on Disturbance Impacts
Thaw slumps0.573.5Segal et al. (2016) [55]>Alters soil, lake, and river chemistry; changes vegetation structure and permafrost conditionsLantz & Kokelj (2008); Thienpont et al. (2013); Kokelj et al. (2013) [50,56,57]
Seismic lines0.431.2World Wildlife Fund (2002a); Yukon Highways and Public Works (2014) [58,59]Changes vegetation structure and permafrost conditions; decreases lichen coverKemper & MacDonald (2009); Williams et al. (2013) [60,61]
Dempster Highway (gravel highway)11010World Wildlife Fund (2002b) [62]Permanent right of way; changes vegetation, soil, and permafrost conditionsMyers-Smith et al. (2006); Gill et al. (2014) [63,64]
Drilling mud sumps0.5105World Wildlife Fund (2002c); Yukon Government (2014) [65,66]Changes vegetation structure and composition, topography, and permafrost conditionsJohnstone & Kokelj (2008); Kokelj et al. (2010) [67,68]
Mackenzie Valley Fibre Link (fibre-optic cable)133Mackenzie Valley Land and Water Board (2014) [69]Permanent right of way; changes vegetation structure, permafrost conditions, and soil conditions; decreases lichen coverStantec Consulting Ltd. (2014) [54]
Gravel quarries0.8108Geomatics Yukon (2014); NWT Cumulative Impacts Monitoring Program (2015a) [70,71]Changes vegetation composition and structure, changes soil conditions and lichen coverHarper & Kershaw (1996); Forbes (2009); Koronatova & Milyaeva (2011) [72,73,74]
Community infrastructure11010NWT Cumulative Impacts Monitoring Program (2015b) [75]Permanent settlement; permanent conversion of vegetation, changes soil and permafrost conditions.Raynolds et al. (2014); Johansson et al. (2006) [14,76]
Table 3. The number and percentage of planning units containing different densities of cultural feature categories across planning units in the Gwich’in Settlement Region.
Number of Cultural Feature Categories Per Planning Unit (PU)Number of PUsPercentage of All PUs
045011.81
1107528.22
2124632.70
389823.57
41413.70
Table 4. Average cultural feature intensity per planning unit, and the number and percentage of planning units in each cultural feature intensity range.
Cultural Feature Intensity (Range)Average Cultural Feature Intensity Per Planning Unit (PU)Number of PUsPercentage of All PUs
Light (0.4–0.8)0.4780321.08
Moderate (0.8–2)1.4896425.30
High (2–8)4.21125432.91
Very high (8–27)13.5071618.79
Extreme (27–100)41.19731.92
Table 5. The number and percentage of planning units containing different densities of disturbance types across planning units in the Gwich’in Settlement Region.
Number of Disturbance Types Per Planning Unit (PU)Number of PUsPercentage of All PUsPercentage of Disturbed PUs
0173445.51-
1158441.5776.30
243711.4721.05
3431.132.07
480.210.39
530.080.14
610.030.05
7000
Table 6. Average disturbance score per planning unit and the number and percentage of planning units in each disturbance score range.
Disturbance Score (Range)Average Disturbance Score Per Planning Unit (PU)Number of PUsPercentage of All PUsPercentage of Disturbed PUs
None recorded (0)-173445.51-
Low (>0–0.01)0.0042105.5110.12
Moderately low (0.01–0.1)0.05109928.8552.94
Moderate (0.1–1)0.2168718.0333.09
High (1–10)2.35701.843.37
Very high (10–100)32.78100.260.48
Table 7. Average overlap score per planning unit and the number and percentage of planning units in each overlap score range.
Overlap Score (Range)Average Overlap Score Per Planning Unit (PU)Number of PUsPercentage of All PUsPercentage of PUs with Overlap
Baseline - none recorded (0)-173445.51-
Low (>0–0.2)0.07106127.8551.11
Moderately low (0.2–2)0.6776920.1837.04
Moderate (2–20)4.872085.4610.02
High (20–200)46.39330.871.59
Very high (200–2003)1130.7550.130.24
Table 8. Contribution of environmental disturbance types to the total disturbance score across the five overlap score ranges. Values represent the percentage of the total disturbance score in each overlap score range attributed to each disturbance type.
Overlap Score Range
LowModerately LowModerateHighVery HighTotal
Disturbance TypePercentage of the Total Disturbance Score in Each Overlap Score Range
Thaw slumps34.7950.8320.780.900.0114.82
Seismic lines59.8629.595.940.640.1710.67
Dempster Highway0.3410.5546.4128.754.8618.75
Drilling mud sumps3.254.392.370.190.341.55
Mackenzie Valley Fibre Link1.762.740.430.210.130.74
Gravel quarries01.9016.7120.393.419.33
Community infrastructure007.3648.9291.0844.14
Table 9. Contribution of cultural feature categories to the total cultural feature intensity across the five overlap score ranges. Values represent the percentage of the total cultural feature intensity in each overlap score range attributed to each cultural feature category. Some of this percentage is attributed to the planning units that did not contain documented cultural features, but that were given a cultural feature intensity value of “1” due to the baseline of cultural activity ascribed to each planning unit.
Overlap Score Range
LowModerately LowModerateHighVery HighTotal
Cultural Feature CategoryPercentage of the Total Cultural Feature Intensity in Each Overlap Score Range
Historic harvesting trails68.6280.9391.6990.1494.6480.89
Named places5.673.912.771.781.054.05
Traditional land use locations9.438.972.842.833.056.95
Archaeological sites0.461.240.443.080.470.82
Planning units with no documented cultural features15.824.952.262.170.797.29

