Article

Pelletization of Refuse-Derived Fuel with Varying Compositions of Plastic, Paper, Organic and Wood

1
Chemical and Biological Engineering Department, University of British Columbia, Vancouver, BC V6T 1Z3, Canada
2
Chemical and Biological Engineering Department, University of Saskatchewan, Saskatoon, SK 3B48, Canada
*
Author to whom correspondence should be addressed.
Sustainability 2020, 12(11), 4645; https://doi.org/10.3390/su12114645
Submission received: 26 May 2020 / Revised: 3 June 2020 / Accepted: 4 June 2020 / Published: 6 June 2020

Abstract

:
The combustible fraction of municipal solid waste (MSW) is called refuse-derived fuel (RDF). RDF is a blend of heterogeneous materials and thus its handling is challenging. Pelletization is an efficient treatment to minimize the heterogeneity. In this research, typical RDF compositions were prepared by mixing several mass fractions of paper, plastic, household organic and wood. The collected compositions were ground, wetted to 20% moisture content (wet basis) and pelletized. Increasing the plastic content from 20% to 40% reduced the pelletization energy but increased the pellet’s calorific value. Pellets with higher plastic content generated more dust when exposed to shaking. Making durable pellets with 40% plastic content needed an increase in die temperature from 80 °C to 100 °C. Increasing the paper content from 30% to 50% increased the durability but consumed higher energy to form pellets. Paper particles increased the friction between pellet’s surface and die wall as was evident from expulsion energy. Force versus displacement curve for material compression revealed that the RDF compositions have rigid material characteristics.

1. Introduction

Municipal solid waste (MSW) management is becoming complicated by the exponential growth of the global population [1]. Although recycling technologies are getting more advanced, a significant portion of MSW still ends up in landfills [2]. Burying waste in landfills leaches the toxins into the soil and water, and emits greenhouse gases like methane and carbon dioxide [3,4]. Landfilling is a big loss of resources such as material, energy and the valuable land used up for landfill sites [5,6]. A substantial reduction in landfilling is the ultimate goal of efficient waste management [2,7,8,9].
MSW consists of three major fractions of combustible, non-combustible and moisture or evaporative material [10,11]. The combustibles that are called “refuse-derived fuel (RDF)” are separated in sorting facilities [10,12,13]. RDF is combusted individually or co-fired in the cement kilns [14,15,16], steel furnaces, power stations [17], or incinerated in energy-from-waste plants [5,18,19]. The heterogeneous physical properties create problems during material flow [20]. For instance, the industrial pneumatic flow of RDF is not feasible, because the RDF components have different density values. Airflow carries the light plastic and papers and the heavy components remain in feeding lines [20]. Making the pellet form of solid waste reduces the variability in size, moisture and density. Using pellet form of feedstock facilitates the handling and flowability of material [21,22,23,24].
Densification data for cellulosic biomass pelletizing is available [25,26,27], but these data do not apply to RDF pelletization. Sprenger et al. [28,29] investigated the pellet density of an RDF composition with fractions of 35% paper, 22% plastics, 14% fabrics, 6% organics/woods and 23% fines. The nature or source of fines was not revealed. Sprenger et al. did not investigate variations in RDF composition. In the previous study, Rezaei et al. [30] densified an RDF with 20% plastic, 50% mixture of paper and cardboard, 20% food residue organics and 10% wood. They concluded that for this specific composition a knife mill equipped with a 4-mm screen wetted to 20% moisture content produced the most durable pellets with the minimum energy intake [30].
RDF composition varies with season, location of waste collection and efficiency of MSW sorting. Reviewing the data from sorting facilities showed that four major fractions of 15–35% plastic, 15–50% cellulosic paper and cardboard, 2–10% wood, 5–20% organics and about 5–10% non-combustibles present in a typical RDF [4,15,31]. The United States Environmental Protection Agency, EPA (2012) [32] also reported a similar range of RDF composition. The collected data from material recovery facilities revealed that the RDF composition varies from batch to batch, too. Bessi et al. [31] classified the processed and sorted an MSW stream with a composition of 35% paper, 24% plastic, 10% organics and 5% wood. The rest was textiles and some other inert materials. Casado et al. [4] investigated the RDF samples produced from a different MSW sorting stream and reported an average composition of ~20% combination of hard and soft plastics, 48.5% paper, 15% mixture of wood and textile, 15.3% organic matter and the rest was non-combustibles. Fyffe et al. [15] used a waste stream with the composition of 25% plastics, 45% paper, 17% organics and 6% wood as an alternative solid fuel in cement kilns. None of these blends were pelletized. We concluded that a range of 20% to 40% plastic, 30% to 50% paper, 10% to 20% organic, and 10% wood are typical ranges of reported compositions.
The literature review revealed that the densification of RDF is still an unrecognized topic. There is a lack of experimental data and optimization for pelletization of RDF. The current research analyses the densification behavior of prepared waste compositions with variation in fractions of plastic, paper and organics in the blend. The percent of wood was kept fixed at 10%. The analysis included force versus deformation data taken during RDF compaction and pellets expulsion from the die. The durability of pellets is analyzed and reported. A successful RDF pelletization is a promising approach to convert the solid waste into a standard solid fuel.

2. Material and Methods

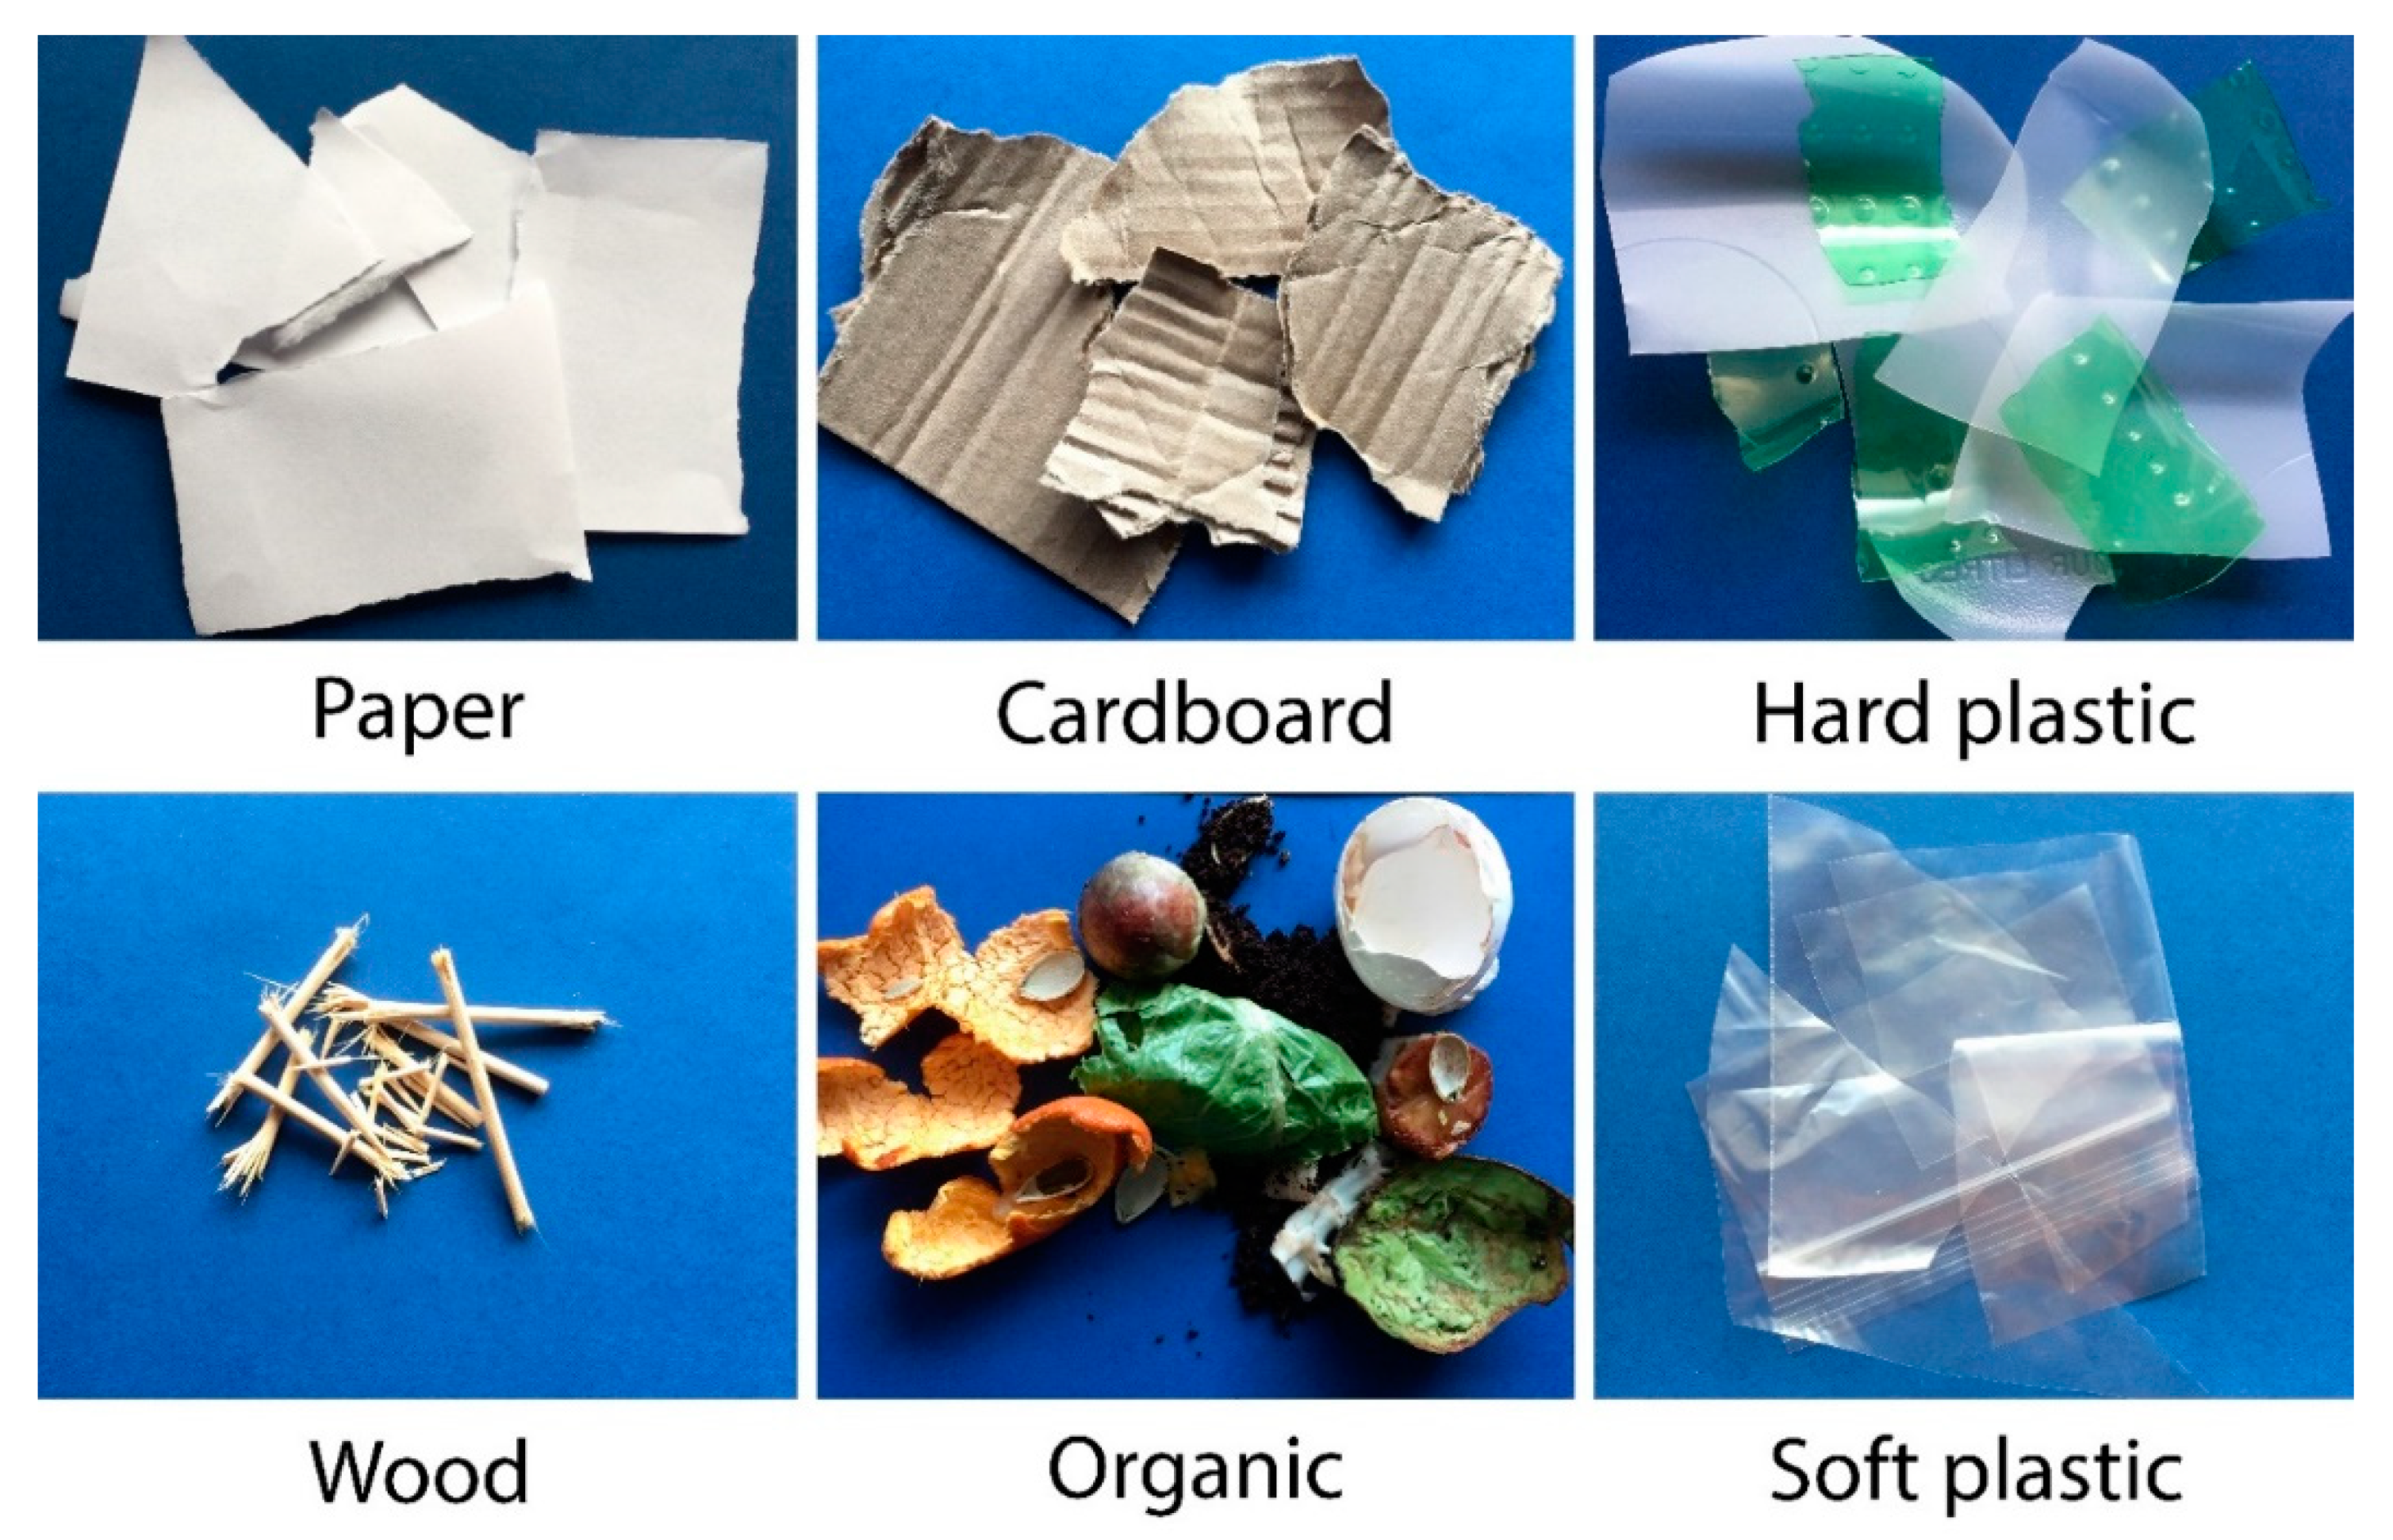
2.1. Preparation of RDF Compositions

Batches of RDF were prepared by mixing four components of plastics, paper, organics, and wood (Figure 1). Rezaei et al. [30] described the details and specifications of the collected fractions. The collected plastic fraction was a combination of hard plastics cut from milk and juice containers and pieces of plastic film. Plastics were cut into 80–100 mm pieces using a scissor. Paper waste was collected from office scrap papers. Papers were inspected visually to ensure no ink and plastic film layer. Cardboard pieces were cut from a packaging grocery box. Papers and cardboards were manually ripped to 50–120 mm pieces. Organic fraction was collected from the organic waste bin of several households over 7 days. The fraction consisted of mostly the food residue ranging in size from 1-mm ground coffee particles up to the size of whole fruit like apple, orange or tomato. Large food items were cut into small pieces using a knife. Collected wood was shredded pine wood chips 5–20 mm in length.
The materials were individually dried in an oven (THELCO laboratory PRECISION oven, Thermo Electron Corporation, Model 6550, USA) at 50 °C over a 24-h period. Table 1 lists the as-received moisture content and dry-basis calorific value of individual fractions. Each component was ground individually using a knife mill (Retsch, model: SM 100) installed with a 4-mm diagonal dimension perforations screen.
The ground materials were mixed with four fractions listed in Table 1. Each blend was moistened to 20.0% ± 0.5% (wet basis) by spraying water while rotating and agitating the material. The moistened blends were each sealed in a glass jar and stored at room temperature for 48 h. The glass jar was intermittently rotated for uniform wetting. Moisture content of samples were measured after 48 h using a moisture analyzer (AND, model: MF-50, a precision of 0.05%).

2.2. Particle Size, Bulk Density, and Calorific Value

The ANSI/ASAE S319.4 Standard outlined the procedure to analyze particle size distribution. Mesh sieves of 0.25, 0.5, 1.0, 1.4, 2.0, 3.35 and 4.0 mm were stacked in a tap sieve shaker (Ro-Tap RX 94) with a 10-min roto-tap, shaking and tapping process. The mass retained on each sieve was measured to two decimal gram precision. Bulk density was measured by following the ASTM E1109-86 Standard. A constant mass of each sample was gently poured into a graduated cylinder. The volume of loose compositions was recorded. The ratio of measured mass to recorded volume was noted as the bulk density. Heating value was measured by the procedures outlined in ASTM D5865-13 Standard. The measurement was conducted using a bomb calorimeter (Parr Calorimeter, model 6100, USA). Approximately, 0.50 g of each waste fraction was initially oven dried. Dried samples were prepared to burn using an electrical wire passing through each sample in an oxygen bomb vessel. The produced heat of combustion was adsorbed by the water jacket. The calorific value of samples was calculated using the temperature rise in the water jacket. Rezaei et al. [22,33,34] explained the procedure for measurement of particle size distribution, bulk density and calorific value.

2.3. Pelletization

Pellets were made using a universal testing instrument (Measurements Technology Inc., Universal Testing Machine, Model MTI-50K). Figure 2 shows the stages of pelletization in the single pellet die. The single pellet unit was made up of a cylindrical die and piston assembly. A piece of removable solid steel block placed under the lower end of the cylinder. The block could be removed after making a pellet to allow the pellet exit from the bottom of the cylinder. A controlled electrical heat tape was wrapped around the die. Before each test, the die was heated to either 80 or 100 °C. The purpose of this study was not to investigate the influence of die temperature. All RDF compositions were densified at 80 °C. The sample with the highest plastic content (composition 3) was also densified at 100 °C. The cylinder-piston assembly with the removable block was placed under the moving head of the MTI. About 0.42 ± 0.01 g of each blend was inserted inside the cylinder. The MTI piston was programmed to travel downward at a rate of 6 mm/min for compression. The maximum force was set at 5000 N. With respect to the 6.35 mm die internal diameter, the maximum applied pressure was ~158 MPa. After reaching the maximum force, the formed pellet rested into the die for 30 s. The steel block was removed and allowed the downward piston movement at a rate of 15 mm/min to push the pellets out of the cylinder. Table 2 lists the operational parameters for pelletization. A batch of 10 pellets was produced and stored in individual glass vials for further analysis.
The software of pellet press recorded the force versus displacement. Rezaei et al. [30] and Nielsen et al. [35] described the analysis of force versus deformation data to characterize a pelletization process. The consumed energy was calculated from the numerical integration of force versus displacement data.

2.4. Pellet Durability

A single pellet durability analyzer was used to measure single pellet durability. This apparatus was developed to measure the durability of a small amount of pellet samples. The details of the developed technique were described by Schilling et al. [36]. This machine consisted of a cubic container with an inner dimension of 60 mm × 60 mm × 60 mm, attached to the arm of a wrist action shaker (BURREL shaker, Model 75). A weighed single pellet along with a steel pellet (diameter of 6.3 mm and 24 mm long) were placed in the container. After shaking the container for 10 min, its contents were sieved (3.15 mm opening size) and the generated broken particles and dust were separated. The remaining mass on the sieve was weighed in mg to one decimal precision. The durability was calculated as the ratio of mass on the sieve over the original mass of the pellet (EN 15210-1 Standard).

3. Results and Discussion

3.1. Ground Composition Characterization
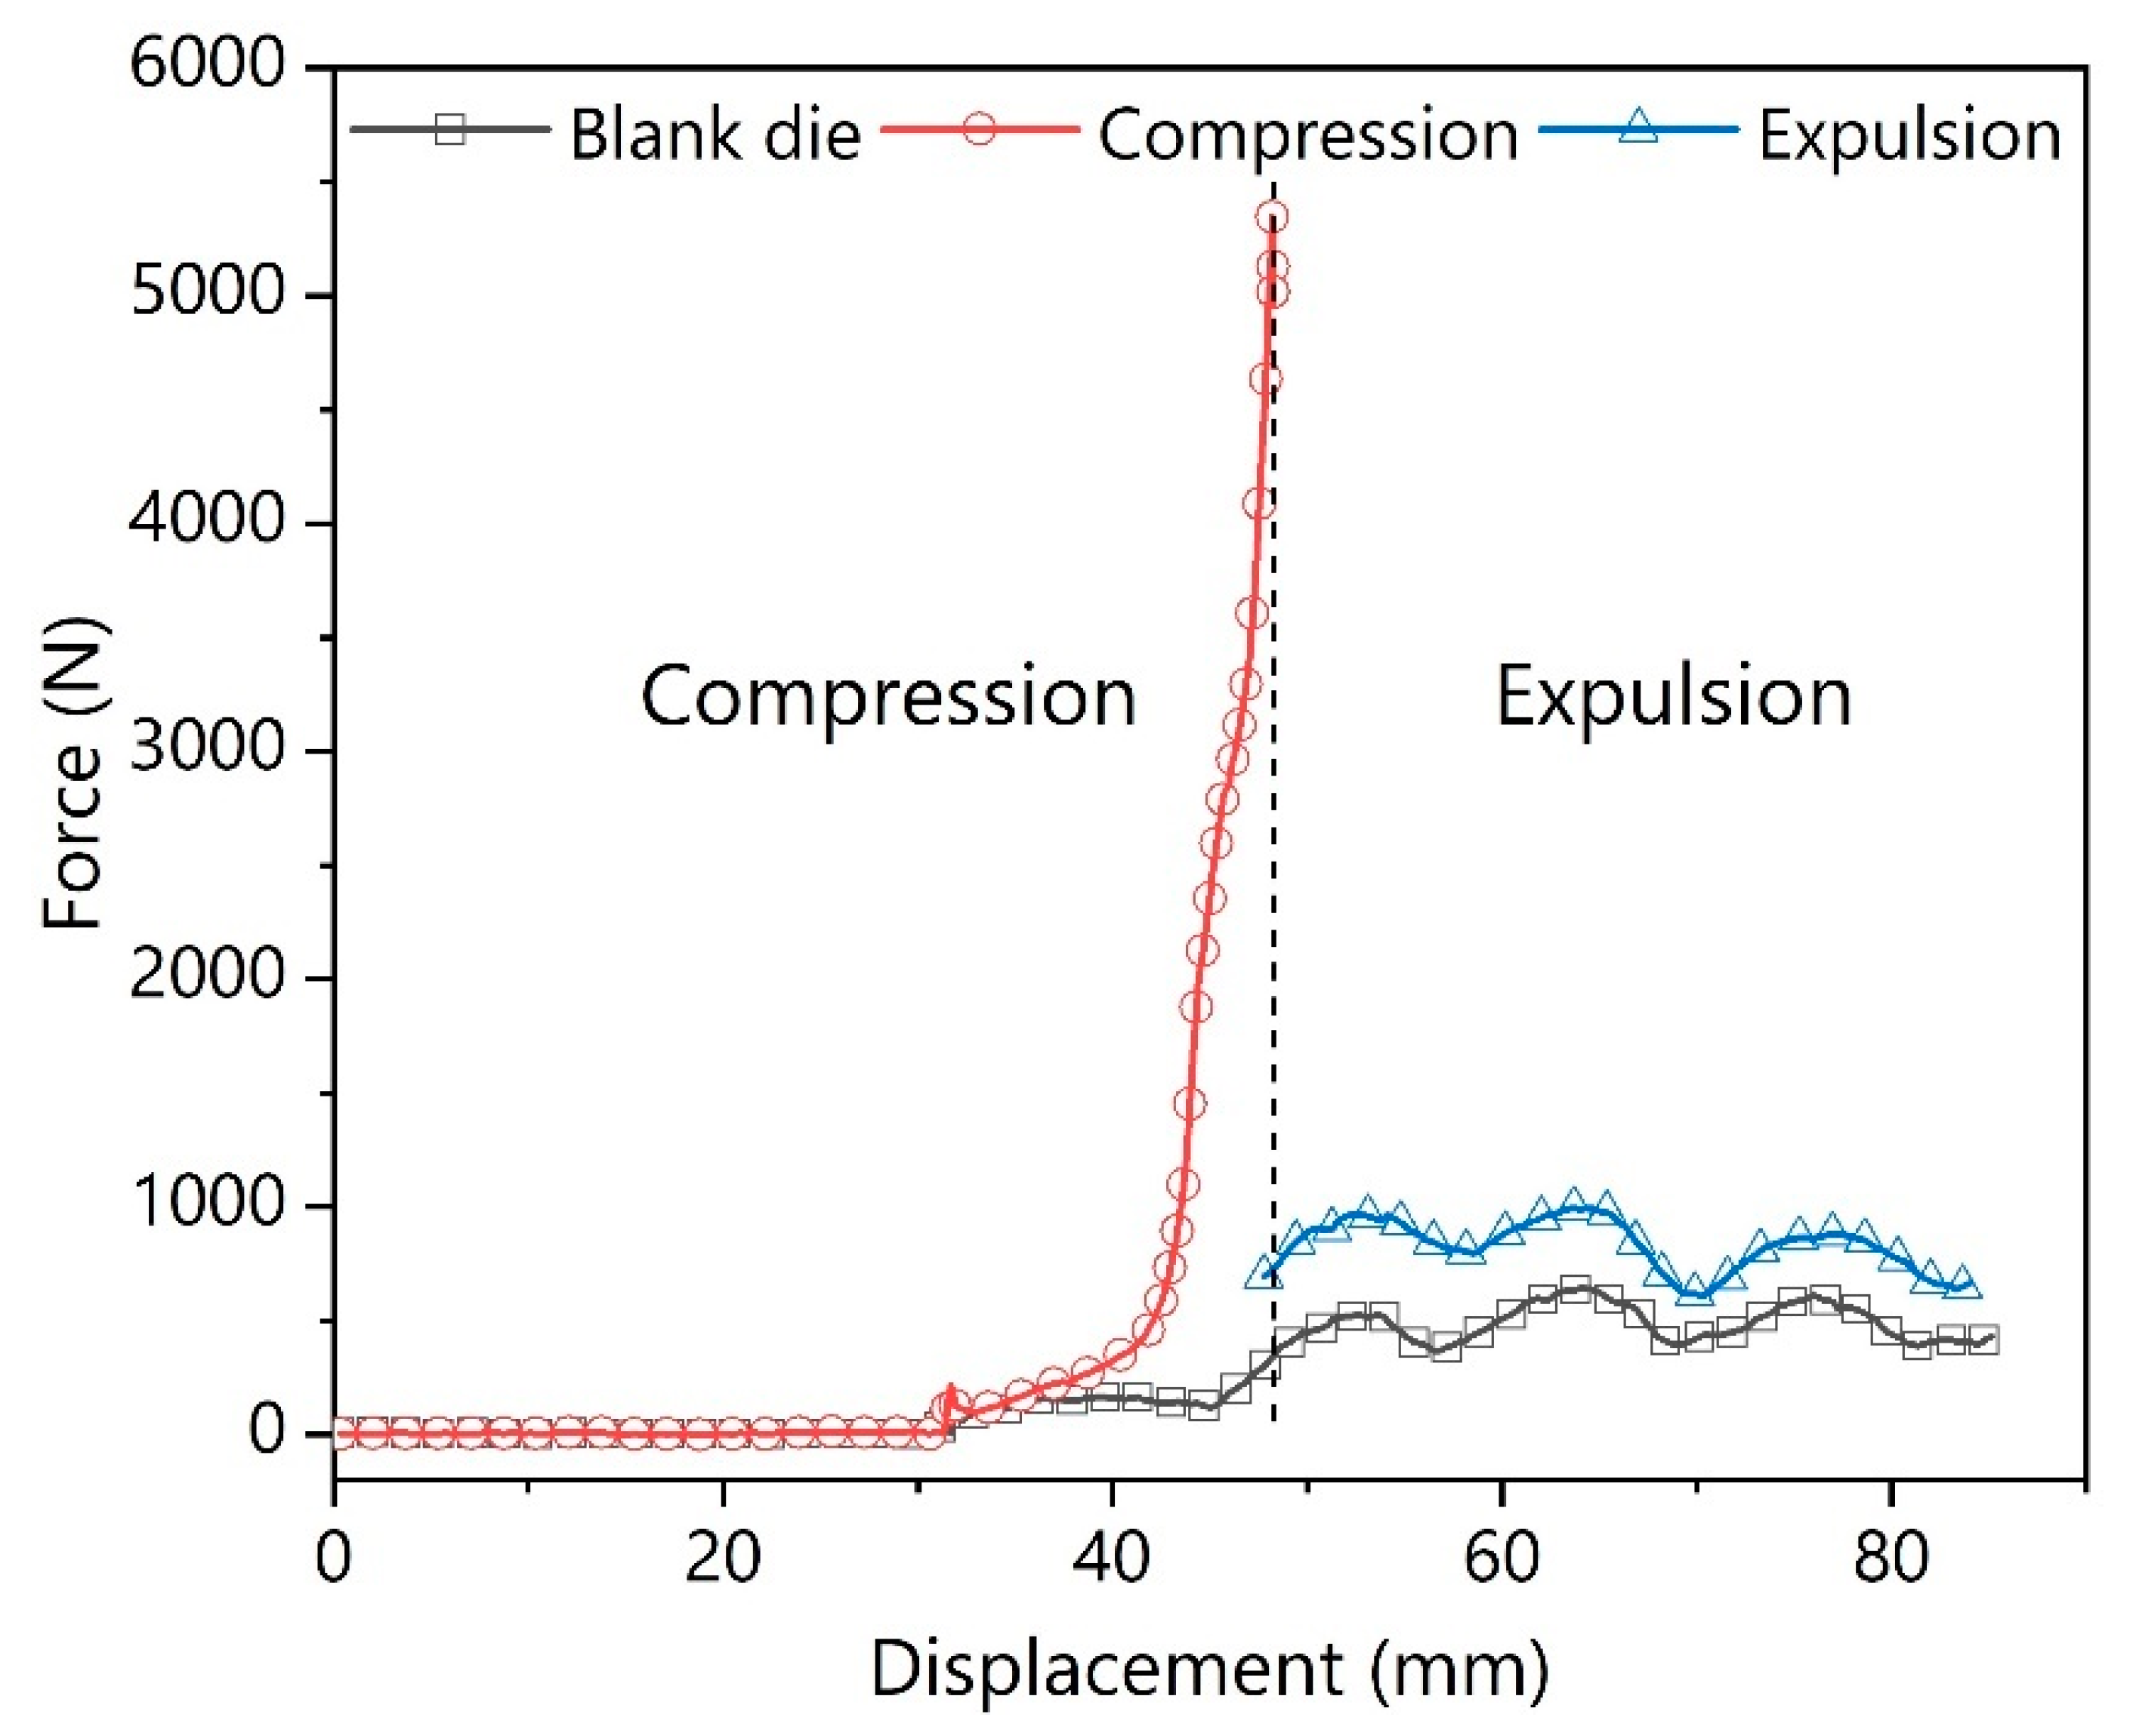
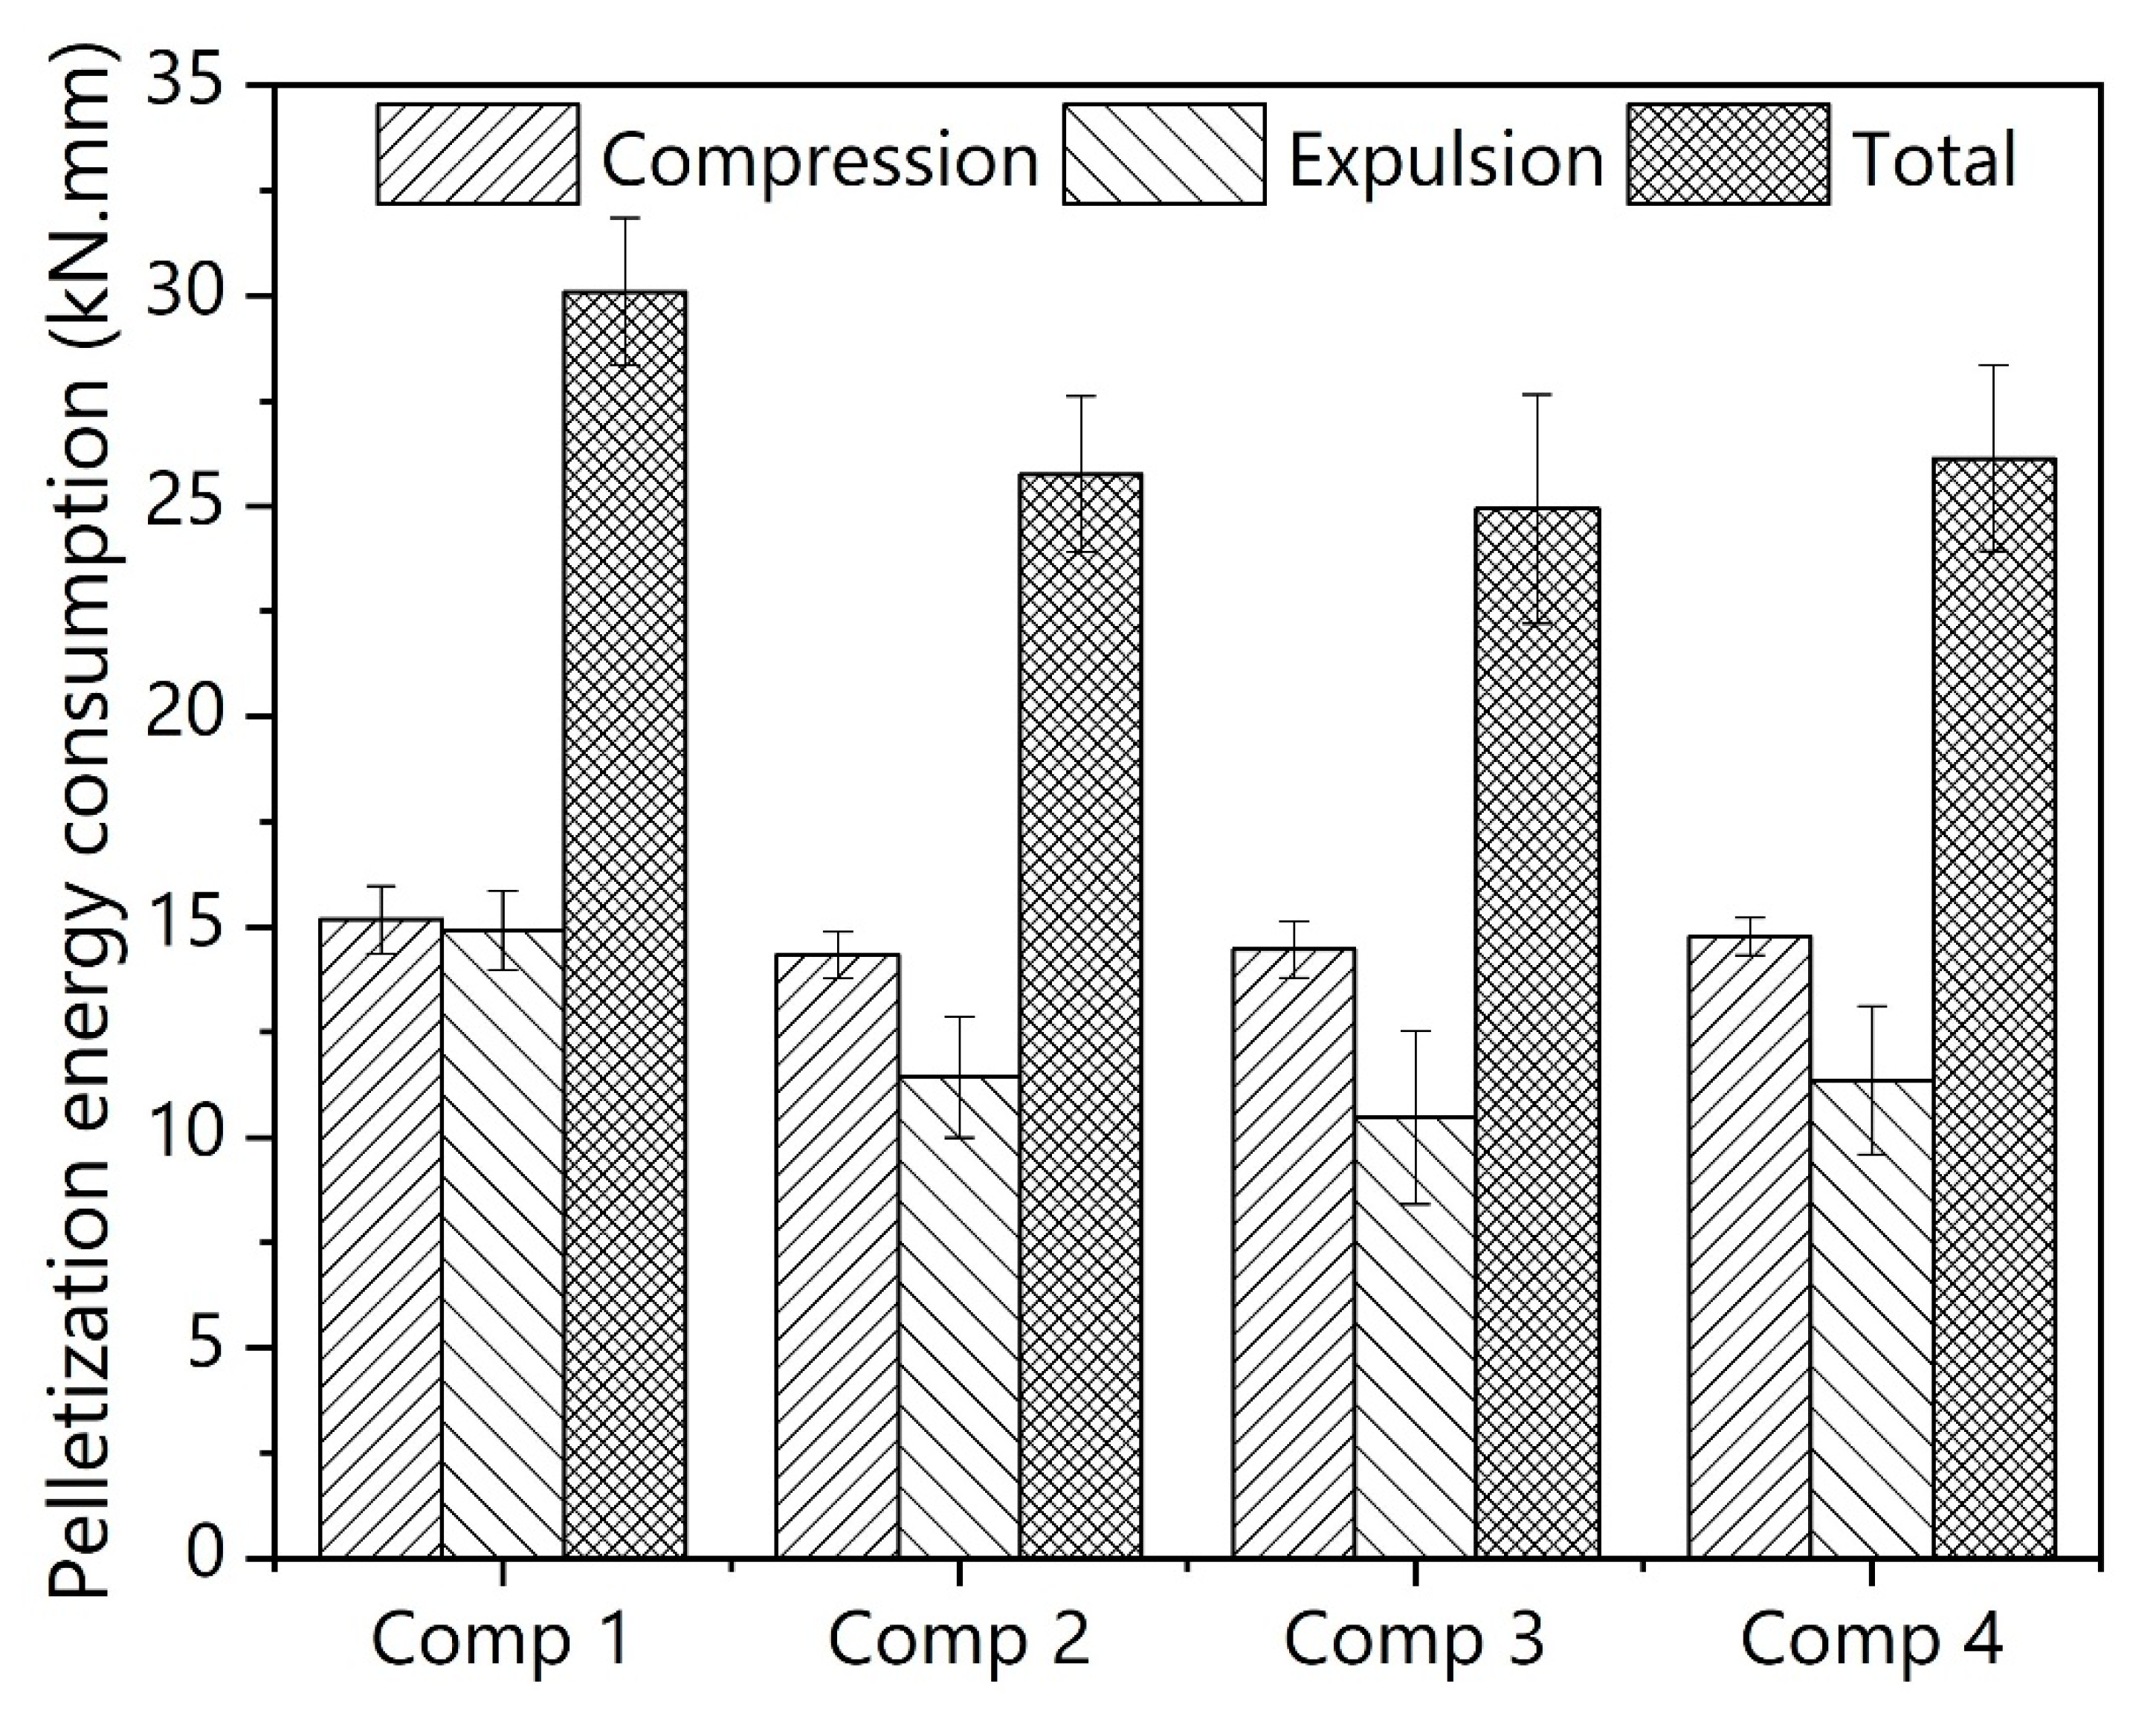
Figure 3 shows the particle size distribution (PSD) of the blended RDF with four compositions. The opening size of the grinder screen was 4 mm; almost the entire ground compositions had particles smaller than 2 mm. Grinding paper generated larger particles than grinding other components. Larger paper content shifted the PSD to the larger particles. The peak of the PSD bar graph for composition 1 with 50% paper and 20% plastic was ~1.5–2.0 mm. The peak for composition 3 with 30% paper and 40% plastic was ~1 mm. Paper particles made a fluffy bulk and had a high tendency to interlock, interfering with the free flowing of the material. Table 3 lists the bulk density of RDF compositions. Increasing the paper content reduced the bulk density, increasing plastic content increased bulk density.
The heating value of plastic at 46.55 MJ/kg was three times the heating value of paper at 15.8 MJ/kg (Table 1). The presence of high-density polymers with long carbon chains [37] contributes to high heating value. Dry organic and dry wood fractions have a similar heating value at around 21 MJ/kg. Composition 3, with the highest plastic content and the lowest paper content, had the highest overall heating value of ~30 MJ/kg.

3.2. RDF Compaction

Figure 4 shows a typical force versus displacement curve for an RDF composition during compaction in the pellet die. The compaction increased until the applied force reached 5000 N at which compression stopped. During the first 80% of the compression cycle, particles only rearranged in the die and required a small amount of force. Rearrangement removed the void fraction of the bulk among the particles. For the last 20% of the compression cycle, the displacement was due to particle deformation. This stage contributed to forming dense pellets with an interlocked structure. The length of time for the particles to rearrange and to deform varied with composition. Paper made the rearrangement stage longer, plastic made it shorter.
Table 3 lists the densification ratio and density of the samples at the beginning and at the end of the compression stage with a die temperature of 80 °C. The densification ratio is calculated by dividing the volumes of the RDF inside the die over the volume of the RDF after compression. Densification ratio has a direct correlation with paper content. Compositions 1 and 4, with 50% paper content, had the highest densification ratios of 10.6 and 10.2, respectively. Such high densification ratios resulted in denser pellets. Pellets produced from compositions 1 and 4 had densities of 1150 and 1200 kg/m3, respectively. Reducing the paper content to 30% in composition 3 lowered the densification ratio to 6.5. For this composition, the pellet density decreased to 1040 kg/m3.
The steep rise of the required force in the deformation stage of the pelletization curve showed that the tested RDF samples were rigid and exhibited low deformation. For this type of material, after the full rearrangement of particles, a large force is required to make a small displacement. Analyzing the cumulative fraction of compression energy input at each level of displacement revealed that in the first 80% of displacement, only 5% of total energy was used. About 72% of the required compression energy was used during the last 5% of displacement.
Figure 4 also shows the force versus displacement plot during the expulsion of the pellet from die. The applied force to push the pellet with a constant displacement rate shows a cyclic variation, probably due to cycling compression and relaxation inside the die. Blank test force measurement shows the friction in the empty die assembly. The measured force in the blank test was excluded from the pelletization force measured for each composition. The measured force in the expulsion stage represents the friction between the pellet’s outer surface and the die’s internal surface. The area beneath each part of the curve represents the required energy to complete each stage.
Figure 5 shows the energy input in each pelletization stage for four compositions. All compositions consumed a similar compression energy input, but the expulsion energy input varied with composition. Increasing the paper content from 30% in composition 3 to 50% in composition 1 required more energy. The paper contained cellulosic fibers, which caused large friction with the die internal surface compared to other fractions. Increasing the plastic content from 20% in composition 1 to 40% in composition 3 reduced the expulsion energy. Softened plastic particles inside the hot pellet die facilitated the expulsion of the material. Low paper content and high plastic content minimized the total energy requirement.
Paper content increased pellet durability (Table 4). As previously mentioned, the interlocking of the paper particles improved durability. Durability analysis showed that paper had a strong influence on strengthen the pellet structure. Compositions 1 and 4 had the highest paper content of 50% and their durability values were ~92%.
The plastic content was supposed to soften and act as a binder in the pellet structure, but this effect was not observed at 80 °C. When plastic content increased to 40% in composition 3, pellets were bent from the point with the maximum plastic accumulation (Figure 6). This means that 80 °C was not hot enough to melt the plastics through the pellet structure. The increase in plastic made pellets more fragile during the durability tests. Durability of composition 3 with 40% plastic and 30% paper content was ~50%, while the durability of composition 1 with 20% plastic and 50% paper was larger than 90%.
The hypothesis was that sufficient heat should be provided to melt the plastic particles, especially the hard plastic to strengthen the pellet structure. As a follow-up, composition 3 was pelletized at 100 °C die temperature. The pellets did not bend and kept their shape during the 5-day storage period in an open environment. The durability of pellets increased from 51% at 80 °C to 94% at 100 °C. Elevating the die temperature did not increase pelletization energy but reduced the variability of measurements. We concluded that the plastic content of 40% needed a temperature of at least 100 °C to produce durable pellets.
Analysis of variance (ANOVA) in Table 5 showed that plastic content had a larger impact than paper content on the energy consumption, while the paper content had a larger influence on pellet durability (compare the F-values). In hindsight, we should have had a larger sample size and variation in fractions in order to develop a full regression analysis. That analysis would have revealed a full interaction of the levels of the composition fractions in the blend.

4. Conclusions

This research presented the pelletization of RDF samples made up of several proportions of paper, plastic and organic material. The fraction of wood in the sample did not vary. The experimental data confirmed that paper and plastic had opposite influences on pelletization performance. Higher paper content increased the total energy for compaction but generated a higher durable pellet. Higher plastic content lowered the pellet durability at 80 °C but increased durability considerably at 100 °C pelletization temperature. The plastic fraction that was prepared in this study had the highest heating value of 46.5 MJ/kg and paper had the lowest heating value of ~15 MJ/kg. Composition 3 with the highest plastic and minimum paper content generated pellets with an overall heating value of ~30 MJ/kg. As the plastic content contributed to the higher calorific value, it is suggested to use high plastic content and operate at a temperature higher than plastic’s softening point, that is, greater than 100 °C.

Author Contributions

Conceptualization, H.R., S.S. and C.J.L.; methodology, H.R.; formal analysis, H.R.; resources, H.R. and F.Y.P.; data curation, H.R. and S.S.; writing—original draft preparation, H.R.; writing—review and editing, H.R., F.Y.P., C.J.L. and S.S.; visualization, H.R.; supervision, S.S.; project administration, H.R. and F.Y.P.; funding acquisition, S.S. All authors have read and agreed to the published version of the manuscript.

Funding

This research was funded by Mitacs Canada grant number of IT14044.

Conflicts of Interest

The authors declare no conflict of interest.

References

  1. Caputo, A.C.; Pelagagge, P.M. RDF production plants: II Economics and profitability. Appl. Therm. Eng. 2002, 22, 439–448. [Google Scholar] [CrossRef]
  2. Sarc, R.; Lorber, K.E. Production, quality and quality assurance of Refuse Derived Fuels (RDFs). Waste Manag. 2013, 33, 1825–1834. [Google Scholar] [CrossRef] [PubMed]
  3. Alter, H. The “Recycling” of Densified Refuse-Derived Fuel. Waste Manag. Res. 1996, 14, 311–317. [Google Scholar] [CrossRef]
  4. Casado, R.R.; Rivera, J.A.; García, E.B.; Cuadrado, R.E.; Llorente, M.F.; Sevillano, R.B.; Delgado, A.P. Classification and characterisation of SRF produced from different flows of processed MSW in the Navarra region and its co-combustion performance with olive tree pruning residues. Waste Manag. 2016, 47, 206–216. [Google Scholar] [CrossRef] [PubMed]
  5. Grosso, M.; Dellavedova, S.; Rigamonti, L.; Scotti, S. Case study of an MBT plant producing SRF for cement kiln co-combustion, coupled with a bioreactor landfill for process residues. Waste Manag. 2016, 47, 267–275. [Google Scholar] [CrossRef]
  6. Tanigaki, N.; Ishida, Y.; Osada, M. A case-study of landfill minimization and material recovery via waste co-gasification in a new waste management scheme. Waste Manag. 2015, 37, 137–146. [Google Scholar] [CrossRef]
  7. Ayvaz-Cavdaroglu, N.; Coban, A.; Firtina-Ertis, I. Municipal solid waste management via mathematical modeling: A case study in İstanbul, Turkey. J. Environ. Manag. 2019, 244, 362–369. [Google Scholar] [CrossRef]
  8. Chang, Y.-H.; Chen, W.C.; Chang, N.-B. Comparative evaluation of RDF and MSW incineration. J. Hazard. Mater. 1998, 58, 33–45. [Google Scholar] [CrossRef]
  9. Rada, E.C. Present and future of SRF. Waste Manag. 2016, 47, 155–156. [Google Scholar] [CrossRef]
  10. Caputo, A.C.; Pelagagge, P.M. RDF production plants: I Design and costs. Appl. Therm. Eng. 2002, 22, 423–437. [Google Scholar] [CrossRef]
  11. Infiesta, L.R.; Ferreira, C.R.N.; Trovó, A.G.; Borges, V.L.; Carvalho, S.R. Design of an industrial solid waste processing line to produce refuse-derived fuel. J. Environ. Manag. 2019, 236, 715–719. [Google Scholar] [CrossRef] [PubMed]
  12. Guo, Y.; Li, Y.; Lou, X.; Guan, J.; Li, Y.; Mai, X.; Liu, H.; Zhao, C.X.; Wang, N.; Yan, C.; et al. Improved extraction of cobalt and lithium by reductive acid from spent lithium-ion batteries via mechanical activation process. J. Mater. Sci. 2018, 53, 13790–13800. [Google Scholar] [CrossRef]
  13. Tomasek, S.; Varga, Z.; Hancsók, J. Production of jet fuel from cracked fractions of waste polypropylene and polyethylene. Fuel Process. Technol. 2020, 197, 106197. [Google Scholar] [CrossRef]
  14. Alter, H. The history of refuse-derived fuels. Resour. Conserv. 1987, 15, 251–275. [Google Scholar] [CrossRef]
  15. Fyffe, J.R.; Breckel, A.C.; Townsend, A.K.; Webber, M.E. Use of MRF residue as alternative fuel in cement production. Waste Manag. 2016, 47, 276–284. [Google Scholar] [CrossRef]
  16. Georgiopoulou, M.; Lyberatos, G. Life cycle assessment of the use of alternative fuels in cement kilns: A case study. J. Environ. Manag. 2018, 216, 224–234. [Google Scholar] [CrossRef]
  17. Ko, A.S.; Chang, N.-B. Optimal planning of co-firing alternative fuels with coal in a power plant by grey nonlinear mixed integer programming model. J. Environ. Manag. 2008, 88, 11–27. [Google Scholar] [CrossRef]
  18. Seljak, T.; Katrašnik, T. Designing the microturbine engine for waste-derived fuels. Waste Manag. 2016, 47, 299–310. [Google Scholar] [CrossRef]
  19. Sever Akdağ, A.; Atımtay, A.; Sanin, F.D. Comparison of fuel value and combustion characteristics of two different RDF samples. Waste Manag. 2016, 47, 217–224. [Google Scholar] [CrossRef]
  20. Dunnu, G.; Maier, J.; Schnell, U.; Scheffknecht, G. Drag coefficient of Solid Recovered Fuels (SRF). Fuel 2010, 89, 4053–4057. [Google Scholar] [CrossRef]
  21. Soleimani, M.; Tabil, X.L.; Grewal, R.; Tabil, L.G. Carbohydrates as binders in biomass densification for biochemical and thermochemical processes. Fuel 2017, 193, 134–141. [Google Scholar] [CrossRef]
  22. Rezaei, H. Physical and Thermal Characterization of Ground Wood Chip and Ground Wood Pellet Particles. Ph.D. Thesis, University of British Columbia (UBC), Vancouver, BC, Canada, 2017. [Google Scholar]
  23. Larsson, S.H.; Lestander, T.A.; Crompton, D.; Melin, S.; Sokhansanj, S. Temperature patterns in large scale wood pellet silo storage. Appl. Energy 2012, 92, 322–327. [Google Scholar] [CrossRef]
  24. Lam, P.S.; Sokhansanj, S.; Bi, X.T.; Lim, C.J.; Melin, S. Energy Input and Quality of Pellets Made from Steam-Exploded Douglas Fir (Pseudotsuga menziesii). Energy Fuels 2011, 25, 1521–1528. [Google Scholar] [CrossRef]
  25. Lam, P.Y.; Lam, P.S.; Sokhansanj, S.; Bi, X.T.; Lim, C.J.; Melin, S. Effects of pelletization conditions on breaking strength and dimensional stability of Douglas fir pellet. Fuel 2014, 117, 1085–1092. [Google Scholar] [CrossRef]
  26. Brigagão, G.V.; de Queiroz Fernandes Araújo, O.; de Medeiros, J.L.; Mikulcic, H.; Duic, N. A techno-economic analysis of thermochemical pathways for corncob-to-energy: Fast pyrolysis to bio-oil, gasification to methanol and combustion to electricity. Fuel Process. Technol. 2019, 193, 102–113. [Google Scholar] [CrossRef]
  27. Rajput, S.P.; Jadhav, S.V.; Thorat, B.N. Methods to improve properties of fuel pellets obtained from different biomass sources: Effect of biomass blends and binders. Fuel Process. Technol. 2020, 199, 106255. [Google Scholar] [CrossRef]
  28. Sprenger, C.J.; Tabil, L.G.; Soleimani, M.; Agnew, J.; Harrison, A. Pelletization of Refuse-Derived Fuel Fluff to Produce High Quality Feedstock. J. Energy Resour. Technol. 2018, 140, 042003. [Google Scholar] [CrossRef]
  29. Sprenger, C.; Tabil, L.G.; Soleimani, M. Compression and Relaxation Properties of Municipal Solid Waste Refuse-Derived Fuel Fluff. KONA Powder Part. J. 2018, 35, 200–208. [Google Scholar] [CrossRef] [Green Version]
  30. Rezaei, H.; Yazdanpanah, F.; Lim, C.J.; Sokhansanj, S. Pelletization properties of refuse-derived fuel—Effects of particle size and moisture content. Fuel Process. Technol. 2020, 205, 106437. [Google Scholar] [CrossRef]
  31. Bessi, C.; Lombardi, L.; Meoni, R.; Canovai, A.; Corti, A. Solid recovered fuel: An experiment on classification and potential applications. Waste Manag. 2016, 47, 184–194. [Google Scholar] [CrossRef]
  32. EPA Municipal Solid Waste Generation, Recycling, and Disposal in the United States: Facts and Figures for 2012; United States Environmental Protection Agency: Washington, DC, USA, 2012.
  33. Rezaei, H.; Sokhansanj, S. Physical and thermal characterization of ground bark and ground wood particles. Renew. Energy 2018, 129, 583–590. [Google Scholar] [CrossRef]
  34. Rezaei, H.; Lim, J.; Sokhansanj, S. Comparison of Drying Rates of Ground Western Red Cedar with Hemlock, Birch, Aspen and Spruce/Pine/Douglas Fir. Appl. Eng. Agric. 2020, 36, 159–165. [Google Scholar] [CrossRef]
  35. Nielsen, S.K.; Rezaei, H.; Mandø, M.; Sokhansanj, S. Constitutive modelling of compression and stress relaxation in pine pellets. Biomass Bioenergy 2019, 130, 105370. [Google Scholar] [CrossRef]
  36. Schilling, C.; Wohler, M.; Yazdanpanah, F.; Bi, X.; Sokhansanj, S. Development of a Novel Wood Pellet Durability Tester for Small Samples Conference of World Sustainable Energy Days. In Proceedings of the World Sustainable Energy Days—Energy Efficiency & Biomass, At Wels, Austria, 25–27 February 2015; The OÖ Energiesparverband: Wels, Austria, 2015. [Google Scholar] [CrossRef]
  37. Chang, N.-B.; Chang, Y.-H.; Chen, W.C. Evaluation of heat value and its prediction for refuse-derived fuel. Sci. Total Environ. 1997, 197, 139–148. [Google Scholar] [CrossRef]
Figure 1. Picture of the collected fractions. These wastes were dried, ground and blended to prepare the RDF samples.
Sustainability 12 04645 g001
Figure 2. Schematic of the pelletization stages. The darker color of RDF sample into the die represents a higher density.
Sustainability 12 04645 g002
Figure 3. Particle size distribution of four ground RDF samples with four compositions listed in Table 1. The horizontal axis is the opening size of the screens used to sieve the compositions.
Sustainability 12 04645 g003
Figure 4. A sample force vs displacement graph of a single RDF pellet inside the die at 80 °C.
Sustainability 12 04645 g004
Figure 5. Pelletization energy input for four RDF compositions. Total energy input is the summation of compression and expulsion stages.
Sustainability 12 04645 g005
Figure 6. Picture of pellets produced from four different RDF compositions. The diameter of pellets was ~6.4 mm.
Sustainability 12 04645 g006
Table 1. As-received moisture content, dry basis calorific value and bulk density of individual components and prepared refuse-derived fuel (RDF) compositions at four fractions.
ComponentsComposition (wt.%, w.b.)Individual Components
Comp 1Comp 2Comp 3Comp 4Moisture, as Received (%, w.b. 2)Heating Value (MJ/kg, d.b. 2)
Plastic203040301.946.5 ± 1.1
Paper & cardboard504030503.515.8 ± 0.2
Organic (food waste)202020104.121.2 ± 0.3
Wood1010101075.321.8 ± 0.2
Overall moisture content (%, w.b.) 117.5 ± 0.117.4 ± 0.117.2 ± 0.110.5 ± 0.0--
Overall heating value (MJ/kg, d.b.) 123.6 ± 0.326.7 ± 0.529.8 ± 0.626.2 ± 0.2--
1 Overall moisture content (%, w.b.) and overall heating value (MJ/kg, d.b.) were calculated using a linear relationship with the individual moisture content and heating values. 2 w.b. represents the wet basis and d.b. represents the dry basis.
Table 2. Operating parameters used in the single pellet machine.
ParameterValue
Die internal diameter6.35 mm
Maximum applied force5000 N
Maximum applied pressure158 MPa
Die temperature80 and 100 °C
Compression rate6 mm/min
Expulsion rate15 mm/min
Relaxation time30 s
Sample loading0.42 ± 0.01 g
Table 3. Density of samples before and after compression and the densification ratio of each composition. This table shows the variation of sample density before and after the compaction process at a die temperature of 80 °C.
ParameterComposition
Comp 1Comp 2Comp 3Comp 4
Mass of RDF fed to die (g)0.42 ± 0.010.42 ± 0.010.42 ± 0.010.42 ± 0.01
Density before pelletization (kg/m3)108.1 ± 3.2133.3 ± 4.1160.0 ± 2.8117.6 ± 3.6
Densification factor10.68.16.510.2
Density of pellet (kg/m3)1145.8 ± 30.11079.7 ± 33.21040.0 ± 18.21199.5 ± 36.7
Table 4. Durability of the pellets with four compositions made at a die temperature of 80 °C.
SampleComp 1Comp 2Comp 3Comp 4
Durability (%)92.25 ± 4.0766.06 ± 6.0550.96 ± 6.6992.38 ± 4.74
Table 5. Analysis of variance (ANOVA) for the influence of plastic and paper content on pelletization energy consumption and pellet durability.
SourceDFAdj SS 1Adj MS 2F-Valuep-Value
Pelletization energy consumption
Regression213.78646.89323.380.359
Plastic content (%)16.21186.21183.040.331
Paper content (%)10.47360.47360.230.714
Error12.04172.0417--
Total315.8281---
Regression equation40.2 − 0.337 (Plastic content, %) − 0.079 (Paper content, %)
Pellet durability
Regression21236.29618.14730.160.128
Plastic content (%)12.132.1350.100.801
Paper content (%)1383.86383.86118.730.145
Error120.5020.498--
Total31256.79---
Regression equation−26.7 + 0.198 (Plastic content, %) + 2.262 (Paper content, %)
1 Adjusted sum of square. 2 Adjusted mean squares

