The Return on Investment in Social Farming: A Strategy for Sustainable Rural Development in Rural Catalonia


Abstract
1. Introduction
2. Conceptual Framework
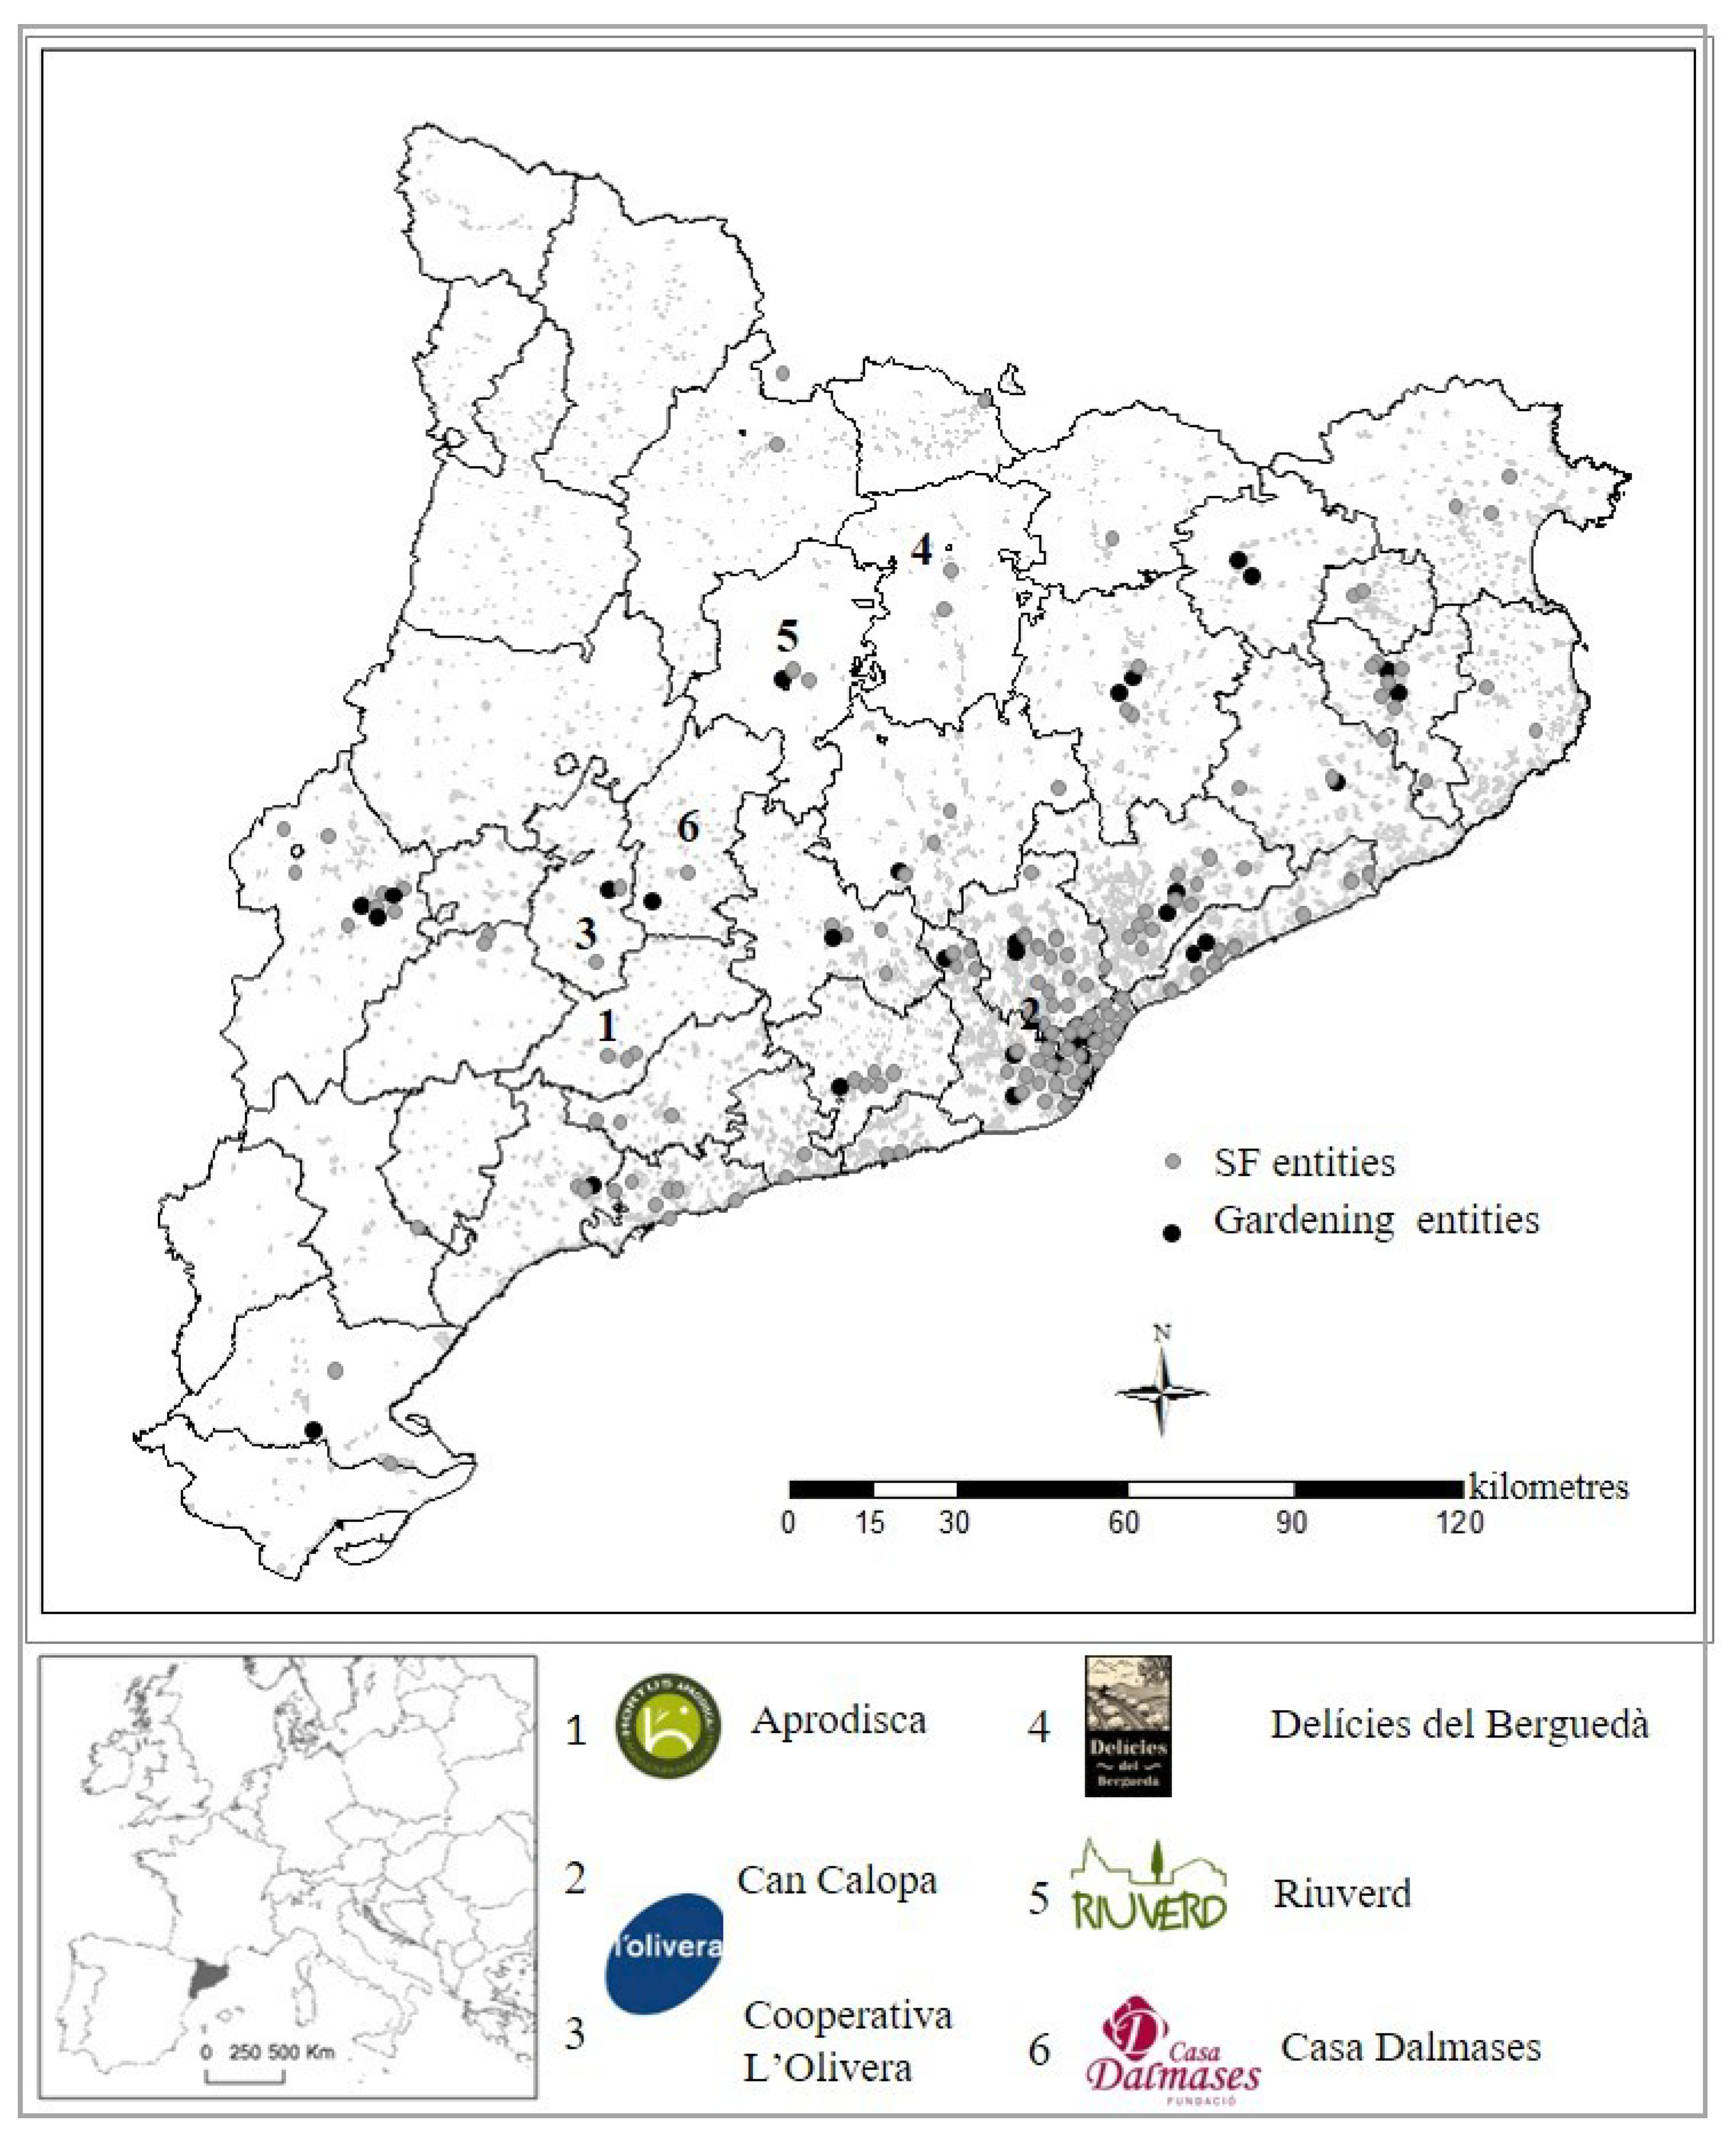
3. Study Area
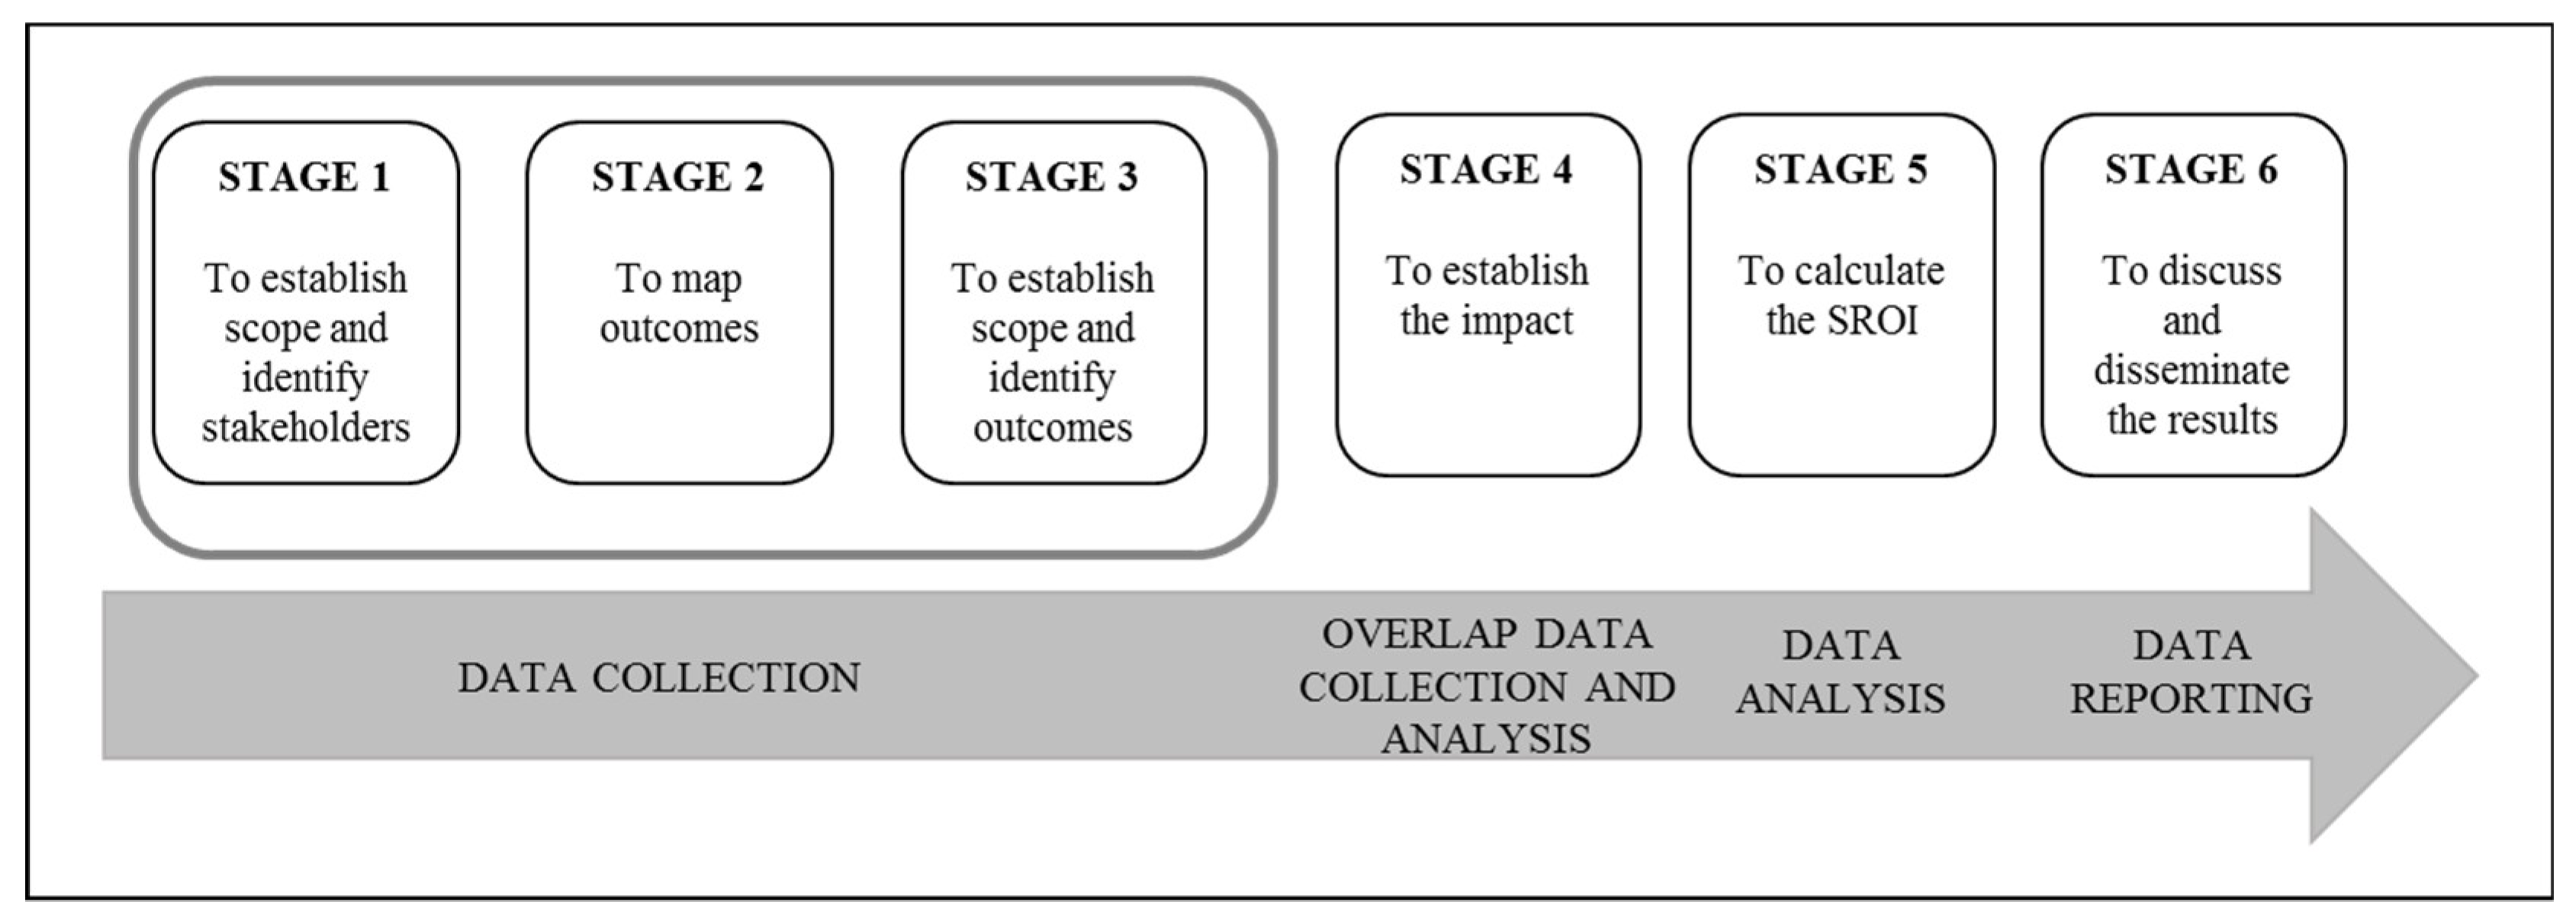
4. Methodology
5. Results and Discussion
5.1. Project Analysis and Stakeholder Identification
5.2. Impact Map of Each Case: Identification of the Investment and Results
5.3. Identification and Types of Stakeholder Changes
5.4. Measurement of the Changes
5.5. The Social Return of Investment (SROI): Total Impact Value
- (1)
- The social return of Aprodisca is €2.90 for each euro invested.
- (2)
- The social return of Can Calopa is €2.75 per euro invested, and 10% of the exchange rate is of an environmental nature.
- (3)
- The social return of Casa Dalmases is €2.73 for each euro invested.
- (4)
- The social return of Delicies del Berguedà is €2.38.
- (5)
- Due to savings for the administration in social work, healthcare, and employment services finding work for people in the collective at RSE, Riuverd has a social return of €2.22 per euro invested, and this especially benefits the community and the territory.
5.6. Calculation of Social Return on Investment (SROI)
6. Conclusions
Author Contributions
Funding
Acknowledgments
Conflicts of Interest
References
- Guirado, C.; Valldeperas, N.; Tulla, A.F.; Sendra, L.; Badia, A.; Evard, C.; Cebollada, A.; Espluga, J.; Pallarès, I.; Vera, A. Social farming in Catalonia: Rural local development, employment opportunities and empowerment for people at risk of social exclusion. J. Rural Stud. 2017, 56, 180–197. [Google Scholar] [CrossRef]
- Nicholls, J.; Lawlor, E.; Neitzert, E.; Goodspeed, T.I.; Cupitt, S. A Guide to Social Return on Investment; The SROI Network: London, UK, 2012. [Google Scholar]
- Di Iacovo, F.; O’Connor, D. Supporting Policies for Social Farming in Europe: Progressing Multifunctionality in Responsive Rural Areas; ARISA: Florence, Italy, 2009. [Google Scholar]
- Murray, J.; Wickramasekera, N.; Elings, M.; Bragg, R.; Brennan, C.; Richardson, Z.; Wright, J.; Llorente, M.G.; Cade, J.; Shickle, D.; et al. The impact of care farms on quality of life, depression and anxiety among different population groups: A systematic review. Campbell Syst. Rev. 2019, 15, e1061. [Google Scholar] [CrossRef]
- Finoula, R.; Pascale, A. L’agricoltura Sociale Nelle Politiche Pubbliche; INEA: Rome, Italy, 2008. [Google Scholar]
- Di Iacovo, F.; Moruzzo, R.; Rossignoli, C.; Scarpellini, P. Transition management and social innovation in rural areas: Lessons from social farming. J. Agric. Educ. Ext. 2014, 20, 327–347. [Google Scholar] [CrossRef]
- Tulla, A.F.; Vera, A. Could social farming be a strategy to support food sovereignty in Europe? Land 2019, 8, 78. [Google Scholar] [CrossRef]
- Tulla, A.F.; Vera, A.; Badia, A.; Guirado, C.; Valldeperas, N. Rural and regional development policies in Europe: Social farming in the common strategic framework (horizon 2020). J. Urban. Reg. Anal. 2014, 7, 35–52. [Google Scholar]
- Cone, C.A.; Myhre, A. Community-supported agriculture: A sustainable alternative to industrial agriculture? Hum. Organ. 2000, 59, 187–197. [Google Scholar] [CrossRef]
- Martínez-Torres, M.E.; Rosset, P.M. La Via Campesina: The birth and evolution of a transnational social movement. J. Peasant Stud. 2010, 149–175. [Google Scholar] [CrossRef]
- Deux Marzi, M.V.; Vannini, P. Manual de Tecnologías Abiertas Para la Gestión de Organizaciones de la Economía Social y Solidaria; Universidad Nacional de General Sarmiento y Cooperativa de Trabajo GCOOP Ltd.: Los Polvorines, Argentina, 2000. [Google Scholar]
- Laville, J.-L. Asociarse Para el Bien Común. Tercer Sector, Economía Social y Economía Solidaria; Icaria Editorial: Barcelona, Spain, 2015. [Google Scholar]
- Weckerle, P.; van Elsen, T. Anwendbarkeit des “social return on investment (SROI)” als messmethode für den mehrwert der sozialen landwirtschaft. In Proceedings of the 2015 Scientific Conference of the German Speaking Countries, Eberswalde, Germany, 17–20 March 2015. [Google Scholar]
- Osterwalder, A.; Pigneur, Y. Generación de Modelos de Negocio; Deusto: Bilbao, Spain, 2010. [Google Scholar]
- Tinga, E.; van der Velden, F.; Baas, P. Social Return on Investment: An. Introduction-Context; International Cooperation Contextuals: Utrecht, The Nederlands, 2006. [Google Scholar]
- Tulla, A.F. Sustainable rural development requires value-added activities linked with comparative advantage: The case of the catalan pyrenees. Eur. Ctry. 2019, 11, 229–256. [Google Scholar] [CrossRef]
- Tempesta, T.; Vecchiato, D.; Nassivera, F.; Bugatti, M.; Torquati, B. Consumers demand for social farming products: An analysis with discrete choice experiments. Sustainability 2019, 11, 6742. [Google Scholar] [CrossRef]
- Best, S. The commodification of reality and the reality of commodification: Jean baudrillard and post-modernism. Curr. Perspect. Soc. Theory 1989, 19, 23–51. [Google Scholar]
- Perkins, H.C. Commodification: Re-resourcing rural areas. In Handbook of Rural Studies; Cloke, P., Marsden, T., Mooney, P., Eds.; Sage: London, UK, 2006. [Google Scholar]
- Taylor, P.J. The error of developmentalism in human geography. In Horizons in Human Geograph; Gregory, D., Walford, R., Eds.; Macmillan: Basingstoke, UK, 1989; pp. 303–319. [Google Scholar]
- Atchoarena, D.; Gasperini, L. Education for Rural Development: Towards New Policy Responses; Food and Agriculture Organization of the United Nations: Rome, Italy, 2004. [Google Scholar]
- Informe de la Comisión Mundial sobre el Medio Ambiente y el Desarrollo; Brundtland Report; United Nations General Assembly: New York, NY, USA, 1987.
- Perpiña, C.C.; Coll Aliaga, E.; Lavalle, C.; Martínez Llario, J.C. An assessment and spatial modelling of agricultural land abandonment in Spain (2015–2030). Sustainability 2020, 12, 560. [Google Scholar] [CrossRef]
- Marsden, T.; Banks, J.; Bristow, G. Food supply chain approaches: Exploring their role in rural development. Sociol. Rural. 2000, 40, 424–438. [Google Scholar] [CrossRef]
- Fernández-Such, F. Análisis de la cooperación al desarrollo en zones rurales. Desde el productivismo a la soberanía alimentaria. In Soberanía Alimentaria. Objetivo político de la Cooperación y el Desarrollo en Zones Rurales; Icaria: Barcelona, Spain, 2006; pp. 27–47. [Google Scholar]
- Beuchelt, T.D.; Virchow, D. Food sovereignty or the human right to adequate food: Which concept serves better as international development policy for global hunger and poverty reduction? Agric. Hum. Values 2012, 29, 259–273. [Google Scholar] [CrossRef]
- Timmermann, C.; Félix, G.T.; Tittonell, P. Food sovereignty and consumer sovereignty: Two antagonistic goals? Agroecol. Sustain. Food Syst. 2018, 42, 274–298. [Google Scholar] [CrossRef]
- Wilson, G.A. Multifunctional Agriculture: A Transition Theory Perspective; CAB International: Wallingford, UK, 2007. [Google Scholar]
- Kitchen, L.; Marsden, T. Creating sustainable rural development through stimulating the eco-economy: Beyond the eco-economic paradox? Sociol. Rural. 2009, 49, 273–294. [Google Scholar] [CrossRef]
- Ray, C. Endogenous development in the era of reflexive modernity. J. Rural Stud. 1999, 15, 257–267. [Google Scholar] [CrossRef]
- Flora, C.B.; Flora, J.L.; Frey, S. Rural Communities: Legacy and Change, 3rd ed.; Westview Press: Boulder, CO, USA, 2008. [Google Scholar]
- Anderson, C.; Bell, M. The devil of social capital: A dilemma of American rural sociology. In Country Visions; Cloke, P., Ed.; Pearson: Harlow, UK, 2003; pp. 232–243. [Google Scholar]
- Quaranta, G.; Dalia, C.; Salvati, L.; Salvia, R. Building resilience: An art-food hub to connect local communities. Sustainability 2019, 11, 7169. [Google Scholar] [CrossRef]
- Ploeg van der, J.D.; Renting, H.; Brunori, G.; Knickel, K.; Mannion, J.; Marsden, T.; De Roest, K.; Sevilla-Guzmán, E.; Ventura, F. Rural development: From practices and policies towards theory. Sociol. Rural. 2000, 40, 391–408. [Google Scholar] [CrossRef]
- Kendall, J. The mainstreaming of third sector into public policy in the UK. Whys and wherefores. Policy Politics 2000, 28, 541–562. [Google Scholar] [CrossRef]
- Guirado, C.; Badia, A.; Tulla, A.F.; Vera, A.; Valldeperas, N. La agricultura social en Catalunya: Innovación social y dinamización agroecológica para la ocupación de personas en riesgo de exclusión. Ager J. Depopulation Rural Dev. Stud. 2014, 17, 65–97. [Google Scholar] [CrossRef]
- Guirado, C.; Tulla, A.F.; Valldeperas, N. La Agricultura Social en Cataluña: Diagnosis de un fenómeno emergente. Boletín De La Asoc. De Geógrafos Españoles 2018, 77, 148–185. [Google Scholar] [CrossRef]
- Hassink, J.; Van Dijk, M. Farming for Health: Green-Care Farming Across Europe and the United States of America; Springer: Dordrecht, The Netherlands, 2006. [Google Scholar]
- Hine, R.; Peacock, J.; Pretty, J. Care farming in the UK: Contexts, benefits and links with therapeutic communities. Int. J. Ther. Communities 2008, 29, 245–260. [Google Scholar]
- Haubenhofer, D.K.; Elings, M.; Hassink, J.; Hine, R.E. The development of green care in western European countries. Explore 2010, 6, 106–111. [Google Scholar] [CrossRef] [PubMed]
- Sempik, J.; Hine, R.; Wilcox, D. Green Care: A Conceptual Framework. A Report of the Working Group on the Health Benefits of Green Care. COST 866, Green Care in Agriculture; Loughborough University: Loughborough, UK, 2010. [Google Scholar]
- Dessein, J.; Bock, B.B.; De Krom, M.P. Investigating the limits of multifunctional agriculture as the dominant frame for green care in agriculture in flanders and The Netherlands. J. Rural Stud. 2013, 32, 50–59. [Google Scholar] [CrossRef]
- Pallarès-Blanch, M.; Prados, M.J.; Tulla, A.F. Naturbanization and urban-rural dynamics in Spain: Case study of new rural landscapes in Andalusia and Catalonia. Eur. Countrys. 2014, 6, 118–160. [Google Scholar] [CrossRef]
- Leck, C.; Evans, N.; Upton, D. Agriculture-who cares? An investigation of ’care farming’ in the UK. J. Rural Stud. 2014, 34, 313–325. [Google Scholar] [CrossRef]
- Di Iacovo, F.; Moruzzo, R.; Rossignoli, C.M. Social farming and policies in Tuscany, between social innovation and path dependency. Ital. Rev. Agric. Econ. 2018, 73, 107–131. [Google Scholar] [CrossRef]
- Tulla, A.F.; Guirado, C.; Sendra, L.; Valldeperas, N. L’Agricultura Social a Catalunya. Anàlisis de la Viabilitat Econòmica i Avaluació del Retorn Social; Final Report Project 2014ACUP29; Badia, A., Cebollada, A., Evard, C., Espluga, J., Pallarès, I., Vera, A., Eds.; ERAS-UAB and Programa RecerCaixa: Bellaterra, Spain, 2017. [Google Scholar]
- Idescat. Població ocupada. Anuari de l’Institut d’Estadística de Catalunya; Generalitat de Catalunya: Barcelona, Spain, 2017. [Google Scholar]
- Idescat. Estadística. Enquesta de Població Activa; Generalitat de Catalunya: Barcelona, Spain, 2020. [Google Scholar]
- Idescat. Estadística de l’estructura d’explotacions. Anuari de l’Institut d’Estadística de Catalunya; Generalitat de Catalunya: Barcelona, Spain, 2014. [Google Scholar]
- Kumar, S. Social return on investment (SROI) analysis: An innovative framework for measuring the impact of one health. Planet@Risk 2014, 2, 150–154. [Google Scholar]
- Ruiz-Lozano, M.; Tirado-Valencia, P.; Sianes, A.; Ariza-Montes, A.; Fernández-Rodríguez, V.; López-Martín, M.C. SROI methodology for public administration decisions about financing with social criteria. A case study. Sustainability 2020, 12, 1070. [Google Scholar] [CrossRef]
- Kim, D.-J.; Ji, Y.-S. The evaluation model on an application of SROI for sustainable social enterprises. J. Open Innov. Technol. Mark. Complex. 2020, 6, 7. [Google Scholar] [CrossRef]
- Lombardo, G.; Mazzocchetti, A.; Rapallo, I.; Tayser, N.; Cincotti, S. Assessment of the economic and social impact using SROI: An application to sport companies. Sustainability 2019, 11, 3612. [Google Scholar] [CrossRef]
- Moody, M.; Littlepage, L.; Paydar, N. Measuring social return on investment. lessons from organizational implementation of SROI in The Netherlands and the United States. Nonprofit Manag. Leadersh. 2015, 26, 19–47. [Google Scholar] [CrossRef]
- Cordes, J.J. Using cost-benefit analysis and social return on investment to evaluate the impact of social enterprise: Promises, implementation and limitations. Eval. Program. Plan. 2017, 64, 98–104. [Google Scholar] [CrossRef]
- Moruzzo, R.; Di Iacovo, F.; Funghi, A.; Scarpellini, P.; Espinosa, S.; Riccioli, F. Social farming: An inclusive environment conducive to participant personal growth. Soc. Sci. 2019, 8, 301. [Google Scholar] [CrossRef]
- Guinjoan, E.; Badia, A.; Tulla, A.F. Noves ruralitats i desenvolupament rural. Estat de la qüestió i aplicació d’um nou mètode d’anàlisi a Catalunya: La rural web. Doc. D’anàlisi Geogràfica 2016, 62, 503–530. [Google Scholar] [CrossRef]


| Stakeholder | Description | Justification | Cases |
|---|---|---|---|
| Beneficiaries or users | People at RSE in various groups. | Employment and socio-health care are the main objectives of SF. | The five entities. |
| Technical team | Professionals with transversal skills in different fields. | They are responsible for promoting and managing the project. | The five entities. |
| Volunteers and/or student interns | They work without pay and receive job satisfaction as well as acquiring skills and knowledge in managing SF. | An important element in SF entities for creating social capital and improving social relations. | Aprodisca; Can Calopa; Casa Dalmases; Delícies Berguedà. |
| Foundations/associations | A promoting parent entity that helps to develop an SF project. | Provides services, funding, and advice at the beginning of and during the process. | The five entities. |
| Family members | From the milieu closest to the beneficiaries, they experience positive changes such as emotional and material well-being. | The activity of the entity gives emotional support and eases the burden of family attention to the people at RSE in their care. | The five entities. |
| Customers | People or entities that value the project for the quality of the product and services of the SF entity. | They contribute most of the income for products and services they obtain in the SF entity. | The five entities |
| Suppliers | These are the companies that contribute the raw materials for the products of the SF entity. | These are basic suppliers, such as those that provide organic products. This is a key expense for the entity. | The five entities. |
| Collaborating institutions | Entities offering services and indirect contributions of materials, as well as advice. | They assist in the development of the entity, especially during the first years of the project. | Can Calopa; Casa Dalmases; Delícies del Berguedà. |
| Local and provincial administration | They offer grants and subsidies to maintain jobs and facilitate the development of the entity. | Their services work with the entity and contribute investments, as well as recording changes in relation to people at RSE. | The five entities. |
| Community and local territory | The activity of the SF entity may have an effect upon or generate change in the territorial environment. | This favors cooperation between activities in the territory, as well as ecological products of added value. | The five entities. |
| State and provincial administration | They receive income from taxes and social security payments as well as saving on aid and subsidies. | Significant changes and savings are registered regarding the activity of the entity and the employment function of the staff at RSE. | The five entities. |
| Stakeholder | Expected Changes |
|---|---|
| Beneficiaries or users | Integration into the job market: access to a job. New job skills: increased responsibility (e.g., punctuality). New professional and personal skills (e.g., specialization). Material well-being: salary, social security, economic autonomy. Emotional well-being: self-esteem, trust, satisfaction, relationship with nature. Physical well-being: improved health. Social integration. Improvement of interpersonal relationships and social skills. Personal autonomy and independent life. Empowerment. |
| Technical team | Access to a job. Salary and social security. Learning, experience, and new professional skills. Ability to adapt easily to a range of functions. Emotional well-being. Participating in a social project, motivation, satisfaction. Physical well-being: work in a pleasant environment in contact with nature. Personal development and improved social relationships. |
| Volunteers and/or student interns | Emotional satisfaction and motivation to participate in a social project. Learning to generate projects (organizational skills). Acquisition of technical knowledge: agriculture and ecological processes. Physical well-being: work in a pleasant environment in contact with nature. New contacts and expansion of the personal social network. |
| Foundations/associations | Meeting the core objectives of the foundation and/or association. Social diffusion of access to employment and social improvement for beneficiaries. Capital contribution and financing the development of the SF project. Knowledge and contacts with society. Recruitment of new partners. Providing training and platforms for collaboration among SF entities. Saving costs of guardianship and human resources management (Guardianship Foundation). Management and maintenance of farms and heritage (landscape, land, and buildings). |
| Family members | Availability of more time if paid work is done. Economic security: contribution of a salary to the family nucleus (only sometimes). Emotional well-being: psychological rest, stress reduction, tranquility. Improvement of inter-family relationships: conflict reduction. Peace of mind and hope of resolving situations of conflict. |
| Customers | Revenue from sales and services (agricultural and processed products, training). Emotional well-being of the client: satisfaction of working with a social project. Social economy: acquiring quality social products locally. |
| Suppliers | Providing raw materials and services for the development of the activity Giving value to proximity agriculture. Obtaining better prices and working relations because of dealing with wholesalers. Economic and treatment facilities thanks to relationship with a social project. |
| Collaborating institutions | Therapeutic support and monitoring of people at RSE in the SF project. Joint marketing strategies (2147 Mans, Vogadors, etc.). Contribution of low-cost materials and advice, and funding. Making contacts that promote social networks and territorial activities. |
| Local and provincial administration | Agreement ceding public properties for use by projects: management and maintenance. Economic contributions to SF projects through offering services. Savings in social benefits expenses, for example with subsidized housing. Savings in social and health services expenses (e.g., family assistance and healthcare). Savings in training and education of workers. |
| Community and local territory | Presence of a local development and entrepreneurship project. Social cohesion. Networking for collaboration among producers and contacting consumers. Giving value to local products and promoting quality added value. Recovery of abandoned agricultural land and production, for example, of wine. Landscape and historical heritage conservation. Actions to reduce fire risk and increase biodiversity. |
| State and provincial administration | Increased revenue from tax collection (personal income tax, VAT, etc.) Increased revenue from social security contributions. Grants for paying salaries of Special Work Centre (SWC) and Employment Integration Company (EIC) workers. Reduction of aid and expenses in social benefits. |
| Stakeholders | Description | Value in € | Results (Outputs) |
|---|---|---|---|
| Workers at RSE | Time, effort, and commitment. | 0.00 | 7 workers in a situation of social exclusion. |
| Professionals (technical team) | Time, involvement and commitment. | 0.00 | 3 permanent workers and 3 substitute workers for holidays and specific reinforcement needs. |
| Aprodisca Association (parent) | Financing. | 24,688.39 (23.38%) | Working to advance the activity of the Employment Integration Company (EIC). |
| Customers | Monetary contribution. | 48,613.94 (46.03%) | They prefer quality and proximity agriculture with social value. |
| Suppliers | Monetary expenditure. | −42,454.62 (−40.20%) | Revenue for suppliers. |
| Family members of people at RSE | Effort, satisfaction, time and commitment. | 0.00 | 7 families have members who are EIC workers. |
| Public administration | Money. | 29,927.33 (28.34%) | Subsidies and contributions of a public nature for EIC activity. |
| Community and local territory | Generating compatibilities with surrounding entities. | 0.00 | Links with the administration and entities. Environmental improvement of abandoned land. |
| Volunteering at the Horticultural School | Time and professional support. | 2376.00 (2.25%) | 2 people have participated in the entity as intern staff (550 h). |
| TOTAL INPUTS | 63,151.04 | = + 105,605.66 − 42,454.62 |
| Stakeholders | Description | Value in € | Results (Outputs) |
|---|---|---|---|
| Workers at RSE in home-residence | Time and effort. | 39,204.00 (6.69%) | 11 workers in the SWC and home-residence users. |
| Technical team: SWC professionals and home-residence | Time, effort, involvement, and commitment. | 0.00 | 12 jobs (6.5 in the SWC and 5.5 in the home-residence). |
| Volunteers | Time, commitment and personal effort. | 12,692.16 (2.17%) | 4 volunteers (2938 h per year). |
| Barcelona City Council | Monetary contribution and collaboration. | 217,334.17 (37.11%) | Home-residence management concession (people with intellectual disabilities). |
| Sabadell Agrarian Park | Collaboration. | 0.00 | Maintenance of public farm and production of 3100 bottles per year. |
| Customers of services | Monetary income. | 60,751.50 (10.37%) | Receive services offered by the SWC. |
| Suppliers | Contribution of remunerated services and raw material. | −153,054.34 (−26.13%) | Therapy and other health services. Packaging, transport, etc. |
| Public administration, provincial and state | Subsidies for SWC and home-residence workers. Tax revenue. | 255,718.10 (43.66%) | Maintenance of protected jobs (SWC) and home-residence positions. Paid taxes and social security. |
| Families and tutors | Effort, satisfaction, time, and commitment. | 0.00 | 11 families and/or guardians with members in the home-residence and in the SWC. |
| Guardian foundations: “Som Fundació” and 3 more | Socio-health collaboration. | 0.00 | 8 of the 11 home-residence users are supervised by a foundation. |
| Community and local territory | Collserola Natural Park; surroundings. | 0.00 | Managing crops and spaces at fire risk. Environmental improvement in abandoned land. |
| TOTAL INPUTS | 432,645.59 | = + 585,700.33 − 153,054.24 |
| Stakeholders | Description | Value in € | Results (Outputs) |
|---|---|---|---|
| Workers (disabled) at RSE | Time, effort and commitment. | 1797.12 (5.13%) | 1 person working in an internship. |
| Young people with special difficulties or in structural unemployment | Time, effort, involvement and commitment. | 5063.04 (14.45%) | 8 users (5 with intellectual disabilities—Association Alba- L’Espígol store, and 3 at RSE of Emaús Rural). |
| Permanent volunteers in the technical team | Time, effort, involvement, and commitment. | 1195.92 (3.41%) | 2 volunteers in the technical team. |
| Temporary volunteers in the technical team | Time, effort, involvement, and commitment. | 3732.48 (10.65%) | 4 volunteers working to develop the project (foundation president, social networks, administration, and technical). |
| Casa Dalmases technical team | Time, effort, and commitment. | 0.00 | 2 professionals. |
| Members of the board of trustees of Casa Dalmases | Monetary contribution. | 4999.00 (14.27%) | Collaboration in developing the entity’s activity. |
| Family members of workers at RSE | Time, effort, involvement, and commitment. | 0.00 | Impact on family when one of its members is working. |
| Customers | Monetary income. | 12,077.29 (34.47%) | Proximity agriculture and social value. |
| Suppliers | Monetary outlay. | −14,382.69 (−41.05%) | Payment for raw materials and services received by the foundation. |
| Collaborators (Alba Association, L’Olivera, and so on) | Assistance and advice. | 1260.00 (3.60%) | Assistance in the development of the entity’s activity. Donation of material for production. |
| “Obra Social La Caixa” Foundation | Monetary contribution. | 5000.00 (14.27%) | Grant for work to improve the building. |
| Public administration | Tax revenue and subsidy savings. | 0.00 | Maintenance of protected workplaces. |
| Community and territory | Generates compatibilities with surrounding entities. | 0.00 | Creates collaborative ties with the administration and other activities. Environmental improvement in abandoned land. |
| TOTAL INPUTS | 20,652.16 | = + 35,034.85 − 14,382.69 |
| Stakeholders | Description | Value in € | Results (Outputs) |
|---|---|---|---|
| Workers of the EIC | Time, effort, and commitment. | 0.00 | 3 positions for young people with dual pathology. |
| Professionals (technical team) | Time, effort, involvement, and commitment. | 0.00 | 3 positions for people with professional, educational, and group organization knowledge. |
| Volunteers and intern students | Time, effort, involvement, and commitment. | 4942.08 (2.35%) | 1 intern student (20 h/week) and a volunteer worker (2 h/week). |
| Ship2b Foundation | Monetary contribution. | 16,000.00 (7.61%) | 11 investment partners contribute €80,000 (in 5 years), thus acquiring shares. |
| Families | Effort, satisfaction, time, and commitment. | 259.20 (0.12%) | 3 families have young people with dual pathology working in the company. |
| Customers | Monetary income. | 162,789.00 (77.43%) | They receive proximity agriculture with social value. |
| Suppliers | Monetary outlay. | −97,691.68 (−46.47%) | Payment for raw materials and services received by the foundation. |
| Portal Foundation | Monetary contribution. | 13,200.00 (6.28%) | Working in development of the employment integration company (EIC). |
| Amalgama Association | Time, effort, and commitment. | 207.36 (0.10%) | 1 psychologist makes periodic visits to young people at RSE. |
| Catalunya-La Pedrera Foundation (Agrosocial network) | Monetary contribution and advice. | 3000.00 (1.43%) | Grant to create a joint marketing platform with the coop. Vogadors and other SF initiatives. |
| Public administration | Tax revenue and subsidy savings. | 9844.05 (4.68%) | Subsidies and public contributions for the development of EIC activity maintaining jobs. |
| Community and territory | Generating compatibilities with surrounding entities. | 0.00 | Creating collaborative ties with the administration and other activities. Environmental improvement of abandoned land. |
| TOTAL INPUTS | 112,550.01 | = + 210,241.69 − 97,691.68 |
| Stakeholders | Description | Value in € | Results (Outputs) |
|---|---|---|---|
| Workers at RSE in the EIC | Time, effort, and commitment. | 0.00 | 6 young people at RSE. |
| Training and Social Occupation Service | Time, effort, involvement, and commitment. | 0.00 | 18 young people from the Shared Schooling Unit (SSU) as users. |
| Professional workers (technical team) | Time, effort, involvement, and commitment. | 0.00 | 3 positions for the technical team. |
| WeL’Afrau Association | Monetary contribution. | 15,961.56 (19.75%) | 7 people benefiting from the SSU. Grant from the Youth Guarantee Program for horticultural training. |
| Customers | Monetary income. | 31,893.20 (39.47%) | They receive proximity agriculture with social value. |
| Suppliers | Monetary outlay. | −17,050.50 (−21.10%) | Payment for raw materials and services received by the foundation. |
| Families | Effort, satisfaction, time, and commitment. | 0.00 | 5 families of young workers at RSE. |
| Public administration | Tax revenue and subsidy savings. | 32,959.05 (40.78%) | Subsidies and public contributions for development of EIC activity maintaining jobs. |
| Community and territory | Generating compatibilities with surrounding entities. | 0.00 | Creating collaborative ties with the administration and other activities. Environmental improvement in abandoned land. |
| TOTAL INPUTS | 63,763.29 | = + 80,813.79 − 17,050.50 |
| Changes Detected (Outcomes) | Nature of the Exchange Rate | Exchange Rate Incidence | Change Indicator |
|---|---|---|---|
| Disabled workers (users) who have acquired new skills and abilities | Social | Direct | Number of people who have acquired new personal and work skills and abilities (1). |
| Social | Direct | Number of people trained in specialized work (e.g., craft beer; viticulture, etc.) (2). | |
| Users who have improved social relationships (e.g., making friends, participating) | Social | Direct | Number of people who have increased interpersonal relationships (3). |
| Social | Direct | People who participate in social and/or cultural activities (4). | |
| Social | Direct | People whose leisure activities have increased (5) | |
| Troubled youth (users) who have acquired new skills and abilities | Social | Direct | Number of beneficiaries who have taken the entrance exam to a training cycle or to the Adult School (6). |
| Beneficiaries who have improved their personal autonomy (income, mobility, home, etc.) | Social | Direct | Number of people who use public transport more (7). |
| Economic | Direct | Number of people who have found rented accommodation (8). | |
| Social | Direct | Salary received by beneficiaries for work performed (minimum wage) (9). | |
| Beneficiaries with improved health status through physical exercise, healthy lifestyle habits, and working in a natural environment | Social | Direct | Number of people whose well-being and physical health have improved (10). |
| Beneficiaries who have improved their emotional well-being (self-esteem, confidence, satisfaction) | Social | Direct | Number of people whose mental health status has improved (11). |
| Volunteers who altruistically devote time to the project | Economic | Direct | Number of hours devoted to the project or entity (12). |
| Volunteers who acquire new professional skills and abilities | Social | Direct | Number of people have increased their skills and professional experience through unpaid work (13). |
| Members of the technical team receive a salary for their work | Economic | Direct | Monetary amount that workers receive for their work (14). |
| Professional workers participating in a social project who experience greater job satisfaction | Social | Direct | Number of people who feel linked to the project because of its social content (15). |
| Members of the technical team who have acquired new job and professional skills | Social | Direct | People who have increased their job and professional skills and abilities since working in the entity (16). |
| The members of the cooperative or association who experience greater job satisfaction | Social | Direct | Number of people in the cooperative or association who feel satisfied by working in a social project (17). |
| The employment integration company Portal Berguedà which offers psychological support to young people, through the Amalgam Association | Social | Direct | Number of hours per year of psychological care for young people with dual pathology given by Portal Berguedà (18). |
| The SHIP2B Foundation volunteers who have acquired new skills and abilities, experiencing personal satisfaction in the social project | Social | Direct | Number of people who have expanded their professional experiences and skills (19). |
| Economic | Direct | Number of hours devoted to the social project (20). | |
| Families reduce the emotional burden due to the problems of their children’s situation | Social | Indirect | Number of families now having a quieter life with a reduced emotional load (21). |
| Potential benefit of shorter healthcare time for a disabled family member | Economic | Indirect | Number of hours professional caregivers can devote to work (22). |
| Saving in direct costs associated with the daily life of people with disabilities | Economic | Indirect | Number of hours that families no longer spend caring for with people with disabilities (23). |
| Saving for the Foundation in costs of guardianship for users | Economic | Indirect | Number of people supervised by foundations (24). |
| People working in the technical team of the Foundation or Association | Economic | Indirect | Average unemployment benefit in Catalonia (2014) multiplied by the number of workers (25). |
| Savings for the public administration in guaranteed minimum income payments | Economic | Indirect | Benefits (in €) that the public administration saves in minimum income payments by placing workers in an SF project (26). |
| Direct revenue from taxes and duties (VAT, personal income tax, fees, etc.) for the public administration | Economic | Direct | Amount of revenue for the Treasury in taxes and duties (27). |
| Contribution of the public administration to the EIC and SWC for employing people with disabilities | Economic | Direct | Amount of benefits for labor integration of workers with disabilities (28). |
| Savings in unemployment benefits | Economic | Indirect | Amount of benefits payments saved by the public administration thanks to the SF project (29). |
| Public administration (PPAA) savings in dependency benefits | Economic | Indirect | Number of people who have stopped receiving dependency benefits (30). |
| Savings for the health system | Economic | Indirect | Difference in cost in terms of frequency of visits to Primary Care Centers (31). |
| Social Security fees paid to the public administration | Economic | Direct | Revenue (in €) from Social Security contributions to the public administration (32). |
| Public administration savings due to creation of professional employment in SF projects | Economic | Indirect | Average unemployment benefit in Catalonia (2014) multiplied by the number of technical team workers (33) |
| Savings in the maintenance of properties belonging to the Barcelona City Council and Sabadell Agrarian Park | Economic | Indirect | Number of hectares of the Can Calopa de Dalt farmhouse (Collserola Park) and the Sabadell Agrarian Park estate managed by Can Calopa (34). |
| Barcelona City Council saves on the purchase of wine bottles from other producers | Economic | Direct | Number of bottles of “Wine of the City of Barcelona” at an agreed price with Can Calopa de Dalt (35). |
| Contribution to local economic development | Economic | Indirect | Economic value of goods purchased to develop the activity (36). |
| Economic | Indirect | Value (in €) of contracting services and jobs to develop the project’s activity (37). | |
| Contribution to obtaining added value with proximity agriculture in SF | Economic | Indirect | Difference in price between the cost of the raw material used and income for the final product (by units) (38). |
| Promotion of territorial compatibilities | Economic | Indirect | Existence of economic promotion associations participating in the SF project (39). |
| Fire risk reduction in the natural parks of Sant Llorenç del Munt and Collserola | Environmental | Indirect | Number of hectares of farms managed by SF entities. This can be generalized to all cases (40). |
| Improvement of the biodiversity of the territory around the project | Environmental | Indirect | Report on improvement of natural conditions (e.g., vegetation and fauna) (41). |
| Reduction of CO2 resulting from use of the farmland managed by the project | Environmental | Indirect | Difference between CO2 that vegetation managed by the project can capture and CO2 of the previous vegetation (42). |
| Indicator | Num. | Time | Financial Proxy | Value (€) | Total (€) | Sources Year |
|---|---|---|---|---|---|---|
| Beneficiaries who have acquired new personal and work skills and abilities (1) Aprodisca (Ap) | 6 | 3 months | Cost of professional training and career guidance. | 285.70 | 1714.2 | DIBA a 2015 |
| Users travelling more on public transport (7) Ap | 3 | 1 year | 10 trips (1 zone) per week. | 940.80 | 2822.4 | TMB b 2015 |
| Beneficiaries who have found rented accommodation (8) Ap | 2 | 1 year | Average rent of a flat near the farm. | 3600.0 | 7200.0 | Habitaclia 2015 |
| Users whose well-being and physical health have improved (10) Ap | 6 | 1 year | Annual registration with a gym. | 597.84 | 3587.0 | FACUA c Catatalunya 2014 |
| Voluntary hours in the project (12) Can Calopa (CC) | 2938 | 1 year | Catalonia’s average hourly wage. | 15.63 | 45,920.9 | IDESCAT d 2013 |
| Volunteers who improve skills and professional experience through unpaid work (13), (CC) | 4 | 3 courses | Average training cost: viticulture, horticulture, or social care. | 285.71 | 1142.8 | DIBA a 2014 |
| Monetary value received by workers (14) Casa Dalmases (CD) | 1 | 1 year | Salary of technical team staff. | 6819.9 | 6819.9 | 2015 Report C. Dalmases |
| People linked to the project because of its social content (15) CD | 2 | 1 year | Cooperative partner or association fee. | 600.00 | 1200.0 | L’Olivera Coop. 2015 |
| Psychological care (hours) for young people with pathology (18) Delícies(DB) | 48 | 1 year | Cost of one hour of therapeutic care. | 50.00 | 2400.0 | CEPFAMI 2015 e |
| Families with a quieter life and reduced emotional load (21) DB | 3 | 1 year | Cost of two-weekly family therapies per year. | 1680.0 | 5040.0 | CEPFAMI 2015 e |
| Hours that professional caregivers can devote to work (22) CC | 11,160 | 1 year | Average hourly wage in Catalonia. | 15.63 | 174,431. | IDESCAT d 2013 |
| Hours that families have ceased to spend caring for people with disabilities (23) AP | 1560 | 1 year | Cost of one hour of Home Help Assistant. | 7.51 | 11,715.6 | ECODES f Report 2015 |
| People supervised by foundations (24) CC | 8 | 1 year | Average annual cost of a tutor. | 3482.3 | 27,858.4 | Can Calopa Rep. 2015 |
| Public administration savings by employment of workers (25) Riuverd (RV) | 7.5 | 1 year | Unemployment benefits (Catalonia). | 9945.6 | 74,592.0 | CCOO T. Union 2014 |
| Public administration savings in minimum income benefits due to employment (26) RV | 1 | 1 year | Guaranteed minimum income (Catalan Average). | 6725.7 | 6725.7 | CCOO Trade Union 2014 |
| Treasury revenue from taxes (27) RV | 1 | 1 year | PPAA income from taxes. | 13,137 | 13,137.1 | Riuverd Rep. 2015 |
| Benefits from employment of disabled workers (28) AP | 3 | 1 year | Unemployment benefits (Cat). | 9945.6 | 29,836.8 | CCOO T. U. 2014 |
| People who have ceased to receive dependency benefits (30) CC | 1 | 1 year | Annual benefit amount. | 600.00 | 600.00 | C. Calopa Report 2015 |
| Public administration revenue from Social Security payments (32) RV | 1 | 1 year | Value of Social Security payments. | 21,842 | 21,842.0 | Riuverd Report 2015 |
| Hectares of the farmhouse Can Calopa de Dalt in Collserola Park (34) CC | 150 ha | 1 year | Cost per ha. in agro-forestry maintenance. | 1125.0 | 168,750. | Barcelona City Council 2014 |
| Number of bottles of “Wine of the City of Barcelona” (35) CC | 5000 bottles | 1 year | Retail price of a bottle. | 15.00 | 75,000.0 | L’Olivera Coop. 2015 |
| Goods purchased to develop the activity (36) DB | 5.13 tons | 1 year | Purchase value of goods and services. | 12,971 | 66,570.5 | ElC Portal Berguedà Rep. 2015 |
| Contracting of services and work to develop the activity (37) DB | 1 | 1 year | Value of subcontracting services. | 21,842 | 31,121.2 | El Portal Berguedà Rep. 2015 |
| Number of hectares of farms managed by entities (40) CC | 150 ha | 1 year | Cost per ha. of fire prevention. | 1125 | 168,750. | CTFC g 2015 |
| Stakeholder | Total Impact Value (€) | % Impact | € impact/€ Invested |
|---|---|---|---|
| Workers with intellectual disability (RSE) | 47,904.67 | 25.43 | 0.74 |
| Professionals (technical team) | 37,353.64 | 19.83 | 0.57 |
| Aprodisca Association (parent) | 0.00 | 0.00 | 0.00 |
| Customers | 0.00 | 0.00 | 0.00 |
| Suppliers | 0.00 | 0.00 | 0.00 |
| Family members of workers with disabilities (RSE) | 14,821.01 | 7.87 | 0.23 |
| Public administration, provincial and state | 37,548.59 | 19.93 | 0.58 |
| Community and local territory | 43,785.60 | 23.24 | 0.67 |
| Volunteers at the Horticultural School | 6952.89 | 3.69 | 0.11 |
| TOTAL | 188,366.40 | 100.00 | SROI = 2.90 |
| Stakeholder | Total Impact Value (€) | % Impact | € Impact/€ Invested |
|---|---|---|---|
| Workers with disabilities and users of home-residence (RSE) | 123,791.64 | 10.10 | 0.28 |
| Technical team: professionals and those of the home-residence | 246,335.22 | 20.11 | 0.55 |
| Volunteers | 36,432.86 | 2.97 | 0.08 |
| Barcelona City Council | 180,937.50 | 14.77 | 0.41 |
| Sabadell Agrarian Park | 5259.38 | 0.43 | 0.01 |
| Customers of production and external services | 0.00 | 0.00 | 0.00 |
| Suppliers | 0.00 | 0.00 | 0.00 |
| Public administration, provincial and state | 113,430.10 | 9.26 | 0.25 |
| Families and tutors | 224,039.79 | 18.29 | 0.50 |
| Guardian foundations: “Som Fundació” and 3 more | 25,072.56 | 2.05 | 0.06 |
| Community and local territory | 269,785.47 | 22.02 | 0.61 |
| TOTAL | 1,225,084.52 | 100.00 | SROI = 2.75 |
| Stakeholder | Total Impact Value (€) | % Impact | € Impact/€ Invested |
|---|---|---|---|
| Disabled workers (RSE) | 6914.50 | 11.90 | 0.32 |
| Foundation users and workers in the Espígol store | 14,370.39 | 24.72 | 0.67 |
| Permanent volunteers in the technical team | 3353.91 | 5.77 | 0.16 |
| Temporary volunteers in the technical team | 11,321.83 | 19.48 | 0.53 |
| Casa Dalmases Foundation technical team | 7064.97 | 12.16 | 0.33 |
| Members of the board of trustees of Casa Dalmases | 0.00 | 0.00 | 0.00 |
| Family members of people in programs of social and job integration (RSE workers) | 468.25 | 0.81 | 0.02 |
| Customers | 0.00 | 0.00 | 0.00 |
| Suppliers | 0.00 | 0.00 | 0.00 |
| Collaborating entities (Alba Association, L’Olivera, etc.) | 0.00 | 0.00 | 0.00 |
| “Obra Social La Caixa” Foundation | 0.00 | 0.00 | 0.00 |
| Public administration | 2882.92 | 4.96 | 0.14 |
| Community and territory | 11,742.68 | 20.20 | 0.56 |
| TOTAL | 58,119.45 | 100.00 | SROI = 2.73 |
| Stakeholder | Total Impact Value (€) | % Impact | € Impact/€ Invested |
|---|---|---|---|
| Workers of the employment integration company (EIC) | 44,647.74 | 16.22 | 0.39 |
| Professionals (technical team) | 51,384.30 | 18.67 | 0.44 |
| Volunteers and trainees | 16,363.67 | 5.95 | 0.14 |
| Ship2b Foundation | 3800.00 | 1.38 | 0.03 |
| Customers | 0.00 | 0.00 | 0.00 |
| Suppliers | 0.00 | 0.00 | 0.00 |
| Families of EIC workers | 6740.16 | 2.45 | 0.06 |
| Portal Foundation | 0.00 | 0.00 | 0.00 |
| Amalgama Association | 0.00 | 0.00 | 0.00 |
| Catalunya-La Pedrera Foundation (Agrosocial network) | 0.00 | 0.00 | 0.00 |
| Public administration | 46,325.86 | 16.83 | 0.40 |
| Community and local territory | 105,968.68 | 38.50 | 0.91 |
| TOTAL | 275,230.40 | 100.00 | SROI = 2.37 |
| Stakeholder | Total Impact Value (€) | % Impact | € Impact/€ Invested |
|---|---|---|---|
| Disabled workers in the EIC | 30,921.81 | 21.17 | 0.47 |
| Users of Training, Social, and Employment Service | 14,154.49 | 9.69 | 0.22 |
| Professional workers (technical team) | 24,188.43 | 16.56 | 0.37 |
| L’Afrau Association | 0.00 | 0.00 | 0.00 |
| Customers | 0.00 | 0.00 | 0.00 |
| Suppliers | 0.00 | 0.00 | 0.00 |
| Families of EIC workers | 11,233.60 | 7.69 | 0.17 |
| Public administration, provincial and state | 47,729.55 | 32.68 | 0.73 |
| Community and territory | 17,823.71 | 12.20 | 0.27 |
| TOTAL | 146,051.58 | 100.00 | SROI = 2.22 |
| Entity | Total Investment | Total Impact | Present Value of Impact | Total Impact/Total Investment | SROI 2015 |
|---|---|---|---|---|---|
| Aprodisca Amb Eco | 63,151.04 | 188,366.40 | 182,880.00 | 2.98 | 2.90 |
| Can Calopa de Dalt | 432,645.59 | 1,225,084.52 | 1,189,402.45 | 2.83 | 2.75 |
| Casa Dalmases | 20,652.16 | 58,119.45 | 56,458.85 | 2.81 | 2.73 |
| Delícies Berguedà | 112,550.01 | 275,230.40 | 267,213.99 | 2.45 | 2.37 |
| Riuverd | 63,763.29 | 146,051.58 | 141,797.65 | 2.29 | 2.22 |
| TOTAL | 692,762.09 | 1,892,852.35 | 1,837,752.94 | 2.73 | 2.65 |
| Entity/Stakeholders | Aprodisca A. E. | Can Calopa | Casa Dalma | Delícies Berguedà | Riuverd | TOTAL | % |
|---|---|---|---|---|---|---|---|
| Beneficiaries | 47,905 | 123,792 | 21,285 | 44,648 | 45,076 | 282,706 | 14.9 |
| Technical team | 37,354 | 246,335 | 7065 | 51,384 | 24,188 | 366,326 | 19.4 |
| Volunteers | 6953 | 36,433 | 14,676 | 16,364 | -- | 74,426 | 3.9 |
| Families and tutors | 14,821 | 249,113 | 468 | 6740 | 11,234 | 282,376 | 14.9 |
| Public administration | 35,549 | 113,430 | 2883 | 46,326 | 27,730 | 245,918 | 13.0 |
| Agreement among entities | -- | 186,197 | -- | 3800 | -- | 189,997 | 10.1 |
| Community, Territory | 43,786 | 269,785 | 11,743 | 105,969 | 19,820 | 451,103 | 23.8 |
| TOTAL | 188,366 | 1,225,085 | 58,119 | 275,230 | 146,052 | 1,892,852 | 100.0 |
| Entity | Economic | Social | Environmental | Total Impact |
|---|---|---|---|---|
| Aprodisca Amb Eco | 134,579.81 | 51,374.15 | 2412.44 | 188,366.40 |
| Can Calopa de Dalt | 701,793.67 | 406,559.72 | 116,731.13 | 1,225,084.52 |
| Casa Dalmases | 41,591.79 | 16,527.66 | 0.00 | 58,119.45 |
| Delícies del Berguedà | 217,885.08 | 57,345.32 | 0.00 | 275,230.40 |
| Riuverd | 77,915.80 | 67,357.57 | 778.21 | 146,051.58 |
| TOTAL | 1,173,766.15 | 599,164.42 | 119,921.78 | 1,892,852.35 |
| % of total impact | 62.01 | 31.65 | 6.34 | 100.00 |
| € per € invested | 1.65 | 0.84 | 0.17 | 2.66 |
© 2020 by the authors. Licensee MDPI, Basel, Switzerland. This article is an open access article distributed under the terms and conditions of the Creative Commons Attribution (CC BY) license (http://creativecommons.org/licenses/by/4.0/).
Share and Cite
Tulla, A.F.; Vera, A.; Guirado, C.; Valldeperas, N. The Return on Investment in Social Farming: A Strategy for Sustainable Rural Development in Rural Catalonia. Sustainability 2020, 12, 4632. https://doi.org/10.3390/su12114632
Tulla AF, Vera A, Guirado C, Valldeperas N. The Return on Investment in Social Farming: A Strategy for Sustainable Rural Development in Rural Catalonia. Sustainability. 2020; 12(11):4632. https://doi.org/10.3390/su12114632
Chicago/Turabian StyleTulla, Antoni F., Ana Vera, Carles Guirado, and Natàlia Valldeperas. 2020. "The Return on Investment in Social Farming: A Strategy for Sustainable Rural Development in Rural Catalonia" Sustainability 12, no. 11: 4632. https://doi.org/10.3390/su12114632
APA StyleTulla, A. F., Vera, A., Guirado, C., & Valldeperas, N. (2020). The Return on Investment in Social Farming: A Strategy for Sustainable Rural Development in Rural Catalonia. Sustainability, 12(11), 4632. https://doi.org/10.3390/su12114632