Article

Study on the Spatial Differentiation of the Populations on Both Sides of the “Qinling-Huaihe Line” in China

1
School of Geographical Science, Northeast Normal University, Changchun 130024, China
2
Department of Resources Management, Tangshan Normal University, Tangshan 063000, China
*
Author to whom correspondence should be addressed.
Sustainability 2020, 12(11), 4545; https://doi.org/10.3390/su12114545
Submission received: 31 March 2020 / Revised: 24 April 2020 / Accepted: 27 May 2020 / Published: 3 June 2020
(This article belongs to the Section Sustainability in Geographic Science)

Abstract

:
The “Qinling-Huaihe Line” is the recognized geographical boundary between north and south China. In the context of a widening north–south gap, the large-scale population flow and the implementation of the regional coordinated development strategy, the north–south differentiation of the Chinese population requires further investigation. This study is based on national census data and uses quantitative methods, such as the centralization index, coefficient of variation, hot spot analysis and geodetector, as research methods. This study takes the Qinling-Huaihe Line as the dividing line and aims to extensively explore the spatial differentiation, evolutionary characteristics, and influential factors of the populations on both sides. The main conclusions are as follows: ① From 1982 to 2010, the population share ratio on the south and north sides of the Qinling-Huaihe Line remained at 58:42, showing a distribution pattern of “South more and North less”. ② The area within 200 km from the Qinling-Huaihe Line is a transition area with a stable distribution of the populations on both sides. ③ From 1982 to 2010, the concentration of the population distribution gradually increased on both sides, and the concentration of population on the south side was higher; the characteristics of population growth had significant spatial differences between the two sides. ④ The results calculated by the geodetector method show that socioeconomic factors are the main factors causing the spatial differentiation of the populations, while physical geographical environmental factors have a smaller influence and their influence continues to decrease.

1. Introduction

Exploring how 10 billion people live and are distributed on the Earth has been considered to be one of the 11 major strategic directions of geography science in the 21st century, and population distribution has always been an important issue in geographical studies [1]. According to World Bank data, the world’s total population reached 7.594 billion in 2018, and the total population of China was 1.395 billion, more than 18% of the world’s total. The land area of China is similar to that of Canada, the United States, Brazil and Australia, but the Chinese population is more than twice the total population of these four countries. Both India and China have a population of more than 1.3 billion, and the combined population of the two countries accounts for one-third of the world’s population, but the land area of China is nearly three times that of India. This shows that the population distribution has significant spatial differences around the world. Spatial differentiation of populations within countries is also a common phenomenon. Currently, approximately 94% of the Chinese population is distributed the southeastern half of the “Hu Huanyong Line” [2]. More than 90% of Canada’s population lives in the southern region within 250 km of the United States border [3]. Nearly 80% of Russia’s population is distributed in Europe, which accounts for only one-quarter of the country’s territory, while the vast Far East region is very sparsely populated [4].
There are two important geographical dividing lines in China, namely, the “Aihui (now Heihe) -Tengchong Line” and the “Qinling-Huaihe Line”, both of which were awarded the “Great Geographical Discoveries of China in 100 Years” by Chinese National Geography and the Geographical Society of China in 2009 [5]. Hu Huanyong, a famous Chinese geographer, proposed the Aihui (now Heihe) -Tengchong Line in 1935, which revealed that the Chinese population was unevenly distributed. This dividing line is called the “Hu Huanyong Line” by scholars at home and abroad. According to the Hu Huanyong Line, 36% of the southeast area is home to 96% of the total national population, while the northwest area accounts for approximately 64% of the land area and only has 4% of the total population [6]. In fact, the Hu Huanyong Line is both a population line and a comprehensive ecological and environmental boundary, which is roughly consistent with the 400 mm equal precipitation line, the line dividing arid and semiarid regions, the line dividing the first and second steps of the terrain, and the line dividing agriculture and animal husbandry [7,8]. The Hu Huanyong Line essentially reflects the high spatial coupling of the Chinese population and the physical geographical environment, which is one of the major geographical discoveries on man–land relationships [9]. The Qinling-Huaihe Line is recognized as an extremely important north–south geographical demarcation line in China that was first proposed by Zhang Xiangwen in the new physiography, and it was used to divide the northern and the southern regions [10]. The Qinling-Huaihe Line has a rich comprehensive geographical connotation, which is highly consistent with the 800 mm equal precipitation line, the line demarcating the humid region and sub-humid region, the 0 °C isotherm in January, and the subtropical and warm temperate zone boundary line. Over a long period of development, the northern and southern regions have formed many natural and human landscape differences, which include climate differences, product differences, dietary differences, language differences, and personality differences. Currently, studies on the Qinling-Huaihe Line are mainly related to the physical geographical category [11], and few scholars have explored its economic and social connotations.
After the reform and opening up, the issue of unbalanced development in north and south China has gradually become more prominent [12], and the resulting aggravation of population flow has promoted the reconstruction of the spatial pattern of the population. At the same time, population, as the main carrier of economic and social activities, has had a prominent spatial response to the unbalanced development of the north and the south. This research studies the spatial differentiation of the populations on both sides of the Qinling-Huaihe Line and aims to explore the differences in development between the north and south from the perspective of population. The following research framework was used (Figure 1): First, we took the southeastern half of the Hu Huanyong Line as the research area, and based on 1982, 1990, 2000, and 2010 national census data, we used mathematical statistics, the concentration index, the coefficient of variation, and hot spot analysis, as well as GIS spatial analysis methods to analyze the characteristics of population spatial differentiation on both sides of the Qinling-Huaihe Line. This mainly included three aspects: the population share ratio, the spatial pattern of population agglomeration and dispersion, and population growth. In view of the fact that the Qinling-Huaihe Line is delimited according to natural mountains and rivers and has a certain transition zone, the analysis of the population share ratio was carried out from two aspects: overlay analysis and equidistant analysis. Second, using the man–land relationships as a reference, we explored the effects of various natural and socioeconomic factors on the spatial heterogeneity of the population by the geodetector method. This study enriches and deepens the knowledge on the comprehensive geographical connotations of the Qinling-Huaihe Line and excavates its human geographical value as the north–south dividing line. It also makes up for the lack of previous research [13,14] on the north–south differentiation of the Chinese population, contributes to improving the understanding of the distribution pattern of the Chinese population in more detail, and provides a reference for guiding the construction of new urbanization, promoting regionally coordinated and sustainable development and narrowing regional development gaps.

2. Literature Review

2.1. Spatial Distribution of the Population

With the development of population geography, the research content on the spatial distribution of the population has become more abundant. Some scholars have measured the population distribution characteristics based on the total population size or the population density. Pan et al. [15] analyzed the population changes and spatial-temporal distribution patterns in China and found that the total population showed a fluctuating upward trend and that the distribution pattern was more balanced. Kabisch and Haase [16] explored the characteristics of population changes in 158 European agglomeration areas, and the results showed that the study areas had a diversified development pattern of suburbanization and reurbanization. Gong and Chen [14] used the population density indicator to explore the historical changes in demographic borderlines dividing sparsely and densely populated areas in China and carried out mathematical fitting. Benassi and Naccarato [17] used Taylor’s power law to analyze the spatial variation of Italy’s population density from 1971 to 2011. Shi et al. [18] found that the population of North Korea was concentrated in the southwest coastal plain area after spatial simulation of the population density distribution. Craig and Margaret [19] summarized the distribution characteristics of the population density in North America and matched them with the supply of highways. Some scholars have focused on the counter urbanization phenomenon of population distribution shifting from urban to rural. Gro [20] interpreted the counter urbanization phenomenon in Norway and stated that family relations and economic issues are important causes of rural migration. Owen and Jacqueline [21] found that the counter urbanization in Zambia has mainly been affected by population migration. Jain and Korzhenevych [22] predicted India’s counter urbanization process and put forward corresponding policy recommendations. Other scholars have explored the relationship between the spatial distribution of the population and socioeconomic phenomena. Guan et al. [23] analyzed the spatial agglomeration process of the population and industry, further identified the problems caused by the mismatch of the two elements, and then proposed relevant policy suggestions. Baumont et al. [24] explored the spatial distribution characteristics of the population and employment in the agglomeration of Dijon in France.
In terms of research objects, scholars have mainly studied the spatial distribution patterns of populations within countries, regions, provinces and cities. Liu et al. [25] used the classification evaluation method of population agglomeration to classify China into eight levels and proposed a population concentration pattern of “one belt, three rivers, two lines, and several regional population centers”. Li et al. [26] focused on the spatial correlations among the population, land area and GDP and proposed the “1 + 4 + 11” spatial structure for the population in China. Doll and Pachauri [27] analyzed the spatial distribution pattern of the population in rural areas by means of a gridded population database. Hoekveld [28] focused on declining regions and analyzed regional differences in population development in Saarland, Germany. You et al. [29] found that the population is relatively sparse in Chinese border areas and that the population density in these areas is much lower than the national average population density. Zuo et al. [30] explored the spatial-temporal evolution and spatial structure characteristics of the population in Xinjiang and proposed that this population presents fragmented spatial distribution characteristics and has an obvious autocorrelations. Zhou and Bian [31] studied the population growth and the changing process of its distribution in Guangzhou over the last 30 years and found that the population of Guangzhou had maintained stable growth and showed a dispersed distribution trend, belonging to the stage of central district development suburbanization.
The research scale has been refined from the provincial level, prefecture level and county level to the township level. Deng et al. [32] predicted the size of the total population of China from 2010 to 2050 at the provincial level and further studied the development scenarios and evolutionary characteristics of the population spatial pattern. Zhang et al. [33] analyzed the spatial distribution and evolutionary characteristics of the population from the perspective of urban agglomeration by using prefecture-level census data. Gao et al. [34] explored the spatial distribution and changes in ethnic minority populations at the county level and noted that the distribution of ethnic minority populations was widespread and uneven, with a significant spatial agglomeration. Bai et al. [35] used town-level census data in 2000 to describe the concentration degree and latitude and longitude characteristics of the Chinese population distribution and found that the distribution at township level can reflect the different characteristics of the population better than the county level.
Based on the Western theoretical model [36,37] and support from spatial information technology, research methods on the distribution pattern of populations have become increasingly diverse. Using population landscape density data based on grid calculation, Du et al. [38] combined the geostatistical method with the population density model to analyze the spatial correlations and variability of populations. Liu et al. [39] analyzed the spatial distribution and evolution of the total population, household population and migrant population in Guangzhou since the reform and opening up by using a population density contour map and exploratory spatial data analysis (ESDA). Wang et al. [40] reconstructed the distribution map of the historical population density in Gansu Province of China using the random forest model. Peng et al. [41] believed that the high-resolution gridded population surface (HGPS) can better highlight the heterogeneity of population compared with the land cover-based population product (LCPP). Yang et al. [42] built an updated grid-based population database system with the help of geographical information technology. In order to improve the precision of the gridded population distribution, Dong et al. [43] and Huang et al. [44] compared and analyzed the suitability of different grid sizes. Some scholars have used nighttime satellite imagery and twitter geolocation density to simulate the population distribution [45,46,47,48].
In recent years, there have been many studies on the spatial distribution of the Chinese population based on the Hu Huanyong Line. Scholars have used population census data, land use data, remote sensing data, and other diversified types of data to test the stability of the Hu Huanyong Line and have further explored the distribution pattern and evolutionary characteristics of the populations on both sides of the Hu Huanyong Line [49,50,51]. The results showed that the spatial distribution pattern of the Chinese population divided by the Hu Huanyong Line is basically stable and that the spatial distribution patterns between the eastern and western regions are significantly different. Qi et al. [52] applied the Hu Huanyong Line idea and proposed the “Qi Ji Line” scheme to clarify the regional differentiation characteristics of the population in the Tibetan Plateau. In response to the question of “whether the Hu Huanyong Line can be broken” raised by premier Li Keqiang in 2014, Chinese scholars have conducted extensive discussions on the topics of “whether the Hu Huanyong Line should be broken” and “how to break through” at different levels [7,9,53].

2.2. Factors Influencing the Spatial Distribution of the Population

In the early periods of population research, most scholars conducted research describing the population distribution and explained the differentiation between the regional distribution of the population from the perspective of the conditions and characteristics of the natural environment [54]. With the deepening of the quantitative revolution and the development of population geography, quantitative research from the perspective of man–land relationships is increasing. Most studies focus on the relationships among population and resources, environment, economy, and society. The factors that influence the distribution pattern of population extend from natural environmental factors to comprehensive factors, such as the physical geographical environment, economy, and society. Wang et al. [55] measured the influences of 11 natural and socioeconomic factors on the changes in the Chinese population density by the partial least square (PLS) method and concluded that the influence of socioeconomic factors was relatively significant and that high levels of economic development, communication facilities, and medical conditions promote population agglomeration. Through spatial coupling of the population density and natural and economic factors, Lv et al. [56] confirmed that the population distribution has been affected by natural factors, of which climate and topography are the main factors, for a long time. Short-term changes have mainly been influenced by economic factors, such as industrial structure and transportation. Bai et al. [35] found that the population density was significantly affected by the land surface relief, road system density, water system density, and socioeconomic development level. Liu et al. [57] found that economic development and national policies have affected immigration choices, thus affecting the spatial pattern of the population. He et al. [58] proposed that the spatial distribution of the population is associated with economic transformation development and urbanization processes. Tan et al. [59] found that the urban population density is connected with a city’s size, the shape index of urban land, and the per capita wage. Mondal and Tatem [60] found that coastal flooding and a rising sea level may bring uncertainty to population distribution.
To summarize, research by scholars at home and abroad on the spatial distribution of populations and the factors influencing this process has achieved a wealth of research results. Research on the distribution pattern of the Chinese population is usually centred on the stability test and the “break” problem of the Hu Huanyong Line. Scholars have mainly discussed the differentiation phenomenon of the Chinese population from the perspective of east–west differences and have paid little attention to the internal differences in the southeast of the Hu Huanyong Line, especially the distribution of north–south differences in the population. Therefore, this study uses national census data, constructs a population spatial database by using county-level units, and aims to explore the spatial differentiation and evolutionary characteristics of the populations on both sides of the Qinling-Huaihe Line and its influencing factors.

3. Materials and Methods
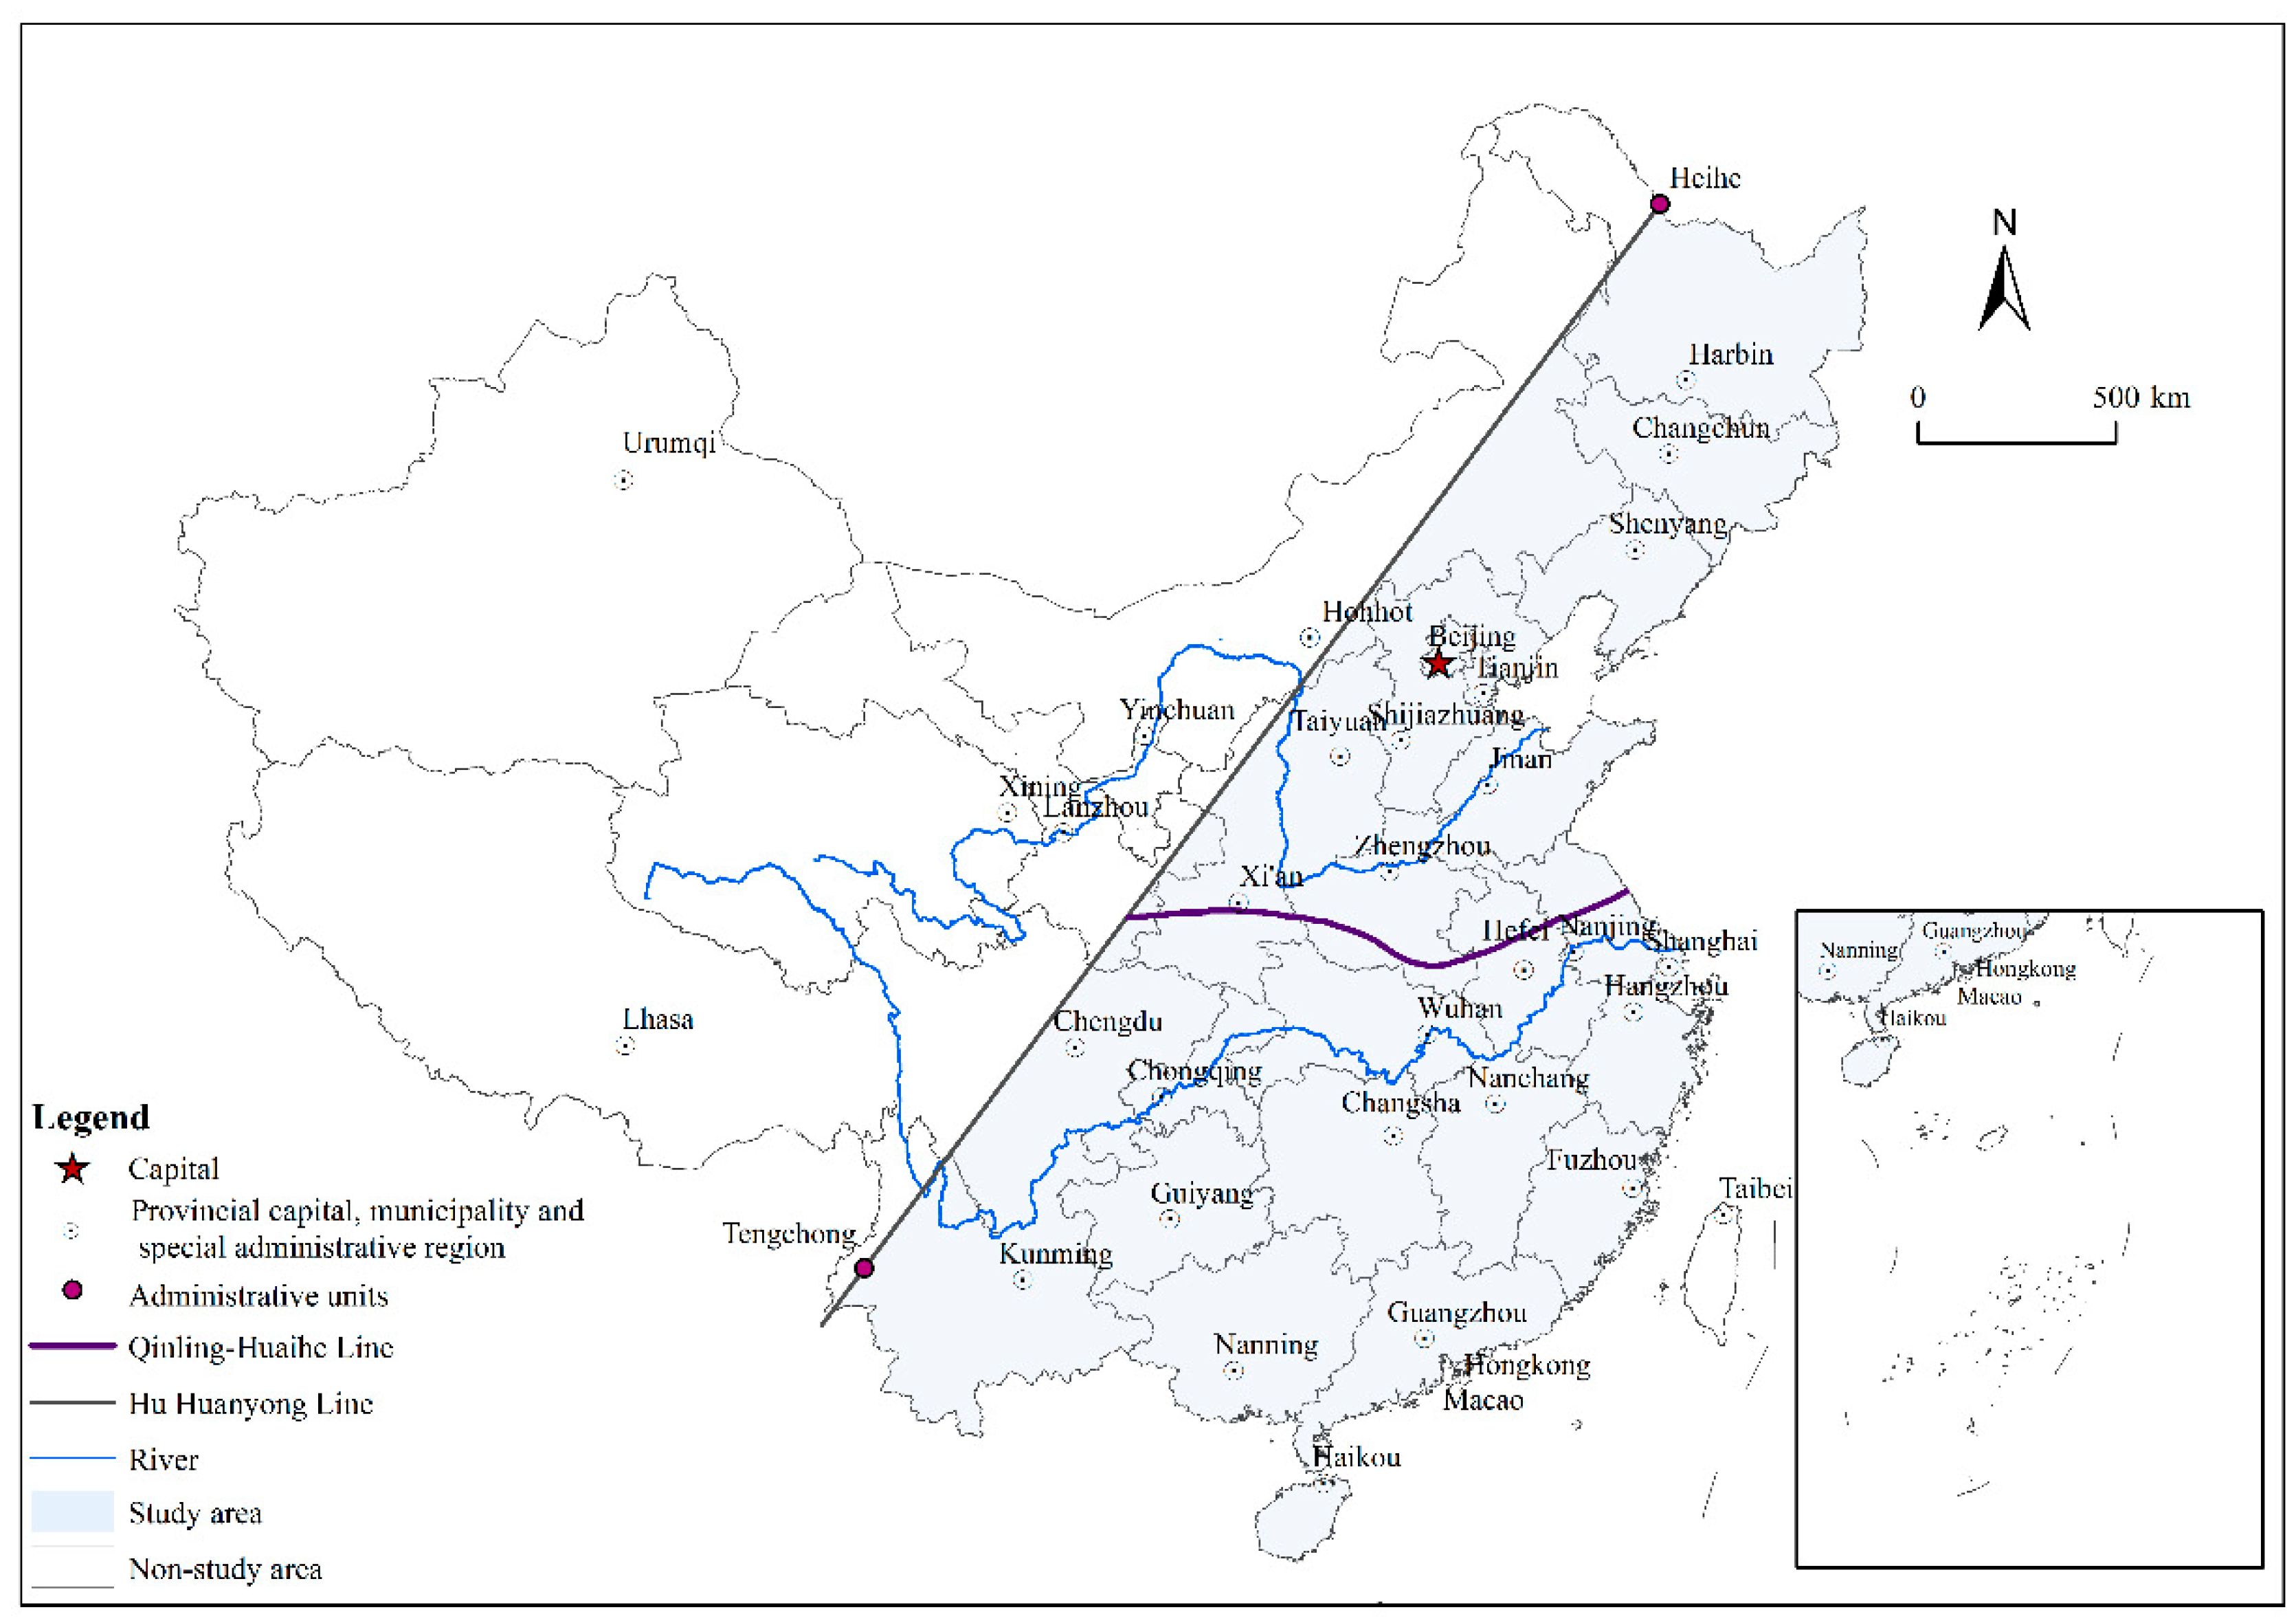
3.1. Study Area

The study area is the southeastern half of the Hu Huanyong Line, covering 27 provinces, municipalities, and autonomous regions (see Figure 2). The study area comprises approximately 94% of the Chinese population and is a densely populated area. The Qinling-Huaihe Line is an important physical geographical dividing line in China. The north and south sides of the Qinling-Huaihe Line have significant differences in climatic conditions, geomorphology, soil and vegetation, cropping systems, and river hydrological characteristics. The regional differences between the sides of the Qinling-Huaihe Line are also reflected in political and economic activities, traditional agricultural production activities and traditional residences. First, the economic center and the political center are differentiated on both sides of the Qinling-Huaihe Line. The Yellow River basin is the birthplace of the Chinese nation, and China’s political center has been located on the north side of the Qinling-Huaihe Line for a long time. After the Tang and Song dynasties, a large portion of the population moved south, and the economic center also moved southward [61]. The area south of the Qinling-Huaihe Line became China’s economic center. Second, there are obvious regional differences in traditional agricultural production activities. Affected by hydrothermal conditions, agriculture south of the Qinling-Huaihe Line is mostly composed of paddy fields, mainly rice and rape, whereas north of the Qinling-Huaihe Line, the land is mostly dry and wheat and peanuts are the main crops grown. Third, traditional residential buildings have their own characteristics. Most architecture south of the Qinling-Huaihe Line is built in the stilt style, which is convenient for ventilation and heat dissipation. On the other hand, the buildings north of the Qinling-Huaihe Line are mainly cave buildings, with thick walls that are good for keeping warm.

3.2. Data Sources and Processing

This study explored the spatial differentiation of populations on both sides of the Qinling-Huaihe Line after the reform and opening up. The population data were derived from four national population censuses in 1982, 1990, 2000 and 2010. The basic spatial data were based on 1:1 million county nationwide maps provided by the National Geomatics Center of China (NGCC). Taking into account the adjustment of administrative divisions and based on the “Administrative Divisions of the People’s Republic of China”, this study synchronized the fusion of county-level population data and the vector boundaries of the counties in each period to make them comparable between years and finally determined 1809 basic space units. Considering the research requirements of this article and the difficulty of data acquisition, the Hong Kong, Macao, and Taiwan regions as well as Kinmen County and Sanshawere not included.
This article also includes data on the attributes of the physical geographical environment and economic and social development. The physical geographical environmental data came from the Resource and Environment Data Center (RESDC) of the Chinese Academy of Sciences, and the economic and social development data came from the “Chinese City Statistical Yearbook” [62,63], “Chinese County Statistical Yearbook” [64,65] and the National Intellectual Property Administration Patent Information Service Information Platform (search. cnipr. com).
In this study, the Hu Huanyong Line was drawn by connecting the geographic coordinate points of the two cities, Heihe and Tengchong and extended to both ends to delineate the southeastern half of China. The counties that intersect the Hu Huanyong Line were included in the study area if more than one-quarter of their area was inside it. Considering the research needs and practicability, the Qinling-Huaihe Line was drawn with reference to Chinese climatic types and was replaced by the boundary between the subtropical and warm temperate zones. This boundary is roughly consistent with the location of the Qinling-Huaihe Line. The counties where the line intersects were classified into the north or south sides according to which side contained more than half of the area of the county; this had little impact on the analysis of the macro-population distribution.

3.3. Methods

3.3.1. Concentration Index

The concentration index was used to measure the concentration of the regional population. We used the standardization method of dispersion as a reference to rank the population in order. We calculated the concentration index based on the cumulative percentage, and took the random distribution and absolute clustering distribution as extreme values. The calculation formula used was:
I = i = 1 n p i i = 1 n 100 i n 100 n i = 1 n 100 i n
where I is the concentration index of the population, i is the population size order, pi is the cumulative percentage of the population in order i, and n is the number of basic spatial units. The index ranged from 0–1. A larger value indicated a higher population concentration.

3.3.2. Coefficient of Variation

The coefficient of variation essentially reflects the volatility of data. The coefficient of variation can be used to measure the discrete trends of population-related indicators and to reflect the degree of difference in the population distribution. The calculation formula used was:
C V = 1 n i = 1 n ( p i p ¯ ) 2 p ¯
where CV is the coefficient of variation; pi is the population index of research unit i; p ¯ is the average value of the population index; and n denotes the number of basic spatial units. The larger the coefficient of variation is, the greater the dispersion degree of the population index and the higher the difference in spatial distribution.

3.3.3. Hot Spot Analysis

The G* index can effectively reveal the locally related properties of each spatial element attribute. The visual map of the G* index can intuitively reflect the spatial distribution of the population and clarify the spatial location of the population. The calculation formula used was:
G i * = j = 1 n W i j X j X ¯ j = 1 n W i j S [ n j = 1 n W i j 2 ( j = 1 n W i j ) 2 ] n 1
where Xj is the population attribute value of the study unit j; X ¯ is the average value of the population attribute values of all spatial units; S is the standard deviation; Wij is the spatial weight matrix; and n is the number of study units. A positive value of G* indicates a local high-value agglomeration, and a negative value indicates a local low-value agglomeration. According to the size of G i * , the study area was divided into seven types, namely, first-level hot spots, secondary hot spots, third-level hot spots, not significant, third-level cold spots, secondary cold spots and first-level cold spots.

3.3.4. Geodetector

The geodetector method was proposed by Wang Jinfeng’s team and can be applied in research on influential factors and mechanisms [66]. The geodetector method is suitable for the analysis of type variables and makes up for the limitation of the use of type variables in general regression models. The factor detector can detect the extent to which the influential factors explain the spatial differentiation of the population. The calculation formula used was:
q = 1 1 N δ 2 h = 1 L N h δ h 2
where N h is the number of spatial units in the subarea; N is the number of all spatial units; L is the number of subareas; δ 2 is the variance of regional population size; and δ h 2 is the variance of the subarea population size. The value range of q is [0, 1]—the larger the value, the greater the influence of factors on the population distribution.
The interaction detector was used to analyze the interactions among influential factors. Comparison of the q value of a single factor and the q value of a two-factor interaction was used to evaluate whether the interaction of the two variables would increase or decrease the effect on the spatial differentiation of the population. There are five types of relationships between the two factors that affect the population distribution, which Meet the following conditions: q ( z i z j ) < min ( q ( z i ) , q ( z j ) ) is a nonlinear weakening interaction; min ( q ( z i ) , q ( z j ) ) < q ( z i z j ) < max ( q ( z i ) , q ( z j ) ) is a single linear weakening interaction; q ( z i z j ) > max ( q ( z i ) , q ( z j ) ) is a double factor interaction enhancement; q ( z i z j ) > q ( z i ) + q ( z j ) is a nonlinear enhancement; and q ( z i z j ) = q ( z i ) + q ( z j ) means the two factors are independent of each other.
Referring to previous related research [25,67], the factors that influence the spatial differentiation of the population mainly cover two aspects: physical geographical environmental factors and socioeconomic factors. Physical geographical environmental factors cover three indicators—temperature zone, arid/humid zoning, and geomorphology—which characterize the differences in the regional natural environmental conditions including climatological conditions and terrain fluctuations. Socioeconomic factors usually include five aspects: the regional economic development level, the natural production capacity, the ability to attract employment, the level of utility services and communication capabilities. This article used the per capita GDP, grain yield per unit area, the number of employees, the number of beds in hospitals and health centers, and the number of fixed telephones as corresponding indicators. Among them, compared with the per capita grain yield, we believe that the grain yield per unit area can more directly reflect the regional natural production capacity. Comprehensive consideration of innovation is playing an increasingly important role in promoting regional economic development, so regional innovation capabilities were added as socioeconomic factors. Referring to the existing research [68], we used the number of patent applications to measure innovation ability. The socioeconomic indicators were divided into five categories using the method of nature breaks. Considering the availability, completeness, and unity of the data, the factors affecting the spatial differentiation of the population were analyzed after 2000. Table 1 shows the specific indicators.

4. Results and Analysis

4.1. Spatial Differentiation Characteristics of the Populations on Both Sides of the Qinling-Huaihe Line

4.1.1. Population Share Ratio

The demographic data show that the overall distribution of the populations between the two sides of the Qinling-Huaihe Line did not change significantly between 1982 and 2010 and that the overall distribution of the populations remained at approximately 58:42 (see Table 2). From 1982 to 2010, the population of the study area increased from 953 million to 1.258 billion, an increase of 305 million people; the population on the south side of the Qinling-Huaihe Line increased from 552 million to 734 million, and the population on the north side increased from 401 million to 524 million. The population density of the south side increased from 227 people/km2 to 302 people/km2, and the population density of the north side increased from 208 people/km2 to 271 people/km2. In terms of the proportions, after rounding, it was found that the proportions of the population on the south and north sides remained at 58% and 42%, respectively, and the south side maintained a relatively significant population scale advantage in 1982, 1990, 2000 and 2010. However, there were slight changes in stability. By observing the decimal places of the proportion of the population, it was found that the proportion of the population on the south side decreased slightly from 57.94% to 57.52% from 1982 to 1990 and then continued to increase slightly to 58.36% in 2010, with a total increase of 0.42 percentage points. The proportion of the population on the north side exhibited the opposite trend: 42.06% in 1982, a slight increase in 1990, and then a slight decrease to 41.64%.
In terms of population growth, the population continued to increase on both sides of the Qinling-Huaihe Line, but the population increase on the south side was always higher than that on the north side. From 1982 to 2010, the population on the south side increased by 182 million, while that on the north side increased by 120 million. The population increase of the south side was 1.19 times that of the north side between 1982 and 1990, and this increased to 1.73 times between 2000 and 2010. In terms of the interannual change, from 1982 to 2010, the average annual growth rate of the populations on the north and south sides showed downward trends in different periods. Except for in 1982–1990, the average annual growth rate of the population on the south side was higher than that on the north side in other periods. The spatial distribution of the populations on both sides of the Qinling-Huaihe Line tended to move southward.
The equidistant analysis used 100 km as the basic metric to cover the entire area. To more clearly show the difference in the population distribution and to save space, distance of 100, 200, 300, 600, 900, and 2100 km were selected for comparison and analysis. Figure 3 shows that within 100 km of the Qinling-Huaihe Line, the proportion of the population on the north side was apparently higher than that on the south side, with the population share ratio rising from 0.57:0.43 in 1982 to 0.59:0.41 in 2010, representing 14 and 18 percentage points difference, respectively. Within the range of 100–200 km, the proportion of the population was roughly the same on both sides, and the proportion of the population on the south side was slightly higher than that on the north side by 2–4 percentage points. In the ranges of 200–300, 300–600, 600–900, and 900–2100 km, the proportion of the population on the south side is significantly higher than that of the north side, and the proportion difference was more than 14 percentage points. On the whole, the spatial distribution of the population within the equidistant range on both sides of the Qinling-Huaihe Line goes from a higher proportion of the population on the north side to a higher proportion of the population on the south side, and the proportions of the population on the south and north sides are nearly equal within the range of 100–200 km. After the distance exceeds 200 km, the proportion of the population on the south side is always significantly higher than that on the north side. The population distribution pattern of “South more and North less” on both sides of the Qinling-Huaihe Line has a certain transition area in the latitude zone, that is, within a range of 200 km from the Qinling-Huaihe Line.

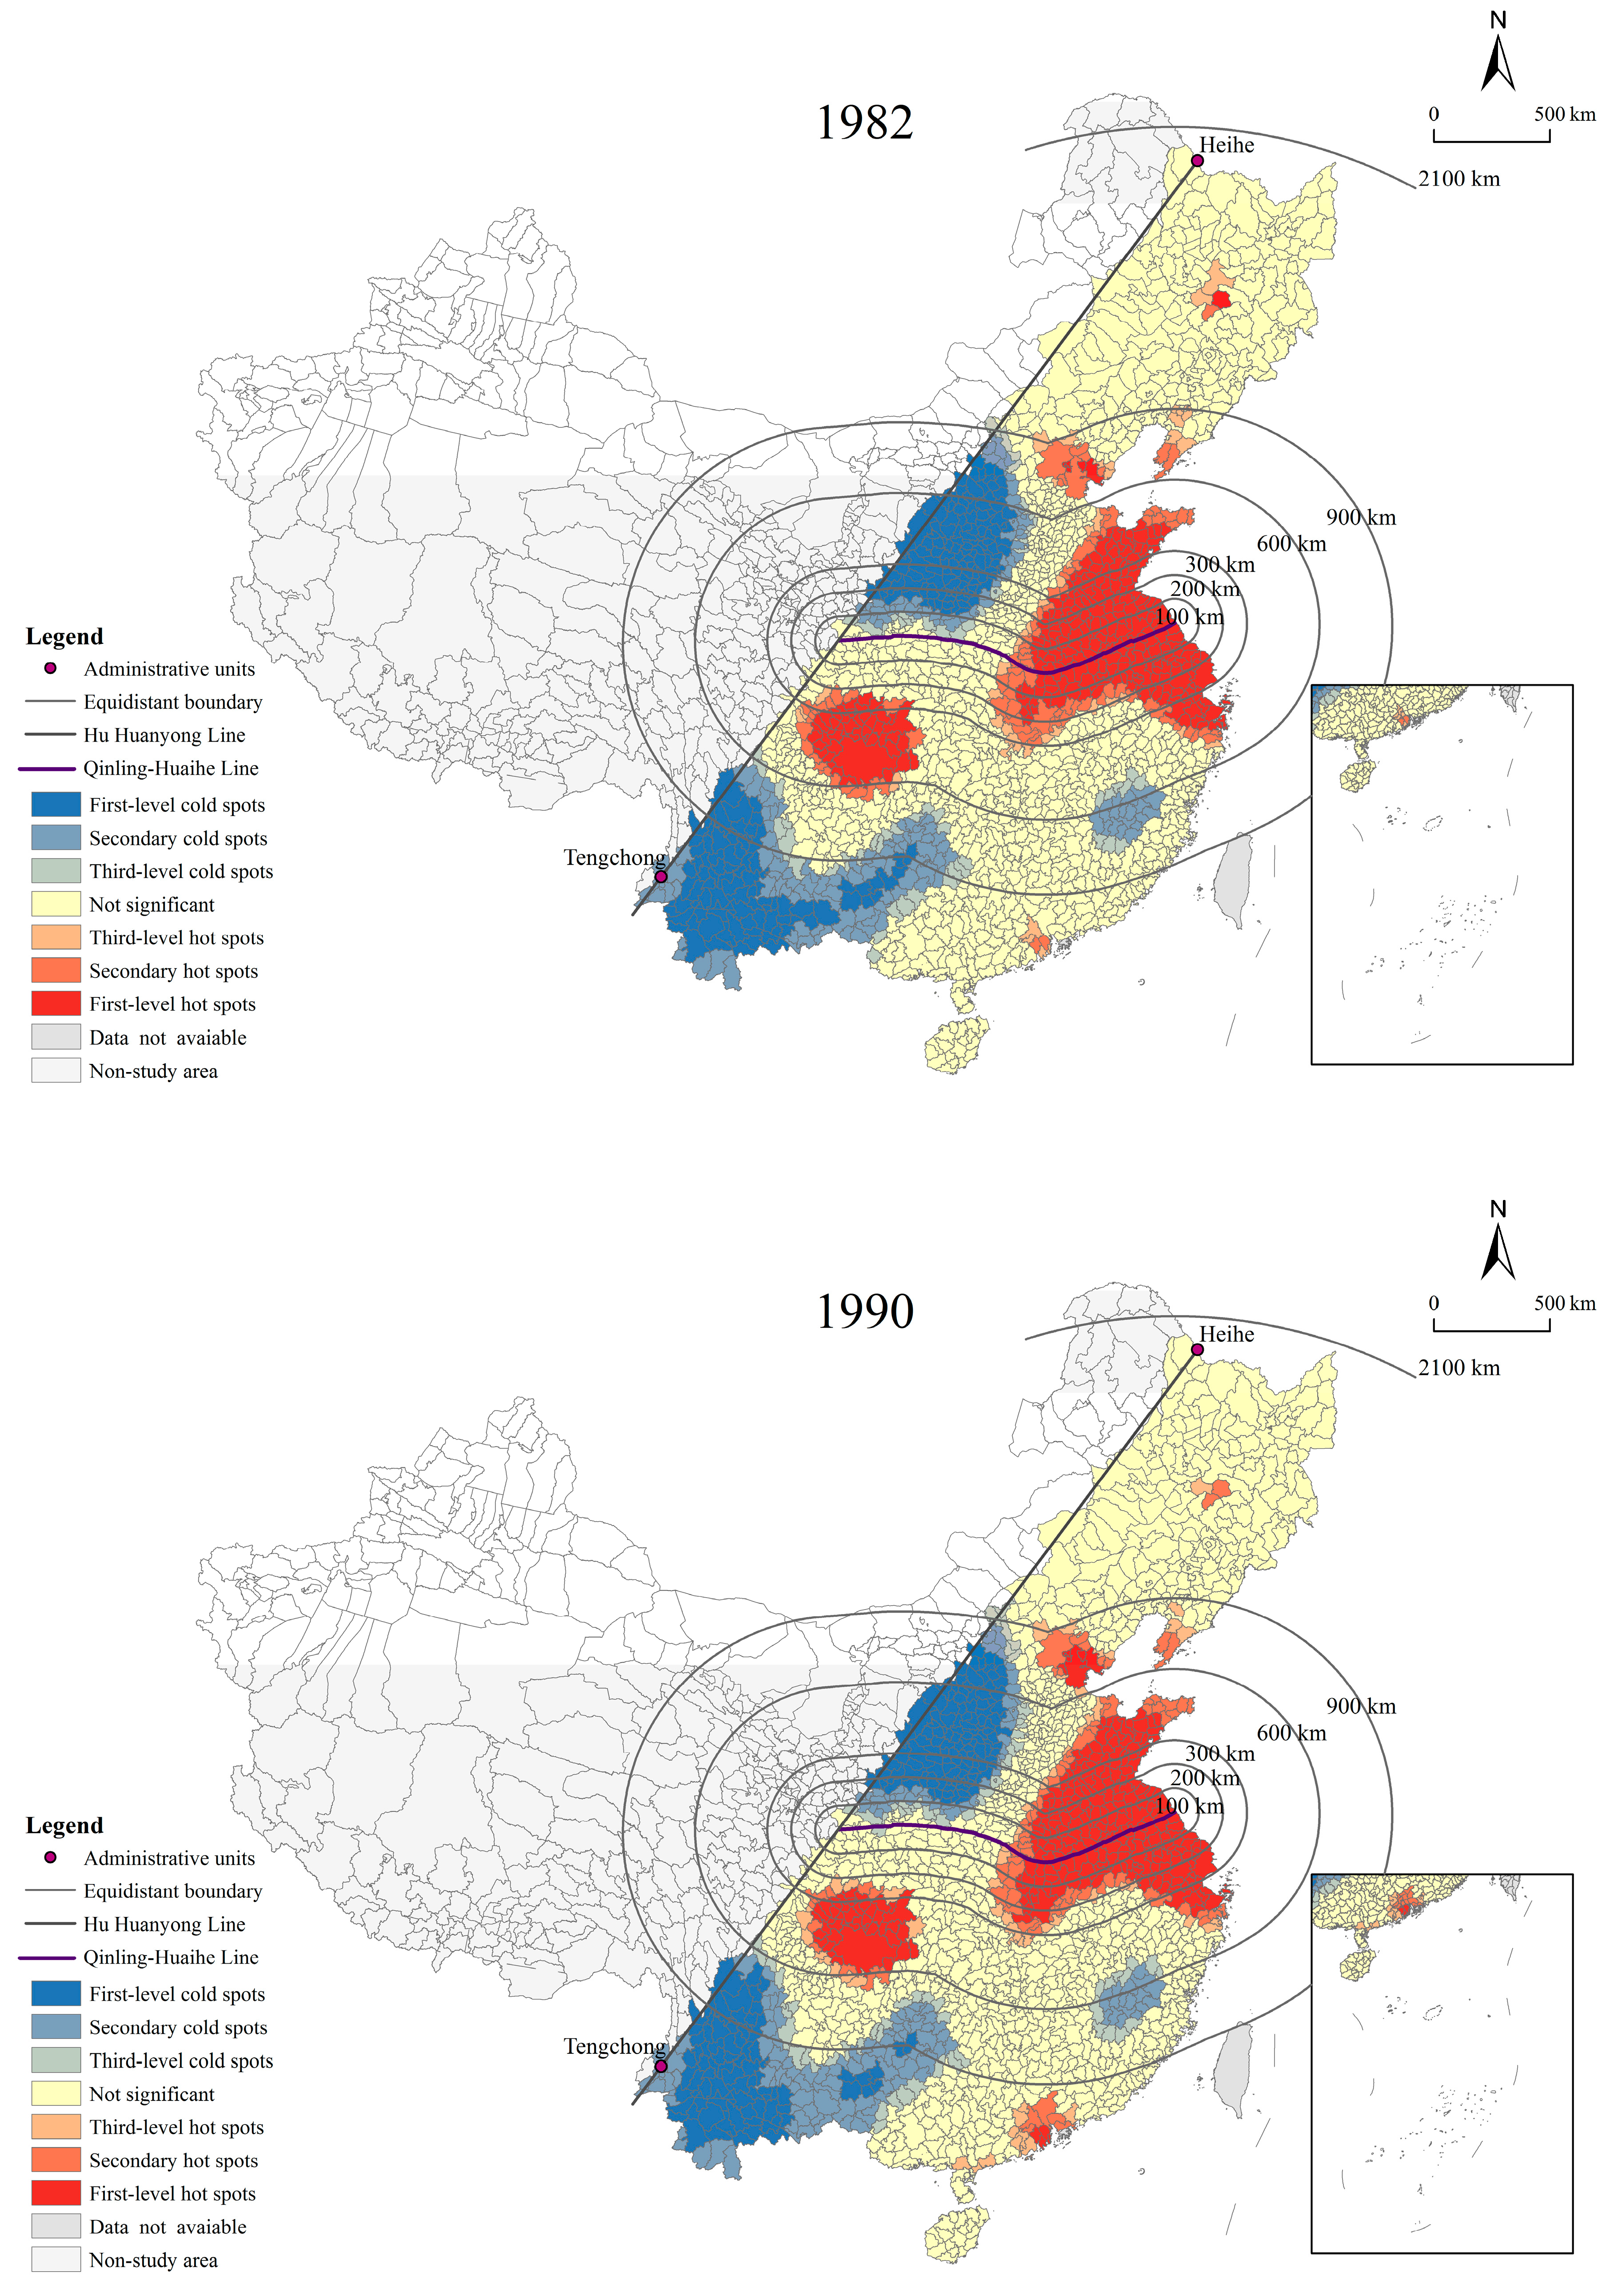
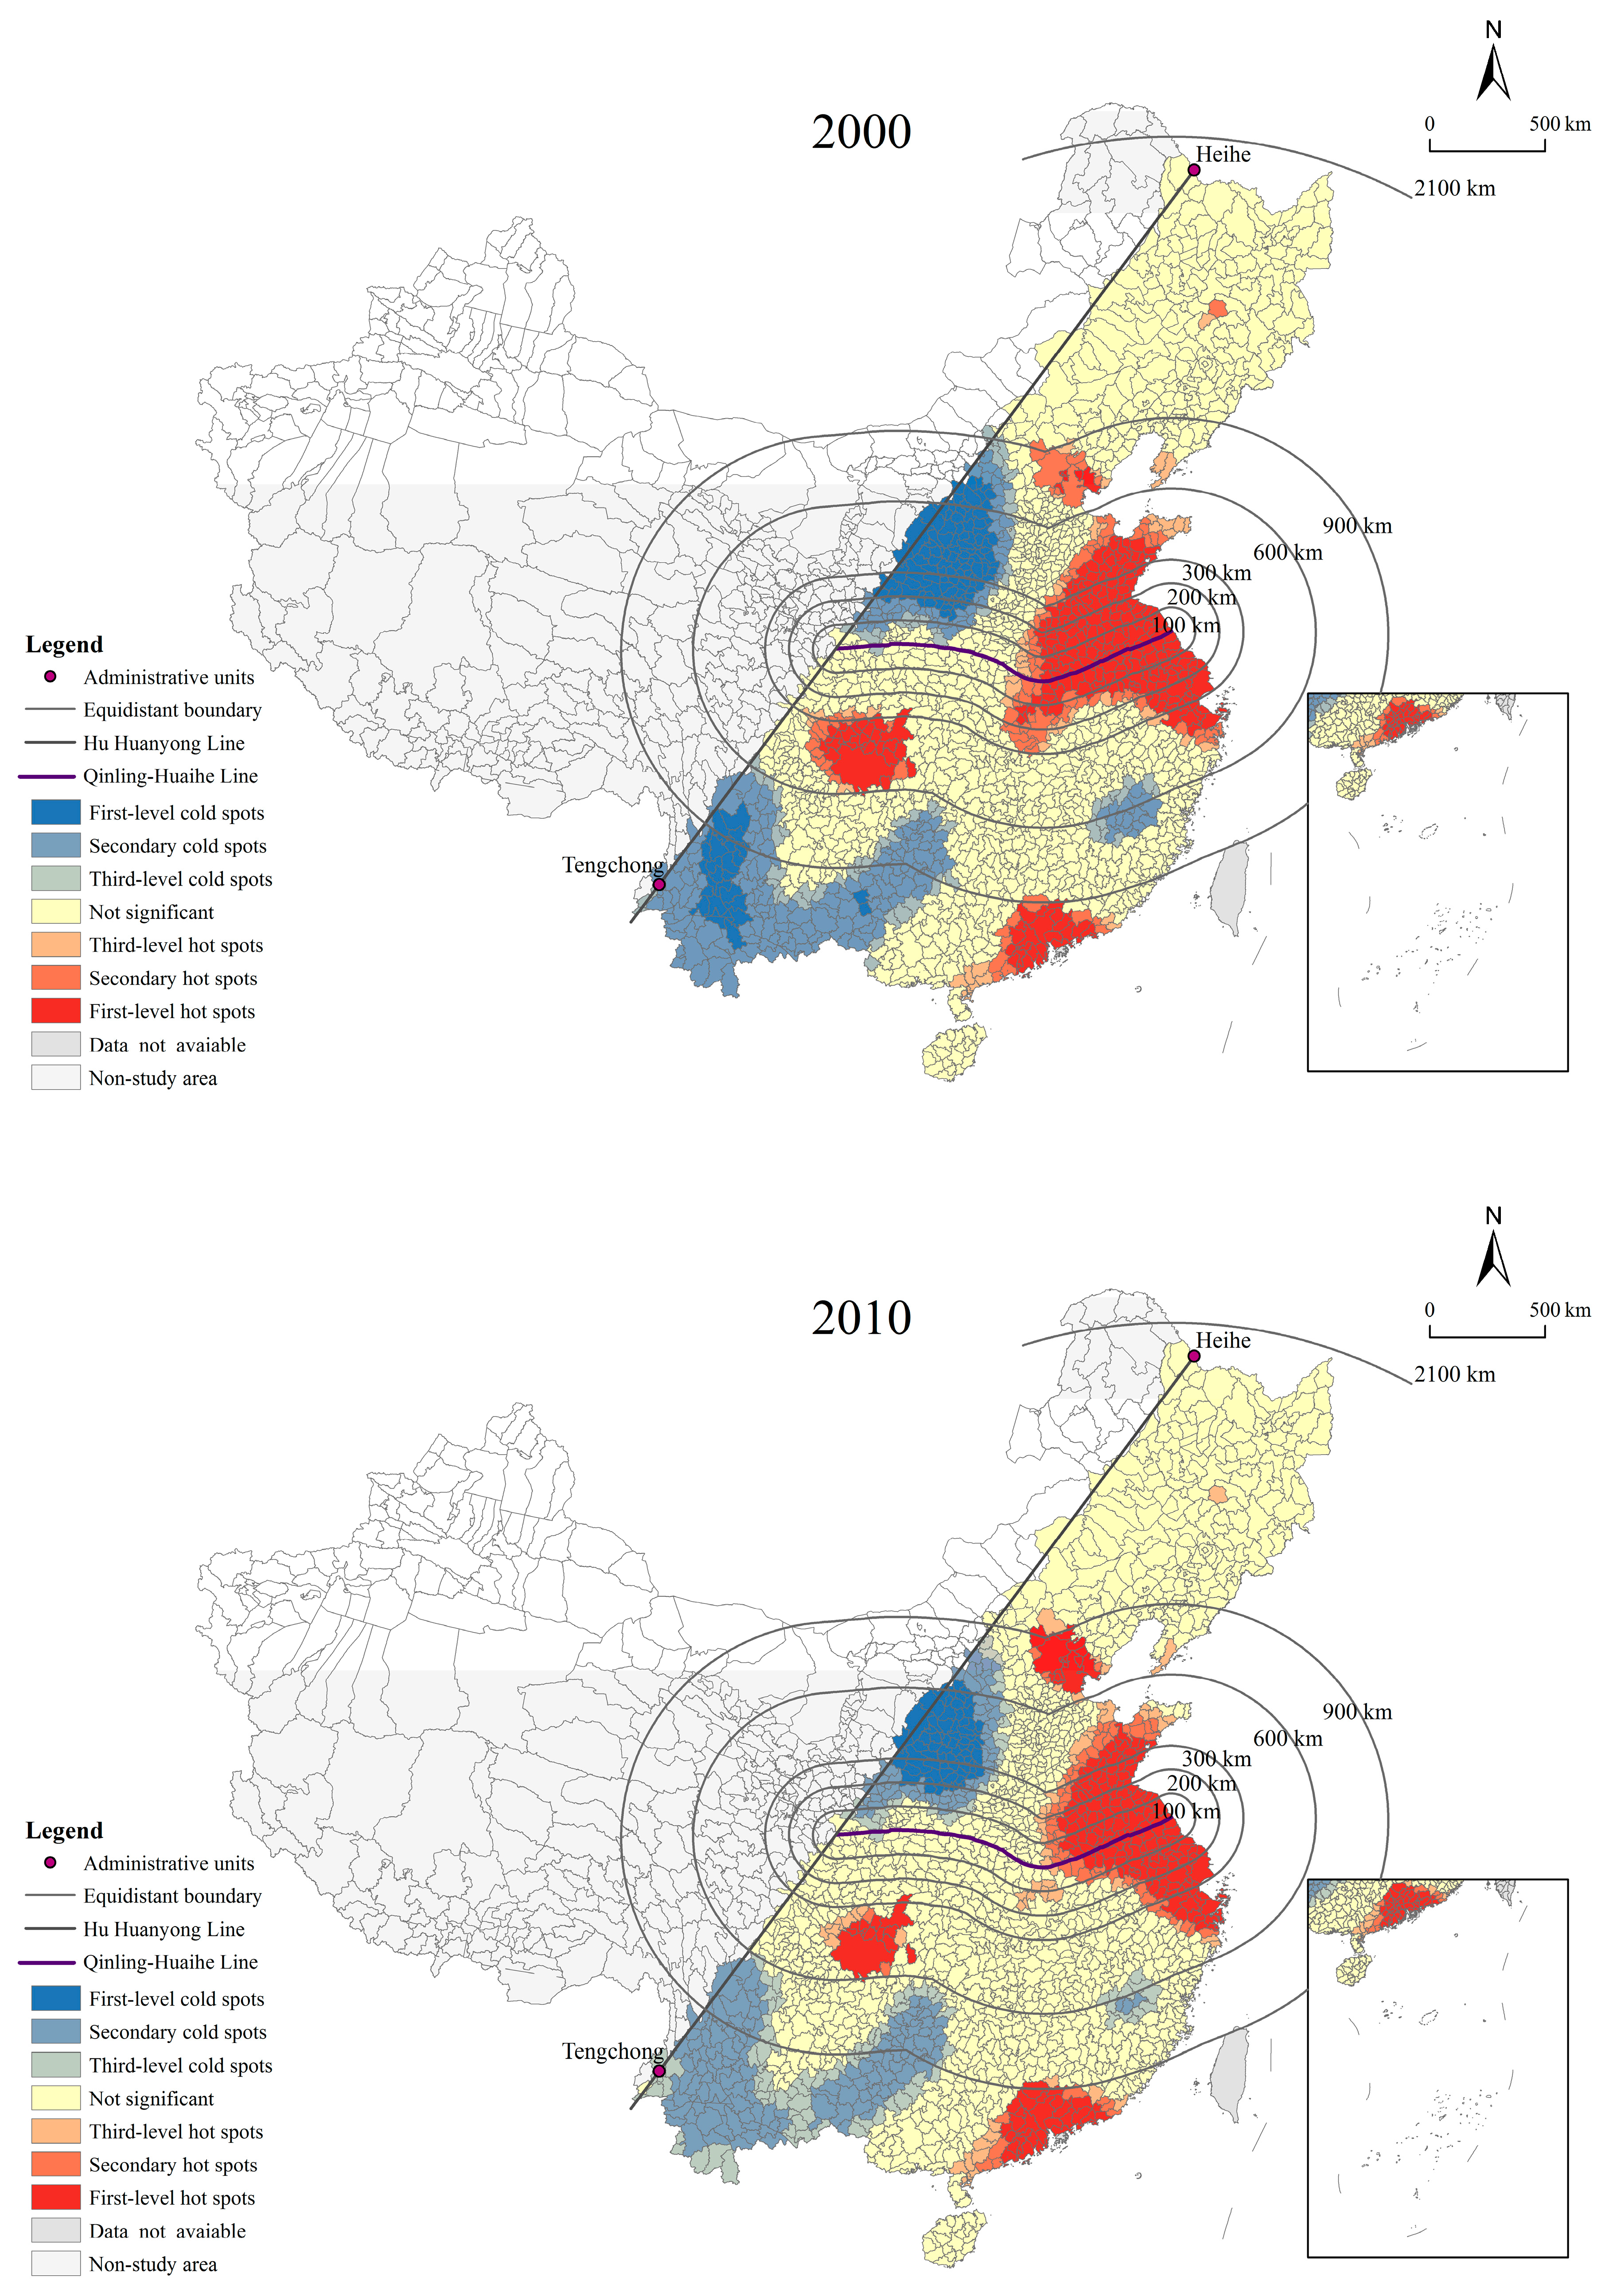
4.1.2. Spatial Pattern of Population Agglomeration and Dispersion

From the analysis results presented in Table 3 and Table 4, it can be seen that from 1982 to 2010, the concentration index of the population increased within the equidistant range on both sides of the Qinling-Huaihe Line. The concentration index of the population on the south side was higher than that on the north side, and the increase was also greater. This finding shows that the concentration of the population on the south side was always higher than that on the north side and that the trend of population agglomeration was more prominent. In terms of population changes, the population average annual increase within the equidistant range generally showed a downward trend on both sides of the Qinling-Huaihe Line, which is closely related to China’s implementation of the family planning policy in the 1980s. The coefficient of variation of the population average annual increase within the equidistant range was large on both sides of the Qinling-Huaihe Line and continues to increase, indicating that there was a great disparity in the process of population agglomeration and that the polarization of population growth has continued to expand, especially in 2000 and 2010.
The distribution map of cold and hot spots of the population (see Figure 4) shows that the cold and hot spot cluster areas on the north and south sides of the Qinling-Huaihe Line are shrinking and that the unbalanced trend of the population distribution is increasing. Hot spots were mainly located in the Shandong Peninsula, Yangtze River Delta, Chengdu-Chongqing area, and Beijing-Tianjin surrounding areas in 1982. The first-level hot spots were largely in Shandong Province, Jiangsu Province, Anhui Province, Zhejiang Province, and Sichuan Province. The scope of the hot spots significantly narrowed and gradually converged to the eastern coastal areas and the core of the hot spots between 1982 and 2010. The concentration of hot spots in the surrounding areas of Beijing-Tianjin significantly increased. In 1982, the Beijing-Tianjin surrounding areas were secondary hot spots and then became first-level hot spots in 2010 with the increase in the floating population concentration scale. The cold spots were mainly concentrated in the Yunnan-Kweichow Plateau, Guanzhong Plain, and other areas. A small-scale cold spot formed on the west side of the straits, mainly including Yunnan Province, Shanxi Province, Shaanxi Province, and Fujian Province. From 1982 to 2010, the cold spot area continued to shrink, and the concentration of the population in this area significantly weakened. By 2010, the cold spot in Guanzhong Plain was reduced by nearly half, the cold spot in the Yunnan-Guizhou area changed from a first-level cold spot to a secondary cold spot, and the cold spot on the west side of the straits almost disappeared. Except for the obvious cold and hot spots, the population was randomly distributed in most areas. With the passage of time, it is expected that the scope of the population hot spots will gradually narrow and continue to polarize to the eastern coastal areas and a few developed areas, reflecting the more centralized spatial distribution of the population.
It is worth noting that, from 1982 to 2010, the hot spot area expanded extensively in the Pearl River Delta region, while the concentration advantage of the population in the northeast region gradually disappeared. In 1982, the Pearl River Delta region initially appeared as a hot spot for population concentration, with the population concentrating only in Zhuhai, Zhongshan, Jiangmen, Foshan, and other cities, which were secondary and third-level hot spots. By 2010, hot spots were found in most regions of the Pearl River Delta and were mainly first-level hot spots. However, the northeast region showed the opposite trend. In 1982, small-scale hot spots were formed in the Harbin-Changchun area and the Liaodong Peninsula, mainly covering cities such as Harbin and Dalian. Since then, the scope of hot spots has been shrinking, and these areas have changed from secondary hot spots to third-level hot spots. By 2010, there were almost no significant hot spot areas.

4.1.3. Population Growth

In terms of population growth, by calculating the average annual growth rate of the populations on both sides of the Qinling-Huaihe Line from 1982 to 2010, taking the average value x ¯ and one standard deviation δ as a reference, the population growth was divided into five area types: rapid growth area (> x ¯ , +δ), steady growth area ( x ¯ , x ¯ +δ), slow growth area (0, x ¯ ), slow negative growth area (− x ¯ , 0), and faster negative growth area (˂ x ¯ ). A visualization of the population growth types is shown in Figure 5. The rapid growth areas were concentrated in the Beijing-Tianjin areas, Yangtze River Delta, and Pearl River Delta and were scattered in the municipalities, provincial capitals, sub-provincial cities and other core cities. In the northern region, the steady growth areas were mainly distributed along the Yellow River Basin; the negative growth areas were mainly distributed in the northeast region of China, concentrated in the Changbai Mountains, the Lesser Khingan Mountains and the Greater Khingan Mountains areas. In the southern region, the steady growth areas were distributed along the coastline. It is worth noting that, as a minimally inhabited area, the Yunnan-Guizhou area has a moderately loose family planning policy, giving the natural growth rate has a certain advantage; thus, it has also bee an area with steady population growth. The negative growth areas were mainly distributed in the peripheral edge areas of the Yangtze River Delta and Chengdu-Chongqing. On the whole, the population growth of the north side of the Qinling-Huaihe Line shows the characteristics of “increase in the South and decrease in the North”; that is, the north side of the Beijing-Tianjin area has been the main agglomeration area of negative population growth, and the south side of the Beijing-Tianjin area has been the main agglomeration area of population growth. The population growth on the south side of the Qinling-Huaihe Line has the characteristics of “alternate distribution”, and the growth area and negative growth area cross each other.

4.2. Analysis of Factors That Influence the Spatial Differentiation of the Populations on Both Sides of the Qinling-Huaihe Line

The measurement results of the factor detector of the geodetector show that the relative influences of socioeconomic factors on the spatial differentiation of the populations on both sides of the Qinling-Huaihe Line are large and constantly increasing, while the relative influences of the physical geographical environmental factors on the spatial differentiation of the populations are small and constantly decreasing (see Table 5). Specifically, in 2000, the factors were ranked according to the size of the q statistic, as follows: number of fixed telephones > number of beds in hospitals and health centers > number of employees > number of patent applications > per capita GDP > grain yield per unit area > geomorphology > temperature zone > arid/humid zoning. In 2010, the factors were ranked as follows: number of fixed telephones> number of beds in hospitals and health centers > number of employees > number of patent applications > per capita GDP > geomorphology > grain yield per unit area > temperature zone > arid/humid zoning. Five indicators were found to have an increasing impact on the population distribution: per capita GDP, which indicates the economic development level; the number of employees, which indicates the ability to attract employees; the number of beds in hospitals and health centers, which indicates the utility service level; the number of fixed telephones, which represents communication capabilities; and the number of patent applications, which indicates innovation capabilities. In terms of relative influences, the number of patent applications, the number of employees, the number of beds in hospitals and health centers, and the number of fixed telephones have greater effects than the per capita GDP, which indicates that the regional innovation capabilities, employment absorption ability, utility service level, and communication capabilities have a significant impacts on the population distribution after the attraction of economic development to the population reaches a certain degree. The influence of the grain yield per unit area, which indicates the effect of the natural production capacity on the spatial distribution of population, has a decreasing trend, indicating that the dependence of the spatial distribution of the population on the regional natural production capacity has declined as a result of the development of the market economy and the convenience of commodity circulation. The three indicators of geomorphology, temperature zone, and arid/humid zoning were showed to have less influence on the spatial distribution of the population with downward trends, indicating that the constraints of the natural geographical environment on the population distribution have gradually reduced.
The interaction detector results show that the influence of interaction of any two factors on the spatial differentiation of the population is greater than the influence of a single factor, indicating that the spatial differentiation of the populations on both sides of the Qinling-Huaihe Line is not determined by a single factor but as the result of a combination of factors (see Table 6). Among them, the interaction of the temperature zone, arid/humid zoning, and grain yield per unit area with other factors are all nonlinear enhancements, indicating that suitable climate conditions and the enhancement of the regional natural production capacity will strengthen the influences of the other factors on the spatial differentiation of the population. For the year 2000, when the per capita GDP or geomorphology were superposed with other factors, the intensity of the influence was relatively large. The maximum value (0.881) came from the combination of geomorphology and number of fixed telephones, followed by the combination of the per capita GDP and the number of fixed telephones. There were two main categories and 24 interaction combinations with q values of the interaction detection factor of greater than 0.7. The first type was the interaction of natural geographical factors and the number of employees, number of beds in hospitals and health centers, and the number of fixed telephones; the second type was the interactions of socioeconomic factors. For the year 2010, after the per capita GDP or geomorphology were superposed with other factors, the intensity of the influence was still relatively large. The q value of the interaction between the per capita GDP and the number of fixed telephones was 0.90, and this had the greatest impact on the spatial differentiation of the population. This was followed by geomorphology and the number of fixed telephones and per capita GDP and the number of beds in hospitals and health centers. There were two main categories and 21 interaction combinations with q values of the interaction detection factors were greater than 0.9. The first type was the interaction of natural geographical factors with the number of beds in hospitals and health centers and the number of fixed telephones; the second type was interactions of socioeconomic factors. It can be seen that the interactions between socioeconomic factors or the superposition of natural geographical environmental factors and socioeconomic factors significantly increased the impact of the spatial differentiation of the population, and especially after two factors—the per capita GDP and geomorphology—were superposed with other factors, the growth was relatively large.

5. Discussion

Based on the research results of this study, this section discusses three main aspects: Firstly, the overall population distribution pattern of “South more and North less” at the Qinling-Huaihe Line is basically stable; secondly, the spatial differentiation of the populations on both sides of the Qinling-Huaihe Line is mainly affected by socioeconomic factors; and thirdly, the factors that influence the spatial distribution of the populations in hot spots on both sides of the Qinling-Huaihe Line.

5.1. The Overall Population Distribution Pattern of “South More and North Less” for the Qinling-Huaihe Line Is Basically Stable

After Zhang Xiangwen proposed the Qinling-Huaihe Line, Zhu divided the temperature zone of China scientifically for the first time in 1958, taking the Qinling-Huaihe Line as the boundary between the subtropical and warm temperate zones [69]. Other zoning schemes were formulated based on this framework. Since then, the Qinling-Huaihe Line has become a recognized geographical boundary between the northern and southern parts of China, and it has rich natural and human geographical connotations. Scholars have mostly carried out research on the Qinling-Huaihe Line from the perspectives of hydrology, climate, and disasters and other natural geographical elements, which reveals the natural geographical connotations of the Qinling-Huaihe Line [11,70,71]. Research on its human geographical connotations has mainly focused on elaborative and qualitative analyses [72,73,74], but analyses of human geographical elements has been lacking. This study used the population as a breakthrough point and explored the spatial differentiation of the populations on both sides of the Qinling-Huaihe Line, which can provide effective support for the research on the spatial differences in the development of the north and south regions and helps to enrich the knowledge of the socioeconomic connotations of the Qinling-Huaihe Line.
The research results show that, from 1982 to 2010, the spatial distribution of the populations on both sides of the Qinling-Huaihe Line was basically stable, and the overall share of the population was approximately 58:42, revealing a population distribution pattern for the southeast half of the Hu Huanyong Line that was “South more and North less”. Over three decades of development, the population in the study area increased by 305 million people, an increase of nearly 32%, which is almost equivalent to the entire population of the United States; however, the proportions of the populations on the north and south sides of the Qinling-Huaihe Line only changed by 0.42%. Although affected by uneven economic development and national policies, the population showed a trend of shifting southward, but this shift did not affected the overall distribution pattern of “South more and North less”.
From the equidistant analysis, it can be seen that within of 200 km of the Qinling-Huaihe Line, there is the transition area for the spatial distribution of the populations on both sides. In order to further explore the reasons for this finding, a factor detector was used to further analyze the factors that influence the spatial distribution of the populations within 200 km of the Qinling-Huaihe Line. The results show (see Table 7) that socioeconomic factors have had a significant effect on the spatial distribution of the population. The influence of geomorphology on the spatial distribution of population (0.111) was found to be significantly higher than 0.038 throughout the entire study area, indicating that within 200 km on both sides of the Qinling-Huaihe Line, the spatial differentiation of population is largely restricted by the geomorphology, mainly the Qinling Mountains. The Qinling Mountains are located roughly between 32° and 34° north latitude, stretching 400–500 km from east to west and 100–150 km from north to south, and is 2000–3000 m above sea level. The northern slope is a large fault that is short and steep, while the southern slopes are long and gentle, forming a number of mountains and intermountain basins. The people tend to live on flat terrain, riverside areas, and coastal areas [25], and the mountains undoubtedly affect people’s living choices. Specifically, within the range of 100 km, the area affected by the Qinling Mountains on the south side is larger, the number of administrative units is smaller, and the population of counties is smaller, while the number of administrative units on the north side is greater. The population shows obvious agglomeration characteristics surrounding Xi’an. Hence, the population size on the north side is significantly greater than that on the south side. Within the range of 100–200 km, the restrictions by the Qinling Mountains is decreased on both sides of the Qinling-Huaihe Line. Although the north side has more administrative units, the population sizes of counties on the north side are smaller, while the south side has larger counties with high population agglomeration, such as Wuhan and Nanjing. Thus, the proportion of the population on both sides is roughly the same on both sides (see Table 8).
In 2017, the report of the 19th National Congress of the Communist Party of China (CPC) clearly proposed the implementation of a regional coordinated development strategy. Population is one of the core elements of regional development. The spatial differentiation of the populations on both sides of the Qinling-Huaihe Line can reflect the differences in economic and social development between the north and south areas, which is of great strategic significance for narrowing the development gap between the two areas, solving the problem of imbalanced and inadequate regional development, and promoting the regionally balanced development. Some useful conclusions can be drawn from this study. We have shown an obvious and stable population distribution pattern of “South more and North less” at the Qinling-Huaihe Line from 1982 to 2010, with a certain range of transition areas. After preliminary judgement, this range was determined to be the area within 200 km of the Qinling-Huaihe Line. Future studies should continue to analyze the relationship between the population and natural, economic, and social factors; depict the development pattern of both sides in more detail; and strengthen the comprehensive scientific investigation of the Qinling-Huaihe Line so as to form a landmark achievement supporting China’s regionally coordinated development.

5.2. The Spatial Differentiation of the Populations on Both Sides of the Qinling-Huaihe Line Is Mainly Affected by Socioeconomic Factors

The results of the analysis of factors that influence population differentiation show that socioeconomic factors play a major role in the spatial distribution pattern of “South more and North less” at the Qinling-Huaihe Line. Since the implementation of the reform and opening up policy, China has formed a multilevel, open pattern of points, lines, and areas interconnected with special economic zones, open coastal cities, and various development zones. The center of economic development has gradually shifted to coastal areas along the river. Regional economic and social development differences are important driving forces for population mobility, which greatly affects the distribution pattern of the population [75]. The south side of the Qinling-Huaihe Line has a long coastline and good location conditions. As a priority area for development and opening, it has taken the lead in developing a market economy relying on national policy advantages and the convenience of opening up, where the process of urbanization has been developing rapidly and the economy has become relatively developed. This situation also means that the south side has abundant employment opportunities, higher income levels, more complete public facilities and infrastructure, and more convenient forms of communication [76], thus forming a large “pulling force” for population flow and becoming a concentrated region with a large population. Relatively speaking, the north side has been dominated by resource-based industries and heavy industries for a long time, which has widened the gap in comparison with the economic development of the south side. In the northern region, the proportion of the economy that is state-owned is high, the pressure for transformation development is high, and core cities with strong economic drive are lacking. Therefore, the attractiveness of the population on the north side is relatively weak, and the concentration of the population is low.
Although the influences of natural geographical environmental factors on the spatial differentiation of population have been weakening since 2000, in terms of long-term development, the effects of the natural environmental conditions on the overall regional distribution pattern of the population cannot be ignored [9,56]. The Qinling-Huaihe Line has an important physical geographical connotation, and there are significant differences in the climatic conditions, such as temperature and precipitation, of each side. Due to traditional survival practices, people tend to live in areas with warm and humid climates and abundant water sources [77]. In the southern region, the climate is subtropical or tropical, precipitation is sufficient with an annual precipitation level of greater than 800 mm, the temperature is higher than that in the northern region, and the temperature in January is generally above 0 °C. The northern region has a temperate climate with four distinct seasons, and precipitation has obvious seasonal characteristics. The annual precipitation is below 800 mm, and the winter temperature is below 0 °C. Most areas in the northern region use heating equipment. Comprehensively speaking, the physical geographical environment of the south side is more suitable for human habitation, which matches the stable population distribution pattern of “South more and North less” at the Qinling-Huaihe Line.
The factors that influence the spatial differentiation of the populations on both sides of the Qinling-Huaihe Line are different from those of many other spatial differentiation of the populations on the planet. Around the world, significant spatial differentiations of the population in countries such as Canada and Russia are mainly determined by climatic conditions. Due to the extreme coldness of the northern region, Canada’s population is highly concentrated in the southern region [3]; the regions of Russia situated in Europe are flat with a mild and humid climate, causing the vast majority of the national population to be situated there [78]. Within China, the population distribution pattern of “East dense and West sparse” at the Hu Huanyong Line is basically caused by the rigid constraints of natural environment conditions and has very strong stability [7]. Among them, the northwestern half of the Hu Huanyong Line has a high elevation and is generally arid or alpine. Thus, it is not suitable for human habitation and development, so the population is very sparse. In contrast, the difference in the population distribution pattern of “South more and North less” of the Qinling-Huaihe Line (58:42) is relative. The spatial differentiation of the populations on both sides of the line is mainly affected by socioeconomic factors, and the physical geographical environment has a weaker effect. The difference in regional development is an important driving force of migration on both sides of the line; the growth centers on the north and south sides have obvious attraction for the mobile population, and the north-south flow of the population is increasingly active [79,80]. The Qinling-Huaihe natural geographical boundary has no significant limiting effect on population dispersion.
Compared with previous research on the factors that influence the population distribution, this study introduced indicators of innovation capability, mainly because, in the era of the development of the knowledge economy and globalization, innovation-driven development has become an important driving force for promoting regional economic growth, and innovation capacity is an important indicator reflecting the level of regional economic development [68]. The results show that innovation capacity has had a significant impact on the spatial differentiation of the population at the Qinling-Huaihe Line, even greater than the impact of the per capita GDP, indicating that the improvement in the innovation level will help to promote economic development and will thus affect the spatial distribution of the population. In the future, regional development should be transformed from investment-driven and factor-driven to innovation-driven, making it an important “pulling force” to attract population growth. Second, in terms of measuring the regional natural production capacity, most scholars use the per capita grain yield [67], but this indicator does not reflect the differences in cropping systems in various regions. For example, there are three crops per year in the Lingnan Area, two crops per year in the Yangtze River Basin, and one crop per year in the Northeast Plain. This study used the grain yield per unit area for measurement. The results show that the grain yield per unit area has a weak influence on the spatial differentiation of the populations on both sides of the Qinling-Huaihe Line, which is only higher than the factors related to the physical geographical environment, reflecting that people’s ability to adapt to and transform the regional environment has been continuously enhanced and that the restrictions from the regional natural production capacity on the population distribution continue to decrease.

5.3. Factors That Influence the Spatial Distribution of the Population in Hot Spots on Both Sides of the Qinling-Huaihe Line

The hot spots on both sides of the Qinling-Huaihe Line can be roughly divided into the eastern hot spot formed around the Yangtze River Delta and the Shandong Peninsula, the Beijing-Tianjin hot spot, the Chengdu-Chongqing hot spot, the Pearl River Delta hot spot, and the Northeast hot spot covering the Harbin-Chang area and Liaodong Peninsula (see Figure 4). The concentration of the population in these hot spots is closely connected with the regional economic-social development level.
The eastern hot spot, Beijing-Tianjin hot spot, and Chengdu-Chongqing hot spot showed remarkable population agglomeration advantages between 1982 and 2010, mainly, because the Shandong Peninsula, Yangtze River Delta, Beijing-Tianjin areas, and the Chengdu-Chongqing areas are all regions with good economic strength that have undergone rapid development; thus, they are important destinations for migrants [81], so the population distribution is always relatively dense in these regions. As the polarization of core cities such as Beijing, Tianjin, Shanghai, Nanjing, Hangzhou, Jinan and Qingdao increased, the population absorption capacity became stronger, thus making the spatial distribution of the population more centralized. The total populations of Shanghai and Chongqing always exceeded 10 million from 1982 to 2010, that of Beijing has exceeded 10 million since 1990, and that of Tianjin exceeded 10 million in 2010.
The Pearl River Delta hot spot expanded rapidly between 1982 and 2010 and became an important population agglomeration in China. Ning [82] believes that the expansion of the population scale in the Pearl River Delta region has resulted from the rapid development of the economy and society after the reform and opening up. The Shenzhen and Zhuhai special economic zones were the first to open in 1980. Guangzhou became one of the first open coastal cities in 1984. In 1985, the State Council approved the Pearl River Delta as a coastal economic open zone. The Pearl River Delta region, as the pioneer of China’s reform and opening up, has attracted a large amount of domestic and foreign capital and labor, promoted the development of labor-intensive industries, and created a large number of employment opportunities; thus, the population is rapidly radiating and expanding outward from the core of Guangzhou city.
The northeast hot spot continued to shrink from 1982 to 2010 and had almost disappeared by 2010. This situation was closely connected to the development of the northeast region. During the “First Five-Year Plan” period, the northeast region, with its rich resources and good industrial foundation, was a concentrated distribution area of China’s national key projects. With rapid economic development, large population inflow, and the continuous expansion of the population scale, the northeast region showed a relatively obvious population agglomeration advantage. However, after the reform and opening up in 1978, due to the constraints of the planned economic system and the national strategic shift to prioritize the development of the eastern region, the economic development of the northeast region slowed, the push for population movement increased, the pull force decreased, and the population outflow was more serious, resulting in the gradual disappearance of the population agglomeration advantage. Regarding the hot issue of “population loss in Northeast China”, some social media posts attributed the loss to the cold climate conditions in the northeast region, which is a one-sided inference, contrary to the fact that a large number of people gathered in the northeast region in the early days of the founding of the People’s Republic of China. Qi et al. [83] found that population loss continued to increase in the northeast region from 2000 to 2015 and, following a systematic analysis, proposed that the main reason for population loss was the lack of economic momentum.
The distribution of the population on both sides of the Qinling-Huaihe Line has obvious agglomeration distribution characteristics. It is mainly concentrated in the Beijing-Tianjin areas, the Yangtze River Delta, the Pearl River Delta region, the Chengdu-Chongqing area, and other developed areas, which are also the main radiation areas of China’s key national urban agglomeration and have strong and lasting attractions for the population. Over the past 10 years, China has regarded urban agglomerations as new growth poles. In 2011, “The Main Functional Area Planning” proposed that urban agglomerations are areas of key and optimized development. “National New Urbanization Planning (2014–2020)” proposed that urban agglomerations are dominant areas for promoting new urbanization. The development of urban agglomeration has an important influence on the distribution of the population and the economy [84]. However, in terms of the layout of urban agglomerations, there is an imbalance between the north and south. The number of urban agglomerations on the south side of the Qinling-Huaihe Line is greater and the agglomeration capacity is stronger, while the number of urban agglomerations on the north side is smaller—only the Beijing-Tianjin-Hebei urban agglomeration is a key national urban agglomeration [85]. In the future, China’s new urbanization construction should rely on urban agglomerations, actively guide the population toward urban areas, take into account the northern and southern regions, and scientifically plan the size and layout of urban agglomerations, so as to promote the rational distribution of the population and the regionally coordinated development.

6. Conclusions

This research studied the spatial differentiation of the populations on both sides of the Qinling-Huaihe Line and the factors influencing this differentiation. The results show that the population showed a distribution pattern of “South more and North less” at the Qinling-Huaihe Line from 1982 to 2010. The ratio of the population share for the south and north sides was basically stable at 58:42. The population density on the south side was always higher than that on the north side. Although the population continued to increase on both the north and south sides, the population on the south side grew faster and the proportion of the population continued to increase slightly, indicating a population trend of shifting southward. The demographic results of the equidistant range show that area within 200 km of the Qinling-Huaihe Line is a transition area with a stable population distribution. In terms of population clustering characteristics, the concentration of the populations has gradually increased on both sides of the Qinling-Huaihe Line, and the concentration of the population on the south side is higher than that on the north side. There have been significant differences in the characteristics of population growth on both sides. In the northern region, the population growth areas have been mainly concentrated in the Beijing-Tianjin area and along the Yellow River Basin, and the negative growth areas have been mainly distributed in the northeast region. In the southern region, the population growth areas have been mainly distributed in the Yangtze River Delta, the Pearl River Delta, and the eastern coastal areas and the negative growth areas have been mainly concentrated in the peripheral edge areas of the Yangtze River Delta and Chengdu-Chongqing. Finally, the spatial differentiation of the populations at the Qinling-Huaihe Line is the result of the long-term combined effects of multiple factors such as the physical geographical environment and economic and social development. Socioeconomic factors have become an important driving force for the spatial differentiation of the population, while the influence of physical geographical environmental factors on the population distribution has been smaller and is constantly decreasing.

Author Contributions

Conceptualization, J.L. (Jie Liu) and Q.Y.; methodology, J.L. (Jie Liu); formal analysis, J.L. (Jie Liu); writing—original draft preparation, J.L. (Jie Liu); writing—review and editing, J.L. (Jian Liu), Y.Z., X.J. and Y.Y.; supervision, Q.Y. All authors have read and agreed to the published version of the manuscript.

Funding

This research was funded by the National Natural Science Foundation of China, grant number 41771126.

Conflicts of Interest

The authors declare no conflict of interest.

References

  1. NRC. Understanding the Changing Planet: Strategic Directions for Geographical Sciences; National Academies Press: Washington, DC, USA, 2010. [Google Scholar]
  2. Ge, M.; Feng, Z. A study on the distribution pattern of Chinese population in 2000 based on GIS: Comparison with the Hu Huanyong Line in 1935. Popul. Res. 2008, 32, 51–57. [Google Scholar]
  3. Zhang, G.; Li, L. Changes of Canada’s population development and spatial difference. World Reg. Stud. 2004, 13, 96–102. [Google Scholar]
  4. Li, S.; Liu, W. Spatial distribution of population in Russia and its evolution. Econ. Geogr. 2014, 34, 42–49. [Google Scholar]
  5. Chinese National Geography. Available online: http://www.dili360.com/cng/mag/detail/344.htm (accessed on 19 April 2020).
  6. Hu, H. Distribution of China’s population: Attached statistical table and density chart. Acta Geogr. Sin. 1935, 2, 33–74. [Google Scholar]
  7. Chen, M.; Li, Y.; Gong, Y.; Lu, D.; Zhang, H. The population distribution and trend of urbanization pattern on two sides of Hu Huanyong population line: A tentative response to Premier Li Keqiang. Acta Geogr. Sin. 2016, 71, 179–193. [Google Scholar]
  8. Yang, Q.; Li, L.; Wang, Y.; Wang, X.; Lu, Y. Spatial distribution pattern of population and characteristics of its evolution in China during 1935–2010. Geogr. Res. 2016, 35, 1547–1560. [Google Scholar]
  9. Lu, D.; Wang, Z.; Feng, Z.; Zeng, G.; Fang, C.; Dong, X.; Liu, S.; Jia, S.; Fang, Y.; Meng, G.; et al. Academic debates on Hu Huanyong population line. Geogr. Res. 2016, 35, 805–824. [Google Scholar]
  10. Zhang, B. Ten major scientific issues concerning the study of China’s north-south transitional zone. Prog. Geogr. 2019, 38, 305–311. [Google Scholar]
  11. Li, S.; Lu, J.; Yan, J.; Liu, X.; Kong, F.; Wang, J. Spatiotemporal variability of temperature in northern and southern Qinling Mountains and its influence on climatic boundary. Acta Geogr. Sin. 2018, 73, 13–24. [Google Scholar]
  12. Fan, J.; Wang, Y. Pattern evolution of China’s economic geography in the past 40 years and regional coordinated development in the new era. Econ. Geogr. 2019, 39, 1–7. [Google Scholar]
  13. Liu, J. A review of population geography research in China. Acta Geogr. Sin. 2014, 69, 1177–1189. [Google Scholar]
  14. Gong, S.; Chen, Y. The historical change, mathematical fitting and geographical significance of demographic borderlines in China. Acta Geogr. Sin. 2019, 74, 2147–2162. [Google Scholar]
  15. Pan, Q.; Jin, X.; Zhou, Y. Population change and spatiotemporal distribution of China in recent 300 years. Geogr. Res. 2013, 32, 1291–1302. [Google Scholar]
  16. Kabisch, N.; Haase, D. Diversifying European agglomerations: Evidence of urban population trends for the 21st century. Popul. Space Place 2011, 17, 236–253. [Google Scholar] [CrossRef]
  17. Benassi, F.; Naccarato, A. Modelling the spatial variation of human population density using Taylor’s power law, Italy. Reg. Stud. 2019, 53, 206–216. [Google Scholar] [CrossRef]
  18. Shi, T.; Yang, X.; Lan, R. Spatial simulation and influence factors detection of population density in North Korea. J. Geomat. Sci. Technol. 2017, 34, 79–84. [Google Scholar]
  19. Craig, T.; Margaret, E. Urban population density and freeways in North America: A Re-assessment. J. Transp. Geogr. 2018, 73, 75–83. [Google Scholar]
  20. Gro, M. How well does the ‘counter-urbanisation story’ travel to other countries? the case of Norway. Popul. Space Place 2011, 17, 642–655. [Google Scholar]
  21. Owen, C.; Jacqueline, B. Causes of urbanisation and counter-urbanisation in Zambia: Natural population increase or migration? Urban Stud. 2019, 56, 2005–2020. [Google Scholar]
  22. Jain, M.; Korzhenevych, A. Counter-urbanisation as the growth of small towns: Is the capital region of India prepared? Tijdschr. Econ. Soc. Geogr. 2019, 110, 156–172. [Google Scholar] [CrossRef]
  23. Guan, X.; Wei, H.; Lu, S.; Su, H. Mismatch distribution of population and industry in China: Pattern, problems and driving factors. Appl. Geogr. 2018, 97, 61–74. [Google Scholar] [CrossRef]
  24. Baumont, C.; Ertur, C.; Le Gallo, J. Spatial analysis of employment and population density: The case of the agglomeration of Dijon 1999. Geogr. Anal. 2004, 36, 146–176. [Google Scholar] [CrossRef]
  25. Liu, R.; Feng, Z.; Yang, Y.; You, Z. Research on the spatial pattern of population agglomeration and dispersion in China. Prog. Geogr. 2010, 29, 1171–1177. [Google Scholar]
  26. Li, M.; He, B.; Guo, R.; Li, Y.; Chen, Y.; Fan, Y. Study on population distribution pattern at the county level of China. Sustainability 2018, 10, 3598. [Google Scholar] [CrossRef] [Green Version]
  27. Doll, C.; Pachauri, S. Estimating rural populations without access to electricity in developing countries through night-time light satellite imagery. Energy Policy 2010, 38, 5661–5670. [Google Scholar] [CrossRef]
  28. Hoekveld, J.J. Spatial differentiation of population development in a declining region: The case of Saarland. Geogr. Ann. Ser. B Hum. Geogr. 2015, 97, 47–68. [Google Scholar] [CrossRef]
  29. You, Z.; Feng, Z.; Lei, Y.; Yang, Y.; Li, F. Regional features and national differences in population distribution in China’s border regions (2000–2015). Sustainability 2017, 9, 336. [Google Scholar] [CrossRef] [Green Version]
  30. Zuo, Y.; He, B.; Tao, L. Population spatio-temporal variations and spatial structure in Xinjiang from 1949 to 2007. Sci. Geogr. Sin. 2011, 31, 358–364. [Google Scholar]
  31. Zhou, C.; Bian, Y. The growth and distribution of population in Guangzhou city in 1982–2000. Sci. Geogr. Sin. 2014, 34, 1085–1092. [Google Scholar]
  32. Deng, Y.; Liu, S.; Cai, J.; Lu, X. Spatial pattern and its evolution of Chinese provincial population and empirical study. Acta Geogr. Sin. 2014, 69, 1473–1486. [Google Scholar] [CrossRef] [Green Version]
  33. Zhang, G.; Huang, W.; Zhou, C.; Cao, Y. Spatio-temporal characteristics of demographic distribution in China from the perspective of urban agglomeration. Acta Geogr. Sin. 2018, 73, 1513–1525. [Google Scholar]
  34. Gao, X.; Wang, X.; Zhu, B. Distribution and change of the ethnic minority population in China: A “Hu Line” perspective. Popul. Res. 2016, 40, 3–17. [Google Scholar]
  35. Bai, Z.; Wang, J.; Yang, Y.; Sun, J. Characterizing spatial patterns of population distribution at township level across the 25 provinces in China. Acta Geogr. Sin. 2015, 70, 1229–1242. [Google Scholar]
  36. Clark, C. Urban population densities. J. R. Stat. Soc. Ser. A 1951, 114, 490–496. [Google Scholar] [CrossRef]
  37. Stewart, J.Q.; Warntz, W. Physics of population distribution. J. Reg. Sci. 1958, 1, 99–123. [Google Scholar] [CrossRef]
  38. Du, G.; Zhang, S.; Zhang, Y. Analyzing spatial auto-correlation of population distribution: A case of Shenyang city. Geogr. Res. 2007, 26, 383–390. [Google Scholar]
  39. Liu, W.; Yan, X.; Chen, Z. Evolutional trends of population spatial distribution structure in Guangzhou based on EDSA-GIS technique. Econ. Geogr. 2010, 30, 34–39. [Google Scholar]
  40. Wang, F.; Lu, W.; Zheng, J.; Li, S.; Zhang, X. Spatially explicit mapping of historical population density with random forest regression: A case study of Gansu Province, China, in 1820 and 2000. Sustainability 2020, 12, 1231. [Google Scholar] [CrossRef] [Green Version]
  41. Peng, J.; You, L.; Andrea, E. Gaughan. A fine-scale spatial population distribution on the High-resolution Gridded Population Surface and application in Alachua County, Florida. Appl. Geogr. 2014, 50, 99–107. [Google Scholar]
  42. Yang, X.; Huang, Y.; Dong, P.; Jiang, D.; Liu, H. An updating system for the gridded population database of China based on remote sensing, gis and spatial database technologies. Sensors 2009, 9, 1128–1140. [Google Scholar] [CrossRef] [Green Version]
  43. Dong, N.; Yang, X.; Cai, H.; Xu, F. Research on grid size suitability of gridded population distribution in urban area: A case study in urban area of Xuanzhou district, China. PLoS ONE 2017, 12, e0170830. [Google Scholar] [CrossRef]
  44. Huang, D.; Yang, X.; Dong, N.; Cai, H. Evaluating grid size suitability of population distribution data via improved ALV method: A case study in Anhui Province, China. Sustainability 2018, 10, 41. [Google Scholar] [CrossRef] [Green Version]
  45. Townsend, A.C.; Bruce, D.A. The use of night-time lights satellite imagery as a measure of Australia’s regional electricity consumption and population distribution. Int. J. Remote Sens. 2010, 31, 4459–4480. [Google Scholar] [CrossRef]
  46. Huang, Q.; Yang, Y.; Li, Y.; Gao, B. A simulation study on the urban population of China based on nighttime light data acquired from DMSP/OLS. Sustainability 2016, 8, 521. [Google Scholar] [CrossRef] [Green Version]
  47. Azar, D.; Engstrom, R.; Graesser, J.; Comenetz, J. Generation of fine-scale population layers using multi-resolution satellite imagery and geospatial data. Remote Sens. Environ. 2013, 130, 219–232. [Google Scholar] [CrossRef]
  48. Patel, N.N.; Stevens, F.R.; Huang, Z.; Gaughan, A.E.; Elyazar, I.; Tatem, A.J. Improving large area population mapping using geotweet densities. Trans. GIS 2017, 21, 317–331. [Google Scholar] [CrossRef] [PubMed]
  49. Qi, W.; Liu, S.; Zhao, M. Study on the stability of Hu Line and different spatial patterns of population growth on its both sides. Acta Geogr. Sin. 2015, 70, 551–566. [Google Scholar]
  50. Yue, T.; Wang, Y.; Liu, J.; Chen, S.; Qiu, D.; Deng, X.; Liu, M.; Tian, Y.; Su, B. Surface modelling of human population distribution in China. Ecol. Modell. 2005, 181, 461–478. [Google Scholar] [CrossRef]
  51. Zhuo, L.; Ichinose, T.; Zheng, J.; Chen, J.; Shi, P.J.; Li, X. Modelling the population density of China at the pixel level based on DMSP/OLS non-radiance-calibrated night-time light images. Int. J. Remote Sens. 2009, 30, 1003–1018. [Google Scholar] [CrossRef]
  52. Qi, W.; Liu, S.; Zhou, L. Regional differentiation of population in Tibetan Plateau: Insight from the “Hu Line”. Acta Geogr. Sin. 2019, 75, 255–267. [Google Scholar]
  53. Wang, K.; Deng, Y. Can new urbanization break through the Hu Huanyong Line? Further discussion on the geographical connotations of the Hu Huanyong Line. Geogr. Res. 2016, 35, 825–835. [Google Scholar]
  54. Feng, Z.; Li, P. Review of population geography in the past century. Prog. Geogr. 2011, 30, 131–140. [Google Scholar]
  55. Wang, L.; Feng, Z.; Yang, Y.; You, Z. The change of population density and its influencing factors from 2000 to 2010 in China on county scale. Acta Geogr. Sin. 2014, 69, 1790–1798. [Google Scholar] [CrossRef] [Green Version]
  56. Lv, C.; Fan, J.; Sun, W. Population distribution and the influencing factors based on ESDA. Econ. Geogr. 2009, 29, 1797–1802. [Google Scholar]
  57. Liu, Y.; Stillwell, J.; Shen, J.; Daras, K. Interprovincial migration, regional development and state policy in China, 1985–2010. Appl. Spat. Anal. Policy 2014, 7, 47–70. [Google Scholar] [CrossRef]
  58. He, C.F.; Chen, T.M.; Mao, X.Y.; Zhou, Y. Economic transition, urbanization and population redistribution in China. Habitat Int. 2016, 51, 39–47. [Google Scholar] [CrossRef]
  59. Tan, M.H.; Li, X.B.; Lv, C.H.; Luo, W.; Kong, X.B.; Ma, S.H. Urban population densities and their policy implications in China. Habitat Int. 2008, 32, 471–484. [Google Scholar] [CrossRef]
  60. Mondal, P.; Tatem, A.J. Uncertainties in measuring populations potentially impacted by sea level rise and coastal flooding. PLoS ONE 2012, 7, e48191. [Google Scholar] [CrossRef]
  61. Han, M. Research on the agricultural technology carried by the Northern immigrants and the ancient Chinese economic center moving southward. J. Chin. Hist. Stud. 2013, 117–138. [Google Scholar]
  62. National Bureau of Statistics (NBS). China City Statistical Yearbook—2001; China Statistics Press: Beijing, China, 2002.
  63. National Bureau of Statistics (NBS). China City Statistical Yearbook—2011; China Statistics Press: Beijing, China, 2011.
  64. National Bureau of Statistics (NBS). China County Statistical Yearbook; China Statistics Press: Beijing, China, 2001.
  65. National Bureau of Statistics (NBS). China County Statistical Yearbook; China Statistics Press: Beijing, China, 2011.
  66. Wang, J.; Xu, C. Geodetector: Principle and prospective. Acta Geogr. Sin. 2017, 72, 116–134. [Google Scholar]
  67. Li, J.; Lu, D.; Xu, C.; Li, Y.; Chen, M. Spatial heterogeneity and its changes of population on the two sides of Hu Line. Acta Geogr. Sin. 2017, 72, 148–160. [Google Scholar]
  68. Liu, J.; Yang, Q.; Jiang, X.; Zhang, Y. Spatial agglomeration of city innovation and its spillover effects in Yangtze River Delta urban agglomeration. Resour. Environ. Yangtze Basin 2018, 27, 225–234. [Google Scholar]
  69. Zhu, K. Subtropical China. Chin. Sci. Bull. 1958, 524–528. [Google Scholar]
  70. Li, S.; Yang, S.; Liu, X. Spatiotemporal variability of extreme precipitation in north and south of the Qinling-Huaihe region and influencing factors during 1960–2013. Acta Geogr. Sin. 2015, 34, 354–363. [Google Scholar]
  71. Yan, D.; Yan, J.; Li, S.; Wang, C.; Wu, Y.; Wan, J.; Wang, H. Spatiotemporal evolution of high temperature and humidity in the north and south of the Qinling-Huaihe River. Resour. Environ. Yangtze Basin 2019, 28, 2197–2206. [Google Scholar]
  72. Chen, Z. The influence of the difference between north and south on historical process in China. Chin. Natl. Expo. 2017, 102–103. [Google Scholar]
  73. Li, Y.; Wu, S. Discussion on the regional culture characteristics of traditional houses in north and south. Shanxi Archit. 2014, 40, 16–18. [Google Scholar]
  74. Li, X. The difference and integration of north-south aesthetic culture from the perspective of diet. Chang’an J. 2017, 25–31. [Google Scholar]
  75. Li, L. Internal population migration in China since the economic reforms: A review. Geogr. Res. 2001, 20, 453–462. [Google Scholar]
  76. Xiao, Z. Hypothesis on potential energy conversion of population migration in theory: Re-interpretion of the push-pull migration laws. Popul. Econ. 2010, 6, 77–83. [Google Scholar]
  77. Gu, C. Introduction to Human Geography; Science Press: Beijing, China, 2012. [Google Scholar]
  78. Guo, M. The population distribution of the Soviet Union. Popul. J. 1989, 53–58. [Google Scholar] [CrossRef]
  79. Liu, Y.; Feng, J. Characteristics and impact factors of migration in China: Based on the analysis of the sixth census data. Hum. Geogr. 2014, 29, 129–137. [Google Scholar]
  80. Yan, Q.; Bian, Z. Analysis on spatial characteristics of China’s interprovincial migration flows based on GIS. Hum. Geogr. 2015, 30, 125–129. [Google Scholar]
  81. Wu, J.; Yu, Z.; Wei, Y.D.; Yang, L. Changing distribution of migrant population and its influencing factors in urban China: Economic transition, public policy, and amenities. Habitat Int. 2019, 94, 1–14. [Google Scholar] [CrossRef]
  82. Ning, Y. On the definition and roles of city clusters in China. Urban Insight 2016, 27–35. [Google Scholar] [CrossRef]
  83. Qi, W.; Liu, S.; Jin, F. Calculation and Spatial Evolution of Population Loss in Northeast China. Sci. Geogr. Sin. 2017, 37, 14–23. [Google Scholar]
  84. Li, J.; Zhang, W.; Sun, T.; Zhang, A. Characteristics of clustering and economic performance of urban agglomerations in China. Acta Geogr. Sin. 2014, 69, 474–484. [Google Scholar]
  85. Fang, C. Progress and the future direction of research into urban agglomeration in China. Acta Geogr. Sin. 2014, 69, 1130–1144. [Google Scholar]
Figure 1. The research framework of spatial differentiation of populations on both side of the Qinling-Huaihe Line.
Sustainability 12 04545 g001
Figure 2. Overview of the study area.
Sustainability 12 04545 g002
Figure 3. The proportions of the population at the equidistant range on both sides of the Qinling-Huaihe Line from 1982 to 2010.
Sustainability 12 04545 g003
Figure 4. Distribution map of cold and hot spots of the population at an equidistant range on both sides of the Qinling-Huaihe Line from 1982 to 2010.
Sustainability 12 04545 g004aSustainability 12 04545 g004b
Figure 5. Population growth types on both sides of the Qinling-Huaihe Line from 1982 to 2010.
Sustainability 12 04545 g005
Table 1. Selection and explanation of the factors that influence the spatial differentiation of the populations on both sides of the Qinling-Huaihe Line.
TypeIndicatorExplanation of IndicatorClassification
Physical geographical environment Temperature zoneCharacterizes temperature conditions5 categories: Qinghai-Tibet Plateau, cold temperate, middle temperate, warm temperate, subtropical, tropical
Arid/humid zoningCharacterizes precipitation4 categories: humid, semi-humid, semi-arid, and arid regions
GeomorphologyCharacterizes terrain fluctuations4 categories: mountain, hill, platform, plain
Economic and socialPer capita GDPCharacterizes the level of economic developmentDivided into 5 categories using the natural breaks method
Grain yield per unit areaCharacterizes the natural production capacity
Number of employeesCharacterizes the ability to attract employment
Number of beds in hospitals and health centersCharacterizes the level of utility service
Number of fixed telephonesCharacterizes communication capabilities
Number of patent applicationsCharacterizes innovation capabilities
Table 2. Statistics of the population size and changes on both sides of the Qinling-Huaihe Line from 1982 to 2010.
YearTotal Population (100 Million People)The Proportion of the Population (%)Population Density (People/km2)Population Increase (100 Million People)Population Average Annual Growth Rate (%)
South SideNorth Side South SideNorth Side South SideNorth Side South SideNorth Side South SideNorth Side
19825.524.0157.9442.06227208////
19906.164.5557.5242.482532360.640.541.381.60
20006.824.9458.0141.992802560.660.391.020.82
20107.345.2458.3641.643022710.520.300.740.59
Table 3. Statistics of the concentration of the population on the south side of the Qinling-Huaihe Line from 1982 to 2010.
Equidistant RangePopulation Concentration IndexPopulation Average Annual Increase (Million)Coefficient of Variation of the Population Average Annual Increase
1982199020002010199020002010199020002010
0–100 km0.37 0.37 0.38 0.41 0.52 0.07 0.07 0.86 8.10 21.56
100–200 km0.40 0.41 0.44 0.49 0.76 0.58 0.50 1.81 2.86 4.98
200–300 km0.47 0.47 0.50 0.57 0.71 0.67 0.83 2.27 4.09 7.38
300–600 km0.44 0.44 0.46 0.48 1.91 1.21 0.76 1.90 4.10 9.39
600–900 km0.36 0.36 0.38 0.41 1.66 0.94 0.60 1.13 3.08 5.60
900–2100 km0.42 0.43 0.50 0.54 2.44 3.10 2.45 1.86 4.57 3.61
Table 4. Statistics of the concentration of the population on the north side of the Qinling-Huaihe Line from 1982 to 2010.
Equidistant RangePopulation Concentration IndexPopulation Average Annual Increase (Million)Coefficient of Variation of the Population Average Annual Increase
1982199020002010199020002010199020002010
0–100 km0.360.360.370.38 0.93 0.47 0.01 1.07 2.19 15.26
100–200 km0.350.350.360.37 1.13 0.63 0.16 0.82 1.46 11.61
200–300 km0.380.380.380.39 0.78 0.42 0.13 1.03 1.09 4.65
300–600 km0.410.410.420.44 1.85 1.04 1.01 1.22 2.06 3.26
600–900 km0.510.510.540.58 1.15 0.86 1.36 2.31 3.84 5.43
900–2100 km0.390.400.410.44 0.93 0.44 0.34 2.11 4.42 7.26
Table 5. Results of analysis of factors that influence the spatial differentiation of the populations on both sides of the Qinling-Huaihe Line in 2000 and 2010.
YearFactor Index z 1 z 2 z 3 z 4 z 5 z 6 z 7 z 8 z 9
2000q statistics0.0040.0030.0420.1330.0560.6810.6860.7480.621
P value0.1190.1680.0000.0000.0000.0000.0000.0000.000
2010q statistics0.0030.0020.0380.1400.0260.7660.7970.8160.663
P value0.1920.2270.0000.0000.0000.0000.0000.0000.000
Note: Z1 denotes the temperature zone, Z2 denotes the arid/humid zoning, Z3 denotes geomorphology, Z4 denotes the per capita GDP, Z5 denotes the grain yield per unit area, Z6 denotes the number of employees, Z7 denotes the number of beds in hospitals and health centers, Z8 denotes the number of fixed telephones, and Z9 denotes the number of patent applications.
Table 6. Results of the interaction analysis of factors that influenced the spatial differentiation of the populations on both sides of the Qinling-Huaihe Line in 2000 and 2010.
z i z j q ( z i z j ) Interaction Type in 2000 z i z j q ( z i z j ) Interaction Type in 2010
z 1 z 2 0.012nonlinear enhancement z 1 z 2 0.010nonlinear enhancement
z 1 z 3 0.072nonlinear enhancement z 1 z 3 0.067nonlinear enhancement
z 1 z 4 0.162nonlinear enhancement z 1 z 4 0.172nonlinear enhancement
z 1 z 5 0.072nonlinear enhancement z 1 z 5 0.037nonlinear enhancement
z 1 z 6 0.716nonlinear enhancement z 1 z 6 0.772nonlinear enhancement
z 1 z 7 0.738nonlinear enhancement z 1 z 7 0.824nonlinear enhancement
z 1 z 8 0.765nonlinear enhancement z 1 z 8 0.828nonlinear enhancement
z 1 z 9 0.652nonlinear enhancement z 1 z 9 0.683nonlinear enhancement
z 2 z 3 0.065nonlinear enhancement z 2 z 3 0.060nonlinear enhancement
z 2 z 4 0.162nonlinear enhancement z 2 z 4 0.159nonlinear enhancement
z 2 z 5 0.068nonlinear enhancement z 2 z 5 0.034nonlinear enhancement
z 2 z 6 0.702nonlinear enhancement z 2 z 6 0.770nonlinear enhancement
z 2 z 7 0.717nonlinear enhancement z 2 z 7 0.821nonlinear enhancement
z 2 z 8 0.761nonlinear enhancement z 2 z 8 0.819nonlinear enhancement
z 2 z 9 0.633nonlinear enhancement z 2 z 9 0.680nonlinear enhancement
z 3 z 4 0.167double factor interaction enhancement z 3 z 4 0.179nonlinear enhancement
z 3 z 5 0.075double factor interaction enhancement z 3 z 5 0.061double factor interaction enhancement
z 3 z 6 0.811nonlinear enhancement z 3 z 6 0.811nonlinear enhancement
z 3 z 7 0.842nonlinear enhancement z 3 z 7 0.866nonlinear enhancement
z 3 z 8 0.881nonlinear enhancement z 3 z 8 0.891nonlinear enhancement
z 3 z 9 0.712nonlinear enhancement z 3 z 9 0.758nonlinear enhancement
z 4 z 5 0.216nonlinear enhancement z 4 z 5 0.175nonlinear enhancement
z 4 z 6 0.819nonlinear enhancement z 4 z 6 0.825double factor interaction enhancement
z 4 z 7 0.840nonlinear enhancement z 4 z 7 0.875double factor interaction enhancement
z 4 z 8 0.873double factor interaction enhancement z 4 z 8 0.903double factor interaction enhancement
z 4 z 9 0.802nonlinear enhancement z 4 z 9 0.840nonlinear enhancement
z 5 z 6 0.798nonlinear enhancement z 5 z 6 0.815nonlinear enhancement
z 5 z 7 0.776nonlinear enhancement z 5 z 7 0.824nonlinear enhancement
z 5 z 8 0.862nonlinear enhancement z 5 z 8 0.856nonlinear enhancement
z 5 z 9 0.707nonlinear enhancement z 5 z 9 0.823nonlinear enhancement
z 6 z 7 0.756double factor interaction enhancement z 6 z 7 0.855double factor interaction enhancement
z 6 z 8 0.781double factor interaction enhancement z 6 z 8 0.860double factor interaction enhancement
z 6 z 9 0.762double factor interaction enhancement z 6 z 9 0.813double factor interaction enhancement
z 7 z 8 0.760double factor interaction enhancement z 7 z 8 0.857double factor interaction enhancement
z 7 z 9 0.705double factor interaction enhancement z 7 z 9 0.853double factor interaction enhancement
z 8 z 9 0.753double factor interaction enhancement z 8 z 9 0.860double factor interaction enhancement
Note: same as above.
Table 7. Results of the analysis of factors that influenced the spatial differentiation of the populations within 200 km of the Qinling-Huaihe Line in 2010.
Factor Index z 1 z 2 z 3 z 4 z 5 z 6 z 7 z 8 z 9
q statistics0.0070.0070.1110.1730.0730.7000.7070.8330.640
P value0.1310.1310.0000.0000.0000.0000.0000.0000.000
Note: same as above.
Table 8. Statistics of administrative units and populations within 200 km of the Qinling-Huaihe Line in 2010.
DistanceNumber of Counties (A)1–3 Million Counties (A)>3 Million Counties (A)Total Population (10,000 people)Proportion of the Population (%)
South SideNorth SideSouth SideNorth SideSouth SideNorth SideSouth SideNorth SideSouth SideNorth Side
0–100 km6579121511450764630.410.59
100–200 km7993142242779772380.520.48

