Article

Riding Comfort Evaluation Based on Longitudinal Acceleration for Urban Rail Transit—Mathematical Models and Experiments in Beijing Subway

1
State Key Laboratory of Rail Traffic Control and Safety, Beijing Jiaotong University, Beijing 100044, China
2
College of Mathematics and Computer Science, Fuzhou University, Fuzhou 350116, China
*
Authors to whom correspondence should be addressed.
Sustainability 2020, 12(11), 4541; https://doi.org/10.3390/su12114541
Submission received: 12 May 2020 / Revised: 26 May 2020 / Accepted: 28 May 2020 / Published: 3 June 2020

Abstract

:
Riding comfort is an important index to measure the quality of service for railways, especially for congested urban rail transit systems where the majority of passengers cannot find a seat. Existing studies usually employ the value of longitudinal acceleration as the key indicator to evaluate the riding comfort of vehicles, while there is no validated mathematical models to evaluate the riding comfort of urban rail trains from the perspective of passengers. This paper aims to employ the collected longitudinal acceleration data and passengers’ feedback data in Beijing subway to qualitatively measure and validate the riding comfort of transit trains. First, we develop four regular fuzzy sets based comfort measurement models, where the parameters of the fuzzy sets are determined by experiences of domain experts and the field data. Then a combinational model is given by averaging the four regular fuzzy set models to elaborate a comprehensive measurement for the riding comfort. In order to verify the developed models, we conducted a questionnaire survey in Beijing subway. The surveyed riding comfort data from passengers and the measured acceleration data are used to validate and optimize the proposed models. Two key parameters are deduced to describe all parameters in the fuzzy set models and a meta-heuristic algorithm is applied to optimize the parameters and weight coefficients of the combinational model. Comparing the collected comfort data with the comfort levels and values calculated by different models shows that the averaging model is better than any regular fuzzy set model. Furthermore, the optimized model is better than the averaging model and provides the best accuracy and robustness for riding comfort measurement. The models provided in this paper offer an optional way to measure the riding comfort for further assessment and more comprehensively tuning of train control systems.

1. Introduction

With the development of rail transit and the improvement of people’s living condition, high-speed, on-time and safety are no longer the only goals of modern railway systems [1]. Passengers’ requirement on good riding experiences has driven the riding comfort as one important index of train control systems. In particular, the majority of passengers in congested urban rail systems cannot find a seat and have to stand through the whole trip (as shown in Figure 1). In these situations, train riding comfort is especially significant, since any sudden accelerating or braking may tumble the standing passengers and cause potential safety risks.
Currently, there are many measurement methods for riding comfort, including Sperling fitted index, Diekeeman index, Janeway comfort factor and so forth [2]. These methods consider that the improvement of riding comfort is one key to improve railway passengers’ amenity [3] and the concept of riding comfort is related to two categories of measurement: the measurement of physical quantities that affect riding comfort and the measurement of the corresponding feeling of human beings [4], which is however too complex for computing in practice. In some other researches, the riding comfort for railway is determined by vibration, noise, temperature, humidity and many other factors, of which vibration has been most extensively studied in quantitative manner [5]. More specific research like the seat measurement method that emphasizes the interactions between the human body and seats has also been developed for the purpose of studying the passengers’ comfort level [6]. However, the riding comfort basically is a subjective feeling of passengers and there are too many influence factors that cannot be well measured [7]. For example, the vehicle-track interaction [8], overhead system [9], ground-borne vibration [10] and the environment [11] may affect the feeling of passengers, and there is no universal standard measurement method for riding comfort till now.
In urban railway systems, there are many different subsystems (for example, air conditioning, train control systems, etc). Each of them has its own focus on riding comfort improvement. In our study, we concentrate on the riding comfort arising from train control systems, which not only can provide real-time information on train speeds and positions for riding comfort measurement, but also can change the acceleration to further enhance the riding comfort. In order to evaluate the riding comfort from train control systems, we collected a huge amount of train running data in Beijing subway, which involve the train position, velocity, acceleration (and braking) rate [12,13]. We use these field data to derive some qualitative methods and construct mathematical models for evaluating riding comfort of trains.
Theoretically, riding comfort is some type of perception which varies for different persons; this leads some uncertainties to its measurement. As a suitable tool for measuring subjective feeling and tacking uncertainties in measurements, the fuzzy sets are employed in this paper and the fuzzy membership functions (MFs) are used to calculate the riding comfort of passengers qualitatively. By using MFs, the acceleration rate can be transformed into a unified comfort measurement number in the range of [0 1], which is a suitable index for the purpose of optimizing the train control systems. Four regular fuzzy sets are first employed. The parameters of MFs are initially set by domain experts’ experience and then optimized through a meta-heuristic optimization algorithm. In this study, the acceleration rate data of trains and riding comfort survey data of passengers are collected in Beijing subway Yizhuang line, and they are used to tune and test the riding comfort measurement models. In a short summary, our approach has following three advantages compared with other ones: (1) we only use acceleration rate data to partially measure riding comfort, which make the data collection easier and such kind of index is more suitable for the design of train control algorithms because the most controllable factor in the train operation system is the acceleration. (2) Four fuzzy sets and their ensemble are used to increase the robustness of riding comfort measurement. (3) We use the acceleration data from the field, the surveyed comfort data, and an optimization algorithm to adjust the parameters in the fuzzy set based models and further improved the accuracy of riding comfort measurement.
The rest of the paper is organized as follows. In Section 2, four models for riding comfort computing are developed based on four regular fuzzy sets. The expert experience based determination of the parameters of fuzzy sets is introduced as well. In Section 3, the four models are applied on collected data in Beijing subway, and the results are compared with the surveyed riding comfort data from passengers. Then one combinational model is suggested by linearly combining the four regular fuzzy set models. In Section 4, the parameters of the combinational model are optimized by a meta-heuristic algorithm with measured riding comfort data, and the best riding comfort measurement model is obtained. Finally, conclusions and future work are outlined in Section 5.

2. Comfort Measurement Models Based on Fuzzy Sets

In an inertial reference system like a train, the passengers will move backward when the train starts; on the other hand, the passengers will lean forward when the train suddenly stops. In those cases, passengers may be caught unprepared and lose their balance because the acceleration rate is too large [14]. In short, if the acceleration rate is greater than the scale that the human body can tolerate, passengers feel uncomfortable. In some research [15,16,17], the riding comfort is evaluated by the average acceleration rate. However, the degree of riding comfort is not perceived in the same way by different people. The average acceleration rate sometimes cannot properly indicate the level of riding comfort for the majority of passengers.
In 1965, Zadeh initiated “fuzzy set” theory and the “incompatibility principle”: the traditional system analysis technology cannot handle humanities system in essence, which is greatly related to the human behavior, perception and emotional impacts [18]. Obviously, passengers’ feeling on riding comfort follows “fuzzy set” theory characterized by membership functions (MFs) [19]. In this section, we try to establish four simple models for computing instantaneous riding comfort value by using four commonly used fuzzy sets. By treating the riding comfort value as the degree of fuzzy sets defined in the domain of acceleration rate, we transform the problem for computing the riding comfort value into computing membership degree. As the degree of MFs is within [0 1], we can define that 1 represents the highest riding comfort, and 0 stands for the worst one. We firstly test four regular fuzzy set models, and then we conduct further research on the comparisons among them and combining them to improve the robustness of riding comfort measurement.

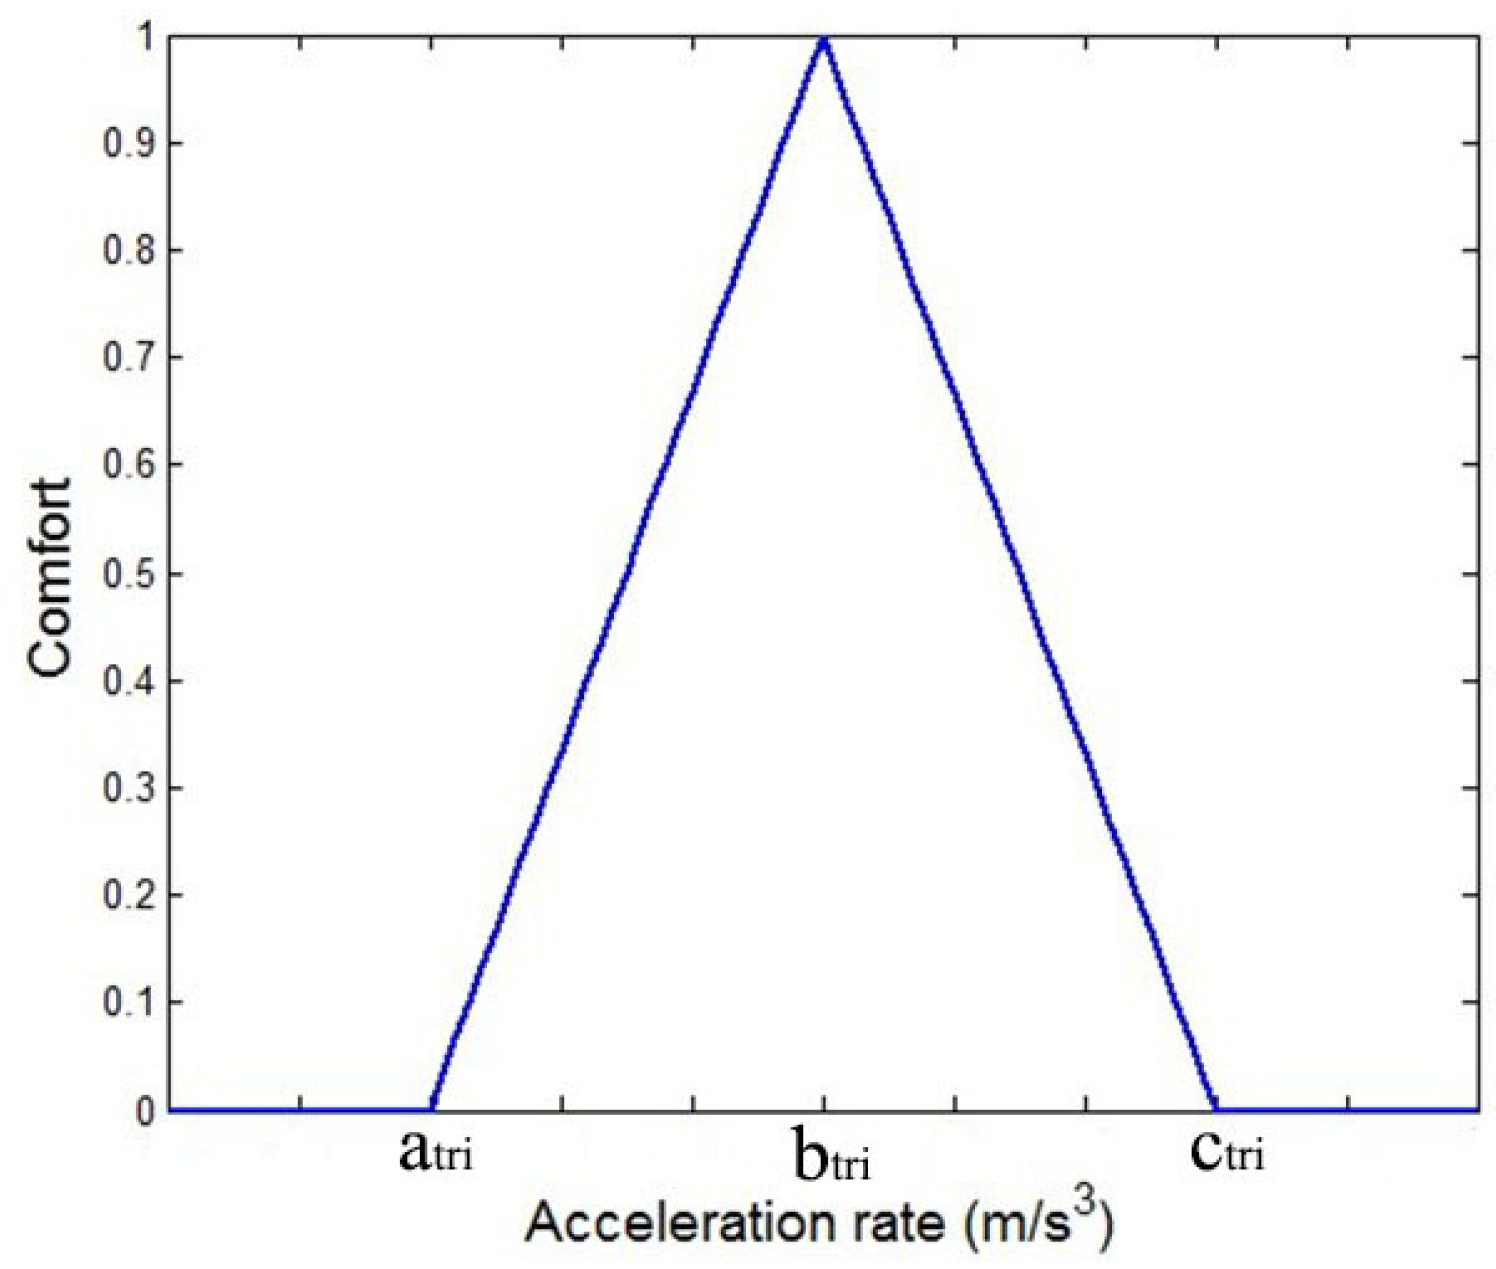
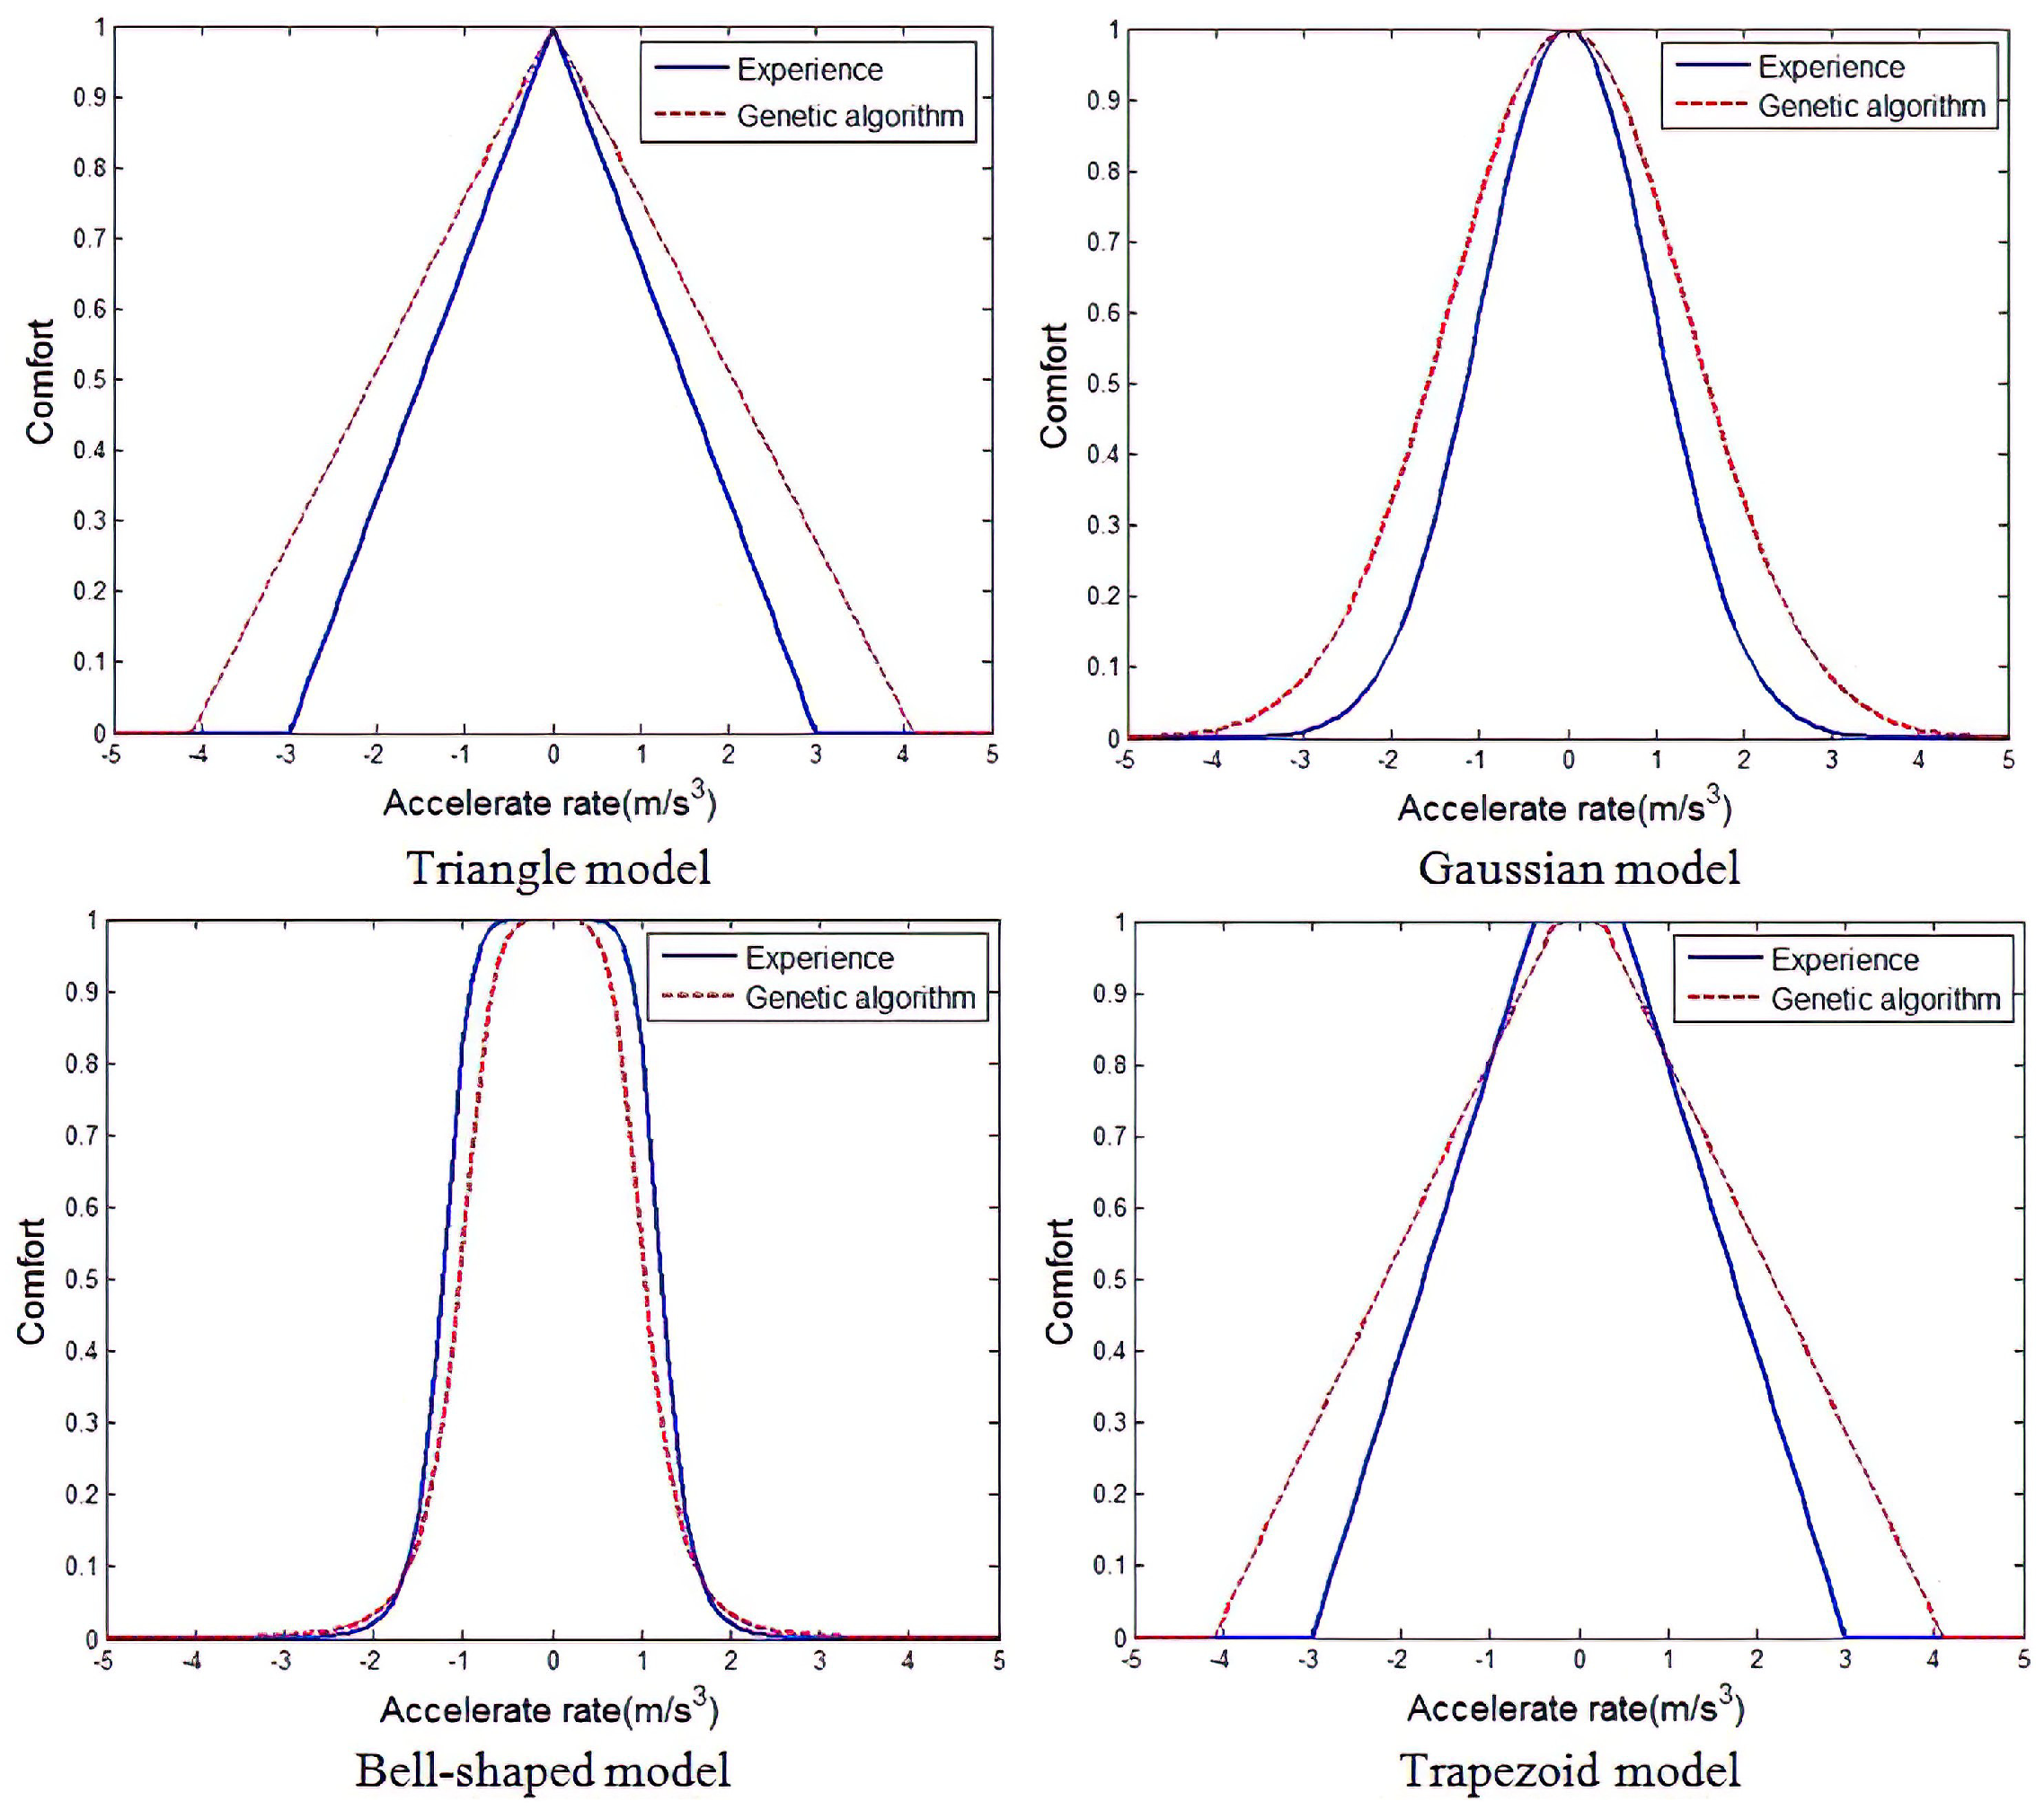
2.1. Triangular Fuzzy Set Model

The first fuzzy set model is the simple and wide-used triangular fuzzy set. The model of the triangular fuzzy set has a MF in the shape of a triangle [20,21] (as shown in Figure 2), and the MF is expressed as follows:
f ( x ; a t r i , b t r i , c t r i ) = 0 , x a t r i , x a t r i b t r i a t r i , a t r i x b t r i c t r i x c t r i b t r i , b t r i x c t r i , 0 , c t r i x ,
where the parameters a t r i and c t r i set the left and right base points of the triangle and the parameter b t r i sets the location of the triangle peak. When acceleration rate is 0, passengers cannot feel the impulse; apparently the corresponding riding comfort value is 1. Hence, we set b t r i = 0 . The previous study has found that when the acceleration rate is more than 3 m/s3, passengers would suffer a great vertical impulse [22]. In this case, the riding comfort value is set to 0. Hence, we can use the maximum acceleration rate, A m a x , to represent the other two parameters in the fuzzy model. Obviously, we have a t r i = A m a x and c t r i = A m a x . This means when the acceleration rate is larger than the maximum one, the riding comfort value will be 0. The field acceleration rate data shown in Figure 2 also reflect that the maximal accelerating rate is very close to 3 m/s3 in the train control systems. Hence, in this model, we set a t r i = 3 , b t r i = 0 , c t r i = 3 .

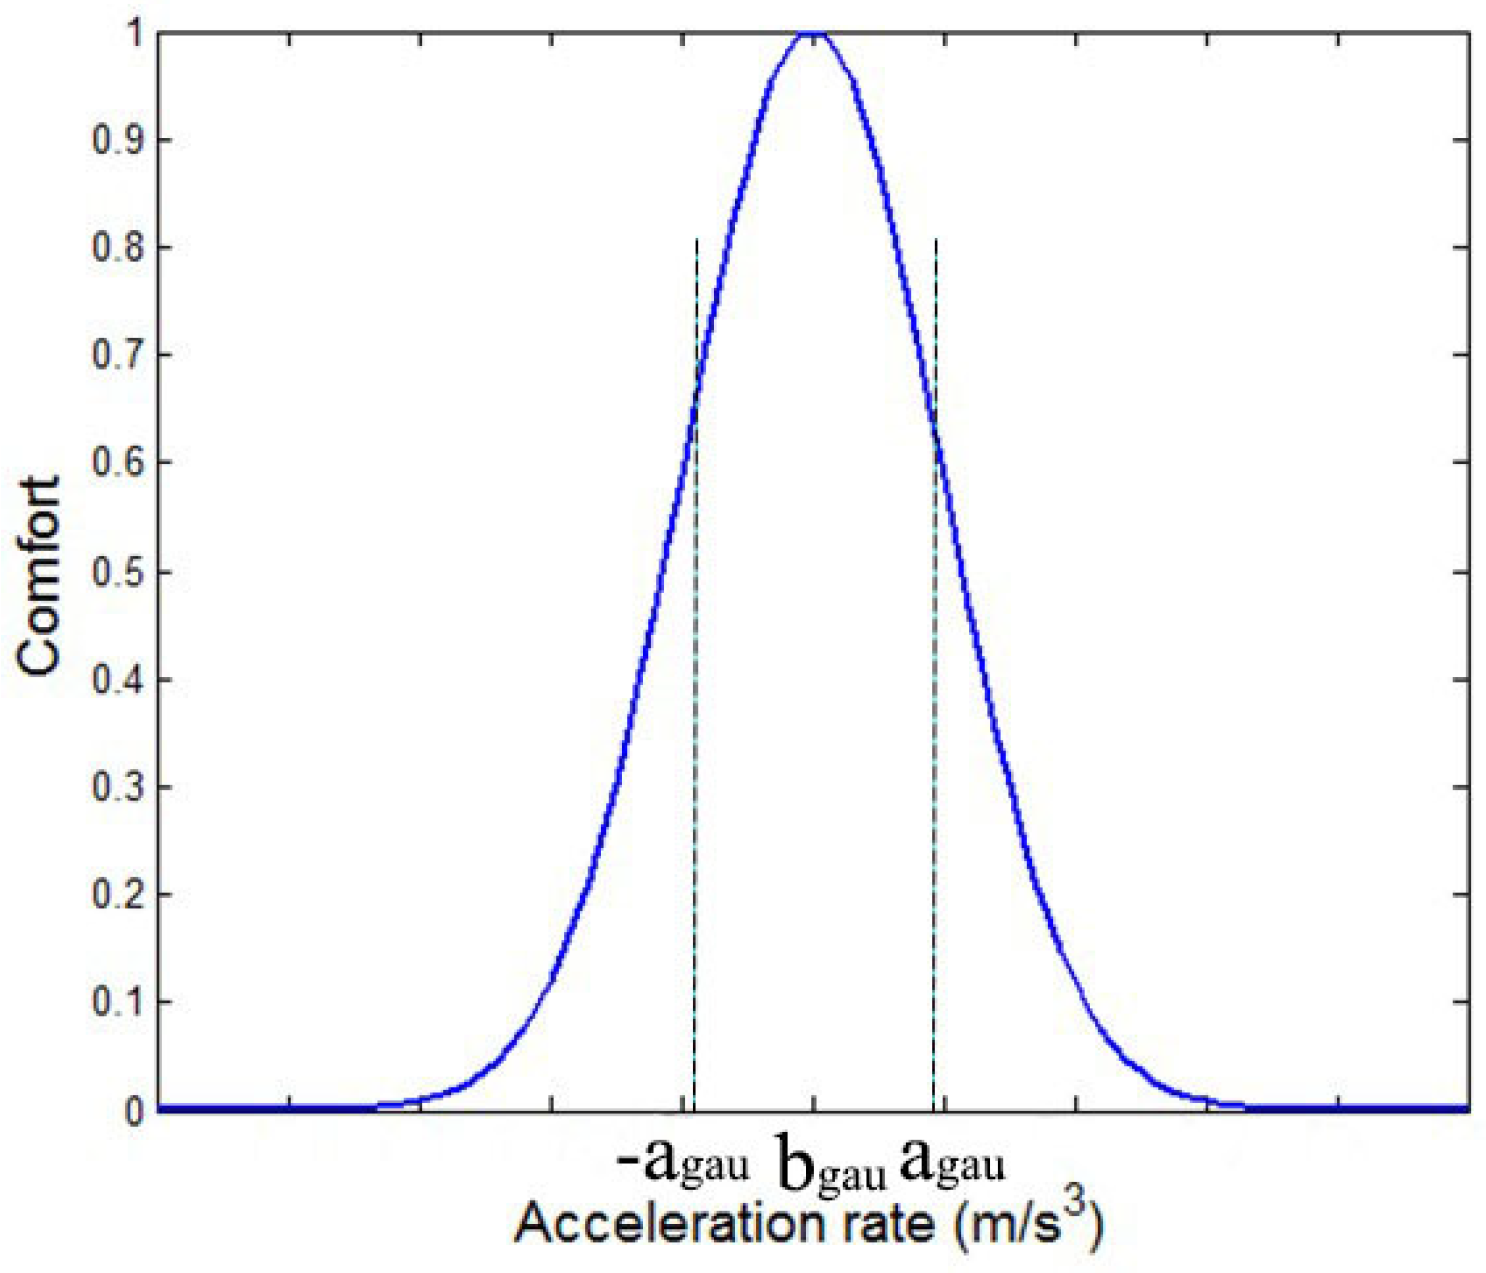
2.2. Gaussian Fuzzy Set Model

The second fuzzy set model used in this paper is the Gaussian model. Gaussian fuzzy set is symmetric with good smoothness, which is widely used in adaptive fuzzy inference systems [23,24]. The Gaussian MF is expressed as follows:
f ( x ; a g a u , b g a u ) = e ( x b g a u ) 2 2 a g a u 2 .
As shown in Figure 3, the Gaussian model is completely determined by a g a u and b g a u , where b g a u represents the center of the model and a g a u determines the width of the model. As we mentioned before, the center of the model is also equal to 0, that is, b g a u = 0 . We can also use A m a x to calculate a g a u , with the assumptions that f ( x ; a g a u , b g a u ) = 0 . 01 when x = A m a x (this means the riding comfort value is almost 0 when the maximum acceleration rate is taken). By deduction, we get a g a u = A m a x 3 . 04 by Equation (2). As A m a x takes the same value in the triangular model, we have a g a u = 0 . 98 .

2.3. Bell-Shaped Fuzzy Set Model

The previous two MFs are symmetric and can describe the human beings’ perception about the relationships between the acceleration rate and the riding comfort value. According to the common sense about human perception, people cannot feel impact when acceleration rate is within a very small range (−0.5 m/s3 0.5 m/s3). Hence, we may need to use a MF that is not sensitive in some range around 0 (as illustrated in Figure 4). In order to reflect the physiological sense better, we use Bell-shaped fuzzy set model as the third MF to measure riding comfort value. The model is expressed as follows [25,26]:
f ( x ; a b e l , b b e l , c b e l ) = 1 1 + | x c b e l a b e l | 2 b b e l .
Here a b e l , c b e l represent the width and center of the model, b b e l is a positive value (if b b e l is negative, the model will be an inverted bell-shaped) and is used to adjust the steep of the curve. Again, the center of the model is 0, that is c b e l = 0 . We use two parameters, the minimum and the maximal acceleration rates A m i n and A m a x , to calculate a b e l , b b e l , c b e l with the following two assumptions:
(1) when c b e l = 0 and x = A m a x , then f ( x ; a b e l , b b e l , c b e l ) = 0 . 01 (when the acceleration rate is large enough, the riding comfort value will close to 0);
(2) when c b e l = 0 and x = A m i n , then f ( x ; a b e l , b b e l , c b e l ) = 0 . 99 (when the acceleration rate is small enough, the comfort level will be close to 1).
According to Equation (3), we can obtain the following equalities:
0 . 01 = 1 1 + | A m a x a b e l | 2 b b e l 0 . 99 = 1 1 + | A m i n a b e l | 2 b b e l .
After rewriting Equation (4), we obtain:
| A m a x a b e l | 2 b b e l = 99 | A m i n a b e l | 2 b b e l 0 . 01 .
Then, according to the above mentioned assumptions, a b e l and b b e l can be approximately solved from Equation (5) in the closed-form as:
a b e l A m a x A m i n
b b e l 2 l g A m a x A m i n .
As we know that A m i n = 0 . 5 and A m a x = 3 , we obtain that a b e l = 1 . 22 and b b e l = 2 . 57 .

2.4. Trapezoidal Fuzzy Set Model

Similar to the bell-shaped fuzzy model, the trapezoidal fuzzy set can also be used to measure the riding comfort with the similar characteristics: when acceleration rate is within a very small range (−0.5 m/s3 0.5 m/s3), the riding comfort value is equal or very close to 1. Compared with the bell-shaped fuzzy set model, the trapezoidal MF has the advantage of easy computation and the disadvantage of discontinuous gradient, as shown in Figure 5. The trapezoidal MF Model is expressed as follows [27,28]:
f ( x ; a t r a , b t r a , c t r a , d t r a ) = 0 , x a t r a x a t r a b t r a a t r a , a t r a x b t r a 1 , b t r a x c t r a d t r a x d t r a c t r a , c t r a x d t r a 0 , d t r a x .
Or, more compactly, the model can be rewritten as:
f ( x ; a t r a , b t r a , c t r a , d t r a ) = m a x ( m i n ( x a t r a b t r a a t r a , 1 , d t r a x d t r a c t r a ) , 0 ) ,
where a t r a , b t r a , c t r a , d t r a represent the four important points of a trapezoid MF as illustrated in Figure 5. We can also use A m i n and A m a x to calculate a t r a , b t r a , c t r a , d t r a by a t r a = A m a x , b t r a = A m i n , c t r a = A m i n , and d t r a = A m a x , respectively. With the following two assumptions: (1) when the absolute of acceleration rate is less than 0.5 m/s3, the riding comfort value is set to 1; (2) when the absolute of acceleration rate is more than 3 m/s3, the riding comfort value is set as 0. Then, we obtain a t r a = 3 , b t r a = 0 . 5 , c t r a = 0 . 5 and d t r a = 3 .

3. Model Evaluation Based on Field Data

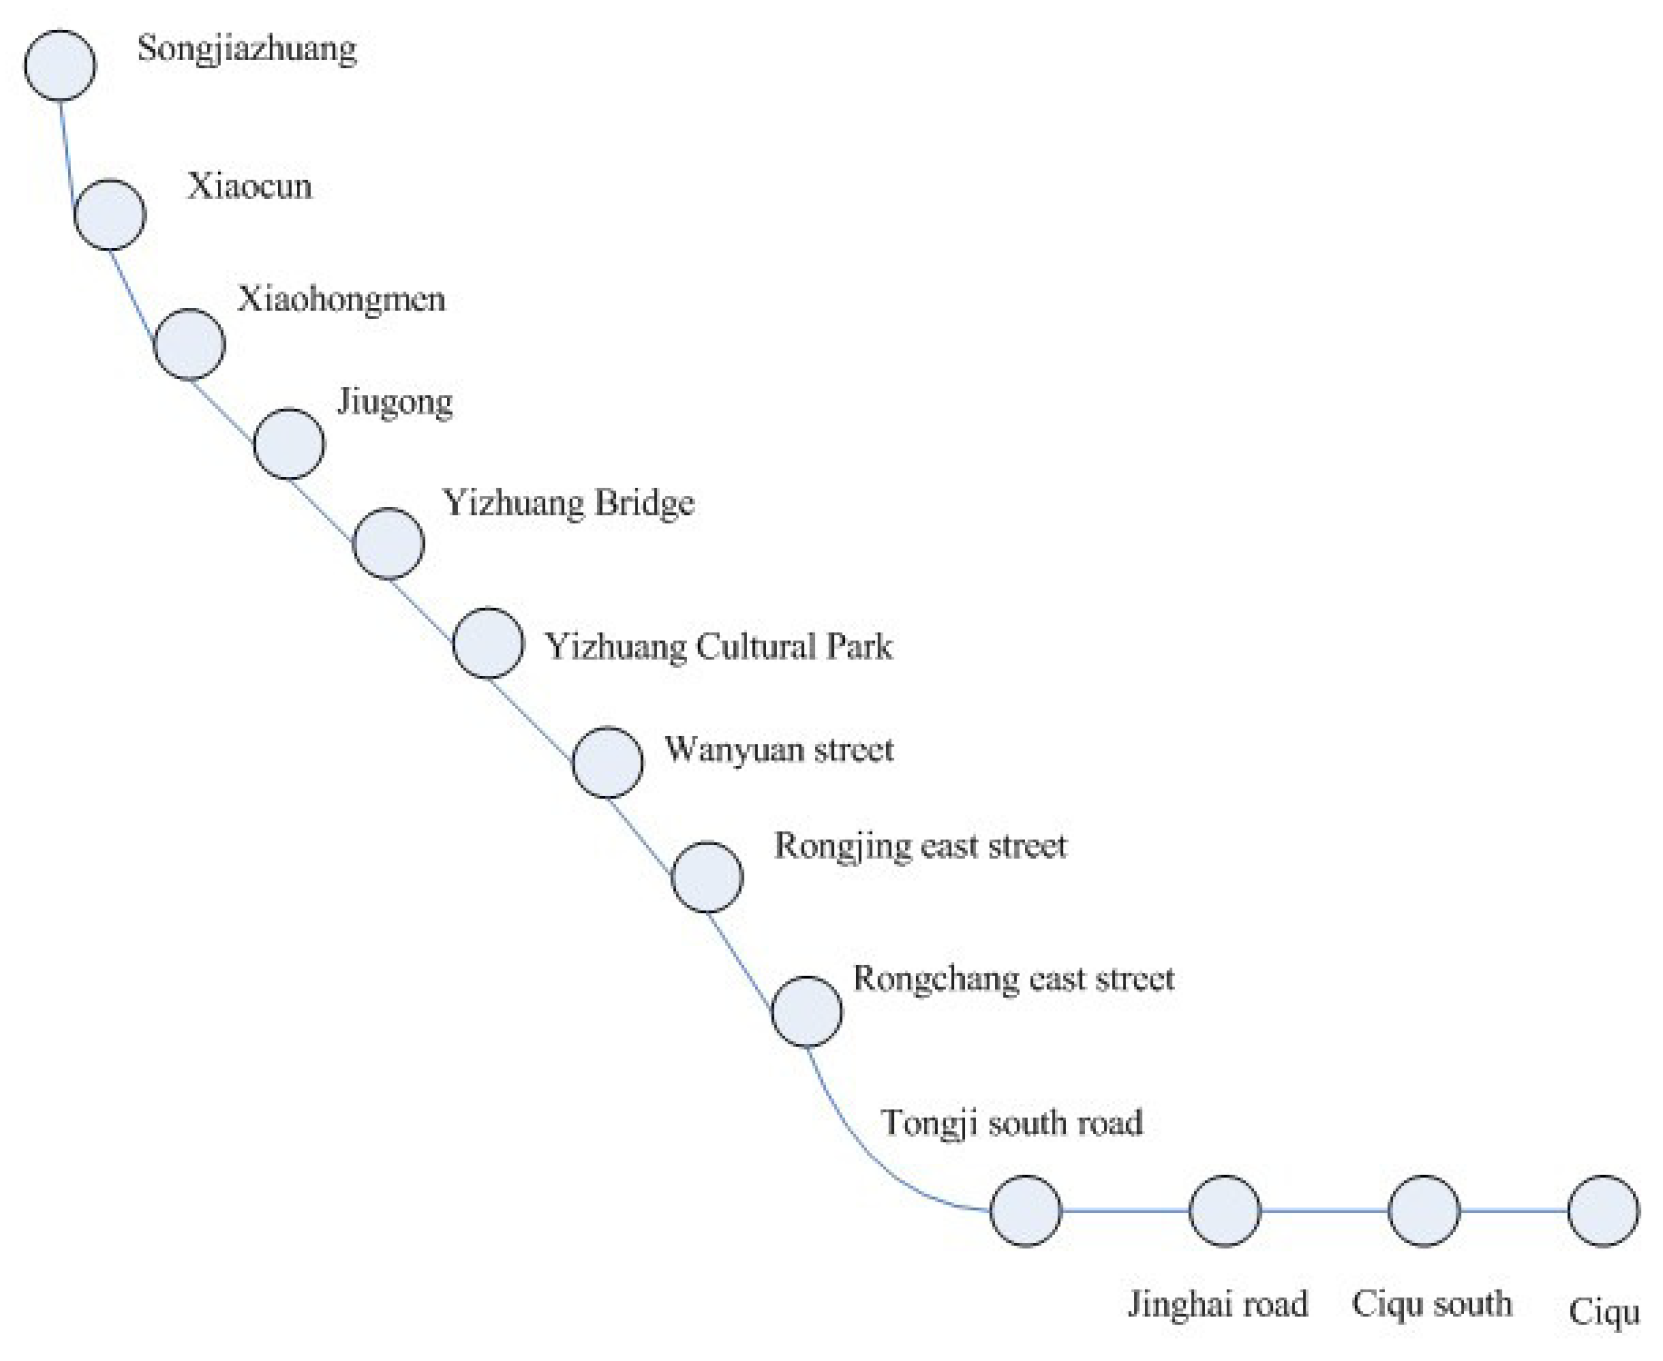
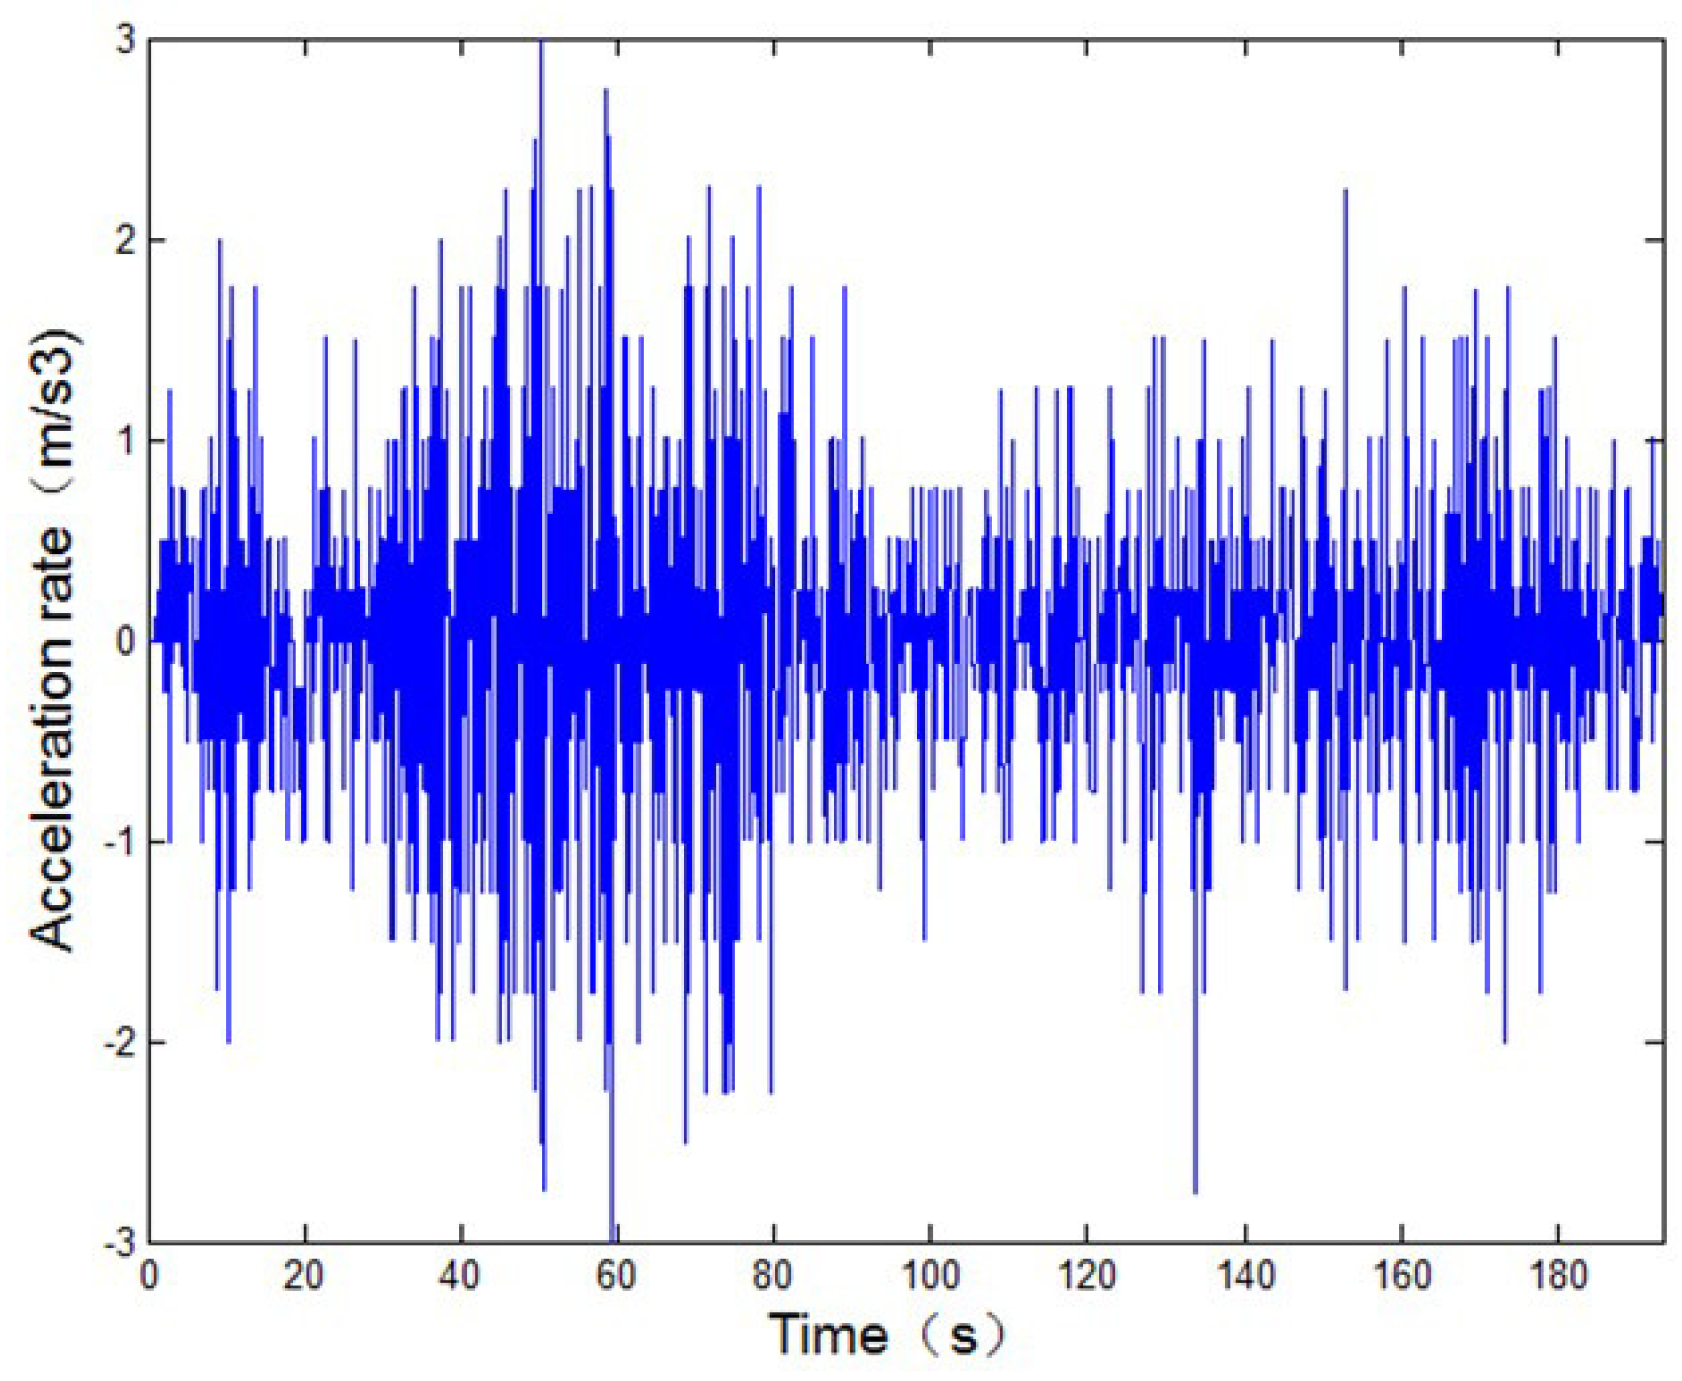
3.1. Field Data Description

Beijing subway Yizhuang line connects the center of Beijing and Yizhuang Economic Development Zone, and the length of the line is 23.23 km. Figure 6 illustrates the route map of Yizhuang Line. It was officially in operation on 30 December 2010 and the entire operation time is 33 min [15].
In Yizhuang subway line, ATO (automatic train operation) systems are adopted to control the train instead of human drivers. Through the connection between the onboard computer and the serial output interface of ATO, large amounts of online train operation data are obtained for riding comfort measurement. In particular, a set of accelerometers are installed on the head and tail of trains in order to record and collect the accelerating rate of trains at each time unit. Here, the accelerating rate actually represents the variations of train acceleration between two time units (or jerk). For example, consider that the train acceleration values are u t and u t + 1 at time units t and t + 1 . Then, the acceleration rate is calculated by | u t + 1 u t | / Δ t , where Δ t is the sampling cycle (0.2 s in Beijing subway) A set of field acceleration rate data, from Xiaocun station to Songjiazhuang station of the Yizhuang subway line, is shown in Figure 7. About 1000 data samples are obtained with the sampling cycle of 0.2 s.

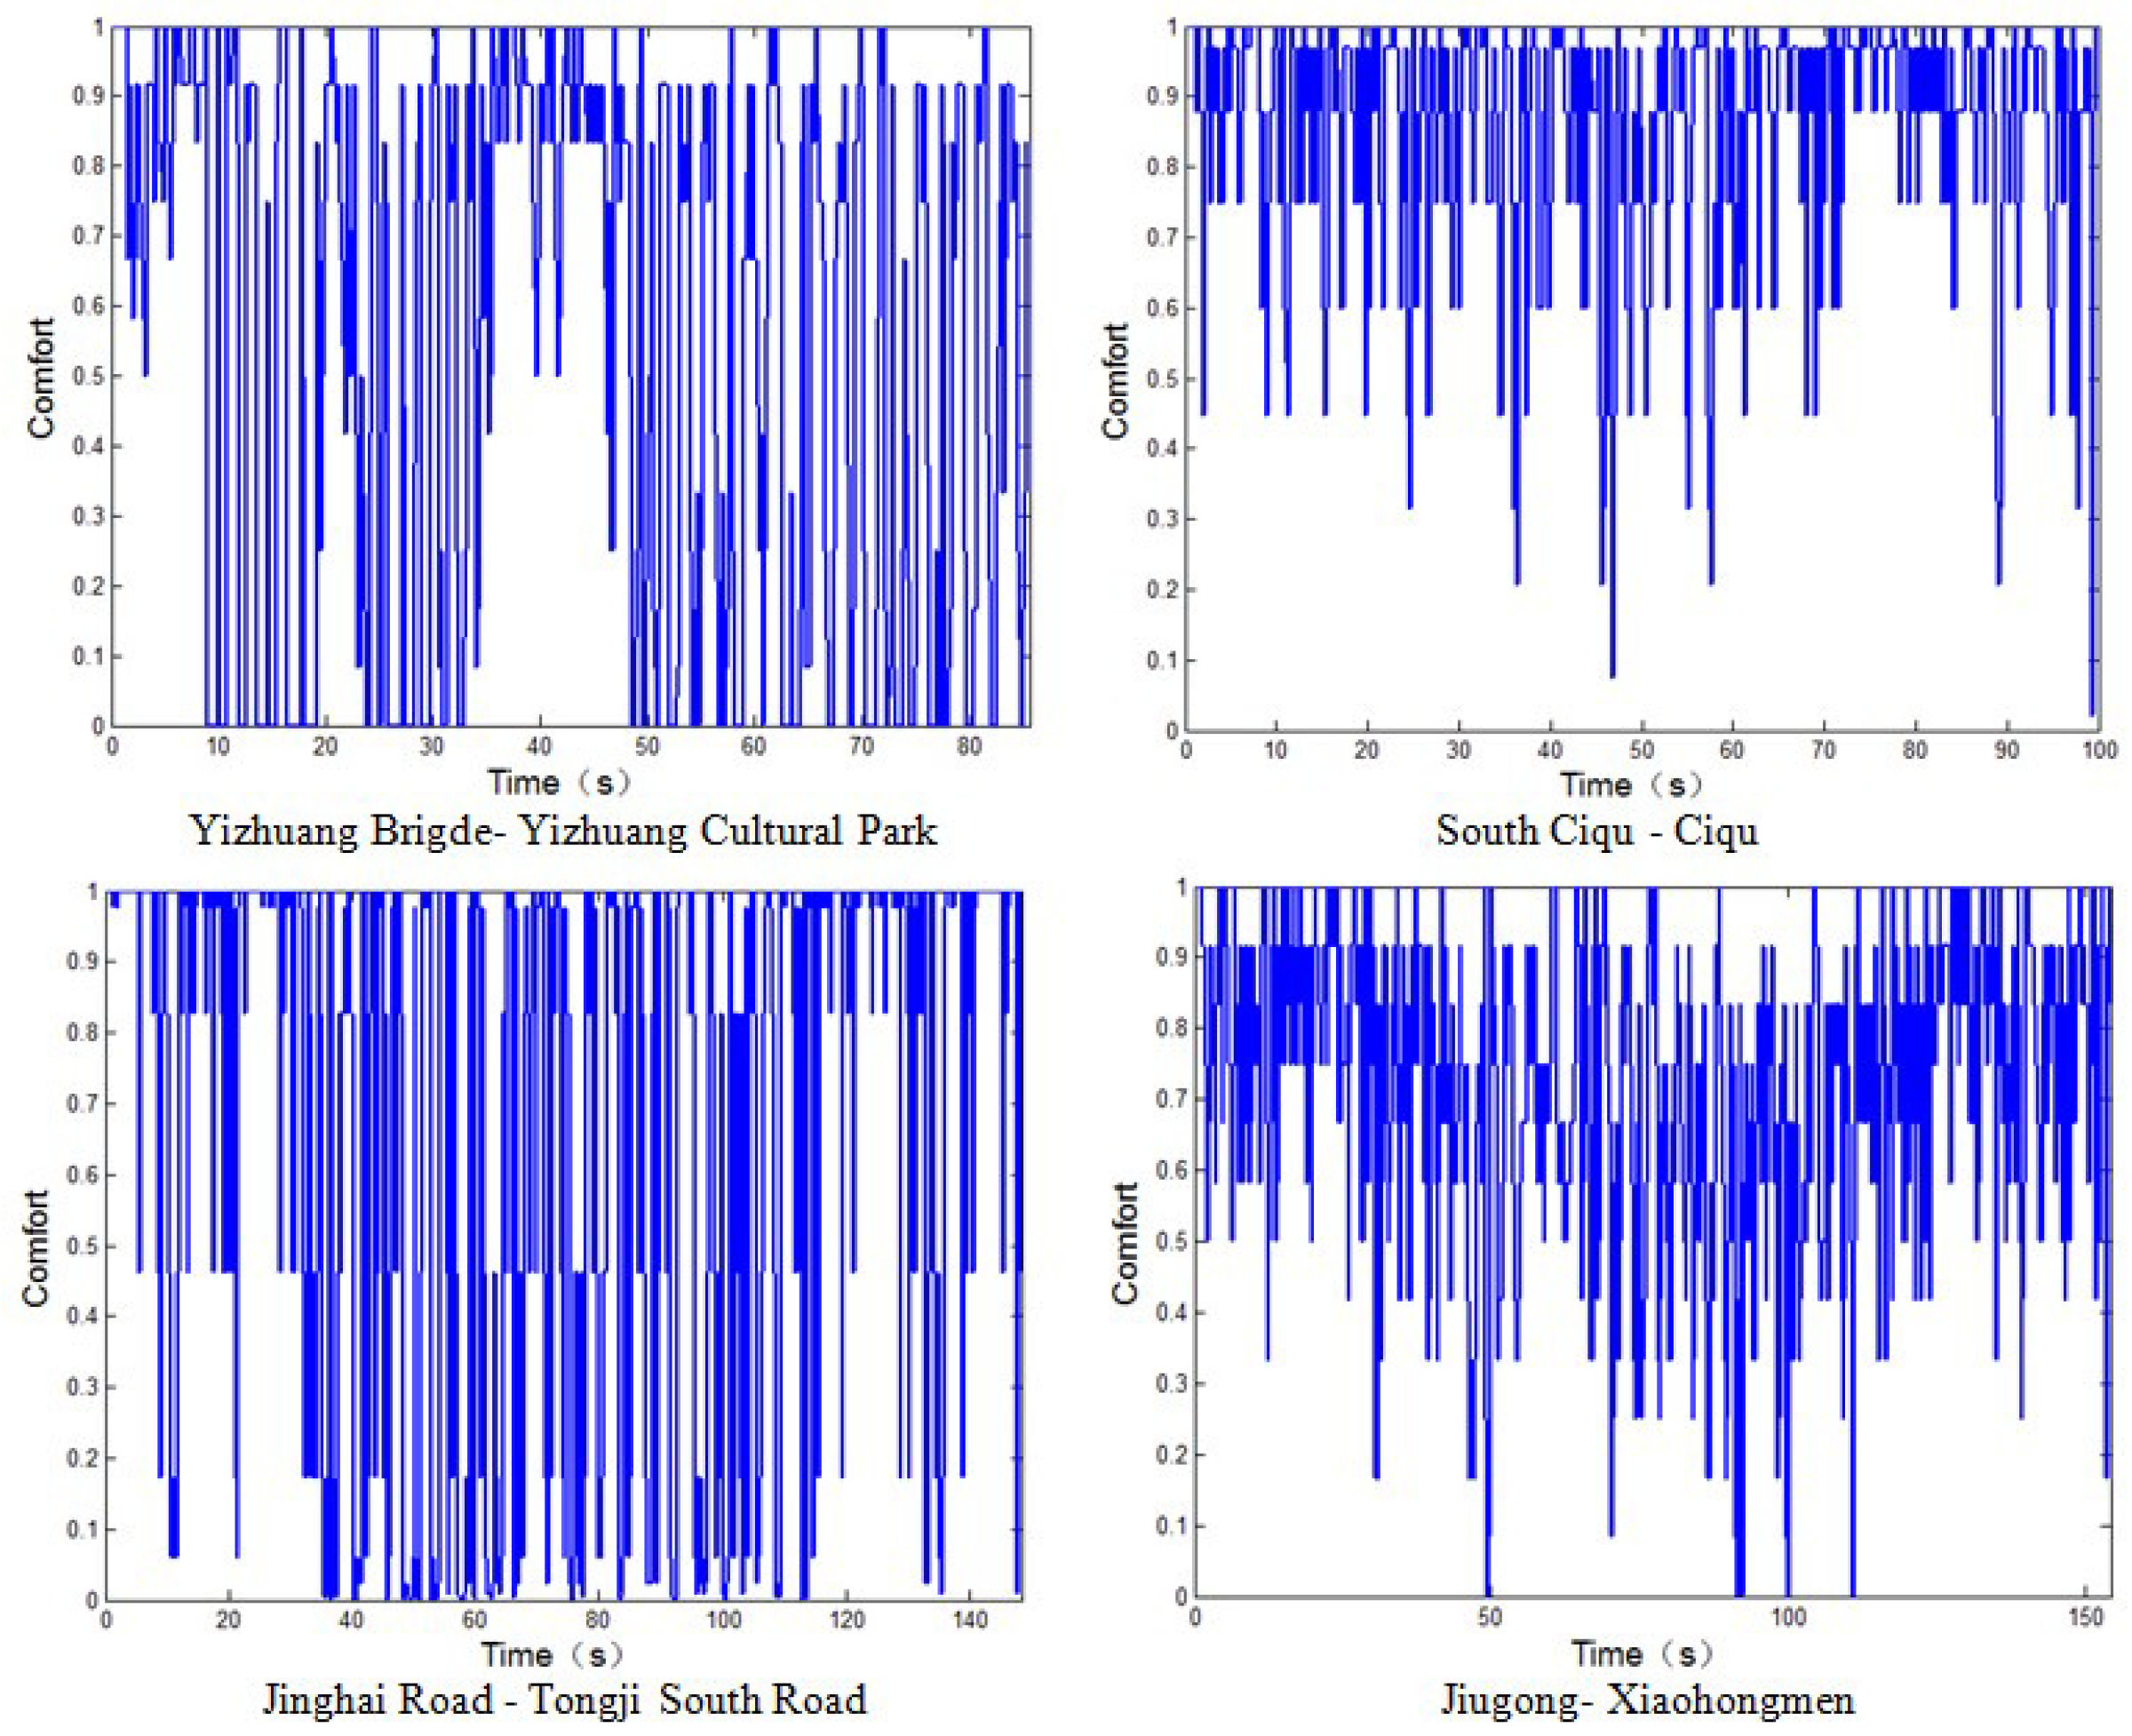
3.2. Model Evaluation Based on Train Acceleration Data

In previous section, we developed four regular fuzzy set models to compute the instantaneous riding comfort value according to acceleration rate from train control systems and more importantly, the parameters in fuzzy models are determined by domain experience and field data. Now we use the four models to compute riding comfort value for the field acceleration rate data collected in Yizhuang Line. In this section, four sets of acceleration rate data are selected to computing riding comfort value: (1) data set 1 from station Yizhuang Bridge to station Yizhuang Cultural Park, (2) data set 2 from station South Ciqu to station Ciqu, (3) data set 3 from station Jinghai Road to station Tongji South Road and (4) data set 4 from station Jiugong to station Xiaohongmen.
Then, four fuzzy models are used to compute the riding comfort value for the four data sets. Due to page limitation, we only show the following derived comfort values: (1) derived by applying the triangle model on the data set 1, (2) derived by applying the Gaussian model on the data set 2, (3) derived by applying the bell-shaped model on the data set 3, and (4) derived by applying the trapezoid model on the data set 4. In each sampling cycle, the acceleration rate data is converted into a degree of the MF, which is the instantaneous riding comfort value in that cycle. Figure 8 illustrates the process of transforming the acceleration rate data into degree of MFs for the four field data sets.
To gain a summarized riding comfort value for the entire riding from one station to the next station, all riding comfort values in the block between two stations are averaged. In other words, the definition of the riding comfort value (V) for a block between two continuous stations is as follow.
V = 1 n i = 1 n f ( J i ) ,
where f is one of the fuzzy membership functions mentioned in Section 3, J is the acceleration rate data set, n is the total number of sampling cycles and C v represents the riding comfort value.
As we know, human beings usually describe the riding comfort in a fuzzy way using expressions like very comfortable, quite comfortable, slightly uncomfortable, less comfortable and very uncomfortable. To facilitate the assessment of the riding comfort, we divide the computed riding comfort value into 5 levels with L = 1, 2, 3, 4, 5, respectively, as shown in Table 1. Hence, there are two kinds of the riding comfort measurement in this paper: riding comfort value and riding comfort level.
By the Equation (10) and Table 1, we can measure the riding comfort levels for all intervals or blocks between two continuous stations. As we mentioned in Section 2, there are 13 stations in Yizhuang subway line. And the line is a Bi-directional subway, and then we have 12 uplink blocks and 12 downlink blocks. For the purpose of convenience, we define the 12 blocks of uplink (from Songjiazhuang to Ciqu) as U1, U2, U3, U4, U5, U6, U7, U8, U9, U10, U11, U12; the 12 blocks of downlink (from Ciqu to Songjiazhuang) as D12, D11, D10, D9, D8, D7, D6, D5, D4, D3, D2, D1.
We take the four blocks Yizhuang Brigde-Yizhuang Cultural Park (U5), South Ciqu-Ciqu (U12), Jinghai Road-Tongji South Road (D10) and Jiugong- Xiaohongmen (D3) as our study cases. For the purpose of comparison, we also include the average of the four regular fuzzy set models to obtain a comprehensive measurement. The riding comfort value of the four blocks calculated by the four regular fuzzy set models, the average value (termed as V in Table 2) of the four models and its corresponding comfort level are listed in Table 2.
From Table 2, it is clear that the outputs of all fuzzy models are close to each other. By averaging, we can obtain the value in the middle of them to increase the robustness of computing riding comfort value and judging its level, similar to the methods used in ensemble learning [29]. This will be validated by the surveyed riding comfort data later.

3.3. Model Validation Based on Passenger Feedback Data

In order to verify the effectiveness of the proposed models, we conduct a field experiment to collect the feeling of riding comfort by on-board passengers on the subway Yizhuang line. The field experiment is conducted as follows: we select a group of volunteers to participate in the experiments on the weekday of October 2018, each one with a questionnaire; after taking the train in Yizhuang subway line, they measured the riding comfort of each block of the line by their personal feelings and filled their feeling on riding comfort level in the questionnaire. Similarly, we divided comfort level into 5 levels from 1 to 5, as shown in Table 1. To avoid other factors’ influence, we ask the experimenters to fill the riding comfort level just according to their feeling about the train’s accelerations and decelerations. In addition, we picked the results of only eight volunteers, who have a seat on the train, in order to reduce the effects of other factors (e.g., congestion) as much as possible.
Since the physical conditions of human are not the same in a day, the feeling for riding comfort is also not the same for the same person in all day long. The experimenters have ridden the train for 6 round trips in a whole day that is from the first station to last station and back forth. Two round trips in the morning (8 a.m.–11 a.m.), two round trips in the afternoon (2 p.m.–5 p.m.) and another two round trips in the evening (7p.m.–10 p.m.). As we mentioned before, there are 13 stations and 12 blocks in the Yizhuang Subway Line. So, we collect 24 × 6 groups of data (each group include the 8 estimated comfort level by 8 experimenters), and we can take half of the data (72 groups: each round trip in the morning, in the afternoon and in the evening) as training data set, the remaining as the testing data set.
Some of the training data set are listed in Table 3, where the values in the brackets are the number of experimenters. The Mor, Aft and Eve in Table 3 represent Morning, Afternoon and Evening respectively. To make the computation efficient, we set the middle value of each riding comfort level ( L e ) as the representative comfort value in that level, that is, the value 0.1, 0.3, 0.5, 0.7 and 0.9 are used to represent the comfort level 1, 2, 3, 4 and 5. Then, we obtain the comprehensive riding comfort value in experiments ( V e ) in the Table 3, which is a referenced or investigated value to test the performance of the proposed models.
In Table 2, we obtain the riding comfort values by four single fuzzy models and the average of them. By Table 1, we can get the riding comfort level for the above models. For the training data set, the difference between the riding comfort obtained by experimenters and that by four fuzzy set models, are listed in Table 4. The comfort level and the absolute errors ( | e V | ) between the surveyed and the computed comfort values are all listed in that Table.
| e V | = | V e ( i ) V ( i ) |
where V e is the value of experience, V c is the value of each one of the proposed fuzzy model.
As shown in the Table 4, although the four models output different values, the overall trend is similar: they are close to the judgements by experimenters. Each fuzzy model has its strength and weakness in different time or blocks. Hence, there is still some room to combine them or optimize the parameters in the fuzzy models to get better results.
To compute riding comfort value and measure riding comfort level better, four fuzzy models can be used together to increase the accuracy and robustness like the bagging technique of the ensemble learning [29]. Hence, we define a combinational or ensemble model that calculates the riding comfort values by weighted averaging the four regular fuzzy models:
V c = w t r i V t r i + w g a u V g a u + w b e l V b e l + w t r a V t r a ,
where V c is the riding comfort value by the combinational model, V t r i , V g a u , V b e l and V t r a are the four riding comfort value by the four models, and w t r i , w g a u , w b e l and w t r a are the weights of four models.
Firstly, we set w t r i = 0 . 25 , w g a u = 0 . 25 , w b e l = 0 . 25 , w t r a = 0 . 25 as we are not sure which model is more important. Clearly, this is a simple average model. Based on the computed riding comfort value, we can then determine the riding comfort level by Table 1. For the training data set, the riding comfort level by experimenters, calculated riding comfort level by the simple average model and the absolute errors between the combinational model(the average model) and the experimenters are shown in Table 5. Compared with data by the single fuzzy models in Table 4, we found that the absolute error of the simple average is only better than other models in some blocks.
We have studied all the data collected in all blocks of the subway line. Taking the data by experimenters as the standard reference data, the level consistence percentage ( P L ) and mean absolute error ( | e V | ¯ ) of four models and the combinational model are shown in Table 6. ( P L ) is defined as the ration of the number of model comfort levels being consistent with that of experimenters and the number of all comfort levels.
P L = i = 1 n t i n × 100 % ,
where if the computing comfort level is consistent with the one by experimenters for the ith test, t i = 0 ; otherwise, t i = 1 , and n is the total number of tests. | e V | ¯ of the combinational model is defined as:
| e V | ¯ = i = 1 n | e V ( i ) | n = i = 1 n | V e ( i ) V c ( i ) | n .
For the four simple fuzzy models, the definition of | e V | ¯ is similar.
As it is shown in Table 6, the four models have different P L and | e V | . The combinational model is the best model among the five models. The advantages of the combinational model lay in not only the P L and | e V | , but also in the robustness according to the ensemble learning theory. Considering the still relative low P L of the models with fixed parameters, we will optimize the adjustable parameters of the proposed models in next section to achieve better P L and | e V | .

4. Optimizing Parameters Based on a Meta-Heuristic Algorithm

From the results in the above section, we see that the combinational model is better than each of the composed model. However, four weights in the combinational model are evenly distributed and some parameters in the fuzzy models are determined by experiences: (1) The minimal accelerate rate, A m i n , is 0.5 m/s3; (2) if the acceleration rate is less than A m i n , then the riding comfort value is 1; (3) The maximal acceleration rate, A m a x , is 3 m/s3, and (4) if the acceleration rate is greater than A m a x , then the riding comfort value is 0.
As these parameters are set based on experiences, the models using them cannot achieve the best performance. In this section, we will optimize six parameters (two parameters in four regular fuzzy set models and four weight coefficients of the combinational model) by using the obtained experimental riding comfort data in Yizhuang Line to measure the riding comfort more accurately.

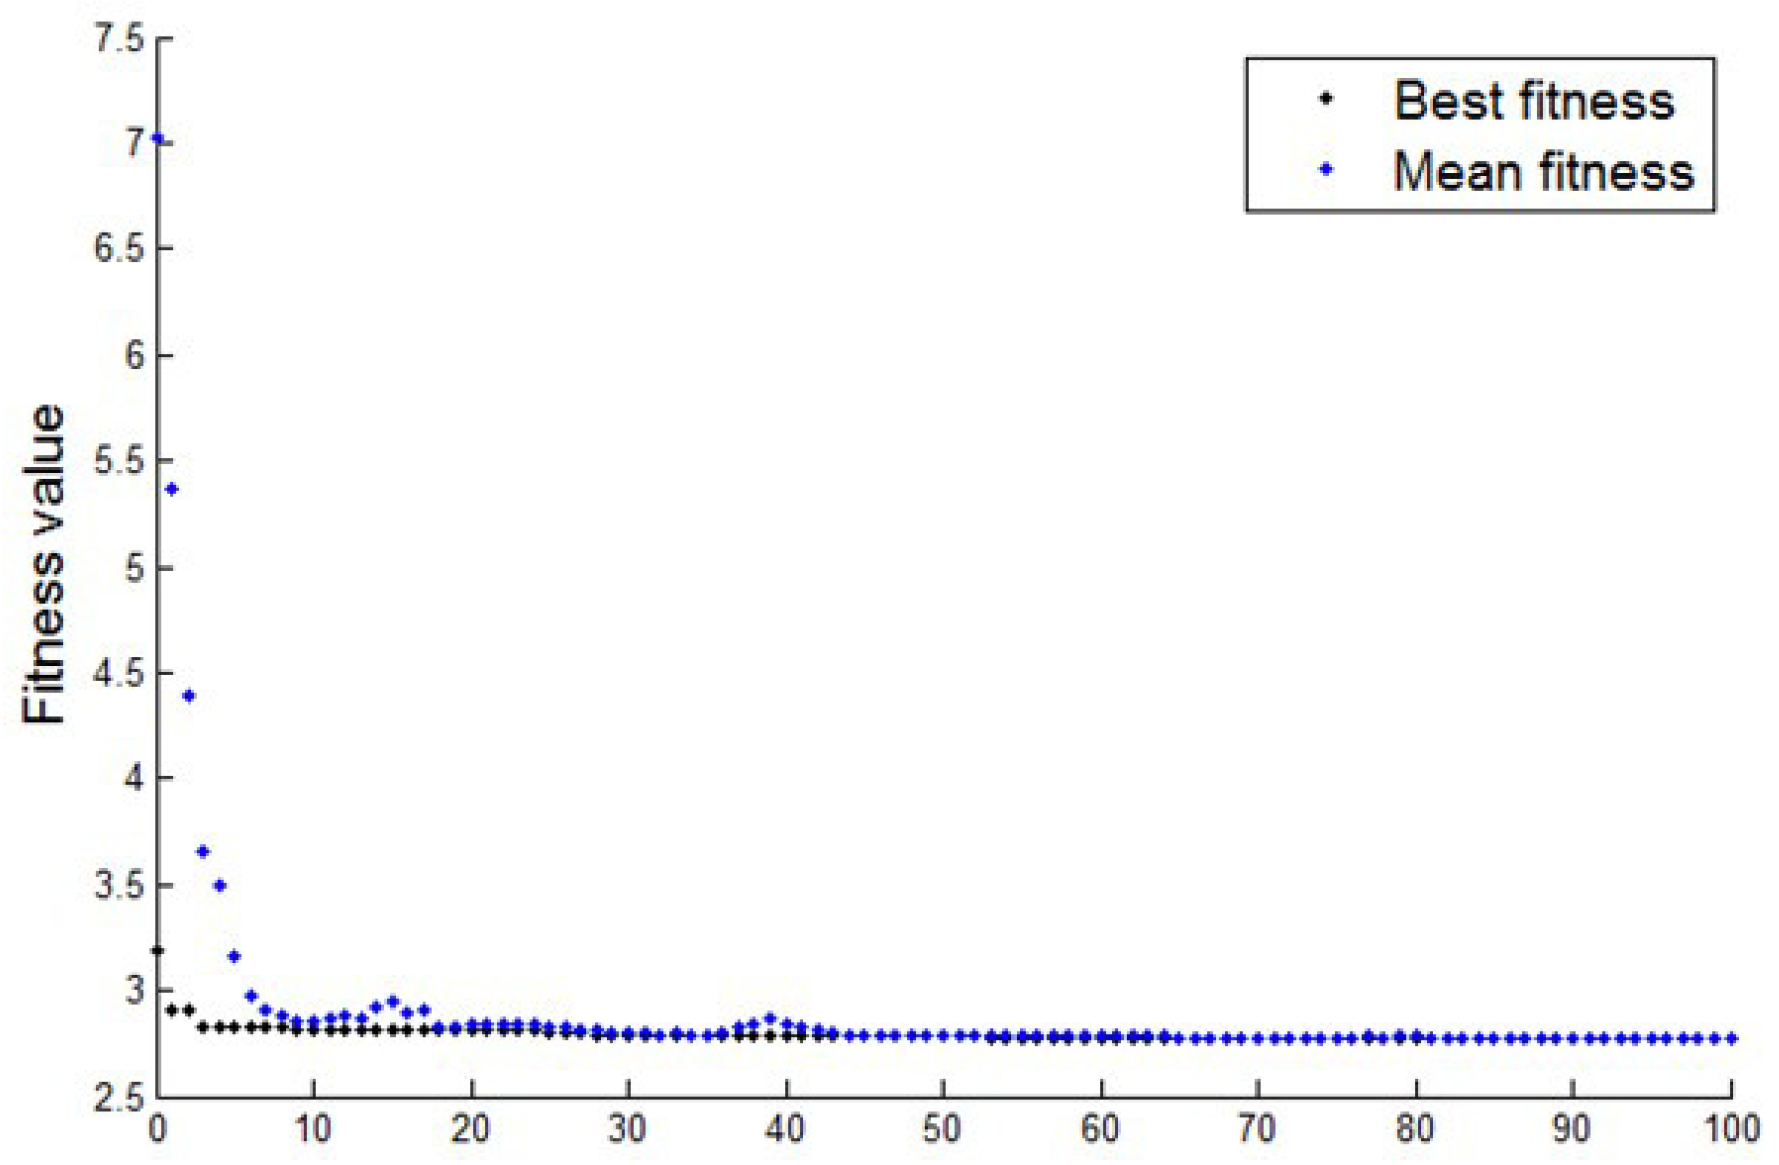
4.1. Genetic Algorithm and Fitness Function for Riding Comfort

Genetic algorithm (GA) [30,31,32] is a global search technique used to find exact or approximate solutions to optimization and search problems that was first presented by J. Holland inspired by biological evolutionism in 1975. GA has been applied successfully to engineering problems in many fields such as automated design, control engineering, neural networks, expert systems, scheduling applications, and many others [33,34]. Genetic algorithm is a parallel random adaptive algorithm that is based on “survival of the fittest”.
Genetic algorithm starts with an initial set of random candidate solutions called population and each individual in the population is called a chromosome [35]. In GA, variables of a problem are represented as genes in the chromosome, and the chromosomes are measured according to their fitness values using some measurements of the profit or the utility that we want to optimize. The chromosomes evolve through successive iterations called generation. Two genetic operators, crossover and mutation, alter the composition of genes to create new chromosomes called offspring. The selection operator is an artificial version of natural selection, a Darwinian survival of the fittest among populations. During each generation, the fitness of chromosomes is measured by a function called fitness function, and chromosomes with better fitness values have higher probabilities of being selected to the next generation. After several generations, GA can converge to the best solution.
As we are trying to optimize the parameters in the combinational model to make its output as close to the output of field experiments as possible, the fitness function to be optimized is defined as follows:
F i t = m i n ( i = 1 m | V c ( i ) V e ( i ) | ) = m i n ( i = 1 m | ( w t r i V t r i ( i , A m a x ) + w b e l V b e l ( i , A m i n , A m a x ) + w g a u V g a u ( i , A m a x ) + w t r a V t r a ( i , A m i n , A m a x ) ) V e | ) ,
where m is the number of the training data set, V c is the riding comfort value by the combinational model and V e is the riding comfort value from experiments. Specifically, using absolute error to measure the fitness will bring better solution than the squared error which will increase a lot in big errors.

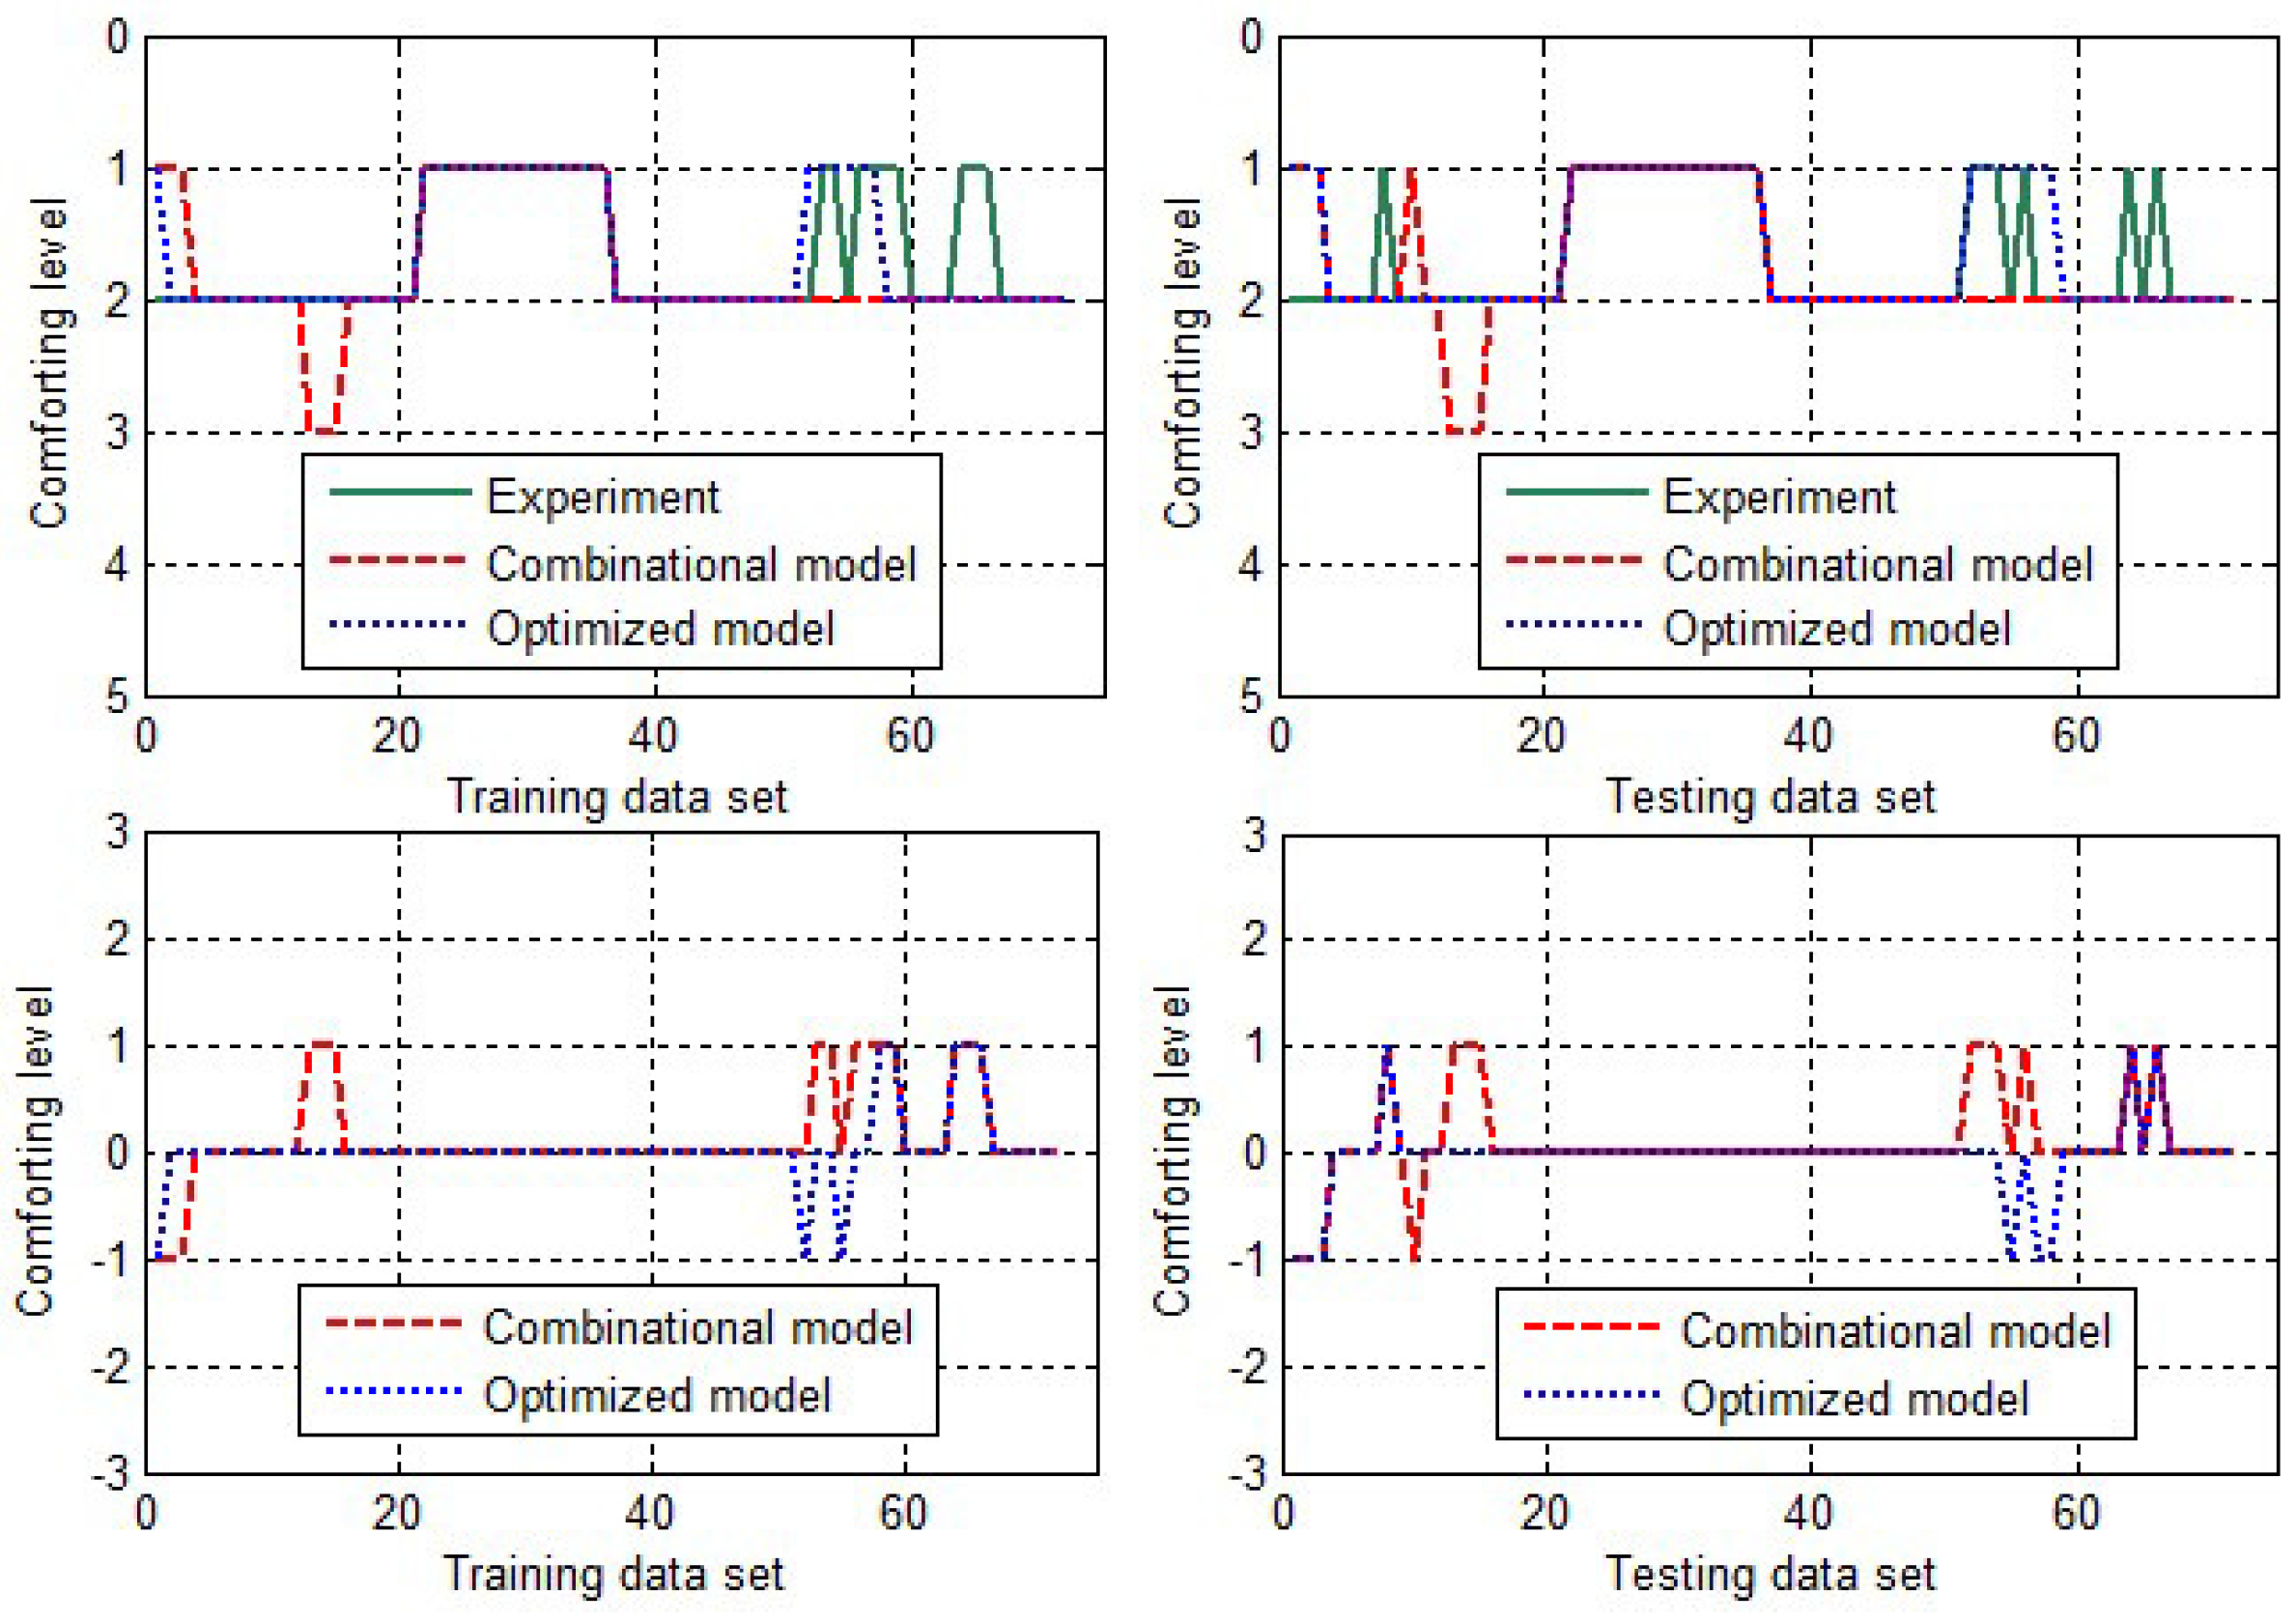
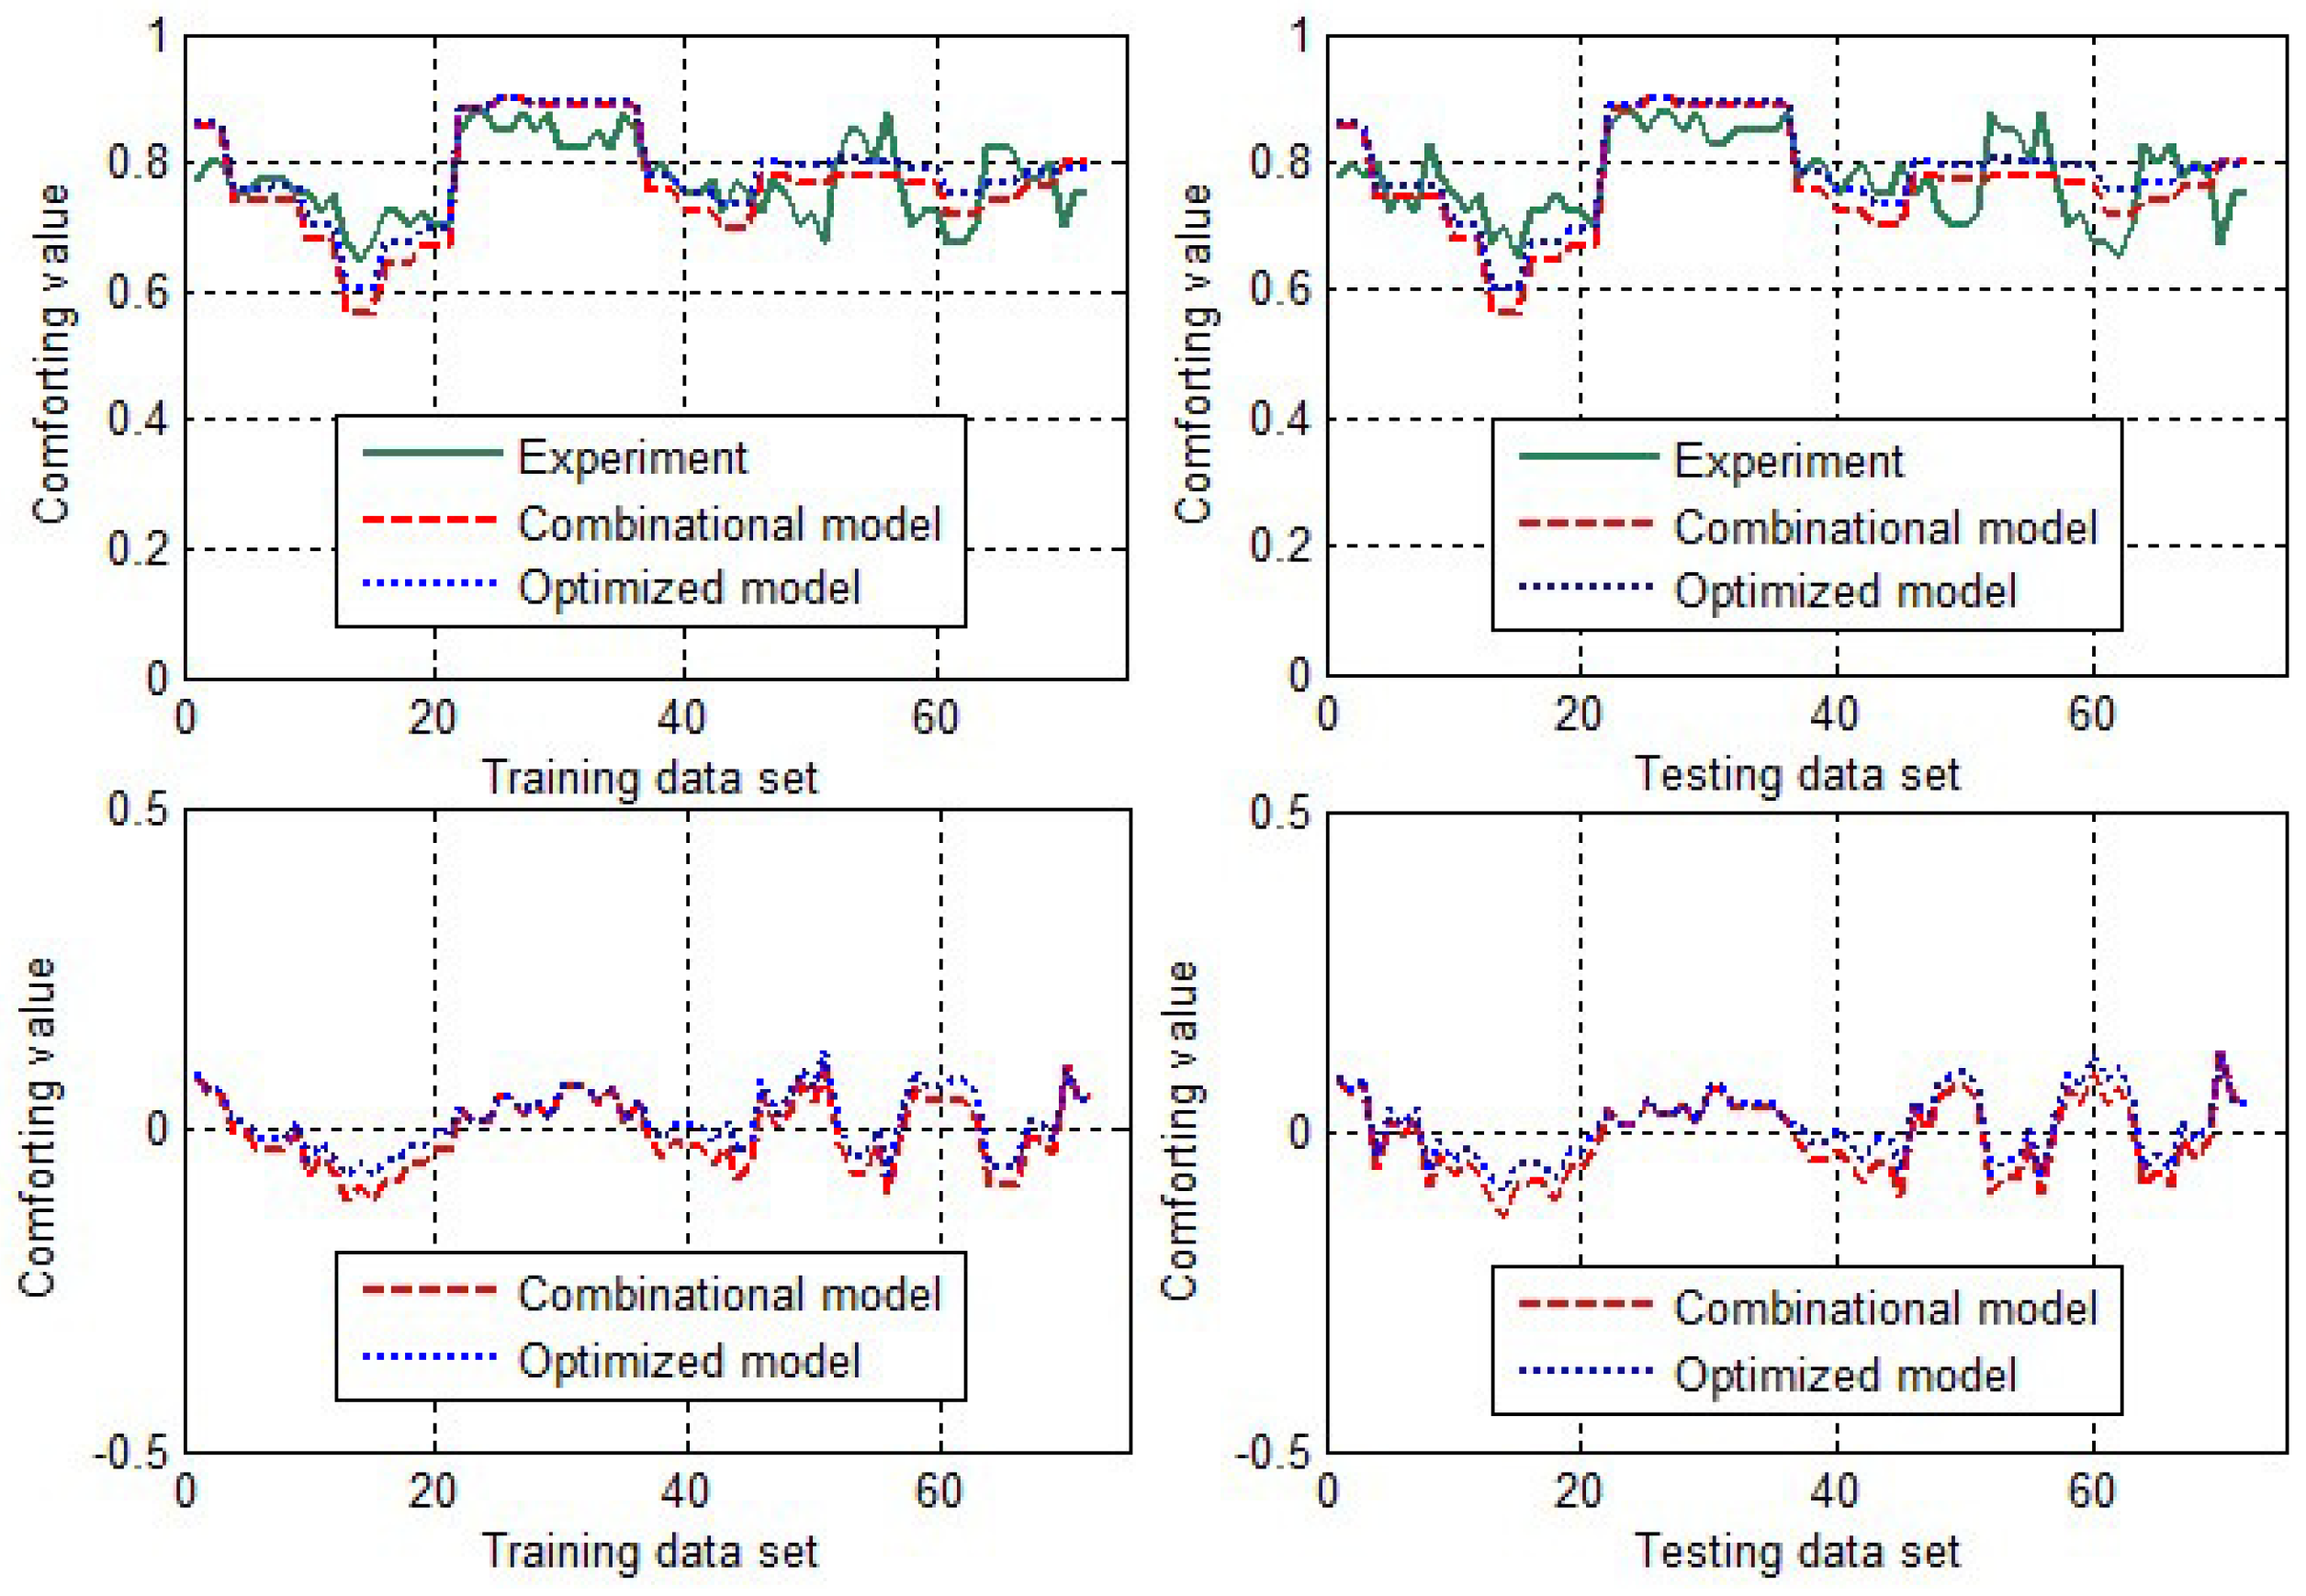
4.2. Optimization Results

In this paper, the parameters of GA are set as follows: Population size (n) = 100, Generation number (k) = 100, Probability of crossover (pc) = 0.8, Probability of mutation (pm) = 0.05. The sum of all the weight coefficients is limited to be 1. The search ranges of the minimal acceleration rate and the maximum acceleration rate are set from 50% to 150% of the experiential value determined by experts.
After optimizing the fitness function by GA for 10 times, the six parameters fluctuate within a little range and the optimization errors show little difference every time. The convergence of fitness function in the optimization process is shown in Figure 9. Then, the best optimization parameters in 10 times are listed in Table 7.
Now we use the parameters of the best optimization result instead of the default parameters, where parameters are w t r i = 0 . 331 , w g a u = 0 . 229 , w b e l = 0 . 253 , w t r a = 0 . 187 , A m i n = 0 . 263 , A m a x = 4 . 108 to calculate the riding comfort levels. We call the model with optimized parameters as the optimized model. From the four optimized weighted coefficients, the first model and the third model are more important than the second and the fourth one. The four fuzzy set models before and after optimizations are shown in Figure 10, where apparent changes after optimization can be identified.
From the optimized two key parameters in fuzzy models, we can find that A m i n is dwindled and A m a x is expanded. It means that human’s feeling in small accelerate rate is more sensitive than that in large acceleration rate. The maximal acceleration by experience is not accurate and bigger acceleration is possible in train control systems even though this situation does not happen in the training data set.
Here we use 7 performance indexes P L , e L ¯ , | e L | ¯ σ L and e V ¯ , | e V | ¯ , σ V to describe the comfort level and value respectively. P L and | e V | ¯ use the same definition in Table 6. e L ¯ is the mean error of level, | e L | ¯ is the mean absolute error of level, σ L is the mean square error of level, e V ¯ is the mean error of value, and σ V is the mean square error of value.
e L ¯ = i = 1 n e L ( i ) n = i = 1 n ( L e ( i ) L c ( i ) ) n
| e L | ¯ = i = 1 n | e L ( i ) | n = i = 1 n | L e ( i ) L c ( i ) | n
σ L = 1 n i = 1 n ( e L ( i ) e L ¯ ) 2
e V ¯ = i = 1 n e V ( i ) n = i = 1 n ( V e ( i ) V c ( i ) ) n
σ V = 1 n i = 1 n ( e V ( i ) e V ¯ ) 2 ,
where n is the number of data, L e is the comfort level by experimenters, L c is the comfort level by the combined model. V e is the comfort value obtained from experimenters and V c is the comfort value computed by the combined model. If the combined model is changed into the optimized model in the above equations, we use L o and V o instead of L c and V c .
In Figure 11 and Table 8, the comfort level of the optimized model in training data set has improved a lot compared with the combinational model. The main performance index P L changes from 77.8% to 88.8% and increases by 14.1%. We also use the testing set to test the generalization capability of the optimized model. And the P L of testing data set changes from 79.2% to 87.5% and increases by 10.4%. The other parameters are also improved a lot. The improvement in training data set is a little better than that in testing data set.
In Figure 12 and Table 9, we can see that the comforting value of the optimized model in training data set has been improved a lot compared with the combinational model. As the parameters e ¯ L and e ¯ V reflect the unbiasedness of a model and the parameters σ L and σ V reflect the fluctuation of a model, the unbiasedness and fluctuation of optimized model have been improved.
Although the improvement in testing data set is a little worse than that in training data set, the comfort measurement of the optimized model in testing data set has also been improved according to both comfort levels and comfort values. From all the analysis above, it is safe to conclude that the optimized model has a very good applicability in evaluating riding comfort from acceleration rate data both in levels and in values. The optimized model is the linear combination of the four regular fuzzy models, whose parameters are optimized by GA. The optimized model over field collected data is illustrated in Figure 13, which reflects our complex cognition on the riding comfort in taking railway for travel.

5. Conclusions

Riding comfort is attracting more attention from industry and academia as the passengers focus more and more on the service quality of railways. Although there are many factors which can affect the riding comfort, acceleration rate data is one of the most important ones and the most easily controllable one for the train control systems. This paper uses the acceleration rate data from on-board accelerometer to measure the riding comfort level and riding comfort value. By using the fuzzy set theory, four comfort measurement models are developed and the parameters of membership functions are determined by the domain experience and the distribution of collected field data in Beijing subway Yizhuang line. Furthermore, we deduced two key parameters A m a x and A m i n , which can represent all the parameters in the four fuzzy models. Then, a combinational model, which is a linear combination of the four regular fuzzy set models, is proposed as a more comprehensive measurement for the riding comfort. Finally, by using the surveyed riding comfort data, an integrated model is obtained by optimizing the parameters in the combinational model via genetic algorithm.
The results show that the four regular fuzzy set models can describe riding comfort in a certain degree. But the combinational model is better than any of the single regular model. Furthermore, GA can effectively optimize the parameters of the combinational model to achieve the best performance. In one word, the proposed models and the optimization method can be used to measure the riding comfort better. Based on outputs of this paper, more complex models and optimization techniques are worth to be further investigated to achieve better performance in riding comfort measurement. Currently, the proposed riding comfort calculation models have been employed as one of the performance indexes in the design of train control systems in Beijing subway.
Currently, improving the quality of service has become a key objective in the management and control of urban rail systems [36,37]. In this paper, we only address one aspect of service quality in urban rail transit systems, that is, the riding comfort of passengers. Nevertheless, some other issues with respect to the service quality of passengers still deserve further investigations. For example, it is well-known that unexpected disruptions could delay the trains and thus impose negative effects on service quality of passengers. However, there is few research that answer “how much do these disruptions affect service quality from the passengers’ perspective?" Second, a lot of researchers recently have began to address the quality of service from the level of multi-modal transportation systems and delivers the passengers with seamless and convenient trips [37]. Thus, our further research will also focus on the quantitive evaluation of service quality through the whole trip of passengers.

Author Contributions

H.M. conducted formal analysis, visualization and wiring of original draft. D.C. conducted Validation, Visualization and Writing–review & editing. J.Y. conducted conceptualization, methodology and Writing–review & editing. All authors have read and agree to the published version of the manuscript.

Funding

This research was supported by the National Natural Science Foundation of China (Nos. 61976055, 71901016, 61790570, 61790573), the Beijing Natural Science Foundation (Nos. L191015), by the China Postdoctoral Science Foundation Funded Project (2019M650474) and by China Railway Research Program Foundation(Nos. J2019G009).

Conflicts of Interest

The authors declare no conflict of interest.

References

  1. Ohnmacht, T.; Scherer, M. More Comfort, Shorter Travel Time, or Low Fares? Comparing Rail Transit Preferences of Commuters, Holiday and Leisure Travelers, Business Travelers, and Shoppers in Switzerland. Transp. Res. Rec. Transp. Res. Board Oct. 2010, 2143, 100–107. [Google Scholar] [CrossRef]
  2. Ren, W.-X.; Zong, Z.-H. Output-only Experimental model parameter identification of civil engineering structures. Int. J. Struct. Eng. Mech. 2004, 17, 429–444. [Google Scholar] [CrossRef] [Green Version]
  3. Suzuki, H. Recent Research and Developments in the Field of Riding Comfort Evaluation; Quarterly Reports; Railway Technical Research Institute: Tokyo, Japan, 1996; Volume 37, pp. 4–8. [Google Scholar]
  4. Suzuki, H. Research trends on riding comfort evaluation in Japan. Proc. Inst. Mech. Eng. Part F J. Rail Rapid Trans. 1998, 212, 61–72. [Google Scholar] [CrossRef]
  5. Suzuki, H. Effects of the range and frequency of vibrations on the momentary riding comfort evaluation of a railway vehicle. Jpn. Psychol. Res. 1998, 40, 156–165. [Google Scholar] [CrossRef]
  6. Inagaki, H.; Taguchi, T.; Yasuda, E.; Iizuka, Y. Evaluation of riding comfort: From the viewpoint of interaction of human body and seat for static, dynamic and long time driving. SAE Trans. 2000, 960–964. [Google Scholar]
  7. Burnfield, J.M.; Shu, Y. Impact of Elliptical Trainer Ergonomic Modifications on Perceptions of Safety, Comfort, Workout, and Usability for People With Physical Disabilities and Chronic Conditions. Phys. Ther. 2011, 91, 1604–1608. [Google Scholar] [CrossRef] [Green Version]
  8. Iwnicki, S. Handbook of Railway Vehicle Dynamics; CRC: Boca Raton, FL, USA, 2006. [Google Scholar]
  9. Song, Y.; Liu, Z.; Rxnnquist, A.; Navik, P.; Liu, Z. Contact Wire Irregularity Stochastics and Effect on High-speed Railway Pantograph-Catenary Interactions. IEEE Trans. Instrum. Meas. 2020, in press. [Google Scholar] [CrossRef]
  10. Kaewunruen, S.; Martin, V. Life cycle assessment of railway ground-borne noise and vibration mitigation methods using geosynthetics, metamaterials and ground improvement. Sustainability 2018, 10, 3753. [Google Scholar] [CrossRef] [Green Version]
  11. Wang, Z.; Song, Y.; Yin, Z.; Wang, R.; Zhang, W. Random response analysis of axle-box bearing of a high-speed train excited by crosswinds and track irregularities. IEEE Trans. Veh. Technol. 2019, 68, 10607–10617. [Google Scholar] [CrossRef] [Green Version]
  12. Yin, J.T.; Su, S.; Xun, J.; Tang, T.; Liu, R. Data-driven approaches for modeling train control models: Comparison and case studies. ISA Trans. 2020, 98, 349–363. [Google Scholar] [CrossRef]
  13. Smith, C.C.; McGehee, D.Y.; Healey, A.J. The prediction of passenger riding comfort from acceleration data. J. Dyn. Syst. Meas. Control 1978, 100, 34–41. [Google Scholar] [CrossRef] [Green Version]
  14. Linz, S.J. Nonlinear dynamical models and jerky motion. Am. J. Phys. 1997, 65, 523–526. [Google Scholar] [CrossRef]
  15. Yin, J.T.; Chen, D.W.; Li, L. Intelligent train operation algorithms for subway by expert system and reinforcement learning. IEEE Trans. Intell. Transp. Syst. 2014, 15, 2561–2571. [Google Scholar] [CrossRef]
  16. Yin, J.T.; Tang, T.; Yang, L.; Xun, J.; Huang, Y.; Gao, Z. Research and development of automatic train operation for railway transportation systems: A survey. Transp. Res. Part C Emerg. Technol. 2017, 85, 548–572. [Google Scholar] [CrossRef]
  17. Chang, C.S.; Sim, S.S. Optimising train movements through coast control using genetic algorithms. IEE Proc. Electr. Power Appl. 1997, 144, 65–73. [Google Scholar] [CrossRef]
  18. Zadeh, L.A. Outline of a New Approach to the Analysis of Complex Systems and Decision Processes. IEEE Trans. Syst. Man Cybern. 1973, 3, 28–44. [Google Scholar] [CrossRef] [Green Version]
  19. Gray, A.W.; Daniels, A.S.; Singer, D.J. Impacts of Fuzzy Logic Modeling for Constraints Opimization. Nav. Eng. J. 2011, 112, 121–132. [Google Scholar]
  20. Ancker, J.S.; Kern, L.M.; Abramson, E. The Triangle Model for evaluating the effect of health information technology on healthcare quality and safety. J. Am. Med. Inform. Assoc. 2012, 19, 61–65. [Google Scholar] [CrossRef] [Green Version]
  21. Long, D.; Singh, V.P.; Scanlon, B.R. Deriving theoretical boundaries to address scale dependencies of triangle models for evapotranspiration estimation. J. Geophys. Res. Atmos. 2012, 117, 1–17. [Google Scholar] [CrossRef]
  22. Darias, J.R.; Sanchez, I.; Gutierrez, G. Experimental study on the vertical motion of grains in a vibrated U-tube. Granul. Matter 2011, 113, 13–17. [Google Scholar] [CrossRef]
  23. Patil, S.D.; Takale, M.V. Relativistic self-focusing of cosh-Gaussian laser beams in a plasma. Opt. Laser Technol. 2012, 44, 314–317. [Google Scholar] [CrossRef]
  24. Birg, L.; Massart, P. Gaussian model selection. J. Eur. Math. Soc. 2001, 3, 203–268. [Google Scholar] [CrossRef] [Green Version]
  25. Kiriakidis, K. On the Expansion of Nonlinear Models Using Bell-Shaped Basis Functions; ASME: New York, NY, USA, 2003. [Google Scholar]
  26. Santika, T.; Hutchinson, M.F. The effect of species response form on species distribution model prediction and inference. Ecol. Model. 2009, 220, 2365–2379. [Google Scholar] [CrossRef]
  27. Cheng, M.; Zhang, B.; Wang, G. Optimal policy for deteriorating items with trapezoidal type demand and partial backlogging. Appl. Math. Model. 2011, 35, 3552–3560. [Google Scholar] [CrossRef]
  28. Chung, K.J. The correct process of arguments of the solution procedure on the inventory model for deteriorating items with trapezoidal type demand rate in supply chain management. Appl. Math. Lett. 2012, 25, 1901–1905. [Google Scholar] [CrossRef] [Green Version]
  29. Dietterich, T.G. Machine Learning Research: Four Current Directions. AI Mag. 1997, 18, 97–136. [Google Scholar]
  30. Goldberg, D.E.; Holland, J.H. Genetic algorithms and machine learning. Mach. Learn. 1988, 3, 95–99. [Google Scholar] [CrossRef]
  31. Holland, J.H. Genetic algorithms. Sci. Am. 1992, 267, 66–72. [Google Scholar] [CrossRef]
  32. Booker, L.B.; Goldberg, D.E.; Holland, J.H. Classifier systems and genetic algorithms. Artif. Intell. 1989, 40, 235–282. [Google Scholar] [CrossRef]
  33. Joachim, S. Parallel Genetic Algorithms: Theory and Applications; IOS Press: Amsterdam, The Netherlands, 1993. [Google Scholar]
  34. Man, K.F.; Tang, K.S.; Kwong, S. Genetic Algorithms: Concepts and Designs; Springer: London, UK, 1999. [Google Scholar]
  35. Huang, Y.; Yu, H.; Yin, J.; Hu, H.; Bai, S.; Meng, X.; Wang, M. An integrated approach for the energy-efficient driving strategy optimization of multiple trains by considering regenerative braking. Comput. Ind. Eng. 2018, 126, 399–409. [Google Scholar] [CrossRef]
  36. Lyons, G.; Hammond, P.; Mackay, K. Reprint of: The importance of user perspective in the evolution of MaaS. Transp. Res. Part A 2020, 131, 20–34. [Google Scholar] [CrossRef]
  37. Huang, Y.R.; Mannino, C.; Yang, L.; Tang, T. Coupling time-indexed and big- M formulations for real-time train scheduling during metro service disruptions. Transp. Res. Part B 2020, 133, 38–61. [Google Scholar] [CrossRef]
Figure 1. Standing passengers in congested subway trains.
Sustainability 12 04541 g001
Figure 2. Triangle comfort model.
Sustainability 12 04541 g002
Figure 3. Gaussian comfort model.
Sustainability 12 04541 g003
Figure 4. Bell-shaped comfort model.
Sustainability 12 04541 g004
Figure 5. Trapezoid comfort model.
Sustainability 12 04541 g005
Figure 6. The run route map of Subway Yizhuang Line.
Sustainability 12 04541 g006
Figure 7. Acceleration rate.
Sustainability 12 04541 g007
Figure 8. Riding comfort values of four cases.
Sustainability 12 04541 g008
Figure 9. Evolution of generations for optimization.
Sustainability 12 04541 g009
Figure 10. Comfort model diagrams of experience and GA.
Sustainability 12 04541 g010
Figure 11. The comforting level of combinational model and optimized model.
Sustainability 12 04541 g011
Figure 12. The comforting value of combinational model and optimized model.
Sustainability 12 04541 g012
Figure 13. Optimized model for computing riding comfort.
Sustainability 12 04541 g013
Table 1. Relationship between Riding Comfort Value and riding comfort Level.
Value>0.80.6–0.80.4–0.60.2–0.4<0.2
Level12345
Comfort
description
Very
comfortable
Quite
comfortable
Slightly
uncomfortable
Less
comfortable
Very
uncomfortable
Table 2. The riding comfort value and its level of the four blocks by the four fuzzy models.
BlockU5U12D10D3
VTriangular0.5470.8360.7450.77
Gaussian0.5350.8450.7130.75
Bell-shaped0.5680.9310.6510.702
Trapezoidal0.6090.9410.8060.833
Average0.5650.8880.7460.779
Comfort Level3122
Table 3. The statistics of training data set.
BlockU5U12D10D3
TimeMorAftEveMorAftEveMorAftEveMorAftEve
L e 1 (1)
2 (5)
3 (2)
2 (6)
3 (2)
2 (7)
3 (1)
1 (6)
2 (1)
3 (1)
1 (7)
2 (1)
1 (6)
2 (2)
1 (2)
2 (5)
3 (1)
1 (3)
2 (5)
1 (3)
2 (4)
3 (1)
1 (5)
2 (3)
1 (4)
2 (4)
1 (5)
2 (3)
V e 0.6750.650.6750.8250.8750.850.750.750.80.8250.80.825
Table 4. Comparisons of four models on the training data set.
BlockU5U12D10D3
TimeMorAftEveMorAftEveMorAftEveMorAftEve
LExperiment222111222121
Triangle333111222222
Gaussian333111222222
Bell-shaped333111222222
Trapezoid222111111111
| e V | Triangle0.1280.1030.1280.0110.0390.0140.0050.0050.0550.0480.0230.048
Gaussian0.1410.1160.1410.020.030.0050.0370.0370.0870.0750.050.075
Bell-shaped0.1070.0820.1070.1060.0560.0810.0990.0990.1490.1230.0980.123
Trapezoid0.0660.0410.0660.1160.0660.0910.0560.0560.0060.0080.0330.008
Table 5. Comparisons between the combinational model and experiments.
BlockU5U12D10D3
TimeMorAftEveMorAftEveMorAftEveMorAftEve
LExperiment222111222121
Combination333111222222
| e V | 0.110.0850.110.0630.0130.0380.0040.0040.0540.0460.0210.046
Table 6. The P L and | e V | ¯ of models.
Training SetTesting Set
P L | e V | ¯ P L | e V | ¯
Triangle76.4%0.053579.2%0.0553
Gaussian76.4%0.062675%0.0659
Bell-shaped77.8%0.059873.6%0.0633
Trapezoid72.5%0.068675.3%0.0619
Combination78.2%0.051579.8%0.0527
Table 7. Optimization results based on genetic algorithm (GA).
w tri w gau w bel w tra A min A max Error
Experience0.250.250.250.250.533.708
GA0.3310.2290.2530.1870.2634.1082.778
Table 8. The P L , e ¯ L , | e L | ¯ and σ L of comforting level in combinational model and optimized model.
Training SetTesting Set
P L e ¯ L | e L | ¯ σ L P L e ¯ L | e L | ¯ σ L
Combination77.8%0.1250.20830.439079.2%0.08330.19440.4330
Optimization88.8%0.04780.11110.332287.5%-0.040.1250.3511
Improvement14.1%61.8%46.7%24.4%10.4%51.9%35.7%18.9%
Table 9. The e ¯ V , | e V | ¯ and σ V of comforting value in combinational model and optimized model.
Training SetTesting Set
e ¯ V | e V | ¯ σ V e ¯ V | e V | ¯ σ V
Combination−0.0860.05150.0546−0.00940.05270.0603
Optimization0.0790.04060.04720.00910.04470.0530
Improvement8.1%21.2%13.6%3.2%15.2%12.2%

