Article

Effect of U-Turns and Heavy Vehicles on the Saturation Flow Rates of Left-Turn Lanes at Signalized Intersections

Qatar Transportation and Traffic Safety Center, College of Engineering, Qatar University, Doha 2713, Qatar
*
Author to whom correspondence should be addressed.
Sustainability 2020, 12(11), 4485; https://doi.org/10.3390/su12114485
Submission received: 23 February 2020 / Revised: 15 April 2020 / Accepted: 15 April 2020 / Published: 1 June 2020
(This article belongs to the Special Issue Road Traffic Engineering and Sustainable Transportation)

Abstract

:
The Saturation Flow Rate (SFR) is a primary measure that can be used when estimating intersection capacity. Further, the efficiency of signal control parameters also depends on the accuracy of assumed SFR values. Driver behavior, type of movement, vehicle type, intersection layout, and other factors may have a significant impact on the saturation flow rate. Thus, it is expected that driving environments that have heterogeneous driver populations with different driving habits and cultures may have different SFRs. In practice, the proposed SFRs based on US standards (Highway Capacity Manual, 2016) have been adopted in the State of Qatar without validation or calibration to consider the local road environment and the characteristics of the driving population. This study aims to empirically analyze the saturation flow rates for exclusive left-turn lanes and shared left- and U-turn lanes at two signalized intersections in Doha city, while considering the effects of heavy vehicles and U-turn maneuvers. Empirical observations revealed that the average base SFR, i.e., when the influences from heavy vehicles and U-turns were excluded, could vary approximately from 1800 vehicles per hour per lane (vphpl) to 2100 vphpl for exclusive left-turning lanes and approximately from 1800 vphpl to 1900 vphpl for shared left- and U-turning lanes. Furthermore, this study proposed different adjustment factors for heavy vehicle and U-turn percentages which can be applied in practice in designing signalized intersections, particularly in the State of Qatar.

1. Introduction

Traffic signals are one of the most effective ways of controlling traffic streams at intersections. They play an important role in eliminating many conflicts inside the intersection caused by different traffic streams moving in different directions. Among several factors, vehicular traffic, pedestrian volumes, and crash experiences are the dominant factors that warrant the use of signal control at intersections. One of the primary tasks for the traffic engineers, while defining the control settings of signalized intersections, is to accurately estimate their capacity, which is defined as maximum number of vehicles that can pass through the intersection under certain road conditions. For signalized intersections, this can be computed by determining the Saturation Flow Rate (SFR), effective green interval, and cycle length. The SFR is defined as the maximum number of vehicles in a single lane that can pass the intersection during one hour of green signal indication when reasonably dense traffic conditions prevail. In other words, it is estimated as the number of vehicles per lane that would pass through the intersection during this one hour of green signal indication when the lost time is zero. SFR is affected by many factors, especially vehicle movement (through, right-turn, or left-turn), vehicle composition (% of heavy vehicles), intersection layout (mainly for turning lanes), and driver behavior, which is characterized by social and cultural norms.
In general, the SFR can be measured by estimating the average headway between the departing vehicles at the stop line. In practice, many engineers prefer to use the procedure proposed in the Highway Capacity Manual (HCM) [1] to estimate the SFR where the base saturation flow rate ( s 0 ) is adjusted to take into account different factors such as heavy vehicles, approach grade, movement type (left- and right-turning), and other factors as shown in Equation (1);
s = s 0 f w f H V f g f p f b b f a f L U f L T f R T f L p b f R p b
where s is the adjusted saturation flow rate (vehicles per hour per lane or vphpl), s 0 is the base saturation flow rate (pc/h/ln), and f are adjustment factors (w for lane width, HV for heavy vehicles, g for approach grade, p for existing parking lane and parking activity adjacent to lane group, bb for the blocking effect caused by local buses that stop within intersection area, a for area type, LU for lane utilization, LT and RT for left-turning vehicle and right-turning vehicle presences, respectively, in a lane group, Lpb for pedestrian-bicycle presence in a left-turn group, and Rpb for a pedestrian-bicycle presence in the right-turn group).
The HCM [1] suggests 1900 vphpl as the base SFR. However, the proposed base SFR and the values for the modification factors are not always applicable and might not represent the prevailing traffic conditions in countries other than the USA. This can be particularly true for countries that have a driving population with diverse social and cultural backgrounds such as that in Arabian Gulf Countries including Saudi Arabia, Qatar, and the UAE. However, traffic engineers still in practice adopt constant HCM procedures, thereby neglecting potential differences which may compromise the efficiency of signal control. Underestimating SFR leads to longer calculated green times than are needed, and thus to longer cycle lengths and associated delays. Meanwhile, overestimating SFR results in insufficient green times that pushes the intersection to oversaturation. This highlights the need for empirical investigation of the SFRs in road environments such as that of the State of Qatar, which has a very heterogeneous driver population including people from more than 55 countries.
This study aims to estimate SFR for exclusive Left-Turn (LT) lanes and shared LT and U-turning lanes at intersections in the State of Qatar to provide practitioners with realistic SFR values to that can be applied in intersection design while considering the impacts of Heavy Vehicles (HV) and U-turning vehicles.
The rest of this paper is organized as follows: previous studies on SFR, particularly studies which examine the effect of turning vehicles on SFR, are discussed in the next section. Then the methods and data used in this study are discussed. This is followed by the results. Finally, conclusions and recommendations for further studies are presented.

2. Literature Review

Previous studies have emphasized the importance of evaluating SFRs under prevailing local conditions. Table 1 summarizes several empirical studies conducted in different locations. Table 1 clearly shows that SFRs can be considerably different from country to another. Furthermore, based on the few available studies, it can be understood that the SFR values in Middle-Eastern countries are significantly higher than the values in other countries. Thus, the SFR values provided in design guidelines, e.g., HCM, should be verified through appropriate field studies before using them in different countries and regions.
Apart from these studies, the influence of weather, intersection geometry, traffic conditions, lighting conditions, and other factors have been investigated and were found to be significant. Sun et al. [25] conducted a study at a four-leg signalized intersection located in Shanghai, China to investigate the effect of rainy weather on SFR and start-up lost times. They reported that SFR in rainy weather conditions can be 3%–7% less compared to when there is clear weather. Chodur et al. [26] studies the effect of rain, snow, and cloudy or foggy weather conditions on SFR. They stated that SFR under long duration and short duration rainy conditions can be 8.5%–12.3% and 3.6% less than during rain-free weather conditions, respectively. Further, they reported that SFR could be reduced by approximately 10% and by approximately 11.4% under snowy and cloudy or foggy weather conditions compared under fine weather (dry-surface) conditions.
Branston [27] concluded that the SFR for straight-through traffic can be reduced by approximately 6% in darkness compared to in daylight conditions. Shao et al. [28] investigated the effects of geometry of the road (number of lanes in each approach, turning radius, lane width, approach grade), effect of the environment (population of the city, parking conditions) and traffic data (type of vehicles, speed limit, volume of venerable road users) on SFR. They found that lane width and turn radius significantly affect the capacity of left-turning lanes. Sando and Moses [29] investigated the influence of intersection geometry on the operation of triple left-turn lanes. They reported that the downgrades and the angle of turn, especially when it is less than 90 degrees, contribute to high SFRs. They also reported that triple left-turn lanes located on one-way streets and on curved approaches contribute to low SFRs. Other studies found that downstream conditions could also influence the SFR at upstream intersections, particularly when the distances between intersections are small [30]. Furthermore, through an empirical study, Qin et al. [31] established that guidelines and pavement markings can improve the saturation flow rate at signalized intersections.
Effects of left- and right-turning vehicles have also been well studied mainly to develop or improve left- and right-turn adjustment factors ( f L T and f R T in Equation (2)). Lin [32] developed analytical models for f L T and verified them using microscopic simulation. In order to improve the theoretic framework for a left-turn adjustment factor for shared, permissive left-turn lane groups using the HCM model, Prassas and Roess [33] proposed a hybrid approach which is composed of a regression portion and an analytical portion. Based on a simulation based study, Wang and Benekohal [19] suggested that when there are one, two, or three lanes with oncoming traffic flows, the left-turn SFR is approximately 0.97, 0.96, or 0.95 of the otherwise saturated traffic flow levels, respectively.
These studies highlight that the SFR for traffic and the factors affecting it have been comprehensively studied. However, limited studies have been reported on exclusive left- or right-turn lanes or on U-turn lanes. Adams and Hummer [24] examined the effect of U-turns on SFR of left-turning traffic based on the data collected at four intersections with exclusive left turn lanes and protected signal phasing during peak hours. Regression models and statistical tests of their study indicated that SFRs were significantly lower when the U-turn proportion was more than 65%. Based on the analyses, they suggested U-turn modification factors for SFRs of left-turning lanes. Bester and Meyers [16] evaluated SFRs for right-turning traffic based on the data collected at several intersections in South Africa. The effect of the gradient, number of through lanes, and speed limit on SFRs has also been discussed. Tsao and Chu [34] presented U-turn adjustment factors for left-turning traffic based on field data. Carter et al. [35] evaluated safety and operational effects of U-turns for exclusive left turn lanes based on the headway data collected at 14 signalized intersections in the US. This study showed that for every 10% increase in the U-turn portion, there is a 1.8% reduction in the saturation flow rate. Liu et al. [22] developed a regression model to quantify the effect of U-turning vehicles in the left turning traffic stream based on the data they collected in the field. U-turning adjustment factors was also suggested based on the regression model they estimated in their study.
It can be noted that remarkably limited studies have been conducted in Arabic countries to examine their SFRs, particularly focusing on exclusive turning maneuvers, considering local conditions, and identifying influencing factors. Thus, this study addresses these gaps by empirically evaluating the effect of U-turns and heavy vehicles on the SFRs of exclusive left, shared LT, and U-turning lanes at signalized intersections in Doha, Qatar.

3. Methodology

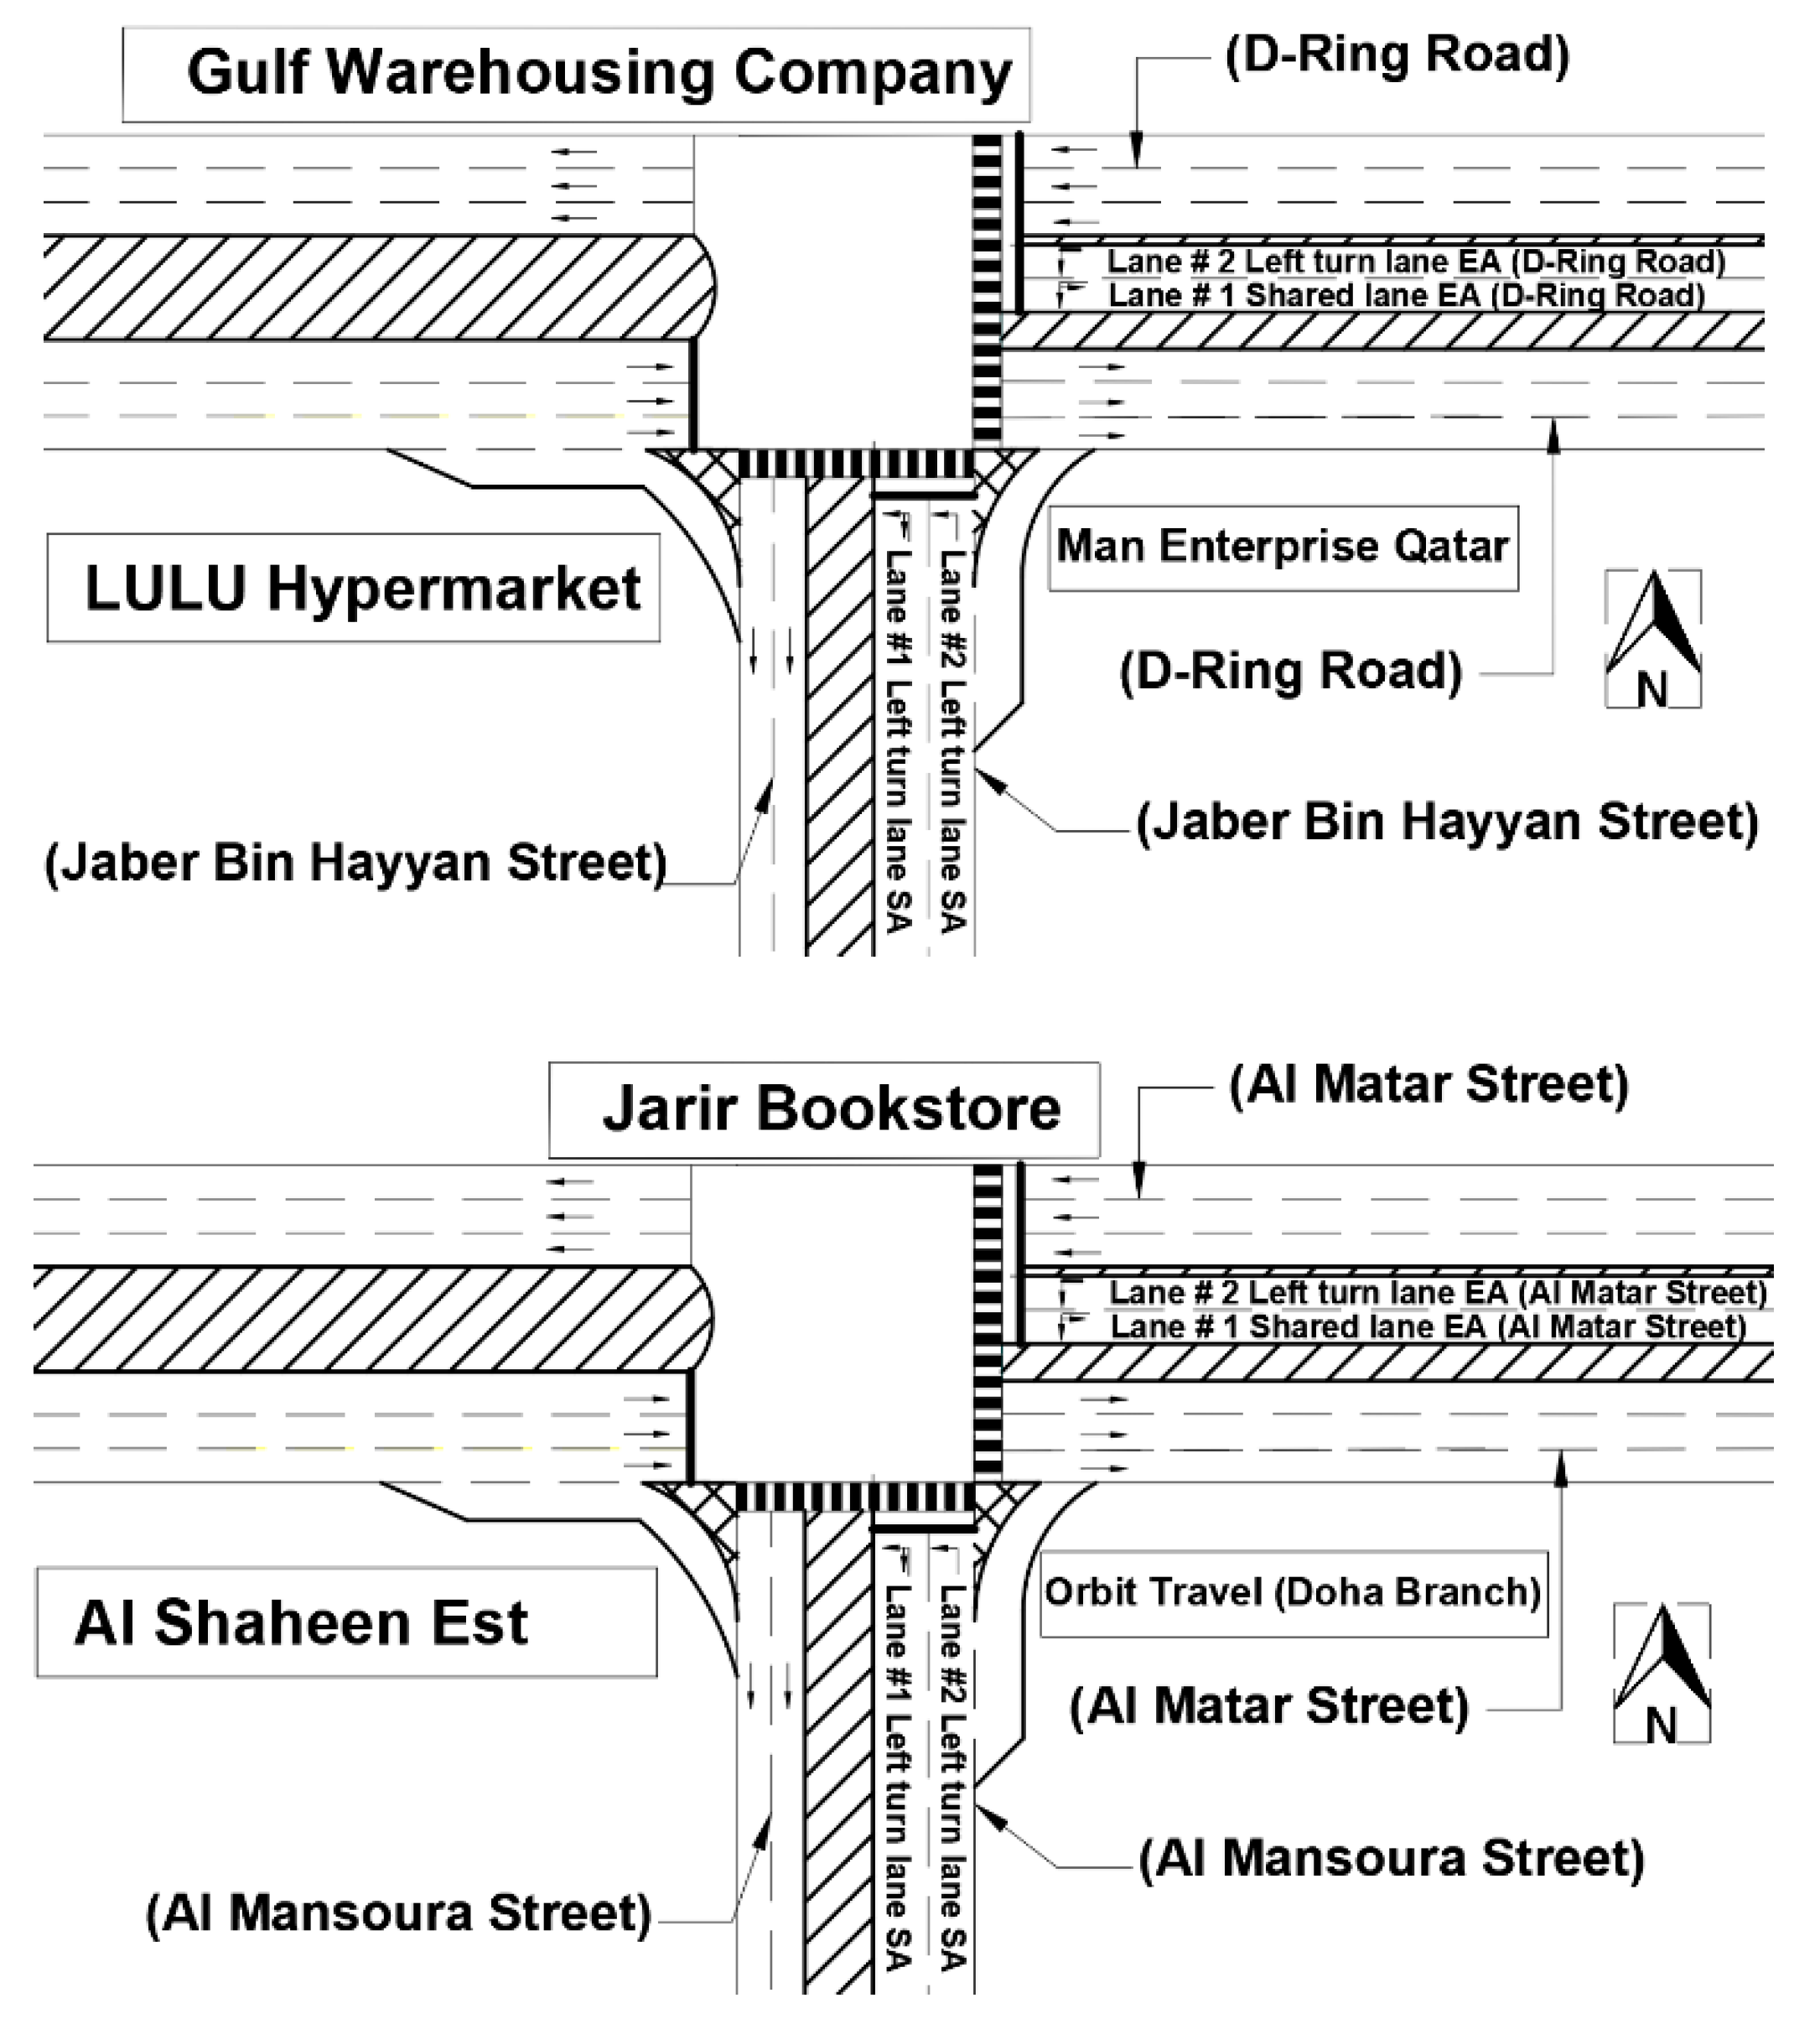
3.1. Description of Selected Sites

Two three-legged signalized intersections with similar types of geometry but located in different areas of Doha, Qatar were selected for video recording of vehicle movements. Figure 1 shows schematic layouts of the observation sites. Long queues were observed during peak hours at both intersections. Lulu Hypermarket Intersection (LHI) is located in a mixed land use environment with a big shopping market, private offices, commercial villas, and residences located nearby. Jaidah Square Intersection (JSI) has mainly commercial and office land nearby. LHI is located on the D ring road which is a busy road with a speed limit of 100 km/h, while JSI is located on a corridor with speed limit of 80 km/h. For both sites, the East and South approaches have two left-turning lanes. The inner lane is shared by left turning and U-turning vehicles (LUT), while the outer lane is exclusively used by left-turning vehicles. It is important to note that during the video survey, there was no disturbance from pedestrians, since the applied phasing plan has protected left-turning phases with a simultaneous red signal for pedestrians. Moreover, the weather conditions were clear and there was no on street parking or bus stops within 100 m from the stop lines for all approaches. The East Approach (EA) and South Approach (SA) were chosen from both sites for the extraction of headways. The geometric characteristics of each approach are provided in Table 2.

3.2. Data Collection and Extraction

For the video surveillance, high definition video cameras were mounted at high-rise buildings located close to these sites, which provided a complete view of the intersections. The cameras were positioned in a way that the signal display, queue lengths, and stop lines were clearly visible for all selected approaches. Data collection was conducted at LHI and JSI sites on 30 March 2017 and 26 April 2017, respectively. The video recording was conducted in the evening peak (from 16:00 to 18:00) at both sites. The headways between two consecutive vehicles were measured manually using Forevid software, which is an open source free software tool used for analyzing videos. The frame number at which the front vehicle of each vehicle crosses the stop line was recorded. A frame rate of 25 frames per second was used. It should be noted that the frames at which the front wheels of a vehicle crossed the stop line were captured manually and crosschecked by another co-author of the paper to ensure the accuracy of the dataset. If the frames were not captured accurately, then the process was repeated until the correct frames were captured. As the analysis is based on the data from captured frames and not on the actual times from the video footage, there are fewer chances of errors. The headway was obtained as the time difference between two consecutive vehicles crossing the stop line. Along with the crossing time data, the vehicle type, turn type, and whether the vehicle was in queue or not was also recorded for each vehicle. The analysis was carried out for each cycle for each lane separately. Initially, the following aspects were considered while extracting data:
  • The queue discharge time was measured from after the 4th vehicle passed the stop line until the last vehicle in the queue passed the stop line during the green light interval.
  • The number of heavy vehicles and their effect on other vehicle movements and time headway was taken into account.
  • Cycles containing a platoon of weaving vehicles were excluded.
  • Cycles in which vehicle platoons were impeded by pedestrians, cyclists, or motorcyclists were excluded.
  • Cycles with less than eight vehicles in the queue were excluded.
  • Cycles where the upstream queue affected the movement of the discharging vehicles were excluded.
The headways were recorded manually for each lane and for each cycle separately. After a collection of headways, the average saturation headway for each lane during each cycle was calculated as follows:
h i = T n i T 4 i n i 4
where h i is the is saturation headway for the ith cycle measured in s, T n i is the discharge time of the nth departed vehicle during ith cycle, T 4 i is the discharge time of the 4th vehicle that crossed the stop line during ith cycle, and n i is the number of vehicles observed during the ith cycle.
Finally, the observed SFR for each cycle was computed by using Equation (3). The average saturation flow rate (Equation (4)) was compared with the estimated adjusted SFR using the procedure proposed by HCM [1] using Equation (1). The observed SFR was also compared with the base SFR provided by HCM and observed values in different countries. A detailed investigation was carried out to observe the variations in the SFR due to variations in the proportion of heavy vehicles and U-turning vehicles.
S F R i = 3600 h i
S F R a v g = 1 N i N S F R i
where, N is the number of cycles per t hours of observation. SFRi and SFRavg were measured based on their vphpl.

4. Data Analysis and Results

The headway data were extracted from four approaches of the two sites with two lanes per approach, which meant that for a total of eight lanes, four lanes exclusively for LT vehicles while the other four lanes are shared between LT and U-turning vehicles. Headway of the following vehicle could be remarkably different based on the leading vehicle type, i.e., whether it is a heavy passenger vehicle, or based on the leading vehicle maneuver type, i.e., whether it made a U-turn or left turn. Headway distributions for these different possible movement types were compared as discussed in the following sub-section.

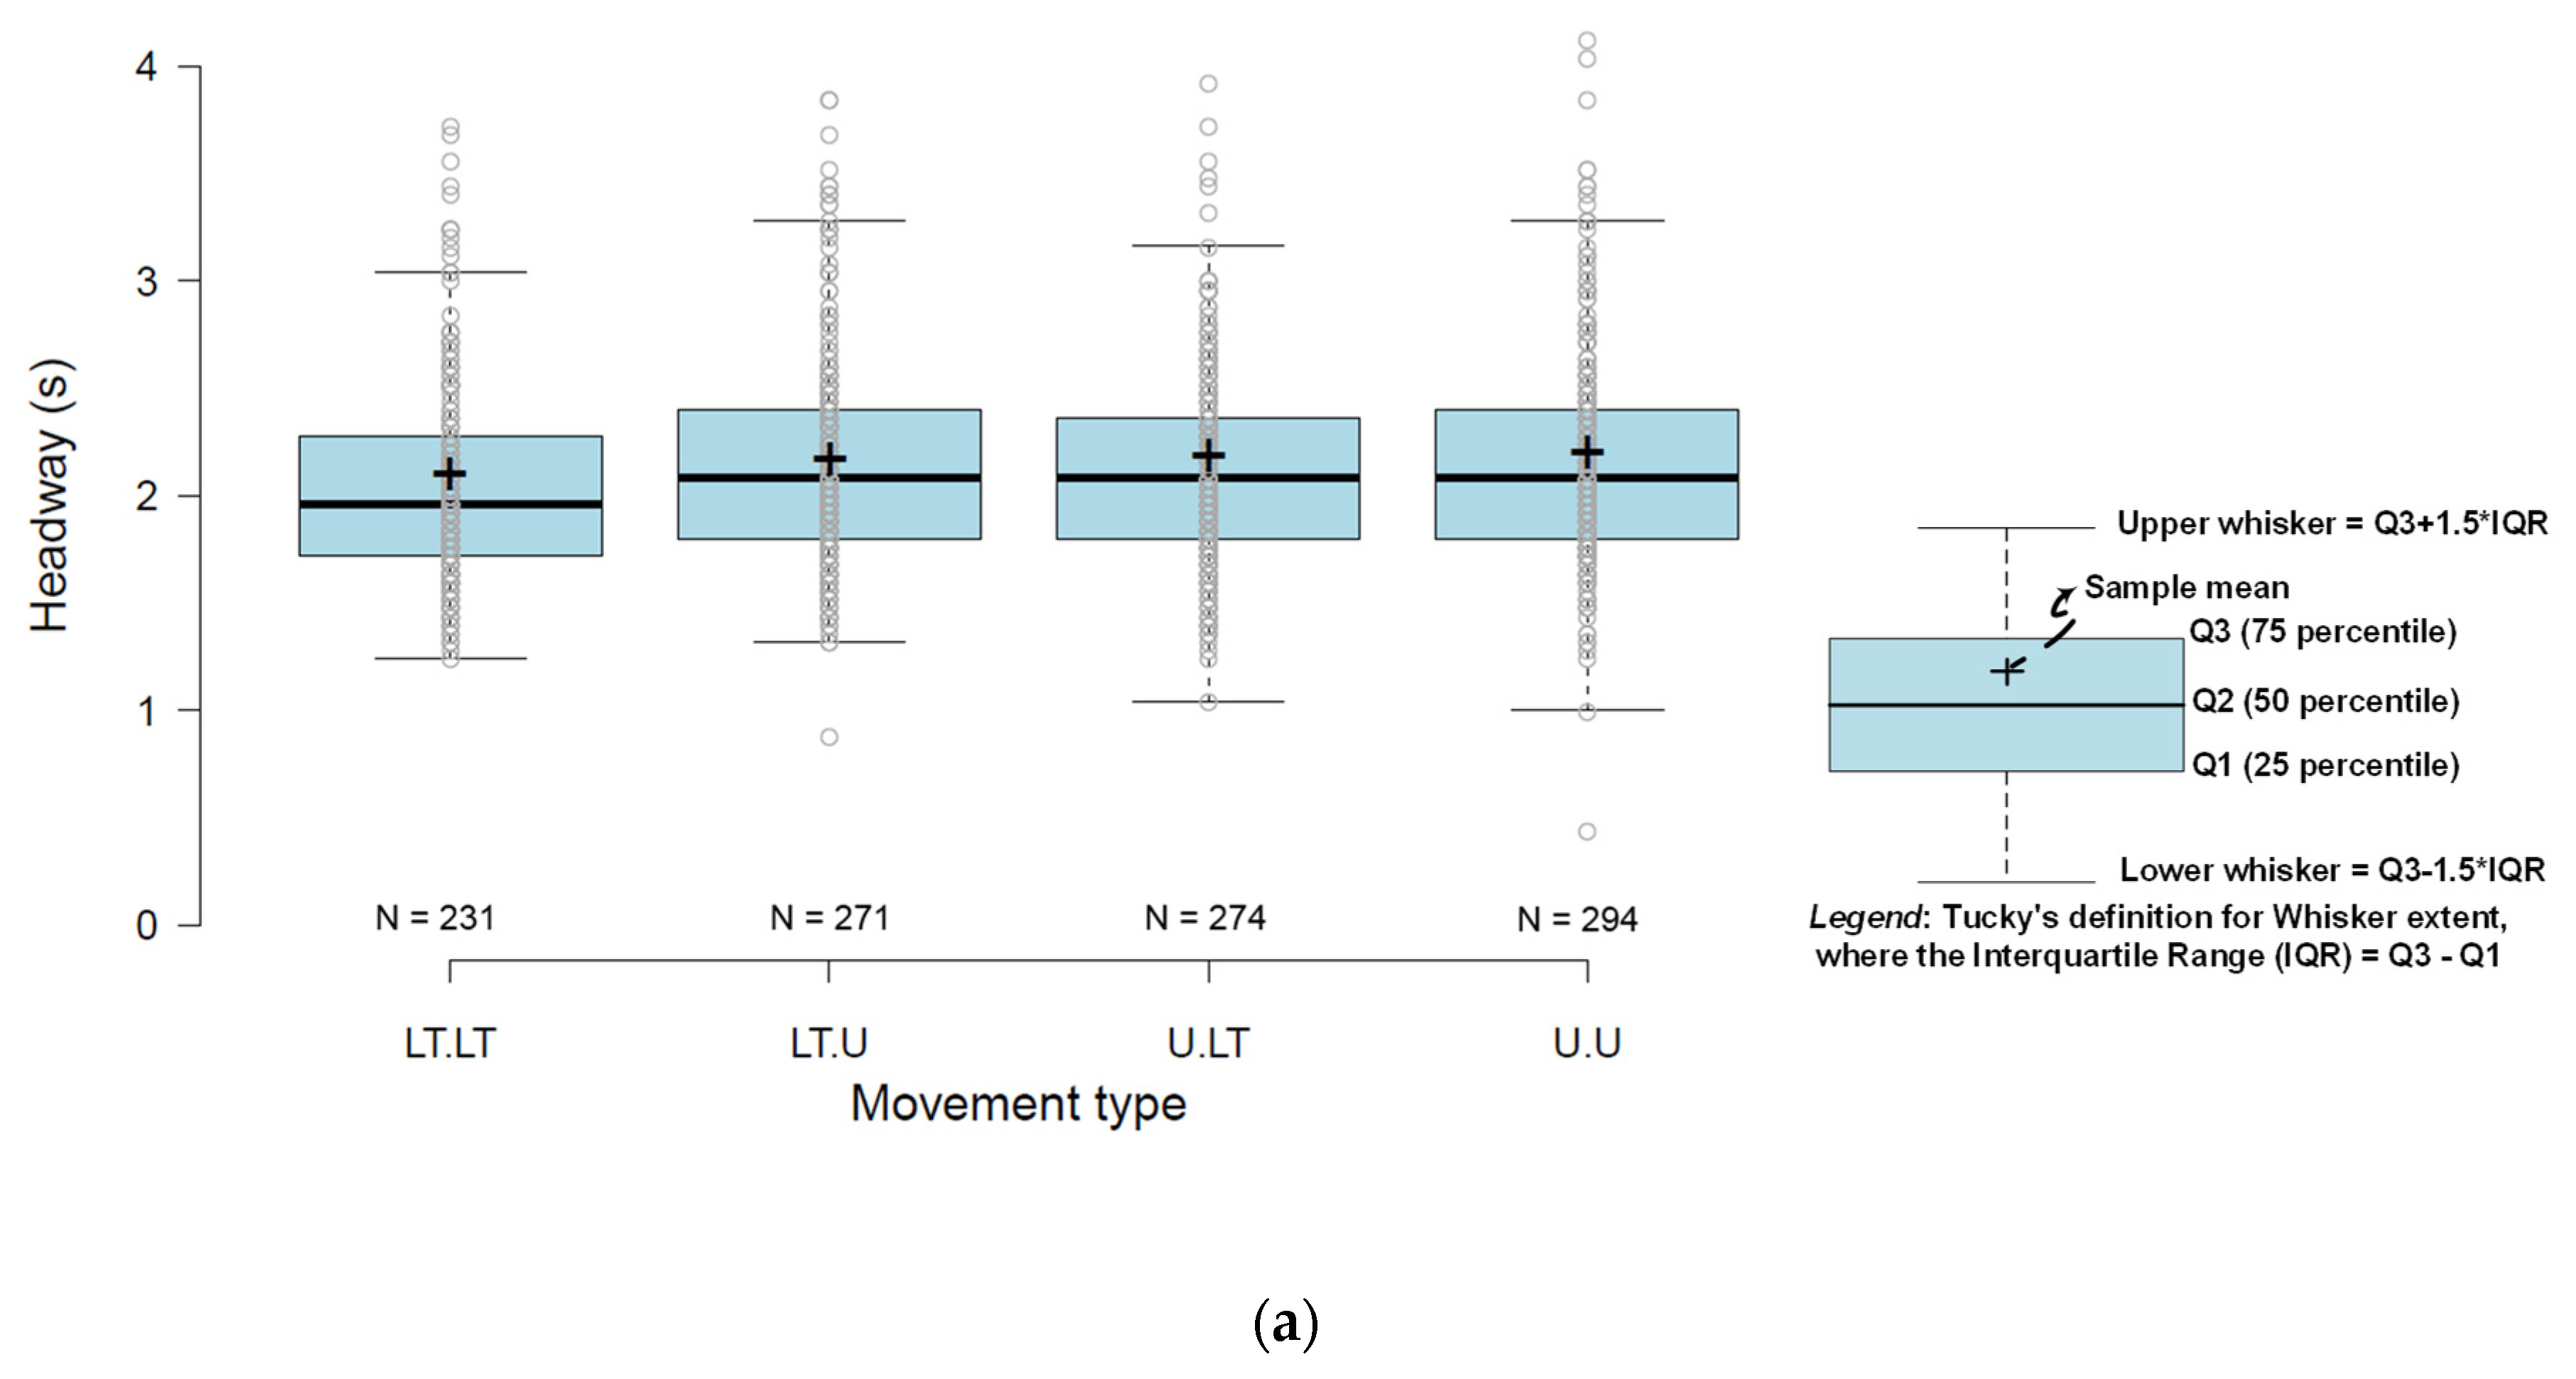
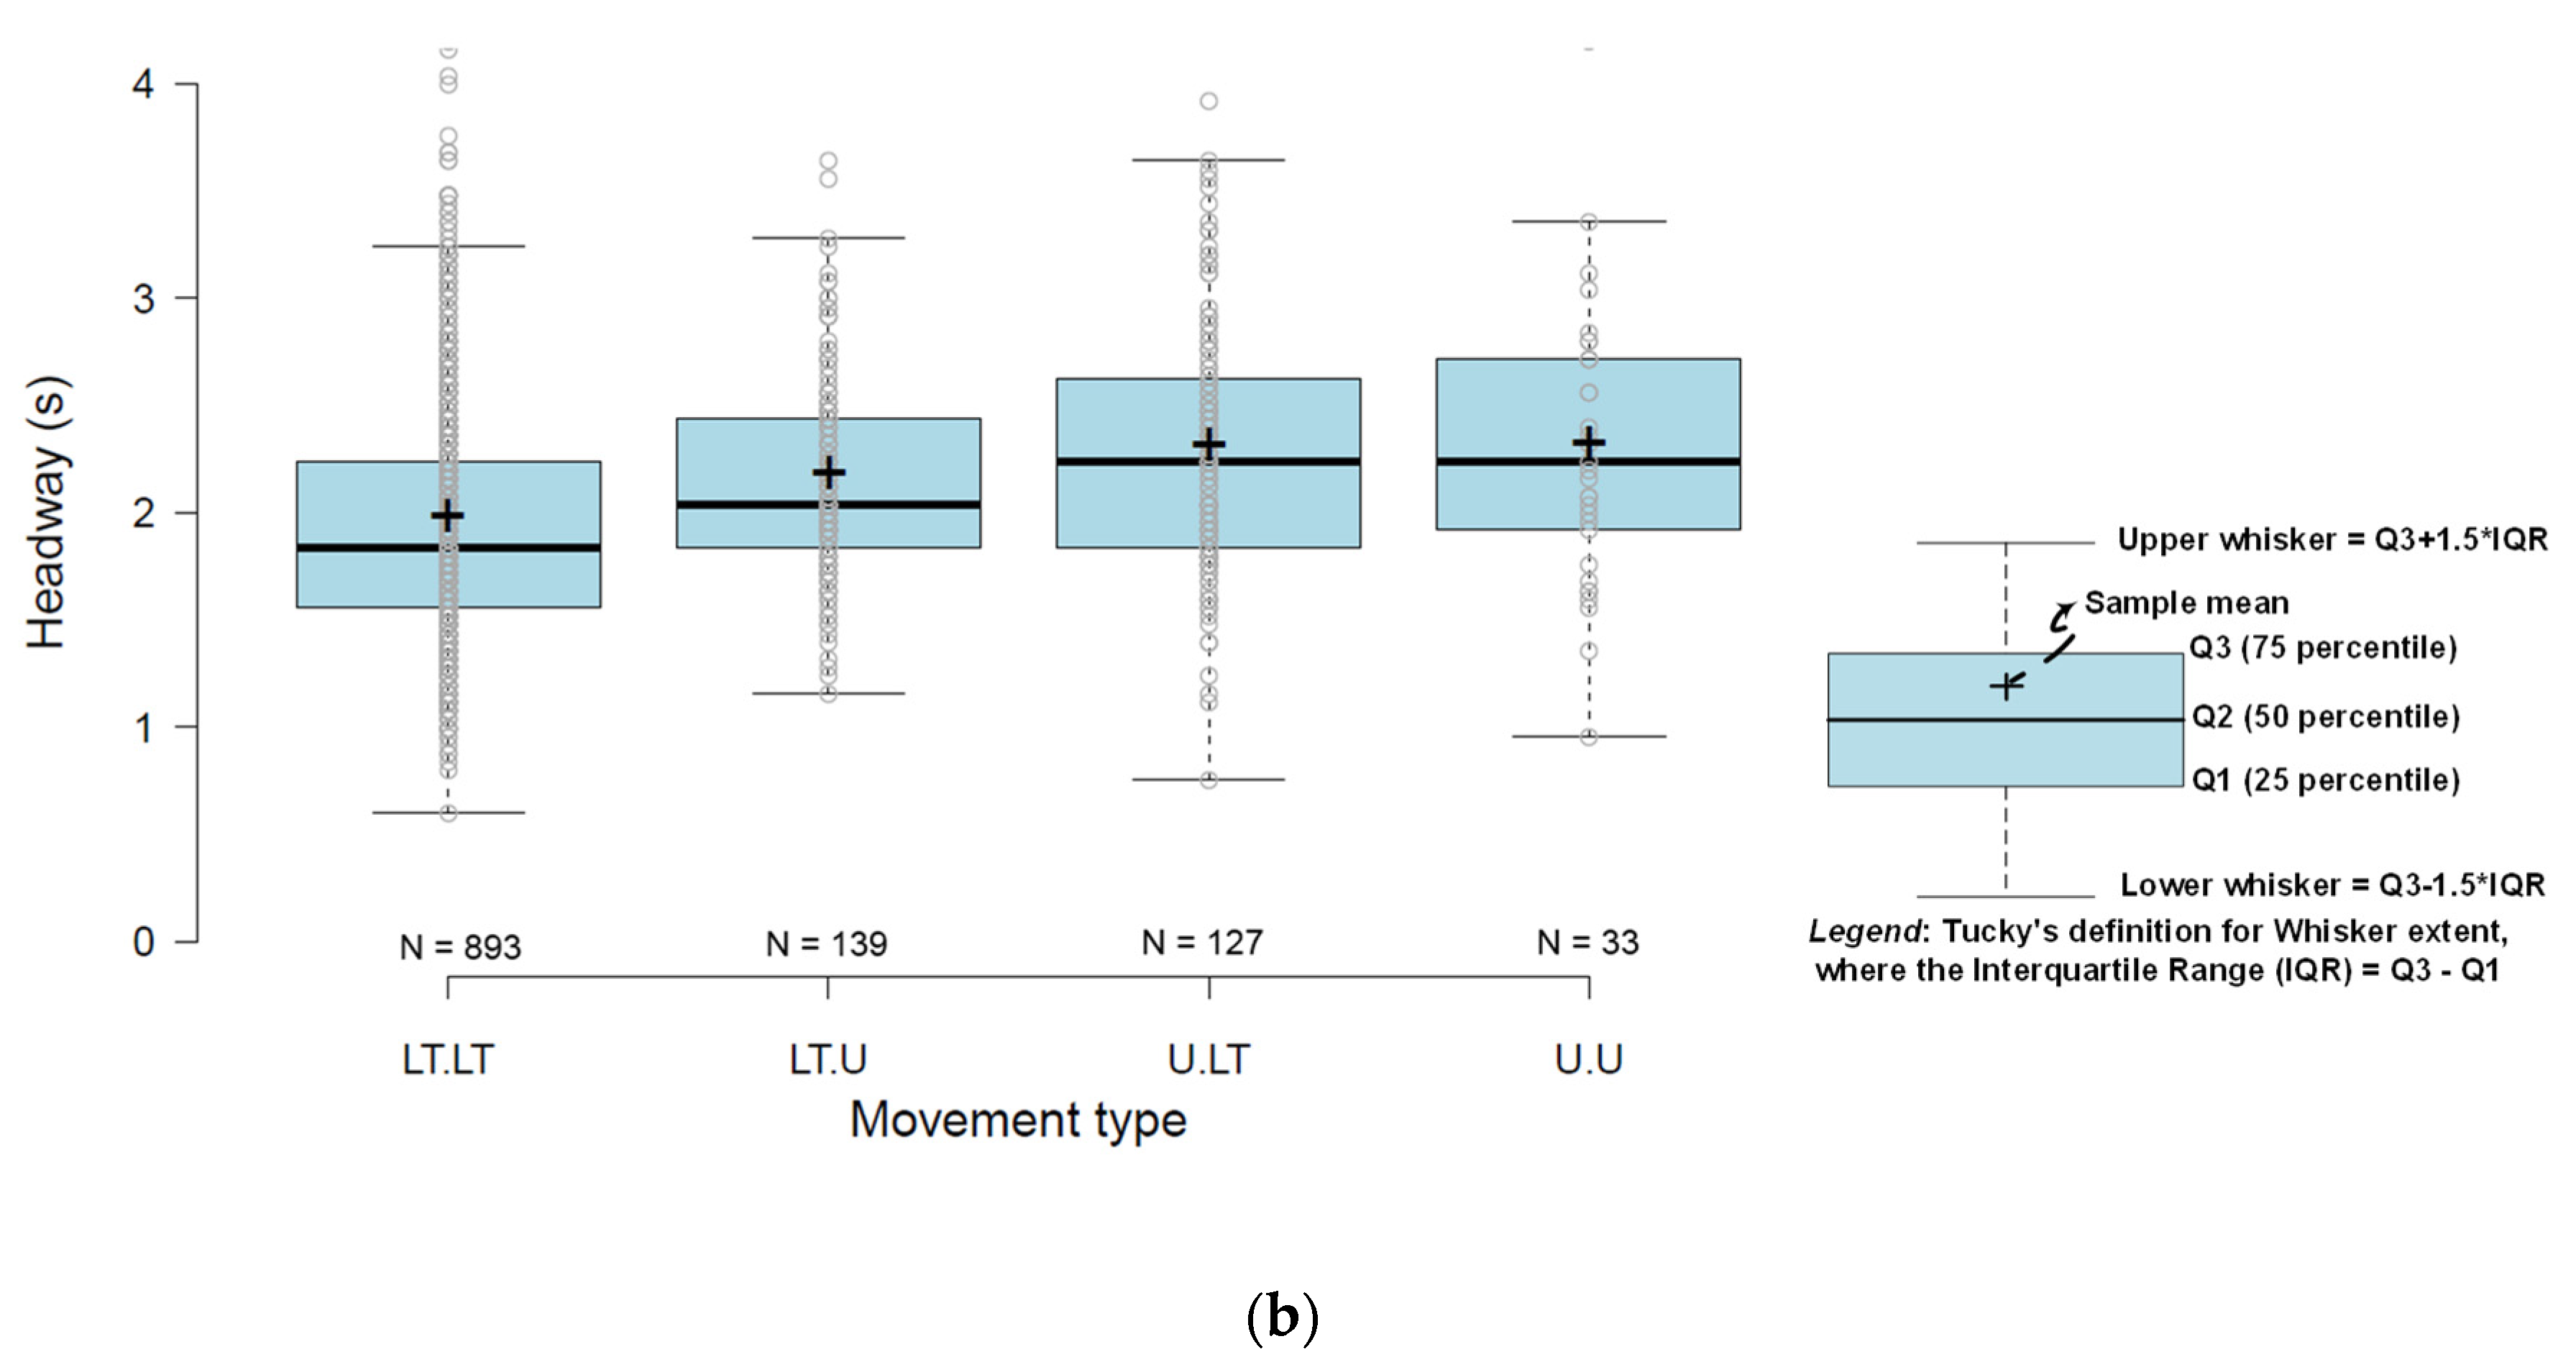
4.1. Characteristics of Headways

Headways were categorized for different lanes and headway distributions were compared based on the following movement types:
  • A leading left-turning vehicle is followed by a left-turning vehicle (LT-LT)
  • A leading U-turning vehicle is followed by a left-turning vehicle (LT-U)
  • A leading left-turning vehicle is followed by a U-turning vehicle (U-LT)
  • A leading U-turning vehicle is followed by a U-turning vehicle (U-U)
  • Both leading and following vehicles are either a SUV or Sedan (SS-SS)
  • A leading heavy vehicle is followed by a SUV or Sedan (SS-HV)
  • A leading SUV or Sedan is followed by a heavy vehicle (HV-SS)
  • A leading heavy vehicle is followed by a heavy vehicle (HV-HV)
Boxplots for the headways for the shared left and U-turning lanes of LHI are compared in Figure 2. It can be observed that the mean headway is smaller for the LT-LT pattern than for the mean headways of other patterns. The Kruskal-Wallis test showed that the median headways for different movement types (i.e., all LT-LT, LT-U, U-LT and U-U patterns) for both approaches are significantly different (H statistic = 15.0406 and p = 0.00178 for the LHI East approach compared with H statistic = 51.5194 and p < 0.0001 for the LHI South approach). Movement types, which involve a U-turn (i.e., LT-U, U-LT, and U-U patterns), were also compared and it was found that the median headways for those patterns are not statistically significant. The H statistic and p-value of the Kruskal-Wallis test were 0.7887 and 0.67, respectively for the East approach and 3.4601 and 0.18, respectively for the South approach. These statistics show that, for both approaches, the median headways for the LT-LT pattern are significantly smaller compared to for other patterns.
Boxplots of headways for different movement types, which were considered based on the vehicle type for the exclusive left-turning lane of the LHI South approach are compared in Figure 3. It is evident that the mean headway for SS-SS pattern is smaller and the mean headway for the HV-HV pattern is larger than for other movement types. The Kruskal-Wallis test confirmed that the median headways are significantly different for these 4 movement types (H statistics = 35.4141, p-value < 0.00001). However, as confirmed by the Mann-Whitney U test, medians were not significantly different between the SS-HV and HV-SS groups (z-score = 0.96747, p-value = 0.33204).
These observations highlight that the movement patterns of turning (U- or left-turning) vehicles as well as the movement patterns of different vehicle types could result in significantly different headways and consequently influence the saturation flow rates and the capacity of the intersection.

4.2. Base Saturation Flow Rates

At LHI, data from 52 and 54 cycles were obtained for shared lanes at the East and South approaches, respectively. Furthermore, data from 41 and 53 cycles was gathered for the exclusive left-turning lanes on East and South approaches, respectively. For JSI, data from 36 and 33 cycles were obtained for shared lanes, while data from 32 and 29 cycles were obtained for exclusive left-turning lanes on the East and South approaches, respectively. Saturation flow rates were estimated for each signal cycle based on Equation (3) using the average headway values estimated from Equation (2). Before evaluating the effect of U-turns and heavy vehicles, base average saturation flow rates, i.e., when the influence of U-turning vehicles and heavy vehicles was excluded, were estimated and compared for different lane groups at the study sites. The obtained values are summarized in Table 3.
It can be observed that the SFRs found for shared lanes are generally lower compared to the SFRs of exclusive LT lanes for all approaches. Furthermore, although their geometric features are similar, the SFR for LHI is higher than that of JSI. This might be due to the fact that LHI is located on the D ring road, which is a busy road with a speed limit of 100 km/h, while JSI is located on a corridor with a speed limit of 80 km/h.
For exclusive LT lanes, the Kruskal-Wallis test showed that the SFRs were different across four exclusive lanes (H statistic = 19.5099, p = 0. 00021). By contrast, for shared LT and U-turn lanes, SFRs were the same, as confirmed with the Mann-Whitney U test (z-score = 1.04096, p = 0.29834). For the LHI South approach, SFRs for the exclusive lane and the shared lane were significantly different (Mann-Whitney U test z-score = 2.11534, p = 0.034). However, for the JSI South approach, SFRs for the exclusive lane and the shared lane were not significantly different (Mann-Whitney U test z-score = 1.53206, p = 0.12602).
Comparing the SFRs obtained in this study with previous studies (Table 1), it is clear that the SFR values observed in this study matched closely with those observed in Saudi Arabia and the USA. The reasons for the similarity with Saudi Arabian results are obvious, as both countries have similar systems and drivers in both countries exhibit similar driving behavior. Further, the observed SFR in this study for shared lane was smaller compared to the rate in Egypt and was significantly larger compared to the rate found in Japanese studies. This shows that Japanese drivers use larger headways to make safer maneuvers compared to Qatari drivers, who exhibit the opposite behavior.

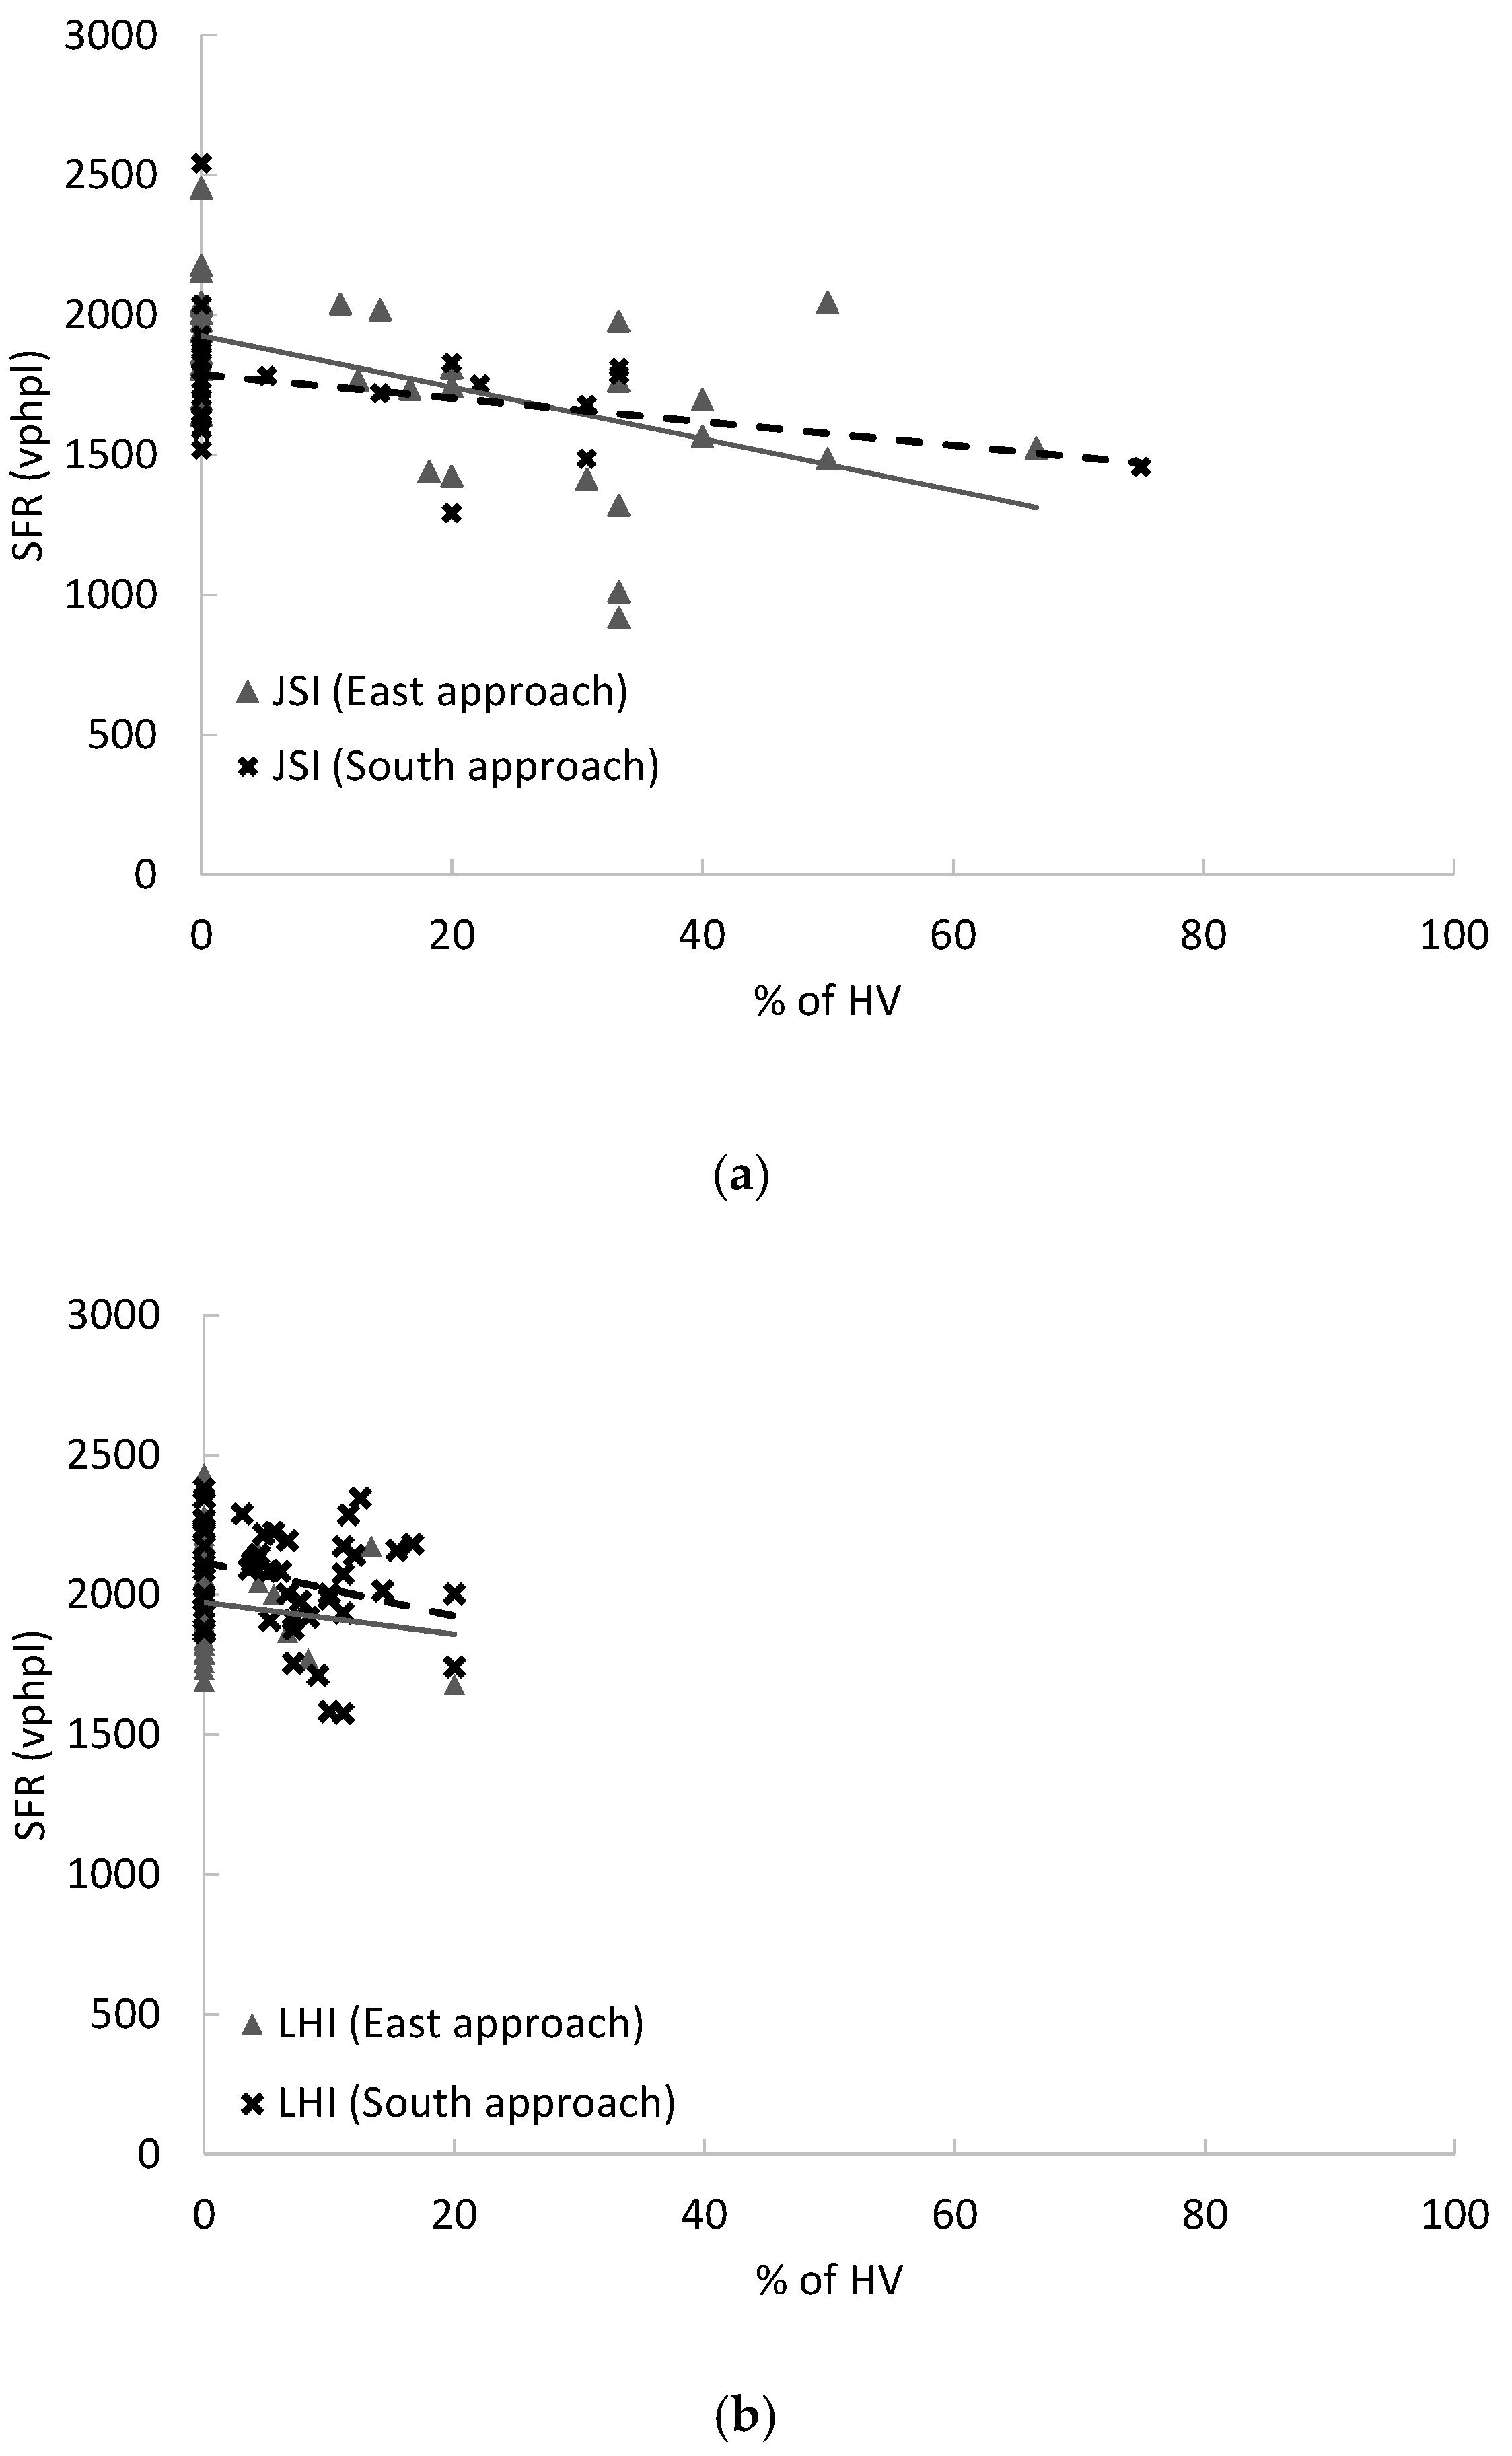
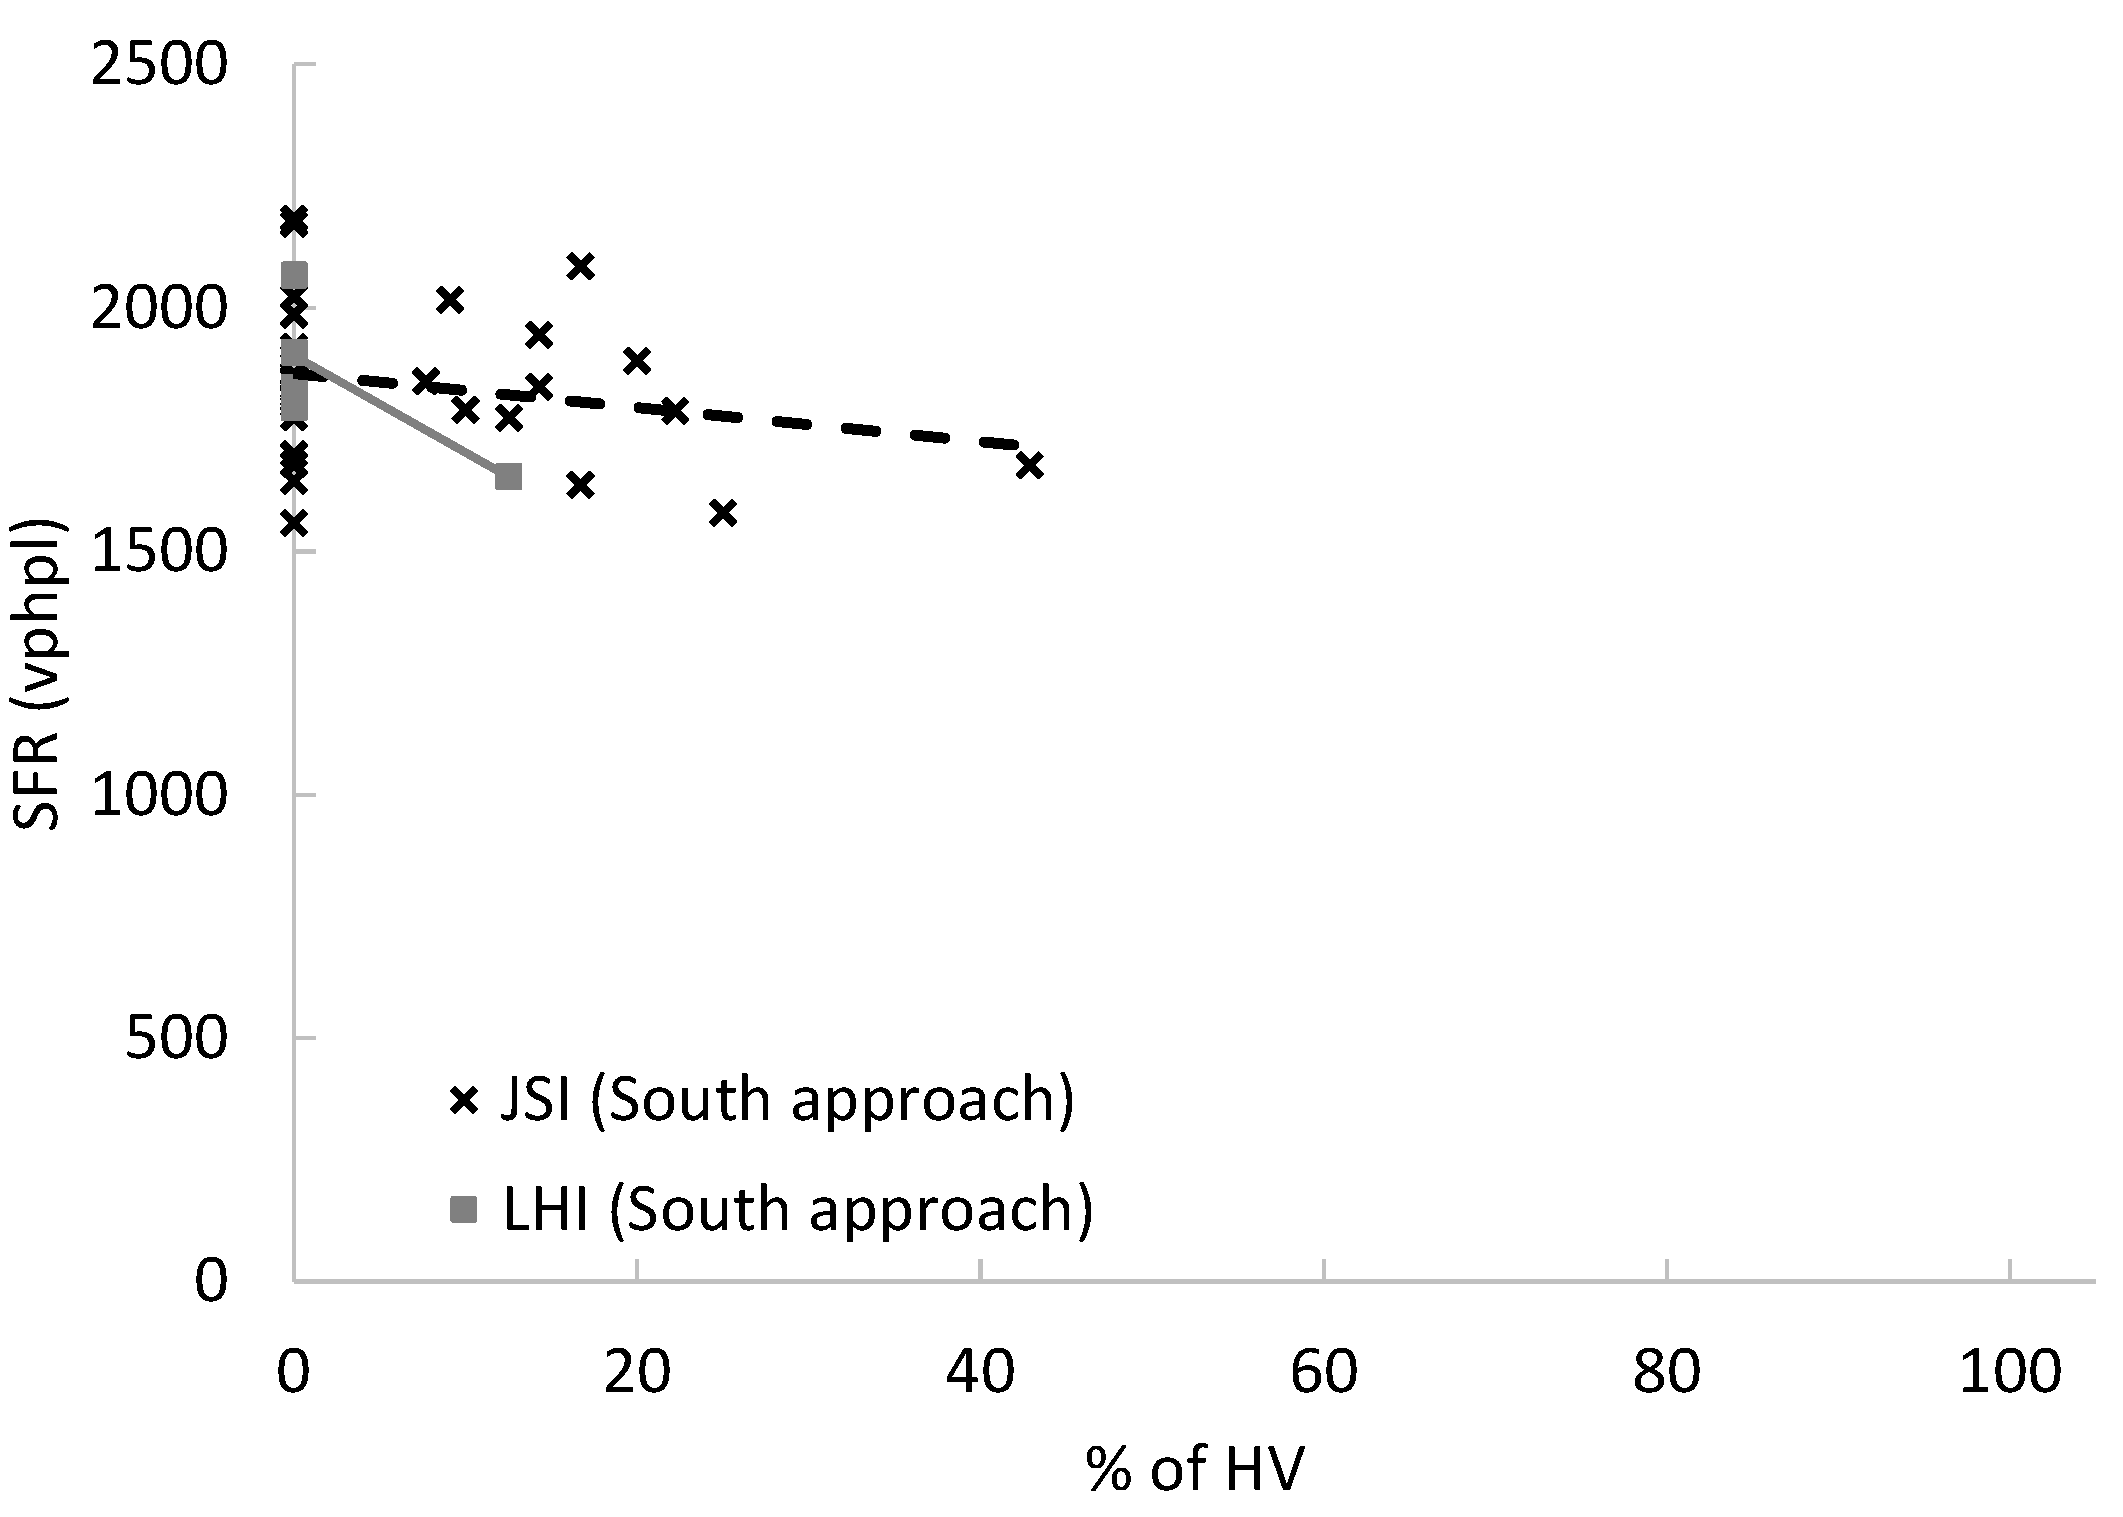
4.3. Effect of Heavy Vehicles

As discussed in Section 4.1, the presence of heavy vehicles can result in larger time headways between vehicles. Further, heavy vehicles generally require longer times compared to passenger cars to traverse through an intersection. Several previous studies in non-Arabic countries have empirically explored the impact of heavy vehicles [4,26,36] as well as light duty trucks [37] on base SFR. As all such studies reported, the SFR decreases with the increase of the share of heavy vehicles or light duty vehicles. Figure 4 and Figure 5 plot the proportion of heavy vehicles versus SFR for exclusive left-turn lanes and shared LT and u-turning lanes, respectively. Similar trends, i.e., a decreasing SFR with the increase of the HV percentage, can be observed in all plots. A considerable variation can be observed in all plots and that could be due to the different following patterns of vehicles, as described in Section 4.1.
Regression statistics disclosed that the slopes (HV percentage) are significant only for the JSI East approach (t = −3.38, p = 0.002) and the LHI South approach (t = −2.13, p = 0.038). For the other lanes, i.e., the JSI South approach and the LHI East approach, the relationships were not significant (t = −1.89 and p = 0.07, t = −0.84 and p = 0.40, respectively). For shared lanes, a limited number of samples were available after removing U-turning maneuvers (Figure 5), while the relationship between the SFR and the percentage of HV was not statistically significant (t for the slope = −1.95, p = 0.06). Limited data samples and variations due to different following patters might have influenced other relationships as well and therefore, more data, collected at difference sites, are required for further verification. Based on the estimated relationships, HV adjustment factors ( f H V ) can be estimated using the following equation:
f H V % = S F R H V % S F R 0
where S F R H V % is the estimated SFR for left-turning traffic (0% of u-turning vehicles) with the specific heavy vehicle percentage (HV%), and S F R 0 is the base average SFR for left-turning lanes (with 0% the vehicles using these lanes being heavy vehicles and 0% being U-turning vehicles).
The estimated model for S F R H V % (vphpl) using the data for JSI East approach, for which the regressed relationship was significant, is as follows:
S F R H V % = 9.2104 H V % + 1927
where H V % is the percentage of heavy vehicles. The coefficient of determination (R2) for this model is 0.276 and the model is defined only when the H V % is less than 70%, as no data were available for H V % > 70%. Estimated f H V % for the JSI East approach were compared with previous studies in Table 4. This comparison demonstrates that the heavy vehicle adjustment factors for through traffic are not suitable for left-turning traffic.

4.4. Effect U-Turning Vehicles

Generally, U-turning vehicles have lower turning speeds compared to LT vehicles due to their more limited maneuverability and the lack of available space for these vehicles to complete a U-turn. Such factors can significantly increase the headways and subsequently reduce the SFR, as explained in Section 4.1. Liu et al. [22] developed regression models for estimating the average queue discharge time as a function of percentages of U-turning vehicles for left-turn traffic. As they reported, the average queue discharge time is continuously increasing with the increase of the percentage of U-turns being made.
Figure 6 plots the relationship between SFR and percentage of U-turning vehicles for the shared lanes at LHI and JSI. SFRs with a HV effect were excluded (i.e., with 0% of the vehicles being heavy vehicles) in this graph and 120 data points were used, i.e., 72 for LHI and 48 for JSI, respectively. Figure 6 clearly shows that as the proportion of U-turn vehicles increases, the SFR drops significantly for both sites. It should be noted that the percentage of U-turning vehicles was calculated as the proportion of observed U-turning vehicles in a specific cycle against the total observed vehicles in that cycle. As described in Section 4.1, different following patterns can significantly affect the estimated SFR values.
Regression statistics confirmed that for both sites, the slope (u-turning vehicle percentage) is significant (t for slope = −2.42 and p = 0.02 for LHI, and t for slope = −3.92 and p < 0.01 for JSI). Further, as no significant difference was found for the relationship between the percentage of U-turns and SFRs for the two sites (ANCOVA, F = 1.60, p = 0.21), the data in Figure 6 were merged with deriving adjustment factors to obtain the share of U-turns compared to total maneuvers. Using merged data, U-turn adjustment factors ( f U T % ) were estimated using the following equation:
f U T % = S F R U T % S F R 0
where S F R U T % is the estimated SFR for left- and U-turn mixed flow (for a 0% proportion of heavy vehicles) at specific u-turn percentage UT% (using the developed linear regression model in Figure 6), and S F R 0 is the base average SFR for left-turning lanes (at 0% of heavy vehicles and 0% of u-turning vehicles). Using the data shown in Figure 6, the estimated model for S F R U T % (vphpl) is as follows:
S F R U T % = 2.8491 U T % + 1864
where U T % is the percentage of U-turning vehicles. The estimated model is significant (t for slope = −4.95 and p < 0.001) and the coefficient of determination (R2) is 0.1721.
Estimated f U T % using merged data at JSI and LHI, i.e., Equations (7) and (8), were compared with those reported in previous studies, as shown in Table 5. This comparison reveals that such adjustment factors could also remarkably vary from one location to the other. Further, the lane type (through, left-turning) could also have a considerable impact on the different adjustment factors used in designs.

5. Conclusions and Recommendations

This study presented empirical observations of headways and SFRs for exclusive LT and shared LT and U-turn lanes using video data collected at two signalized intersections in Doha City, Qatar. Our contribution through this study is mainly threefold: First, we showed that headways could significantly be different depending on the maneuver patterns and types of leading and following vehicles. Second, we estimated base SFR values for left-turning lanes (for both exclusive LT lanes and shared LT and U-turning lanes). Third, we presented adjustment factors for heavy vehicles and U-turns based on the regression models developed in this study.
Estimated base SFR values varied from approximately 1800 vphpl to approximately 2100 vphpl for exclusive LT lanes and from approximately 1800 vphpl to approximately 1900 vphpl for shared LT and U-turning lanes. It should be noted that these values could largely depend on the geometrical characteristics of the intersection and speed limits. Further, it was observed that the impacts of heavy vehicles and U-turning vehicles on SFR of left-turning lanes are significant.
The findings of this study can be useful in determining the capacities of intersections, particularly in the State of Qatar, by setting realistic values for the SFRs of exclusive LT lanes as well as shared LT and U-turning lanes. The results can also be applicable for determining efficient signal timings.
The impact of intersection geometry on the SFR for LT turns and shared lanes, which is expected to be significant, was not investigated in this study. Furthermore, examining the impact of number of LT lanes on SFR as well as the impact of night conditions are also important. Thus, collecting data at various intersections with different geometries during day and night is necessary.

Author Contributions

Conceptualization, W.A. and D.M.; Methodology, C.D., W.A., and D.M.; Software, D.M. and A.A.; Validation, C.D. and W.A.; Formal Analysis, A.A., C.D.; Data Curation, D.M.; Writing–Original Draft Preparation, A.A., D.M. and W.A.; Writing–Review & Editing, C.D., D.M. and W.A.; Supervision, W.A. All authors have read and agreed to the published version of the manuscript.

Funding

This research received no external funding.

Acknowledgments

The authors acknowledge the NPRP 8-365-2-150 project for providing videos for the data analysis.

Conflicts of Interest

The authors declare no conflict of interest.

References

  1. Highway Capacity Manual; Transportation Research Board: Washington, DC, USA, 2016.
  2. Hamad, K.; Abuhamda, H. Estimating base saturation flow rate for selected signalized intersections in Doha, Qatar. J. Traffic Logist. Eng. 2015, 3, 168–171. [Google Scholar] [CrossRef]
  3. Al-Ghamdi, A.S. Entering headway for through movements at urban signalized intersectionsl. Transp. Res. Rec. 1999, 1678, 42–47. [Google Scholar] [CrossRef]
  4. Alam, M.J.B.; Osra, K.A.; Al-Bar, H.O.; Zahran, S.Z. Signalized intersection capacity adjustment factors for Makkah, Saudi Arabia. Can. J. Transp. 2010, 4, 55–66. [Google Scholar]
  5. Al-Omari, B.H.; Musa, Y.B. Aggressive driving effect on signalized intersections saturation flow rates in developing countries. In Proceedings of the 7th Traffic Safety Conference, Amman, Jordan, 12–13 May 2015. [Google Scholar]
  6. Mohseni, P.; Boroujerdian, A.M. Analysis of the impact of users violations on the saturation flow rate at signalized intersections. Int. J. Transp. Eng. 2018, 6, 145–156. [Google Scholar]
  7. Dündar, S.; Öğüt, K.S. Determination of basic saturation flow rates in Istanbul. Int. J. Eng. Technol. 2018, 4, 47–52. [Google Scholar]
  8. Stanić, B.; Tubić, V.; Čelar, N. Straight lane saturation flow and its rate in Serbian cities. Transport 2011, 26, 329–333. [Google Scholar] [CrossRef]
  9. Rahman, M.M.; Ahmed, S.N.; Hassan, T. Comparison of saturation flow rate at signalized intersections in Yokohama and Dhaka. In Proceedings of the Eastern Asia Society for Transportation Studies, Bangkok, Thailand, 22 September 2005; Volume 5, pp. 959–966. [Google Scholar]
  10. Mukwaya, R.; Mwesige, G. Saturation Flow Rate for Through-Traffic at Signalized Junctions in Kampala. In Proceedings of the Second International Conference on Advances in Engineering and Technology, Entebbe, Uganda, 31 January–1 February 2011; Volume 135, pp. 253–259. [Google Scholar]
  11. Hussain, A.M. Determination of saturation flows at signalized intersections in Malaysian urban areas. In Proceedings of the 6th REAAA Conference, Kuala Lumpur, Malaysia, 4–10 March 1990; Volume 2, pp. 1406–1413. [Google Scholar]
  12. Hussayin, A.S.; Shoukry, W.S. Saturation flow and effective approach width at signalized intersections in Greater Cairo. In Proceedings of the 6th African Highway IRF Conference, Cairo, Egypt, 21–26 September 1986. [Google Scholar]
  13. Coeymas, J.E.; Meely, C.B. Basic Traffic Parameters in the Case of Santiago; Transport and Road Research Laboratory (TRRL): Wokingham, UK, 1988. [Google Scholar]
  14. Lee, H.S.; Do, T.W. Saturation headway of through movement at signalized intersections in urban area. J. Transp. Res. Soc. Korea 2002, 20, 23–31. [Google Scholar]
  15. De Andrade, J.P. The Performance of Urban Intersections in Brazil. Transportation Research Group. Ph.D. Thesis, Department of Civil Engineering, University of Southampton, Southampton, UK, Unpublished work. 1988. [Google Scholar]
  16. Bester, C.J.; Meyers, W.L. Saturation Flow Rates. In Proceedings of the 26th Southern African Transport Conference, Pretoria, South Africa, 9–12 July 2007. [Google Scholar]
  17. Chand, S.; Gupta, N.J.; Velmurugan, S. Development of saturation flow model at signalized intersection for heterogeneous Traffic. Transp. Res. Procedia 2017, 25, 1662–1671. [Google Scholar] [CrossRef]
  18. Siddiqui, S. Investigating Saturation Flow Rate of Dual Left-Turn Lanes at Intersection Approaches. In Technical Report; Montana State University: Bozeman, MT, USA, 2015. [Google Scholar]
  19. Wang, M.H.; Benekohal, R. Analysis of left-turn saturation flow rates and capacity at signalized intersections. Transp. Res. Rec. 2010, 2173, 96–104. [Google Scholar] [CrossRef]
  20. Arhin, S.; Anderson, M.F.; Stinson, R.; Ribbiso, A. Prevailing saturation flow rate for lane groups in an urban area. Int. J. Traffic Transp. Eng. 2016, 6, 231–242. [Google Scholar] [CrossRef] [Green Version]
  21. Chen, P.; Nakamura, H.; Asano, M. Saturation flow rate analysis for shared left-turn lane at ignalized intersections in Japan. Procedia Soc. Behav. Sci. 2011, 16, 548–559. [Google Scholar] [CrossRef] [Green Version]
  22. Liu, P.; Lu, J.; Fan, J.; Pernia, J.; Sokolow, G. Effects of U-turns on capacities of signalized intersections. J. Transp. Res. Board 2005, 1920, 74–80. [Google Scholar] [CrossRef]
  23. Shokry, S.; Tanaka, S. Evaluating the operational performance of signalized intersections involving U-turns in Aswan City, Egypt. J. East. Asia Soc. Transp. Stud. 2015, 11, 1754–1773. [Google Scholar]
  24. Adams, J.C.; Hummer, J.E. Effects of U-turns on left-turn saturation flow rates. Transp. Res. Rec. 1993, 1398, 90–100. [Google Scholar]
  25. Sun, H.; Yang, J.; Wang, L.; Li, L.; Wu, B. Saturation flow rate and start-up lost time of dual-left lanes at signalized intersection in rainy weather condition. Procedia Soc. Behav. Sci. 2013, 96, 270–279. [Google Scholar] [CrossRef] [Green Version]
  26. Chodur, J.; Ostrowski, K.; Tracz, M. Impact of saturation flow changes on performance of traffic lanes at signalised intersections. Procedia Soc. Behav. Sci. 2011, 16, 600–611. [Google Scholar] [CrossRef] [Green Version]
  27. Branston, D. Some factors affecting the capacity of signalised intersections. Traffic Eng. Control 1979, 20, 390–396. [Google Scholar]
  28. Shao, C.Q.; Rong, J.; Liu, X.M. Study on the saturation flow rate and its influence factors at signalized intersections in China. Procedia Soc. Behav. Sci. 2011, 16, 504–514. [Google Scholar] [CrossRef] [Green Version]
  29. Sando, T.; Moses, R. Influence of intersection geometrics on the operation of triple left-turn lanes. J. Transp. Eng. 2009, 135, 253–259. [Google Scholar] [CrossRef]
  30. Hashemi, A.H.; Nakamura, H.; Goto, A. Influence of downstream conditions over saturation flow rate. In Proceedings of the 37th Conference of Japan Society of Traffic Engineers, Fukuoka, Japan, 11–13 September 2017; pp. 467–472. [Google Scholar]
  31. Qin, Z.; Zhao, J.; Liang, S.; Yao, J. Impact of guideline markings on saturation flow rate at signalized intersections. J. Adv. Transp. 2019. [Google Scholar] [CrossRef]
  32. Lin, F.B. Left-Turn adjustment factors for saturation flow rates of shared permissive left-turn lanes. Transp. Res. Rec. 1992, 1365, 62–70. [Google Scholar]
  33. Prassas, E.S.; Roess, R.P. Left-turn adjustment for permitted turns from shared lane groups: Another look. Transp. Res. Rec. 1993, 1398, 75–81. [Google Scholar]
  34. Tsao, S.M.; Chu, S.W. A study on adjustment factors for U-turns in left-turn lanes at signalized intersections. J. Adv. Transp. 1995, 29, 183–192. [Google Scholar] [CrossRef]
  35. Carter, D.; Hummer, J.E.; Foyle, R.S.; Phillips, S. Operational and safety effects of U-turns at signalized intersections. Transp. Res. Rec. 2005, 1912, 11–18. [Google Scholar] [CrossRef]
  36. Cuddon, A.P.; Ogden, K.W. The effect of heavy vehicles on saturation flows at signalised intersections. In Proceedings of the 16th ARRB Conference, Perth, WA, Australia, 9–13 November 1992; Volume 16. [Google Scholar]
  37. Kockelman, K.M.; Shabih, R.A. Effect of light-duty trucks on the capacity of signalized intersections. J. Transp. Eng. 2000, 126, 506–512. [Google Scholar] [CrossRef]
  38. Zhang, G.; Chen, J. Study on saturation flow rates for signalized intersections. In Proceedings of the International Conference on Measuring Technology and Mechatronics Automation, Southeast University, Nanjing, China, 11–12 April 2009. [Google Scholar]
  39. Hamad, K.; Abu-Hamda, H. Determining u-turn adjustment factor for signalized intersections in Doha, Qatar. In Proceedings of the MATEC Web of Conferences, Sharjah, UAE, 18–20 April 2017; Volume 120, p. 07008. [Google Scholar] [CrossRef] [Green Version]
Figure 1. Observation sites in Doha City, Qatar; The Lulu Hypermarket Intersection (up), The Jaidah Square Intersection (down)
Sustainability 12 04485 g001
Figure 2. Boxplots of headways for different movement types for the Shared LT and U-turn lanes at LHI; (a) South approach; (b) East approach (“+” indicates sample mean).
Sustainability 12 04485 g002aSustainability 12 04485 g002b
Figure 3. Boxplots of headways for different movement types for the exclusive left-turn lane of the LHI South approach (“+” indicates sample mean).
Sustainability 12 04485 g003
Figure 4. Relationship between the Saturation Flow Rate (SFR) and the percentage of heavy vehicles for exclusive left-turning lanes, (a) Jaidah Square Intersection (JSI), (b) Lulu Hypermarket Intersection (LHI).
Sustainability 12 04485 g004
Figure 5. Relationship between the SFR and the percentage of heavy vehicles for shared lanes.
Sustainability 12 04485 g005
Figure 6. Relationship between SFR and the % of U-turning vehicles (with 0% of the vehicles being heavy vehicles).
Sustainability 12 04485 g006
Table 1. Summary of the saturation flow rates observed in different countries.
SourceCity/CountryLane MovementSFR (veh/h/ln)
Hamad and Abuhamda [2]Doha, QatarTH2323
Al-Ghamdi [3]Riyadh, Saudi ArabiaTH2195–2293
Alam et al. [4]Makkah, Saudi ArabiaTH2500
LT1895
LUT1690
Al-Omari and Musa [5]Jordan
Kuwait
TH2050
2100
Mohseni and Boroujerdian [6]Tehran, IranTH1905
Dündar and Öğüt [7]Istanbul, TurkeyTH1894
Stanić et al. [8]Belgrade, SerbiaTH2120–2209
Rahman et al. [9]Dhaka, Bangladesh
Yokohama, Japan
TH2006–2091
1636–2093
Mukwaya and Mwesige [10]Kampala, UgandaTH1470–1774
Hussain [11]MalaysiaTH1945
Hussayin and Shoukry [12]Cairo, EgyptTH1617
Coeymans and Neely [13]Santiago, ChileTH1603
Lee and Do [14]South KoreaTH1978
De Andrade [15]BrazilTH1660
Bester and Meyers [16]South AfricaTH and RT1711–2370
Chand et al. [17]IndiaTH and RT1869–2083
Siddiqui [18]USALT1815
Wang and Benekohal [19]USALT1828
Arhin et al. [20]USALT1460
Chen et al. [21]JapanLUT1496
Liu et al. [22]USALUT1682
Shokry and Tanaka [23]EgyptLUT1882
Adams and Hummer [24]USALUT1500–2300
Note: TH refers to exclusive through lanes, LT refers to exclusive left-turning lanes, RT refers to right-turning lanes, and LUT refers to shared left-turning and U-turn lanes.
Table 2. Characteristics of study sites.
SiteApproachLane TypeIw (m)Enw (m)Lw (m)Exw-U (m)Exw-LT (m)
Lulu Hypermarket Intersection (LHI)EastShared26.037.423.7115.147.77
Exclusive LT26.037.423.71-7.77
SouthShared41.846.553.268.6510.93
Exclusive LT41.846.553.29-10.93
Jaidah Square Intersection (JSI)EastShared25.776.693.3513.07.52
Exclusive LT25.776.693.34-7.52
SouthShared41.067.683.659.7111.0
Exclusive LT41.067.683.65-11.0
Table 3. Estimated base saturation flows for different lanes at study sites.
SiteApproachLane Type A v e r a g e   S F R a v g   ( vphpl )
LHIEastExclusive LT1947
Shared lane (LT and U) *-
SouthExclusive LT2089
Shared lane (LT and U)1901
JSIEastExclusive LT1792
Shared lane (LT and U) *-
SouthExclusive LT1935
Shared lane (LT and U)1814
Note: * No adequate samples, which exclude both U-turns and heavy vehicles.
Table 4. Comparison of heavy vehicle adjustment factors obtained in this study with factors from previous studies.
Heavy Vehicle Percentage (HV%)
Sources0%10%20%30%40%50%60%70%80%90%100%
Current study *1.000.950.900.860.810.760.710.67*********
Chodur et al. [26] **1.000.960.930.900.87
Alam et al. [4] **1.000.870.840.78
Zhang and Chen [38] **1.000.890.81
Note: * Exclusive LT lanes, ** Exclusive through lanes, and *** Data not available.
Table 5. Comparison of the U-turn adjustment factors obtained in this study with those obtained in previous studies.
U-Turn Percentage (UT%)
Source0%10%20%30%40%50%60%70%80%90%100%
Current study *1.000.980.970.950.940.920.910.890.880.860.85
Carter et al. [35] *1.000.980.960.950.930.910.890.870.860.840.82
Liu et al. [22] *1.000.980.960.940.920.900.870.840.820.790.76
Adam and Hummer [24] *1.001.001.001.001.001.001.000.900.900.800.80
Tsao and Chu [34] *1.000.920.860.81
Hamad and Abu-Hamda [39] **1.000.950.910.880.850.830.810.790.780.770.76
Alam et al. [4] **1.000.980.960.95
Note: * Shared LT and U-turning lanes, and ** Shared through and U-turning lanes.

