1. Introduction
Transport has a fundamental role in sustainable development, as first recognized at the 1992 United Nation’s Earth Summit (and in its outcome document, Agenda 21). This was corroborated in the subsequent documents and most recent communications, such as the Johannesburg Plan of Implementation of 2002, and the outcome of the 2012 United Nations Conference on Sustainable Development—Rio+20.
In 2015, the UN countries adopted the 2030 Agenda for Sustainable Development and its 17 Sustainable Development Goals; sustainable transport is mainstreamed across several goals and targets, especially those related to food security, health, energy, economic growth, infrastructure, and cities and human settlements. Moreover, the United Nations Framework Convention on Climate Change (UNFCCC) emphasizes the importance of transport for climate action and its role in the achievement of the Paris Agreement, given the fact that almost a quarter of energy-related global greenhouse gas emissions come from transport [
1].
Modern cities are evolving into complex and fragmented systems where the proximity to activities, job places and other opportunities provides a social advantage and an increase of possibility of socialization [
2]. One of the main challenges of transport planning is trying to promote sustainable and shared transport modes, and the improvement of social equity, health, resilience of cities, urban-rural connection and productivity of rural and dispersed areas [
3]. Among the strategies put in the field to boost sustainable mobility, we want to mention fare abolition for public transport [
4], having the double objective of facing the uncontrolled growth of the private transport, and thus, the related mobility issues, but also standing as a social policy that can embrace only specific categories of users (e.g., students) [
5].
Conventional public transport is well suited to serve high-density and high-demand mobility corridors; nevertheless, fixed-route and scheduled transit services can result in low quality of travel experience and scarce load factors, especially in dispersed low-demand areas, where it is particularly challenging to ensure both good coverage and high ridership [
6]. Moreover, public transport is not always able to meet the population’s need for accessibility to jobs, education, health and other opportunities in terms of routes and frequencies.
Cities characterized by fast economic growth, increasing city population and demand for mobility are a case in point, requiring prompt tailored strategies to satisfy the ever-increasing and diverse transport demand. In these contexts, innovative on-demand mobility, i.e., the one provided by Demand Responsive Shared Transport (DRST) services, can help to bridge the gap between shared low-quality public transport and unsustainable individual private transport. DRST can promote the socio-economic and territorial integration of the residents, favoring the connection with the reference area centers and even providing a more extended and frequent public transport, flexible mobility schemes and feeder services [
7].
DRST services take advantage of new Information and Communication Technologies (ICT) via “on-demand” transport services booking a shared ride on a vehicle in real-time [
8]. A transport operator can control a vehicle fleet via GPS, track the position of users through smartphones, monitor the service into a dynamic GIS, predict travel times and optimize the matching of drivers and riders with similar itineraries and schedule. Users can book, cancel or easily change their reservation; pay using Internet tools; acquire information on transport modes, routes and expected travel times before and during the trip and expected arrival times. By the same token, new ICT facilitate coordination between operators, who can collect aggregate booking requests based on the place, time of departure and destination; select vehicle carriers, based on the number of passengers, tracing flexible routes and estimate travel times with high load factor and low driven distances; collect and storage of service’s performance data [
9]. DRST services can assume different levels of sharing and flexibility, from a shared taxi service to a flexible transit service [
10], and can have a beneficial role in terms of social, environmental, technological and economic impacts [
11].
Notwithstanding their great potential, they should be appropriately planned and managed to be feasible and successful. Some key aspects require attention when designing such services. They will be presented in the following section aimed at positioning the paper and presents its contribution.
Motivation and Aim of the Study
There are some clear trade-offs that should be tackled when planning DRST services. From the operator’s point of view, it is important to correctly dimension the fleet, and select the optimal strategy to assign vehicles to passengers’ requests, so to perform high load factor (to increase revenues) and low driven distances (to reduce operation costs). This should be done while minimizing the additional time and distances travelers have to experience to assure the expected level of service (user point of view). Such an optimal design of a generic DRST can guarantee its effective management and operation. Therefore, it becomes fundamental to explore the variables of the system that can make the service successful. In this respect, simulation models can provide useful decision support. Among others, agent-based models (ABM) have proven their suitability to reproduce complex systems characterized by individual agents acting and interacting with the other agents and with the environment [
12,
13]. Starting from the microinteraction among the agents, it is possible to monitor the state of the system and find a balance between conflicting objectives.
Based on this premise, this paper presents the results of agent-based simulations using GIS real data to support the planning and operation of DRST services in real-world contexts. In particular, the ABM proposed by Inturri et al. [
10] is applied to the case of a particular type of DRST, i.e., an on-demand flexible route transit service for one district of the city of Dubai (United Arab Emirates—UAE). The aim of the model is to find optimal configurations both from the perspective of the transport operator and of the community. The contribution of the paper is twofold—i.e., to prove the suitability of an agent-based simulation environment to reproduce different DRST services and adapt to different contexts; test an already existing service so to provide useful suggestions for DRST correct planning and management. In this respect, the paper advocates that this tool is suitable for both for ex-ante and for ex-post evaluation of flexible transport services. This is in line with sustainable urban mobility planning processes, implying continuous monitoring and evaluation of solutions from the beginning. The remainder of the paper is organized as follows.
Section 2 will provide a literature review aimed at positioning the paper in current research streams related to planning and designing of public transport services.
Section 3 will present the ABM applied to the case study of Dubai.
Section 4 will present (and discuss) the results obtained.
Section 5 will conclude the paper by highlighting future research directions.
2. Contribution to the Current Literature
Models can be used to reproduce public transport services, in general, and DRST services, in particular, and predict the impacts of different strategies on service efficiency. A review of modeling approach to the problem of DRST design can be found in References [
10,
14].
In particular, ABM are a suitable tool to understand the complexity of transport systems and the emergent phenomena deriving from the interaction between individual agents with different objectives and behaviors [
15,
16]. They provide a natural description of a system; they are flexible, making it possible to add more entities to the model, modify behavior, degree of rationality, ability to learn and evolve, and rules of interactions of agents [
17]. Contrary to traditional simulation modeling (where a model is implemented according to a centralized theory), in ABM, agents are provided with few rules of behavior and emerging patterns through the simulation are investigated [
10]. Another difference stands in the level of aggregation: Even if traditional behavioral models can be disaggregated and detailed, they always presume limited options, rational behavior and maximizing goals [
18]. The use of ABM also provides a suitable environment where to test transport systems serving the same demand and evaluate their performance under different configurations, to understand the potential effectiveness of shared services and their applicability range.
In general, the problem of designing minimum cost vehicle routes and schedules able to accommodate as many users as possible, under a set of constraints, is addressed in literature as a Dial-a-Ride Problem [
19]. In this respect, Pan et al. [
20] propose a heuristic approach to design service area and routing plans for a flexible feeder transit system and validate its capability of reducing last-mile distances and travel times via large-scale simulation. Calabrò et al. [
21] integrated an ant colony optimization algorithm into an ABM to design optimal transit routes in low-demand areas, where the transport demand is biased towards mass rapid transit stations, and thus, helping to build or reinforce a trunk-feeder scheme.
Recently, many authors have been interested in studying the impact of automated mobility on-demand (AMoD) on urban transportation. Scheltes and Correia [
22] developed an ABM to test the use of fully automated vehicles as a first mile/last mile connection to mass public transport modes, with a dedicated dispatching algorithm able to distribute travel requests amongst the available vehicles. Basu et al. [
23] designed a multi-modal agent-based simulation platform to analyze the competitive and complementary relationship between mass transit and AMoD. A significant finding regarded the inability of replacing mass transit with AMoD without compromise the user level of service. Finally, Fagnant and Kockelman [
24] proposed a model on a dynamic ride-sharing service provided by shared autonomous vehicles; results from agent-based simulation highlighted the huge potential of such services in urban areas, in terms of time/cost savings for users and profitability for operators.
Since our attention is focused on transport services presenting both a demand-responsive fashion and a high shareability, we deal with levels of flexibility that are intermediate between a pure door-to-door individual transport and the conventional fixed-route public transport. A methodological framework on planning the so-called “semi-flexible” transit systems is provided in Reference [
14] with a focus on strategic, tactical and operational levels. The degree of flexibility affects both the operator and the users of the service. The former makes decisions about the fleet size and composition or the ICT facilities to be equipped with. The latter experience costs related to the different travel time components (not taking the fares into account), which can be strongly variable with the operational strategy. The importance of the user perspective in determining the success of flexible and demand-responsive transit services is underlined in Reference [
25], where the authors estimate the time-reliability-cost trade-offs of users in terms of value of time and value of reliability, this related to the time variability and uncertainty.
In this study, a particular type of DRST, i.e., an on-demand flexible route transit service for one district of the city of Dubai (United Arab Emirates—UAE), is tested through an ABM, by simulating the interaction between vehicles traveling along with the road network and users willing to get the transport service to their destinations. Such service has been launched as a pilot by The Roads and Transport Authority and was provided by MVMANT (
https://www.mvmant.com). It can be configured as a dynamic and flexible transit. It is dynamic since real-time arriving demand requests affect both the way routes are assigned to vehicles and the service of optional stops, resulting in a dynamic routing elaborated just in time. Moreover, the company designed it as flexible because it is composed of fixed and optional routes, which are currently travelled by the DRST only if demand is present, and which have been designed in advance together with the fixed-route, based on-demand patterns and infrastructure constraints. In fact, due to the short distances between the users’ desired stops, reduced size of the circuit and constraints of roads’ geometry, routes were chosen with a more static approach, making the service more efficient than a pure door-to-door service.
The presented ABM is based on the implementation of: (i) An ad-hoc GIS-based demand model integrated into the simulation environment (ii) different dispatching strategies allowing a dynamic matching between vehicles and passengers; (iii) a flexible simulation interface that easily changes variables and monitor the state of the system in real-time. The model has been presented in Inturri et al. [
8,
10], and applied to the case study of the small-medium city of Ragusa (Italy), where a similar service was tested and where an optimal operation range was found. In this respect, the model can be easily adapted so to reproduce different DRST services and applied to other contexts, allowing to find optimal operation configurations, by monitoring ad-hoc performance indicators. The ABM is able to capture the performance of the DRST, which depends on how vehicles are allocated to passengers, routes and schedules, on the particular topology of the road network and on the spatio-temporal pattern of passenger demand. In the following, the main characteristics of the ABM for the test of MVMANT service in Dubai are presented.
3. Methods and Materials
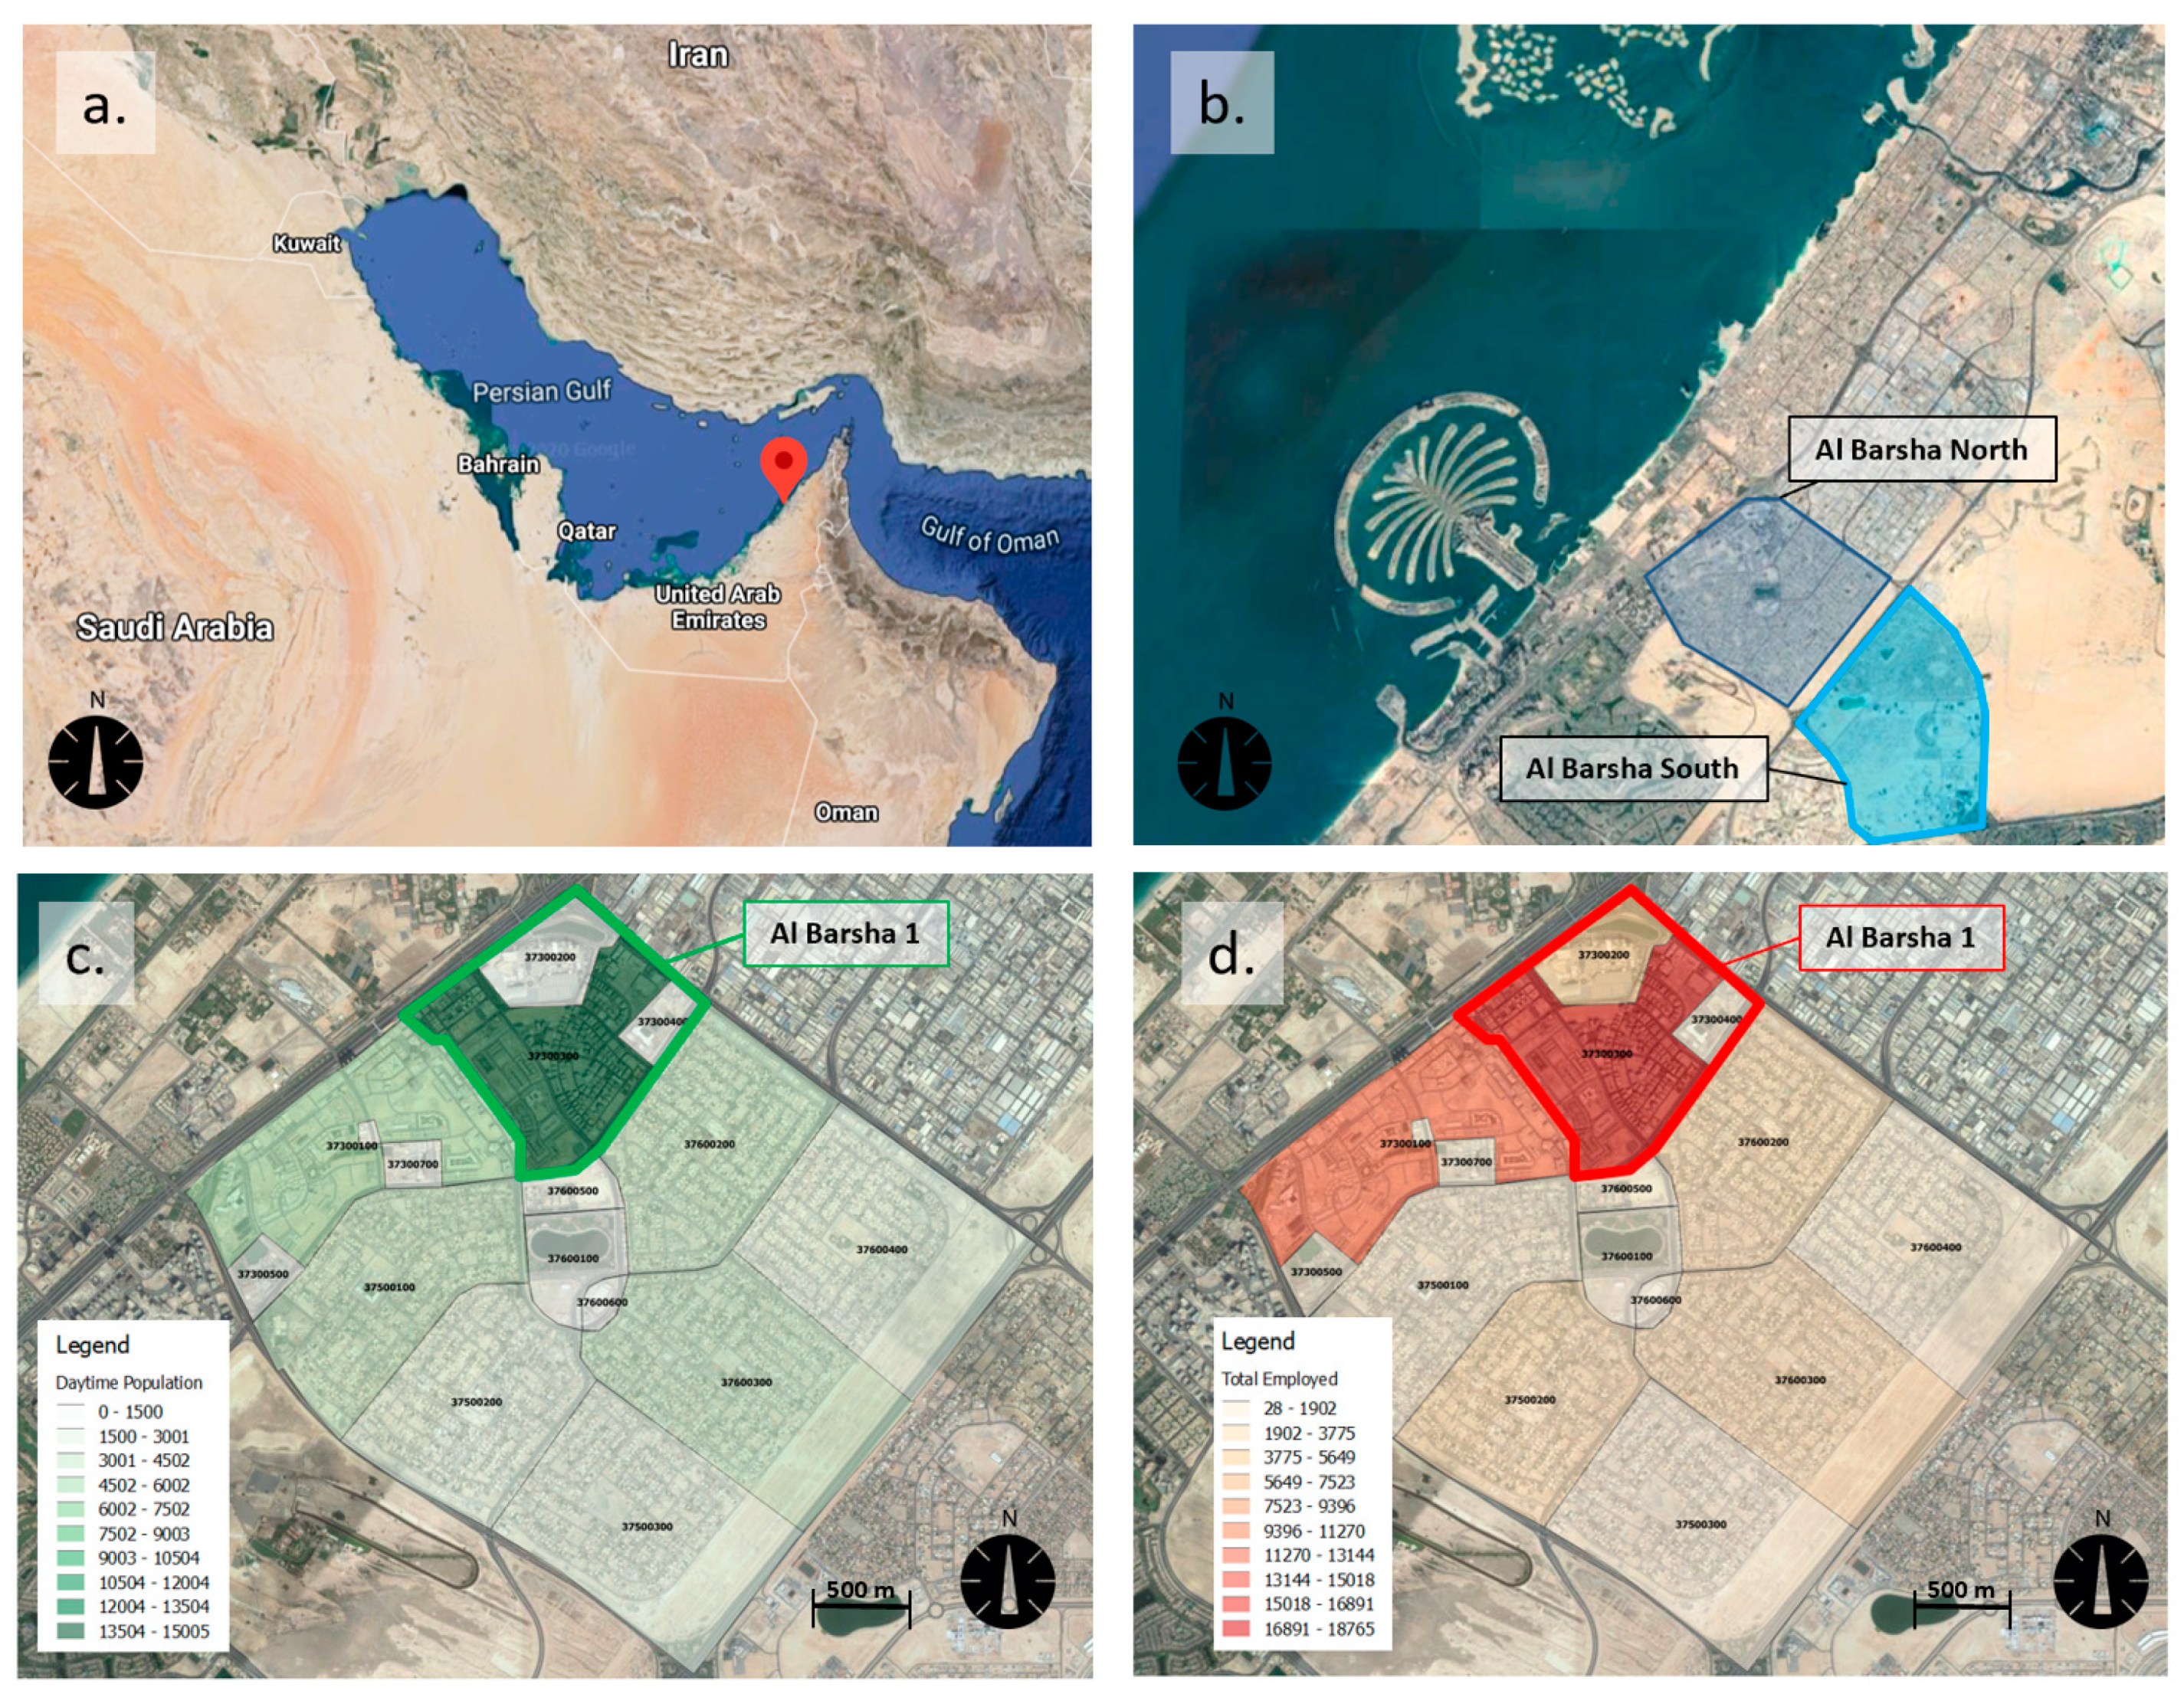
The context reference for the case study is the city of Dubai, the largest and most populous in the UAE, laying on the southeast coast of the Persian Gulf and capital of the Emirate of Dubai (
Figure 1a). In September 2016, the Dubai Future Accelerators selected MVMANT for a 12-week innovation and acceleration program aimed at transforming the city of Dubai into a global testing ground for cutting-edge ideas and technologies. MVMANT is an urban mobility platform which enables the deployment of a dense fleet of vehicles circulating on a fixed-route and the forecast of the mobility flow, coupled with the requests in real-time generated by customers. MVMANT worked closely with the local government transport authority to the implementation of its smart mobility solution in the city of Emirate. The service was tested in two districts located in the vibrant heart of the city—i.e., Al Barsha 1, one of the neighborhood of the Al Barsha district, which life gravitates around the “terminus” Mall of Emirates (including both a commercial center and a metro station), characterized by users moving mainly for shopping and leisure (
Figure 1b); Dubai Internet City, which gravitates around the “terminus” Nakheel MS Seaside (a metro stop), refers to a business center area, and is characterized by home-work journeys.
This paper aims at reproducing MVMANT service via the ABM, evaluating the performance of different vehicle dispatching strategies and service configurations. Simulations have been performed for the district of Al Barsha 1, where the service covered an area of about 3 km
2 and has been particularly successful in connecting the different parts of the district with each other and with the main point of interest, i.e., Mall of Emirates. The demographics available for the area, supplied by the local authorities to the MVMANT company, refer to 2014; the resident population of the area is approximately 15,000 inhabitants (
Figure 1c), while the number of employees is higher (approx. 18,000,
Figure 1d) mainly due to the presence of the Mall.
Model characteristics and simulation parameters will be described in the following.
The ABM used in this study has been built within NetLogo, a free open-source software based on an agent-based programming language and integrated modeling environment [
26]. The main features of the model are the (a) transport network, (b) demand model, (c) agent (user and vehicle) dynamics, (d) assignment of route choice strategies and (e) indicators to evaluate the model’s performance.
3.1. Transport Network
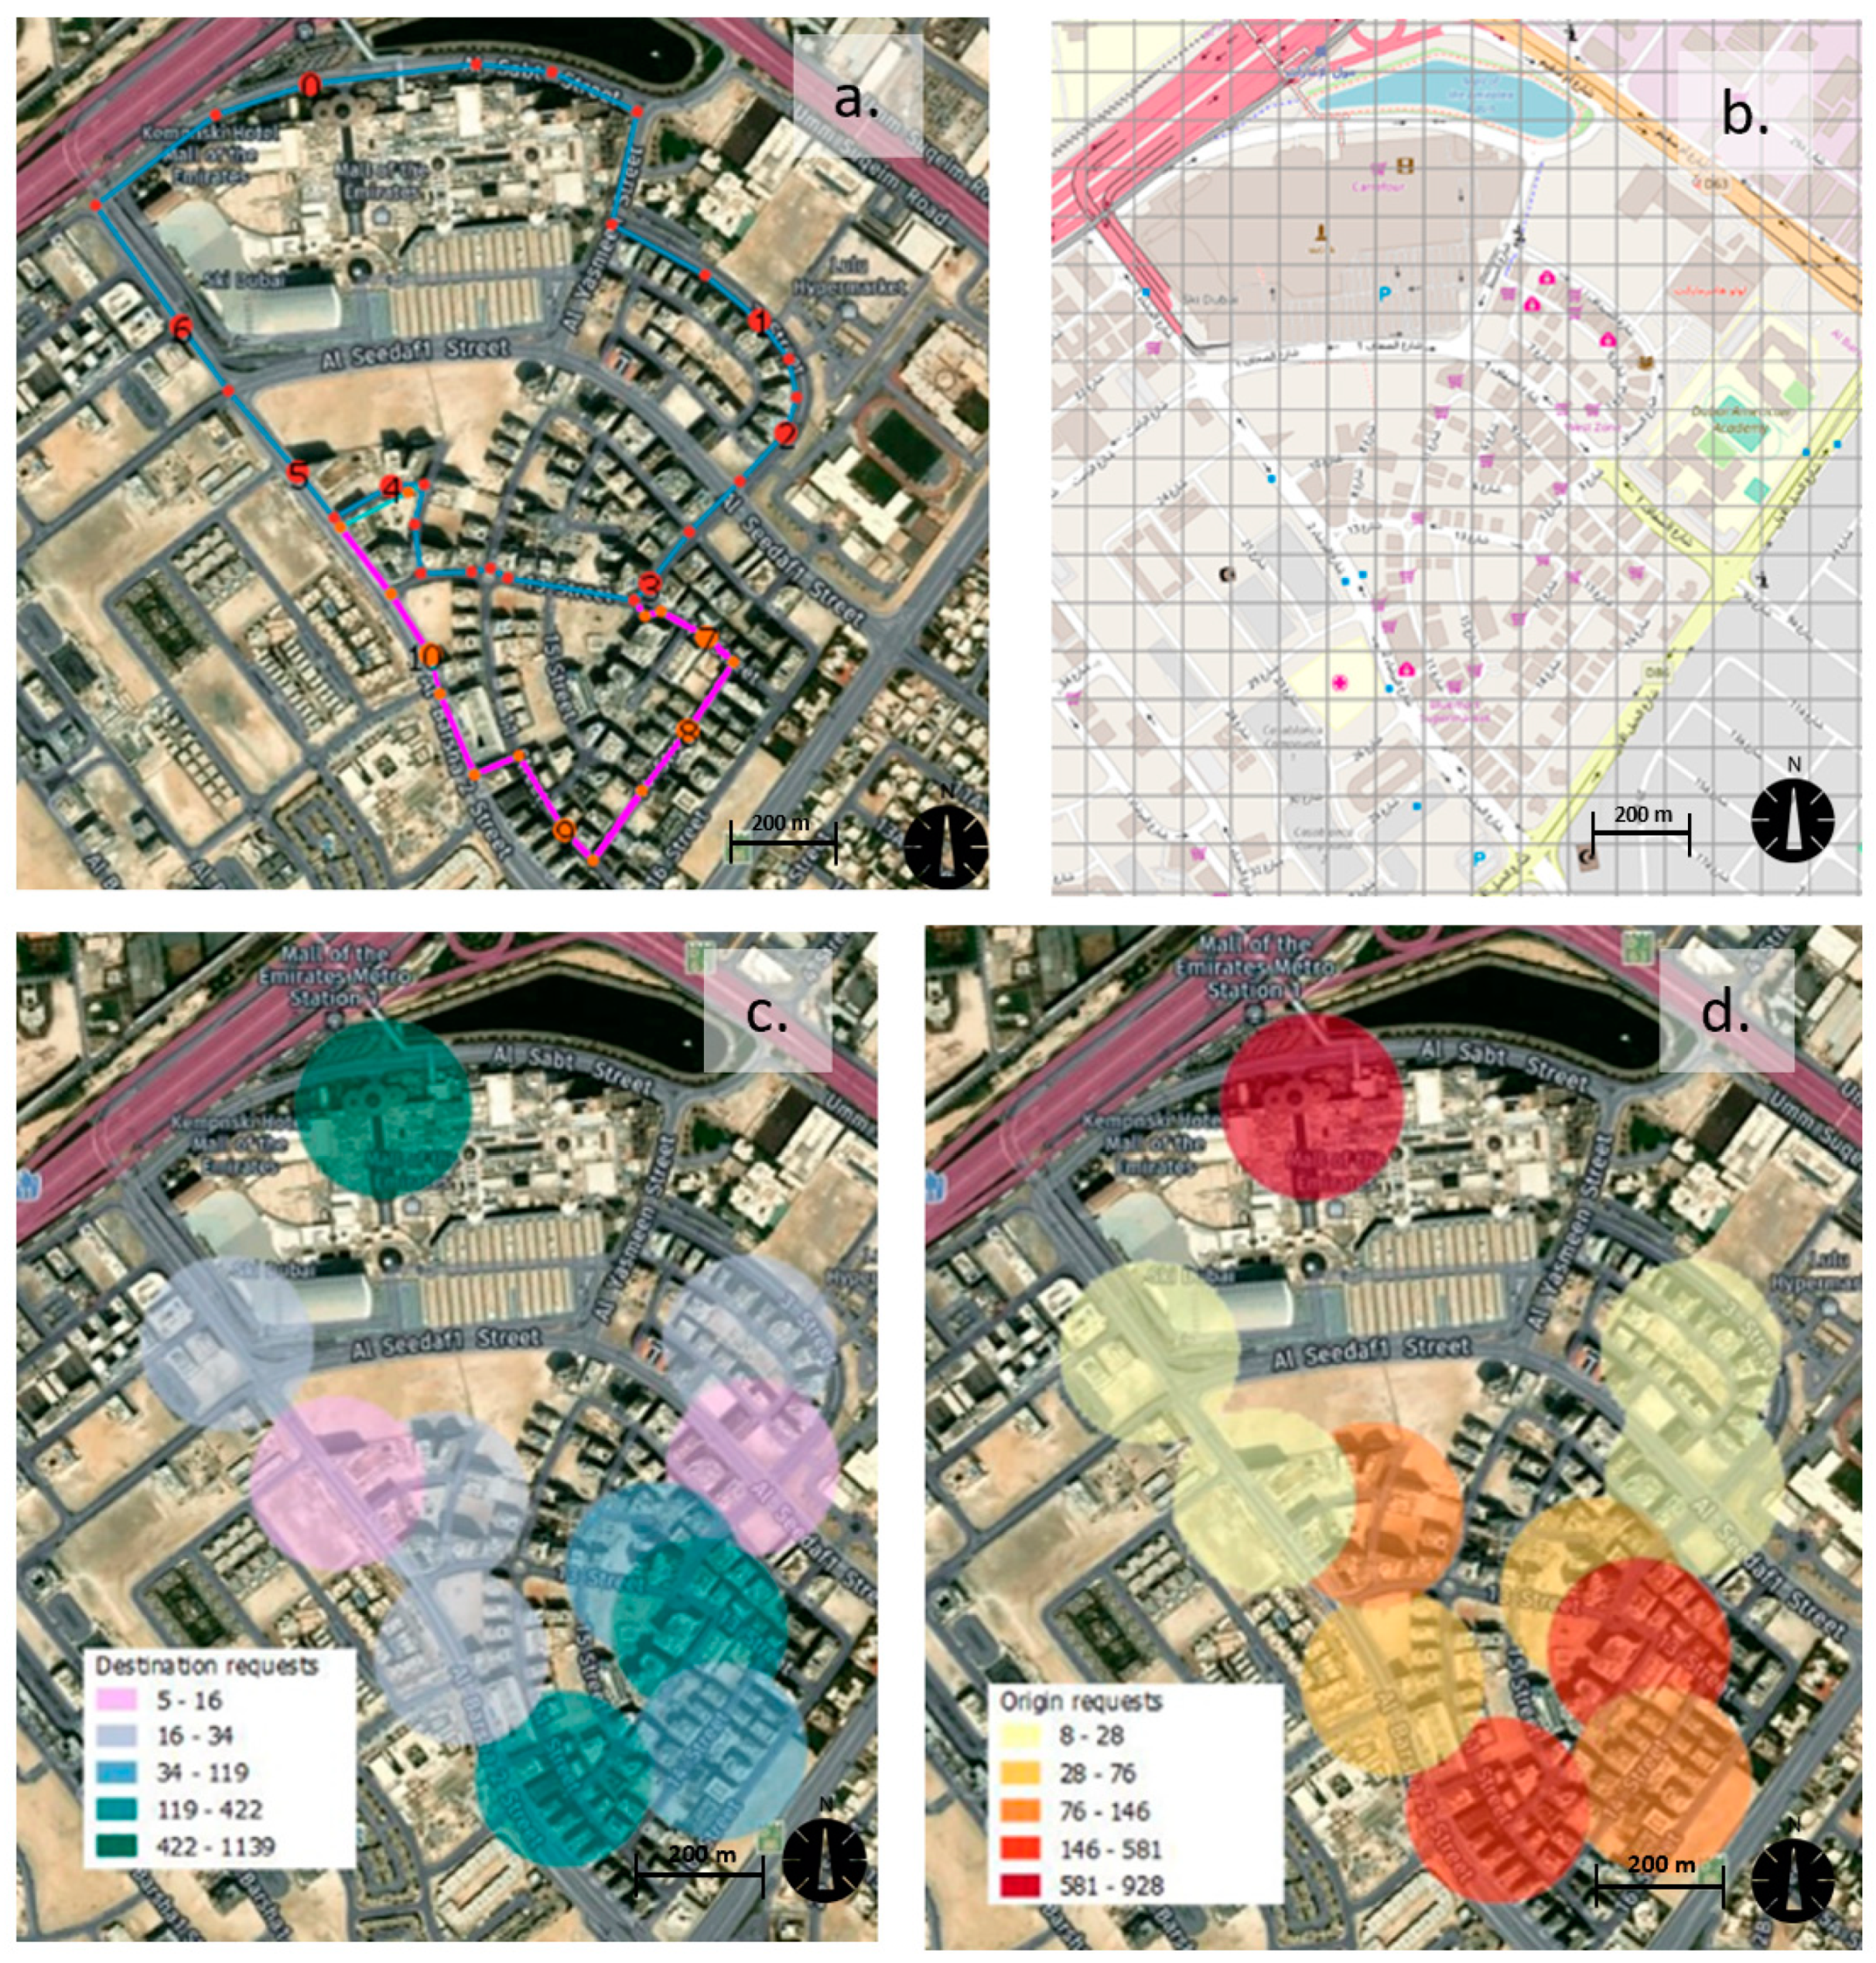
The model’s network, based on the actual road network, is built with a fixed-route and different optional routes, composed of links, stop nodes and diversion nodes (to skip from fixed to optional routes). Dubai’s network used for MVMANT service was reproduced in the ABM (
Table 1) with fixed (dark blue) and flexible (pink) routes (
Figure 2a).
Through the GIS extension of NetLogo, a GIS dataset is used both to build the actual road network and implement a georeferenced real dataset of origin-destination (OD) requests, collected during the MVMANT service’s first weeks of tests..
3.2. Demand Model
The demand model is based on previous works developed by the authors [
10]. However, in this work, the demand model has been improved by using real-world observed data for trips origin and destinations. A trip request is randomly generated in the network following the Poisson distribution with an average trip rate ATR, suited for simulating booking processes, particularly when demand rate is low, and requests can be considered independent [
27]. The trip rate
TRij from an origin
i to a destination
j is calculated via a gravitationally distributed model as in Equation (1):
where
TRi is the generation trip rate of zone
i, and
pij is the probability that a trip with origin
i has destination in
j. TRi is proportional to the density of trip origins (
TOi) and to an average trip rate (
ATR) set at the beginning of the simulation (see Equation (2))
while
oij is calculated via Equation (3):
where
j is the number of trip destinations located at zone
j,
dij is the distance from
i to
j,
α and
β are the parameters of the decay function
f(d) in Equation (4):
3.3. Agent (Passenger and Vehicle) Dynamics
A trip request of a passenger group (with a maximum prefixed size) is stochastically generated, according to the demand model. The user group’s trip request can assume three different status:
“Rejected”, if the distances from the origin destination (OD) stops overcome a prefixed threshold;
“Waiting”, if the OD pair is within the distance range, and the users’ group moves to the nearest stop;
“Satisfied”, when a vehicle with an appropriate number of available seats reaches the stop, each user boards and alights at the nearest stop to its required destination; this is an indicator of the satisfied demand of service within the accepted requests;
“Unsatisfied”, if no vehicle reaches the passenger group within a maximum waiting time.
At the beginning of the simulation, the number of vehicles, their seat capacity and their speed are set, and vehicles are generated at random stops. As far as the vehicle dynamics is concerned, each vehicle starts traveling along the fixed-route until it stops where waiting users are loaded following the first-come-first-served queue rule, updating available vehicle’s seats. If waiting users or on-board passengers’ destinations are present, a vehicle can shift to an optional route at diversion nodes according to the route choice strategy.
3.4. Route Choice Strategies
Vehicles can be assigned to different Route Choice Strategy (RCS), i.e.:
FX—“fixed-route”, each vehicle drives only on the fixed-route;
FR—“fully random”, each vehicle at a diversion node randomly chooses to go on the flexible route; approximately, half of the vehicles will drive on the flexible route, and the other half will keep on driving on the fixed-route, until the next diversion node is reached;
AVAR—“full vehicles drive on all flexible routes”, each vehicle is allowed to drive on a flexible route, but it chooses to do so only when a boarded passenger has to leave, or they is waiting at a stop or according to a random component;
EVAR—“each vehicle is assigned to a flexible route” with a prefixed percentage of vehicles assigned at random; in the case of Al Barsha, since there is only one optional route, EVAR with 0% randomness corresponds to ER.
FR, AVAR and EVAR strategies can have a randomness component. This component refers to the possibility that the vehicle would follow a different route from the one indicated by the RCS. For example, in the case of AVAR strategy, where all vehicles always drive on the flexible route, it could happen that a percentage of vehicles’ trips would skip driving the flexible route (even if demand is present). This is to test its role since it has been demonstrated that it can increase the efficiency of social and economic complex systems (see References [
28,
29,
30]).
4. Results
NetLogo programming environment allowed the development of a flexible and user-friendly simulation interface that easily changes variables and monitors the state of the system in real-time.
From the analysis of OD data collected during the first weeks of MVMANT service (while it still was in operation), it was possible to derive a peak hour demand rate in the range between 50–60 requests per hour. For scenario simulations, a demand rate equal to 100 requests per hour was chosen to simulate a higher demand that, in principle, could be satisfied by the service. The GIS zoning implemented in the simulation is based on a squared grid layer (100 m × 100 m) where each zone is assigned with the information related to the number of OD requests (
Figure 2a); the demand model then takes into consideration the requests generated at a maximum of around 300 m from the centroid of the zones (
Figure 2b,c).
4.1. Scenario 1: Test of Route Optimization and System Efficiency Based on RCS
The first set of simulations considered all the different RCS with increasing levels of randomness, to test routes and the overall system performance. Three types of input variable were considered: service and demand variables, and RCS. Main input data are summarized in
Table 2.
A set of performance indicators (
Table 3) has been analyzed during the simulation to test the impact of different vehicle dispatching strategies on service efficiency and effectiveness. Indicators evaluate the quality of transport service, its sustainability and the overall benefit brought to society. They are chosen to capture the different objectives and points of views of the system actors—i.e., (1) a user is interested in reducing the trip cost (length, travel time, fare); (2) a private company providing the service is interested in maximizing the profit, by increasing the number of passengers within a prefixed travelled distance or, conversely, reducing the amount of travelled distance to serve a prefixed demand; (3) the community is interested in reducing transport externalities, i.e., pollution and congestion.
The total unit cost (TUC) indicator is evaluated according to Equation (5), taking into account the total passenger travel time total user travel time (TPTT) (h), the value of time VOT (€/h) for passengers, and the vehicle operation cost (OC) (€):
it considers the cost of users (with the VOT and the TPTT, which users would like to have as low as possible) and the cost of the operator per each transported passenger, so it can be seen as a unit cost for the transport system (demand and supply) as a whole.
From the comparison among the difference RCS, it is possible to evaluate the efficiency of each route in relation to the performance indicators.
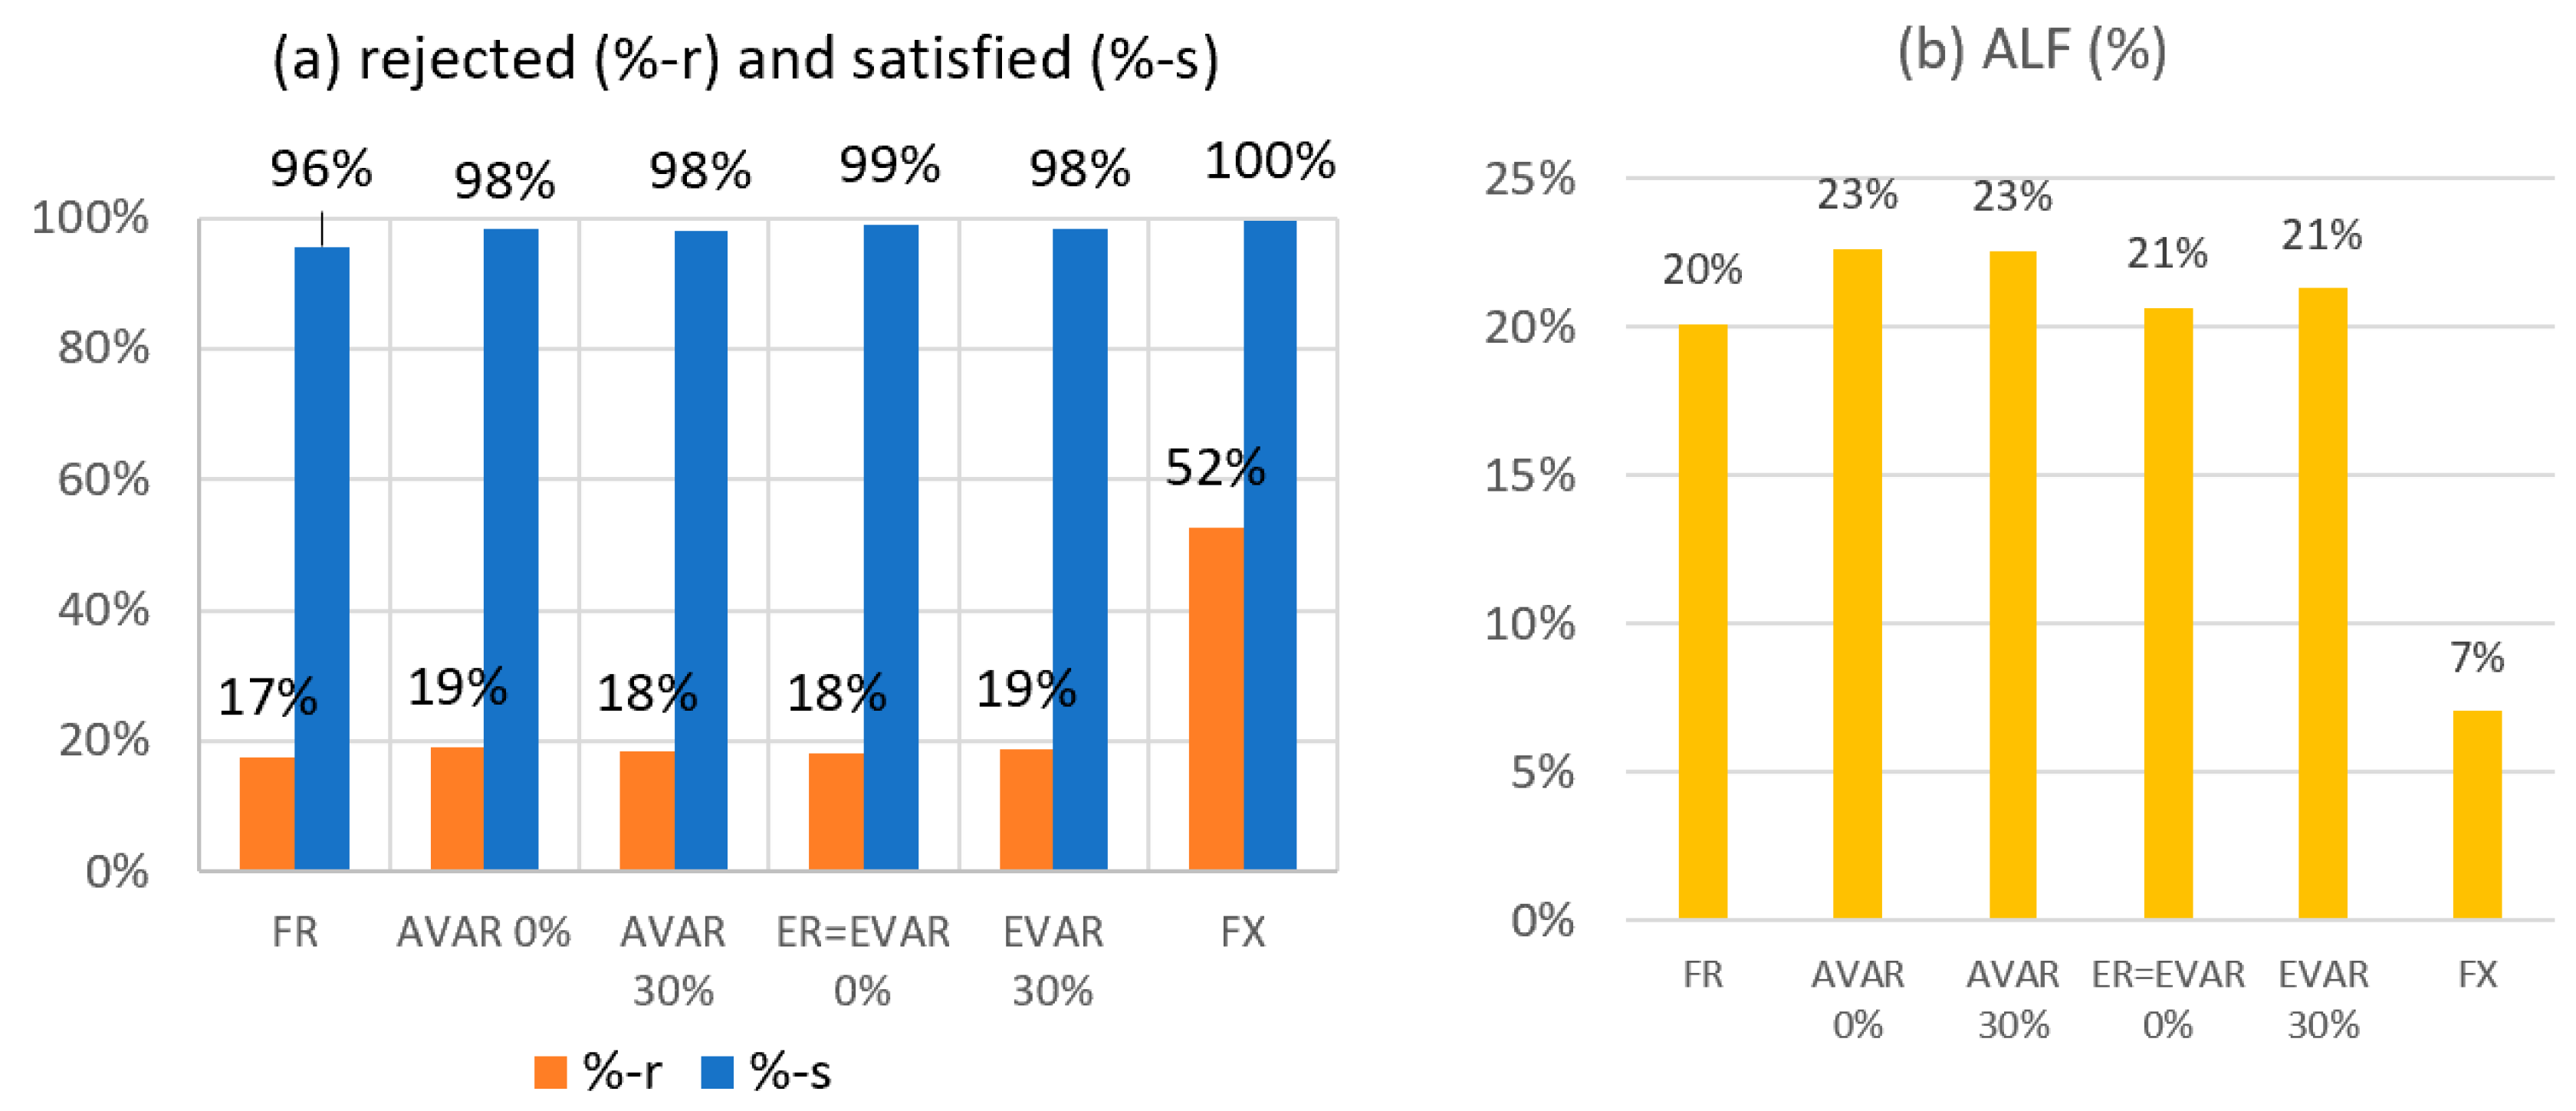
Service coverage (% – r): With regard to the percentage of rejected requests (
Figure 3a), it is possible to see how, in comparison to any other strategy, FX reports a potential loss of 33% of requests in the catchment area. This shows the importance of the introduction of the optional route in order to expand the accessibility of users in the study area.
Demand satisfaction (% – s): Demand satisfaction keeps above the 95% for all strategies (
Figure 3a), indicating the possibility of extending the service to a greater catchment area, without changing operation costs.
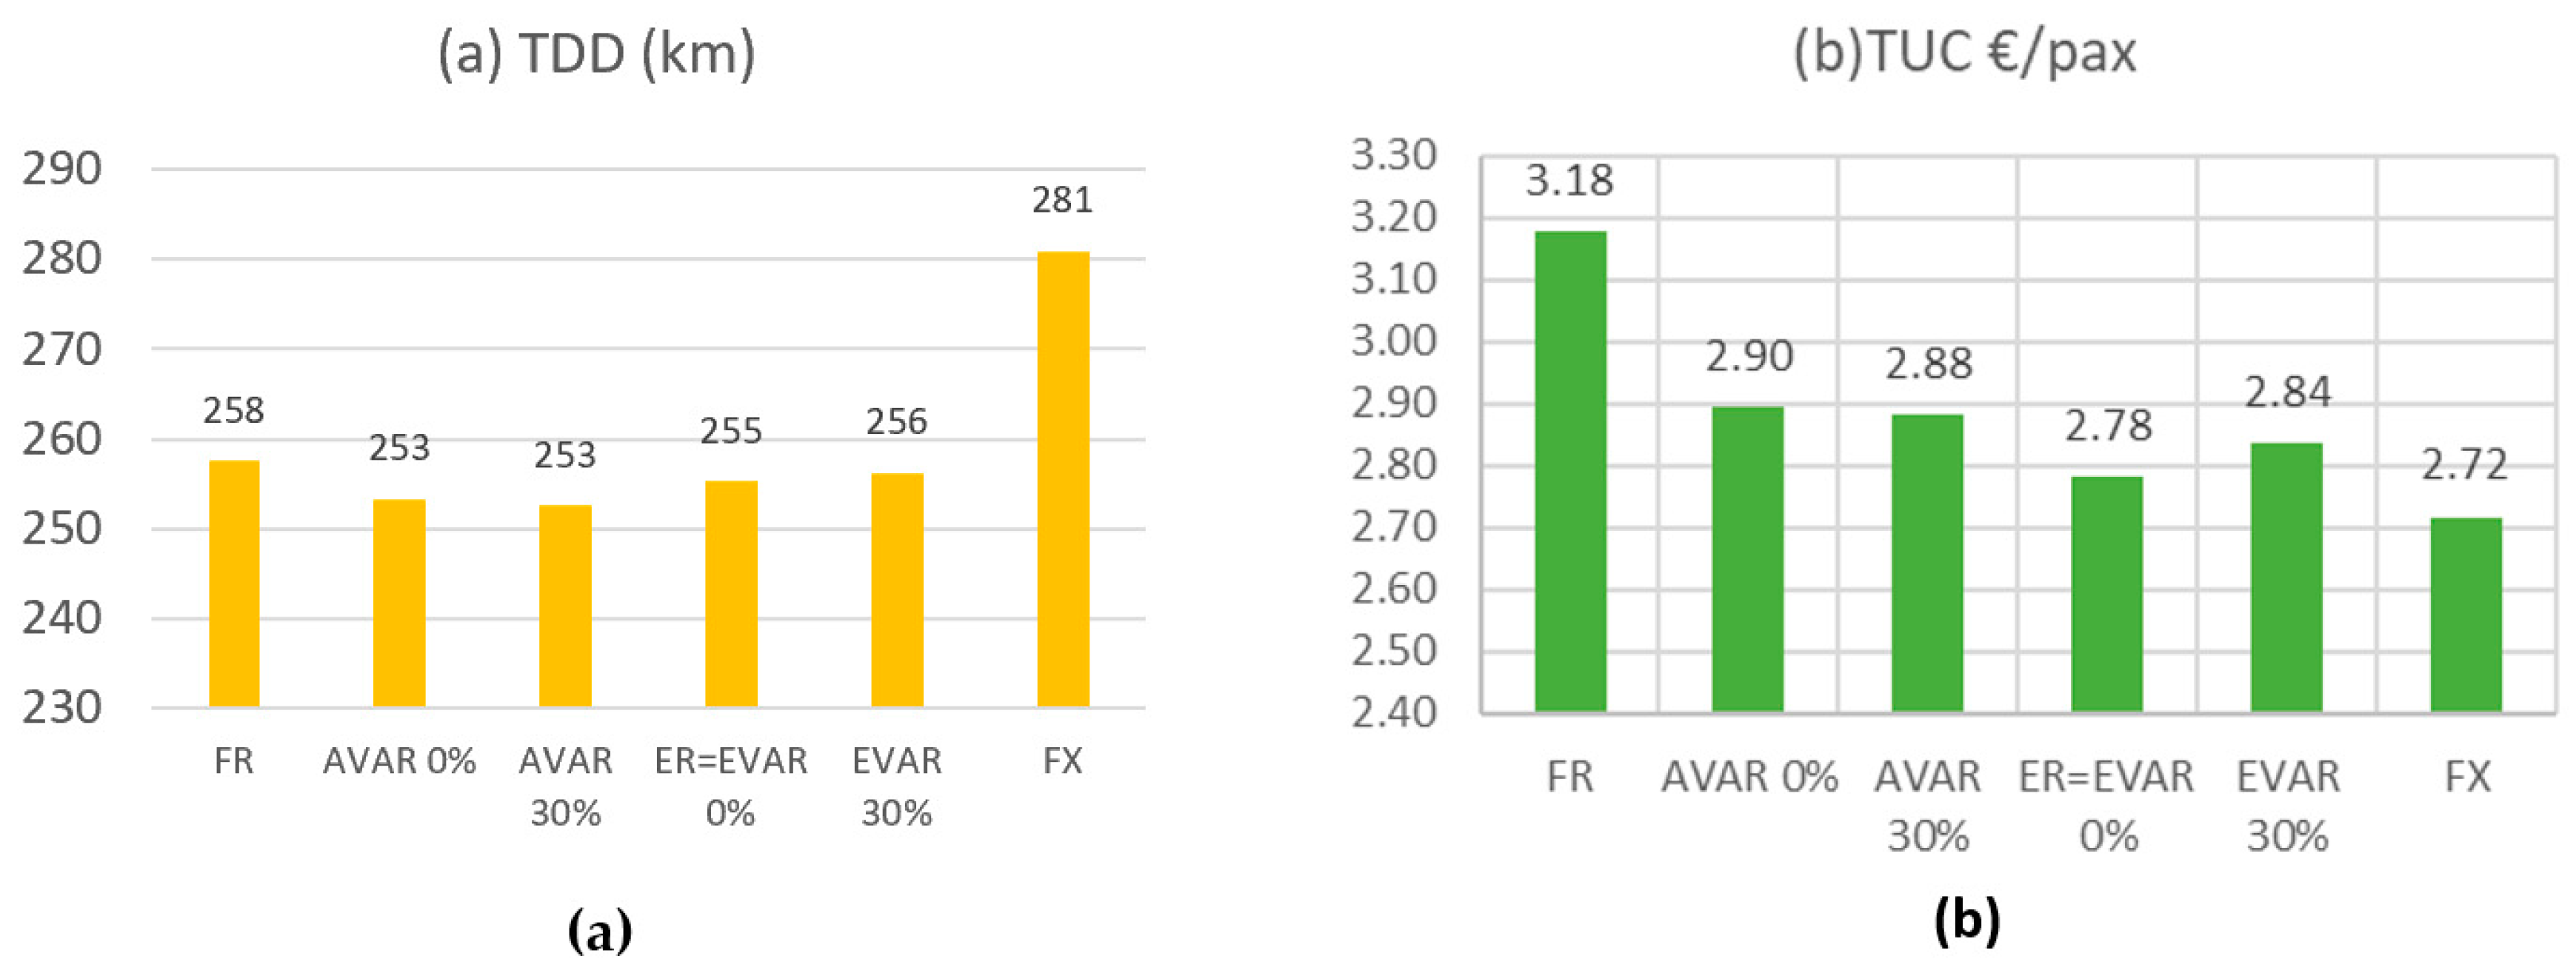
Operator profit (average vehicle load factor (ALF) and total driven distance (TDD)): From the point of view of the operator, it is important to perform high load factors (to increase revenues) and low driven distances (to reduce operation costs); those two factors can be measured through ALF and TDD indicators, which assume their best values for AVAR strategy (
Figure 3b and
Figure 4a). This means that, for the case study under consideration, and from the point of view of the operator, assigning all vehicles to the flexible route, but only when demand is present, would be the best way to satisfy more demand while minimizing the travelled distance. This will also have a direct impact in terms of carbon and local pollutants emissions.
Total unit cost: If one considers both the point of view of the operator and of passengers, it results that the worst strategy in terms of TUC is FR, while the other performs similarly (
Figure 4b). The low value assumed for the FX strategy clearly depends on the fact that routes are shorter, implying a lower value of total passenger travel time. While, if one considers the environmental impact, then AVAR should be preferred, since it implies less travelled distance and higher load factor. In this respect, some carbon credit mechanisms could be defined from policymakers to take into considerations environmental concerns (see, Reference [
31]). However, the FX strategy would clearly provide more than 50% of rejected requests, as shown in
Figure 3a, and this would be socially unsustainable. While, for an equally good value of coverage, the best strategy in terms of TUC is the EVAR with 0% of randomness, corresponding to ER. A similar result was found in the case of Ragusa described in Reference [
10].
4.2. Scenario 2: Comparison to other DRST Services
This second set of simulations tests different DRST services in terms of vehicle capacity and evaluates the economic efficiency of each system in relation to TUC. The scenario takes into account two services with the following characteristics:
A flexible transit service with minibus (comparable to the actual MVMANT service);
A ride-sharing with small vehicles, capable of collecting up to two requests at a time (comparable to typical ride sourcing operators providing services like a shared taxi).
The main input data are summarized in
Table 4; unlike the other tested scenarios, in scenario 2, the number of vehicles will be one of the main outputs.
The number of vehicles: The first output of simulations is that, in order for the ride-sharing service to achieve at least the 85% of satisfied users, six small vehicles are needed; two vehicles with a capacity equal to 19 seats are needed for the minibus system.
Additional time and Distance: In order to assure the expected level of service, operators should minimize the additional time and distances travelers have to experience. One can consider the additional travel distance (ATD), depending on average passenger on-board time (AoBT) and average vehicle speed (as a function of TDD, simulation time and number of vehicles), and the additional travel time (ATT), related to average passenger waiting time (AWT) and AoBT. In the comparison between the two services, passengers of the minibus travel on average the same distance than those traveling by the ride-sharing service, with an additional time of three minutes (
Table 5). This implies that the two services are comparable in terms of the additional distance experimented by a passenger when sharing a trip with others, but the flexible transit achieves less TDD because of the reduced numbers of vehicles used. Of course, this can be easily converted into pollutant emissions.
Total Unit Cost: Ride-sharing service’s TUC assumes a value equal to more than the double of the same service performed via a minibus (
Table 5). This implies that the supposed transport demand can be easily satisfied by a flexible transit service rather than a shared ride-sharing service with more vehicles of lower capacity.
4.3. Scenario 3: Optimization of Vehicle Capacity Based on Demand Fluctuation
This third set of simulation analyses the efficiency of the system as the number of available seats varies, and according to the fluctuation of demand during the week. Based on the analysis of the real-word data coming from the pilot, a demand rate of 50% of the weekdays has been adopted for holidays. Vehicles with 19 seats (corresponding to the MVMANT service), eight seats and four seats have been used to perform the simulations. The main input data are summarized in
Table 6.
TI—transport intensity (km/pax): This indicator represents kilometers travelled for each passenger (km/pax) and companies providing the service are interested in having low values of TI. The main result of this analysis is that a 19-seats vehicle is good for the weekday demand rate, while the 8-seats vehicle is the best solution during the holidays (
Figure 5). This suggests that, in order to be efficient, the service could be tailored according to the fluctuating demand, by using a heterogeneous fleet of vehicles. This also has interesting implications in terms of environmental impact, with low-capacity vehicles emitting less pollution than high-capacity ones. Once again, incentive mechanisms or restrictive policies (i.e., a limited traffic zone) could be useful to include environmental concerns in the planning and operation of such services.
5. Conclusions and Discussion
This paper presented the results of agent-based simulations of the on-demand flexible transit service called MVMANT, recently experimented in the city of Dubai. The aim was to test its performance by reproducing the service in the district of Al Barsha 1, changing important service characteristics, like route assignment and vehicle capacity, and comparing it with alternative shared transport services. An already implemented ABM was used to this purpose, calibrating it via georeferenced real dataset including OD couple requests collected during the first weeks of the service. The paper demonstrates the flexibility of the model to reproduce different services and contexts and provide useful suggestions for its correct planning and management.
Results of the simulations of this flexible transit service highlighted the: (1) Importance of introducing an optional route in order to expand the accessibility of users in the study area; (2) possibility of extending the service to a greater catchment area, without changing operation costs; (3) importance of a pre-scheduling of vehicles to passengers and routes and its reflection on economic performance parameters. Besides, the comparison of the minibus flexible transit service provided by MVMANT with a ride-sharing service with small vehicles showed that the former is more convenient than the latter in terms of a total unit cost accounting both for operator and user points of view, in the hypothesis of guaranteeing a minimum demand satisfaction level of 85%. Finally, fluctuation of demand during the week was considered in the simulations, showing the efficiency of a 19-seats minibus during the weekdays, while suggesting the adoption of a smaller vehicle (with eight seats) during holidays. From an environmental point of view, some useful suggestions can be derived from the results. In this respect, policymakers should adopt push and pull measures so to include environmental concerns in the planning and operation of such flexible services. As an example, operators can decide to use a heterogeneous fleet based both on service efficiency and on policy restrictions (e.g., a time-of the day and vehicle-dependent limited traffic zone).
Other useful policy implications could be derived by changing other service variables. As an example, it would be interesting to understand how this flexible service would perform if one considers a “delay” time at the terminus “Mall of Emirates”, as a standard bus. In this respect, from a simple evaluation based on real data from the pilot, it resulted that the introduction of a 3–minutes delay time of the vehicles at the terminus would lead to a reduction of about the 15% of necessary rides (and thus, of travelled kilometers). The increase in service efficiency with the introduction of a delay time at the terminal could be due to the greater number of passengers that the service will be able to serve, but also because, being a low-demand area, the vehicle would travel less kilometers while empty. It would be interesting to verify this scenario via the ABM, evaluating its feasibility, taking into account the increase in passenger travel time. Future research should also aim at improving demand estimation, by looking at the preferences of users for different service configurations and include more direct environmental evaluations, both related to global emissions (i.e., greenhouse gases) and to local pollutants (e.g., PM10, NOx). A combination with other evaluation approaches, like stated preference surveys or multicriteria decision-making techniques, would be suitable both to investigate agent preferences, and to evaluate different scenarios according to multiple criteria of judgment (environmental, social and economic) [
32,
33,
34,
35,
36]. In this respect, an analysis of different options from the sustainability lens would be interesting, especially in comparison with private mobility, starting from a rough estimation of the travelled distances (per passenger) of private vehicles satisfying the same demand. Finally, it would be important to understand how this type of service should be integrated with other transport services, in order to guarantee a seamless transport system following the approach of mobility as a service (MaaS).
All these evaluations are useful to support decision-makers in planning, management, and optimization of innovative transit services, which have a great potential to reduce car dependency and increase accessibility—especially in cities characterized by fast economic growth, resulting in heterogeneous mobility needs and economic and social inequalities.

 ,
, 


