Article

Polyurethane Foams and Bio-Polyols from Liquefied Cotton Stalk Agricultural Waste

Graduate School of Science and Engineering, Saitama University, Saitama City, Saitama 338-8570, Japan
*
Author to whom correspondence should be addressed.
Sustainability 2020, 12(10), 4214; https://doi.org/10.3390/su12104214
Submission received: 9 April 2020 / Revised: 15 May 2020 / Accepted: 19 May 2020 / Published: 21 May 2020
(This article belongs to the Section Sustainable Chemical Engineering and Technology)

Abstract

:
Cotton is planted on a large scale in China, especially in the Xinjiang Region. A large amount of agricultural waste from cotton plants is produced annually, and currently poses a disposal problem. In this study the product after liquefaction of cotton stalk powder was mixed with diphenylmethane diisocyanate to prepare polyurethane foams. The effects of the liquefaction conditions on the properties of the polyols and polyurethane foams produced using cotton stalk were investigated. The optimal processing conditions for the liquefied product, considering the quality of the polyurethane foams, were studied as a function of the residue fraction. Bio-polyols with promising material properties were produced using liquefaction conditions of 150 °C, reaction time of 90 min, catalyst content of 3 wt.%, and 20 w/w% cotton stalk loading. We investigated the optimal processing conditions for producing bio-foam materials with mechanical properties comparable to those of petroleum-based foam materials. This study demonstrated the potential of cotton stalk agricultural waste for use as a feedstock for producing polyols via liquefaction. It was shown that polyethylene glycol 400 (PEG400) and glycerin can be used as alternative solvents for liquefaction of lignocellulosic biomass, such as cotton stalk, to produce bio-polyol and polyurethane foams.

1. Introduction

The current concerns for the environment and limited availability of petrochemical resources have resulted in the use of lignocellulosic biomass attracting considerable attention, as it is biodegradable, readily available, and renewable [1]. Lignocellulosic biomass from forestry and agriculture could be an abundant feedstock for producing biofuels, such as fuel oil, and bio-based chemicals. Bio-polyols obtained using the thermochemical method, e.g., pyrolysis or liquefaction of lignocellulosic biomass, have promising properties for manufacturing formaldehyde resins [2,3] and bio-based polyurethane foams [4,5] with comparable attributes to their petroleum analogs.
Liquefaction of biomass is an effective method for processing biomass resources, which is classified into two categories based on the reaction conditions [6]: (1) a process requiring a high reaction temperature and pressure-proof reactor; and (2) a process performed using reactive solvents, i.e., phenols, polyhydric alcohols, and carbonates, in the presence of strong acid at relatively low temperature and atmospheric pressure. The liquefaction conditions for woody biomass at temperatures below 200 °C have been optimized in the second category [7,8,9]. These processes are based on solvolysis of lignocellulosic materials, where the liquefaction products can be used as raw materials for producing valuable polymer products.
The pore size and density of foams produced from bio-based feedstocks can be easily manipulated to meet the needs of various applications. Polyols (polyether and polyester) and isocyanate are the two main raw materials for producing polyurethane foam, and are currently obtained from petroleum-based products [10]. The major drawback of petroleum-based products is that they are non-renewable and not biodegradable. Due to increasing concerns over dwindling fossil resources and the environmental impact of their use, obtaining polyols from renewable biomass is an attractive alternative for the polyurethane industry. Most biomasses consist of cellulose, hemicellulose, and lignin, which contain more than one hydroxyl group in the molecular chains, which can be used as an alternative to petroleum-based polyols for preparing polyurethane materials [11]. Agricultural wastes, such as cornstalks and wheat straw, are eco-friendly and readily available feedstocks for sustainable production of energy and chemicals [12]. We previously achieved liquefaction of woody biomass using mixed solvents of alcohol and water, without requiring a catalyst [13]. The use of agricultural residues for producing high-value bio-products can help build a sustainable economy while having a significant positive impact on the environment. To date, there has been little research on liquefaction of cotton stalks for bio-polyols and the subsequent production of polyurethane foams.
Cotton stalks are rich in cellulose and have the potential to be used as a feedstock for the production of paper, industrial fuel, and composites. Currently, cotton stalks and other agricultural waste are generally burned, which wastes potential resources, pollutes the environment, and results in health problems for farmers. A large amount of energy and resources are being used for the current economic development in China. The increasing use of fossil fuels and burning of agricultural waste have exacerbated pollution problems, especially in urban areas. Therefore, it is meaningful to study methods for increasing the value of all biomass, while reducing environmental pollution. Previous studies have focused on the applications of cotton stalks as a renewable energy resource, which can be converted into bioethanol using available pretreatment methods to meet biofuel requirements. However, few studies have focused on cotton stalks as a feedstock for polyurethane materials. The aim of this study was to demonstrate a process for liquefying cotton stalk powder using polyethylene glycol (PEG) 400 and glycerin as liquefaction solvents.

2. Materials and Methods

2.1. Materials

Cotton stalk samples were obtained from Toksun farm (42.79° N, 88.83° E), which is a part of Turpan Agriculture, Xinjiang Province, China. The cotton stalk was air-dried, ground, and then sieved to give fractions with a particle size below 250 µm. It was then dried for 24 h in an oven (model: AS ONE ON-300) at 105 °C before use, and used in the way according to Wang et al. [12]. The chemical composition of the cotton stalk is shown in Table 1. We measured the cellulose, hemicellulose and lignin of cotton stalk in the same way as a previous study [14]. Additives used in the polyurethane foaming process included polymeric methylene-4,40-diphenyl diisocyanate (PMDI; Japan Polyurethane Ind., Ltd., Tokyo, Japan), silicone surfactant (SH193; Toray Dow Corning Silicone, Ind. Ltd., Tokyo, Japan ), and dibutyltin dilaurate (Wako Pure Chemicals, Ind. Ltd., Japan). All other reagents were of analytical grade (Wako Pure Chemicals, Ind. Ltd., Japan). All chemicals used in this study were reagent grade and used without further purification.

2.2. Experimental Methods

2.2.1. Liquefaction of Cotton Stalk with PEG and Glycerin

PEG and glycerin were used as the liquefaction reagents with a ratio of 4/1 (w/w%), with a solvent to cotton stalk ratio of 3/1– 6/1 (w/w%). The required amount of catalyst was added, and all reagents were mixed in a 500 mL three-neck reaction flask equipped with a stirrer and reflux condenser [14]. Then, the reaction flask was immersed in a preheated oil bath at five different temperatures: 120 °C, 130 °C, 140 °C, 150 °C, and 160 °C. After different liquefaction reaction times of 15, 30, 60, 90, 120, 150, 180 or 300 min, the liquefied cotton stalk samples in the flask were collected and placed in a vial for further analysis. The vial was immersed in cold water to stop the liquefaction reaction. To filter the residue, 10 mL of methanol was added to the vial and combined well using a shaking apparatus. Filtering was performed by using a pump (EVP-1000, KNF, EYELA, Japan) and filters (C5, ADVANTEC). Then, the filtered residue was dried for 24 h in an oven at 105 °C. The residue fraction was calculated by dividing the weight of the residue in the sampling vial by the initial weight of cotton stalk powder added to the reaction flask.

2.2.2. Characterization of Liquefaction Products

The functional groups of liquefied cotton stalk samples were characterized using Fourier-transform infrared spectroscopy (FTIR; Jasco Co. Ltd., Japan) in the same way as a previous study. The liquefied sample was clipped thinly by potassium bromide (KBr) plates, and the pellet was placed in the FTIR instrument for measurement. The residue from liquefaction experiments was also characterized by FTIR after preparing pellets with 1 mg of sample and 100 mg of KBr. The infrared spectrum was recorded in the 2000 to 500 cm−1 range by averaging 32 scans with a resolution of 4 cm−1 [12].
The average molecular weights of liquefied cotton stalk samples were measured using a gel permeation chromatography (GPC) system equipped with a column (KF-802, Shodex, Co. Ltd., Japan), an HPLC pump ( Pump PU-2080, JASCO Co. Ltd., Japan), a column thermostat (CO-2060, Jasco, Co. Ltd., Japan), and a refractive index-detector (RID) (RI-2031, Jasco, Co. Ltd., Japan). The analytical conditions are shown in Table 2 [12]. Exactly 10 mg of the liquefied cotton stalk samples was diluted with 10 mL of tetrahydrofuran (THF), and then analyzed by GPC [15].
The viscosity of liquefied cotton stalk was measured using a viscometer (SV-10/SV-100) and determined at 25 ± 0.1 °C. The vibrating viscometer used the tuning-fork vibration method to calibrate using standard purified water before measurement. For precise measurement, we left the sample at room temperature for 2 h, put 35 mL in the glass sample cup (AX-SV-35), then left the sample as is for a while, after placing the sensor plates and the temperature sensor, to ensure no changes to the sample temperature [14].
The hydroxyl value of the liquefied wood is an important factor as it determines the mechanical properties of the prepared resin. The acid number and hydroxyl values of liquefied wood were measured adapted from Ertaş et al. [16]. The hydroxyl value was calculated with acid values. The hydroxyl and acid value of liquefaction wood were determined by titration. Blank titration was conducted using the same procedure.

2.2.3. Preparation of Polyurethane Foams

Liquefied cotton stalk (20.0 g), 1,4-diazabicyclo [2.2.2] octane (0.400 g), dibutyltin dilaurate (IV) (0.400 g), distilled water (0.400 g), and silicone foam stabilizer (0.800 g) were added to a polypropylene cylindrical container in this order. Then, the mixture was stirred at 500 rpm for 10 min using a stirrer. Then, the stirring speed was increased to 2000 rpm, and the required amount of polyphenyl methane polyisocyanate (PMDI) was quickly added with a syringe. After stirring for 25 s, the stirring rod was removed from the solution. After foaming, the materials were cured at room temperature for at least 2 d and used for various analyses.

2.2.4. Characterizations of Polyurethane Foams

The thermal behavior of polyurethane foam is very important because it is mainly used as a thermal insulator. The thermal decomposition of polyurethane foams was analyzed by simultaneous thermogravimetry/differential thermal analysis (TG-DTA; DTG-60 Shimazu Corporation) to evaluate their thermolysis and combustion properties. The samples (10.00 mg) were tested at a heating rate of 20 °C/min from room temperature to 800 °C under a flow of Ar gas (200 mL/min) [17].
Cylindrical test specimens with a diameter of 35 mm and height of 20 mm were cut from three areas of the synthesized polyurethane foam. The samples were cured at 48 °C and a relative humidity of 50% for 48 h. Then, the volume and weight were measured to determine the bulk density (calculated ignoring surface and internal pores) following JIS-K7222 [18].
The compressive strength of a material is its ability to withstand a compressive load, where the maximum stress can be determined from such measurements. The compressive strength is obtained by dividing the original cross-sectional area of the test piece subjected to compression by the maximum load. The compressive strength of a material that is not crushed when compressed is determined by deforming the material by an arbitrary amount. The compressive strength (σ) (kPa) was measured according to JIS-K7220 [18].
σ = F m A 0 × 10 3
where Fm is the maximum force reached for a 10% deformation rate (N), and A0 is the initial cross-sectional area of test piece (mm2).
Polyurethane foam specimens were immersed in liquid nitrogen and frozen, and then fractured into two pieces using pliers. The pieces were fixed to a sample holder using carbon tape, and then coated with Au–Pd using a vacuum sputter coater to impart conductivity to the sample surface. The coated sample was placed in the sample chamber of a scanning electron microscopy (SEM; Hitachi, S-2400) system and observed at an accelerating voltage of 15 kV.

2.2.5. Biodegradation of Polyurethane Foams

Soil embedding tests were used to determine the rate of biodegradation of polyurethane foam following procedures given in the literature [17,19]. Samples were cut into specimens of 20 (width) × 20 (length) × 20 mm (thickness). The specimens were weighed and then embedded in soil with certain microorganisms for a period of up to one year. The PUF samples were put into the open space at intervals of 12 and 3 rows at a depth of about 5 cm from the ground at 20 cm intervals. The samples were unearthed at intervals of 1 month, then soil was washed with distilled water, sonicated for 10 min, and then dried in an oven at 105 °C. The weight was measured and the weight loss rate of PUF before and after embedding was calculated. The average weight loss of each type of sample was calculated from the average of 3 specimens. The average results are given within the experimental error of <±0.5 wt.% [17]. Eventually, the percent weight loss (WL) was calculated using the following equation:
WL = W d W 0 × 10 2 %
where W0 is the oven dry weight of the specimen (g) before soil burial test, and Wd is the oven-dry weight of the sample after soil burial test (g).

3. Results and Discussion

3.1. Effects of Liquefaction Conditions on the Polyol Properties

The residue fraction is frequently used as an index to quantify the optimal liquefaction conditions. The residue is the unreacted part of the biomass samples or the unresinified stuff generated when a condensation reaction occurs in the liquefied samples [15,19,20]. Therefore, in this study, we examined the reaction conditions that minimize the amount of residue to identify the optimum conditions for the liquefaction reaction, including the reaction temperature, reaction time, the amount of added catalyst. In addition, the amount of liquefied solvent was varied, and the change in the amount of residue in the liquefaction reaction for reaction times of 0–300 min was investigated.

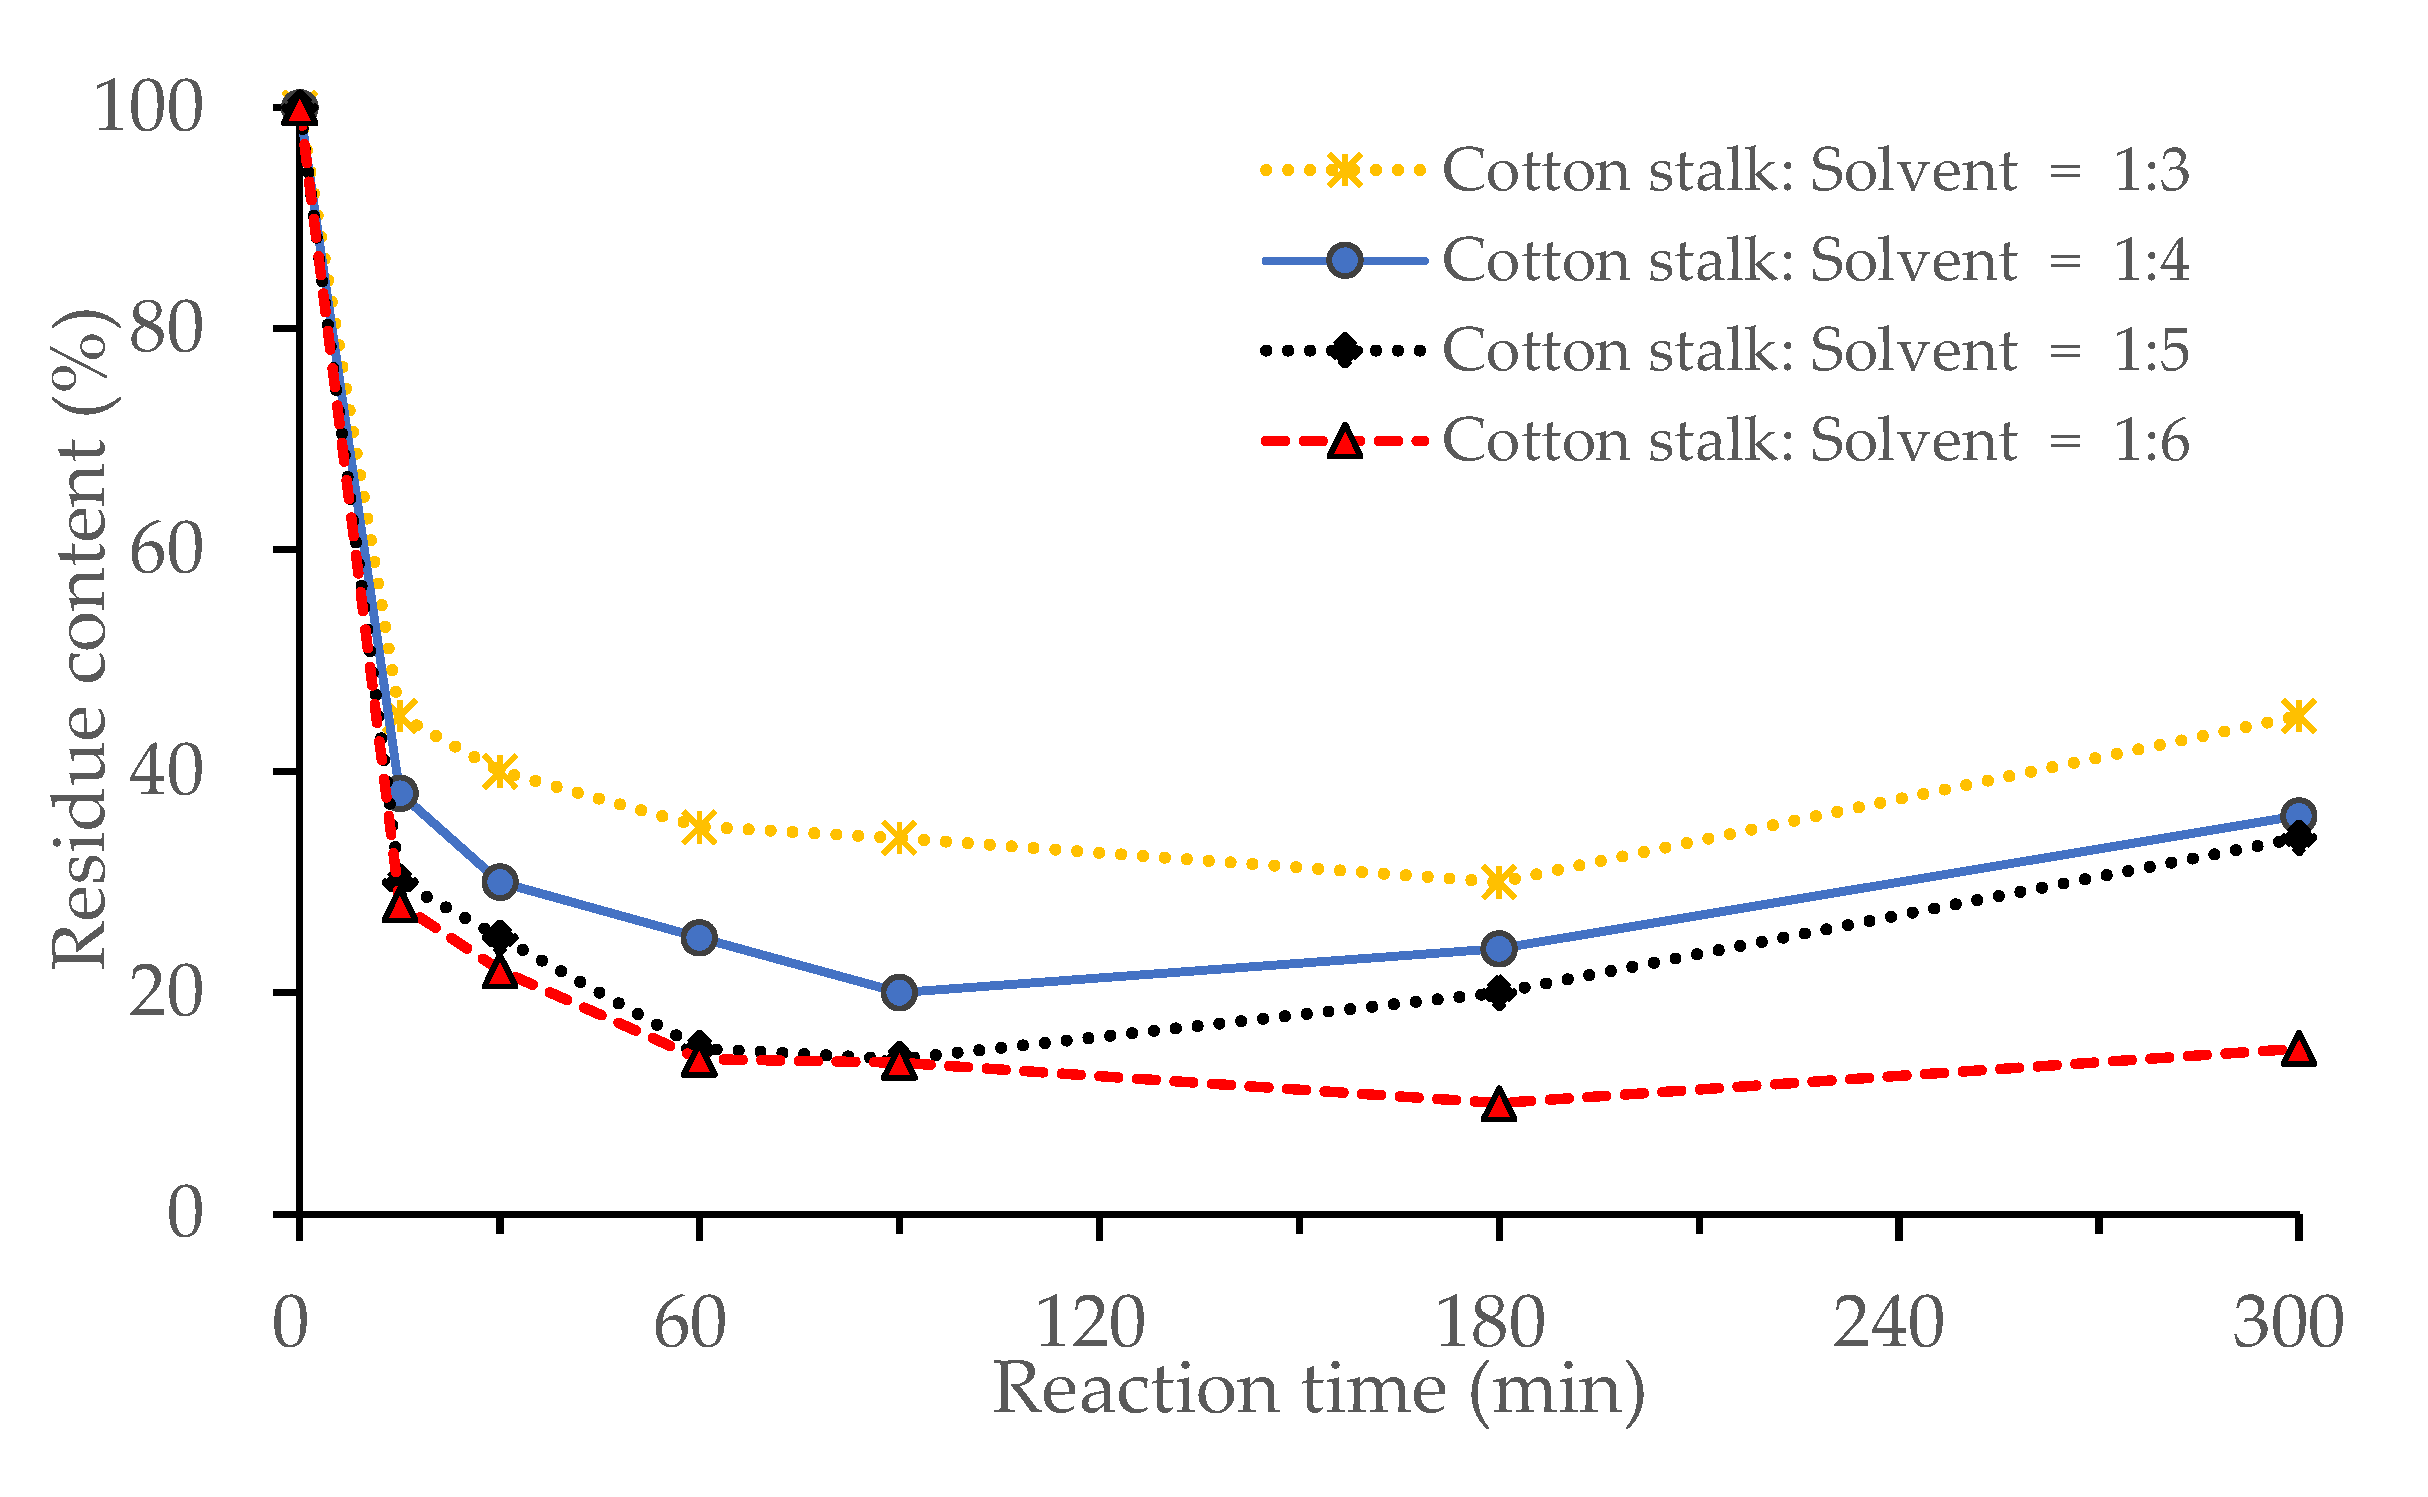
3.1.1. Effect of Biomass Loading

We examined the effect of the cotton stalk/solvent ratio on the amount of residue remaining after liquefaction, and the results are shown in Figure 1. It shows the residue content is increased as reaction time increased after 90 min except with a cotton stalks: solvent ratio of 1/6, and the residue content decreased with increasing amount of added solvent. It is thought that the condensation reaction between the degradation products of the cotton stalk samples was limited as the polyol concentration increased with increasing amount of solvent. When the fraction of cotton stalk to solvent was 1/6, a condensation reaction did not occur at a later reaction stage, and the residue fraction was lower than for other biomass loadings. However, in terms of the effective utilization of biomass, it is inefficient to use very low quantities (16.6%) of biomass in the liquefaction product as more chemicals are used, resulting in a higher capital investment. Therefore, we used moderate raw material concentration (20%) and raw material/solvent ratio (1/5) as these conditions gave a residue fraction content similar to that of the 1/6 ratio.

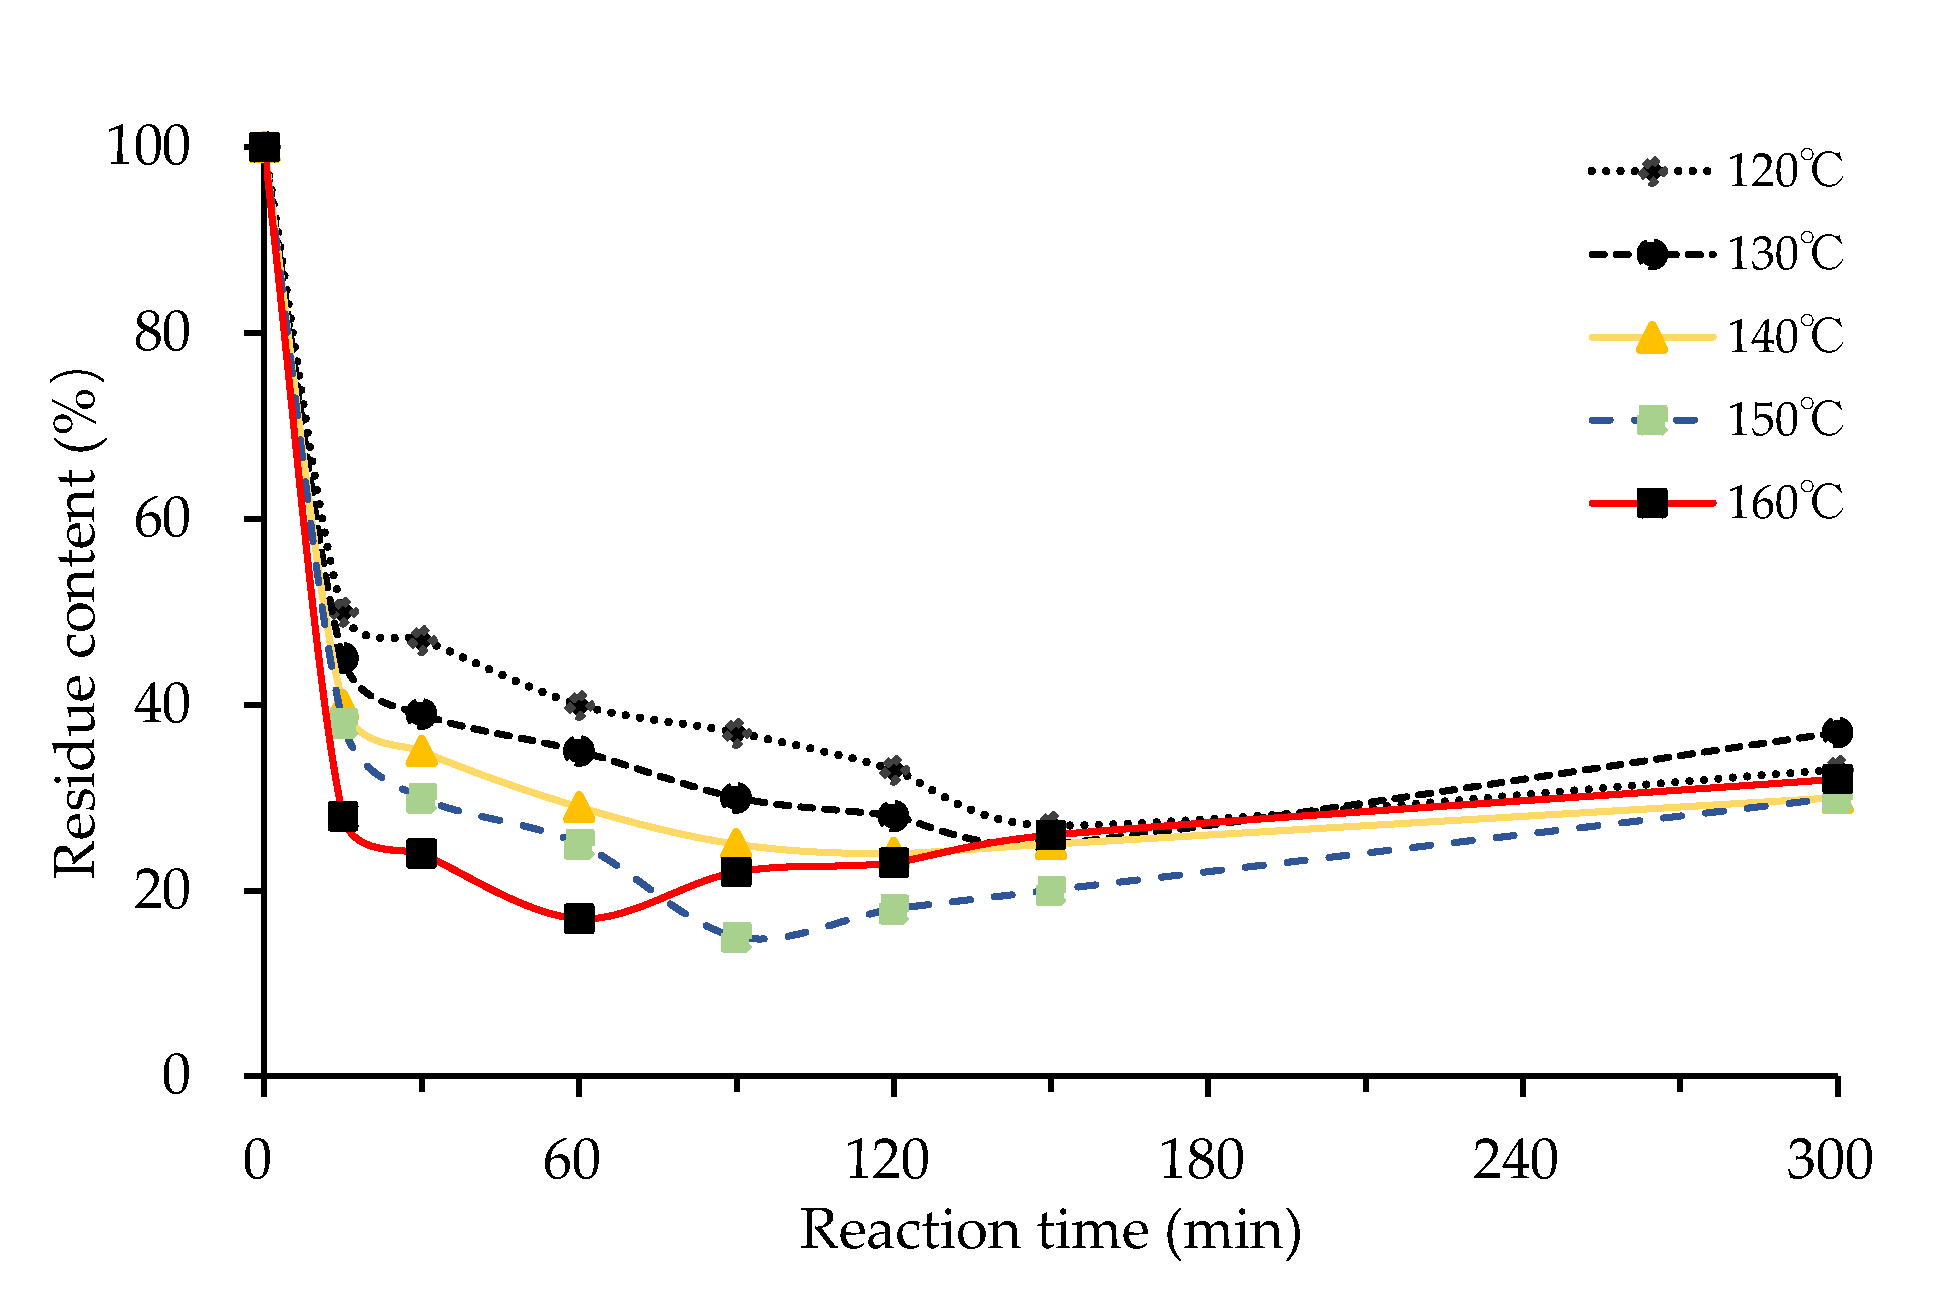
3.1.2. Effect of Reaction Temperature

Figure 2 shows the effect of reaction temperature on the residue content of cotton stalks liquefied by 80% PEG400 +20% glycerin, using 3 wt.% sulfuric acid for cotton stalk. The residue fraction greatly decreased as the liquefaction temperature increased from 120 to 160 °C. At 120 °C, the residue fraction decreased with time over the entire liquefaction procedure, indicating that the condensation reaction was not significant. Conversely, the residue fraction at 160 °C was the lowest after a reaction time of 30 min; the effect of the condensation reaction was only visible after 60 min. At 160 °C, the residue fraction decreased at the early stage of the reaction, but then increased, indicating that both degradation and condensation occurred rapidly at high temperature. The lowest residue rate was achieved at 150 °C and reaction time of 90 min.

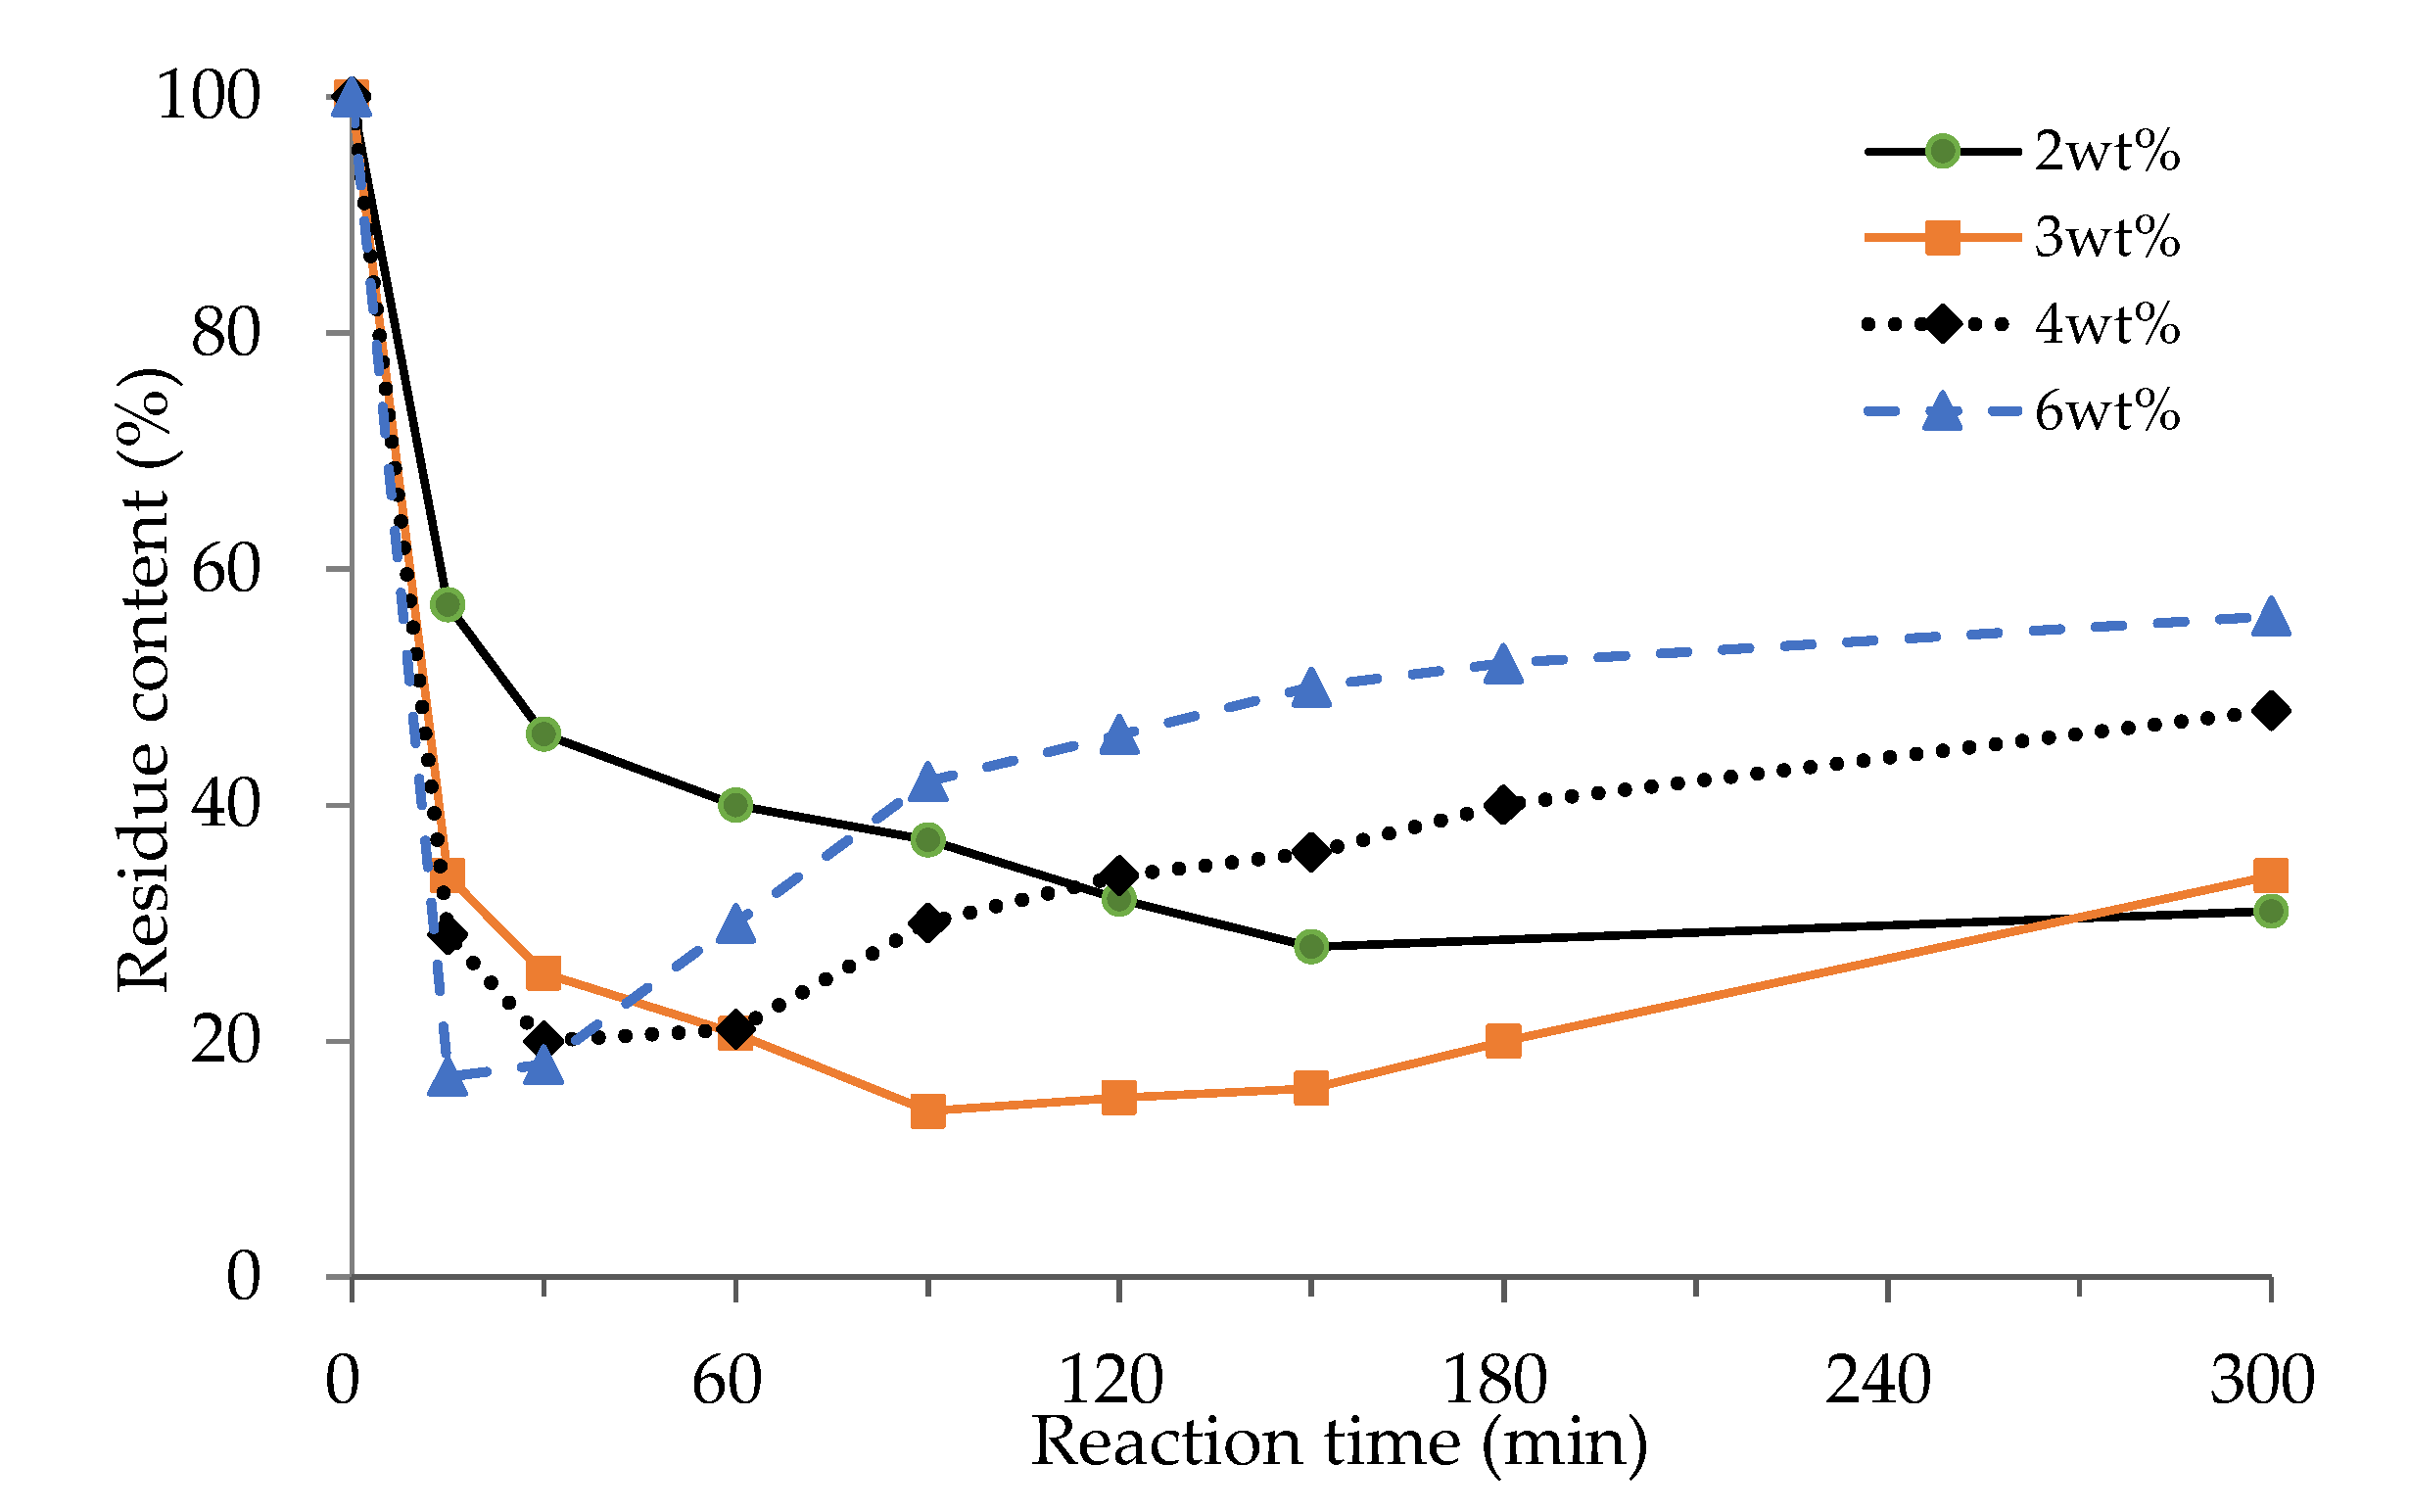
3.1.3. Effect of Catalyst Loading

Increasing the amount of catalyst can increase the degree of liquefaction and decrease the liquefaction temperature and time. However, high acid concentrations can enhance the recondensation reactions of the liquefied fragments, resulting in an increase in the amount of insoluble residue after liquefaction [18]. To determine the optimal acid loading for liquefied cotton stalk, several experiments were performed. Figure 3 shows the effect of acid content on the residue content of cotton stalks liquefied by 80% PEG400 +20% glycerin; catalyst content was changed into 2 wt.% to 6 wt.% for cotton stalk. If the catalyst quantity was 2 wt.% sulfuric acid, the residue fraction was 38.5%, while increasing the acid content to 3 wt.% resulted in a significant decrease in the residue content to 15% at 90 min. Further increasing the catalyst loading to 4 wt.% and 6 wt.% resulted in a high decrease in the residue content at 30 min. After 30 min, it resulted in a significant increase in the residue content. Hence, we concluded that 3 wt.% acid was the optimal catalyst loading for this system.

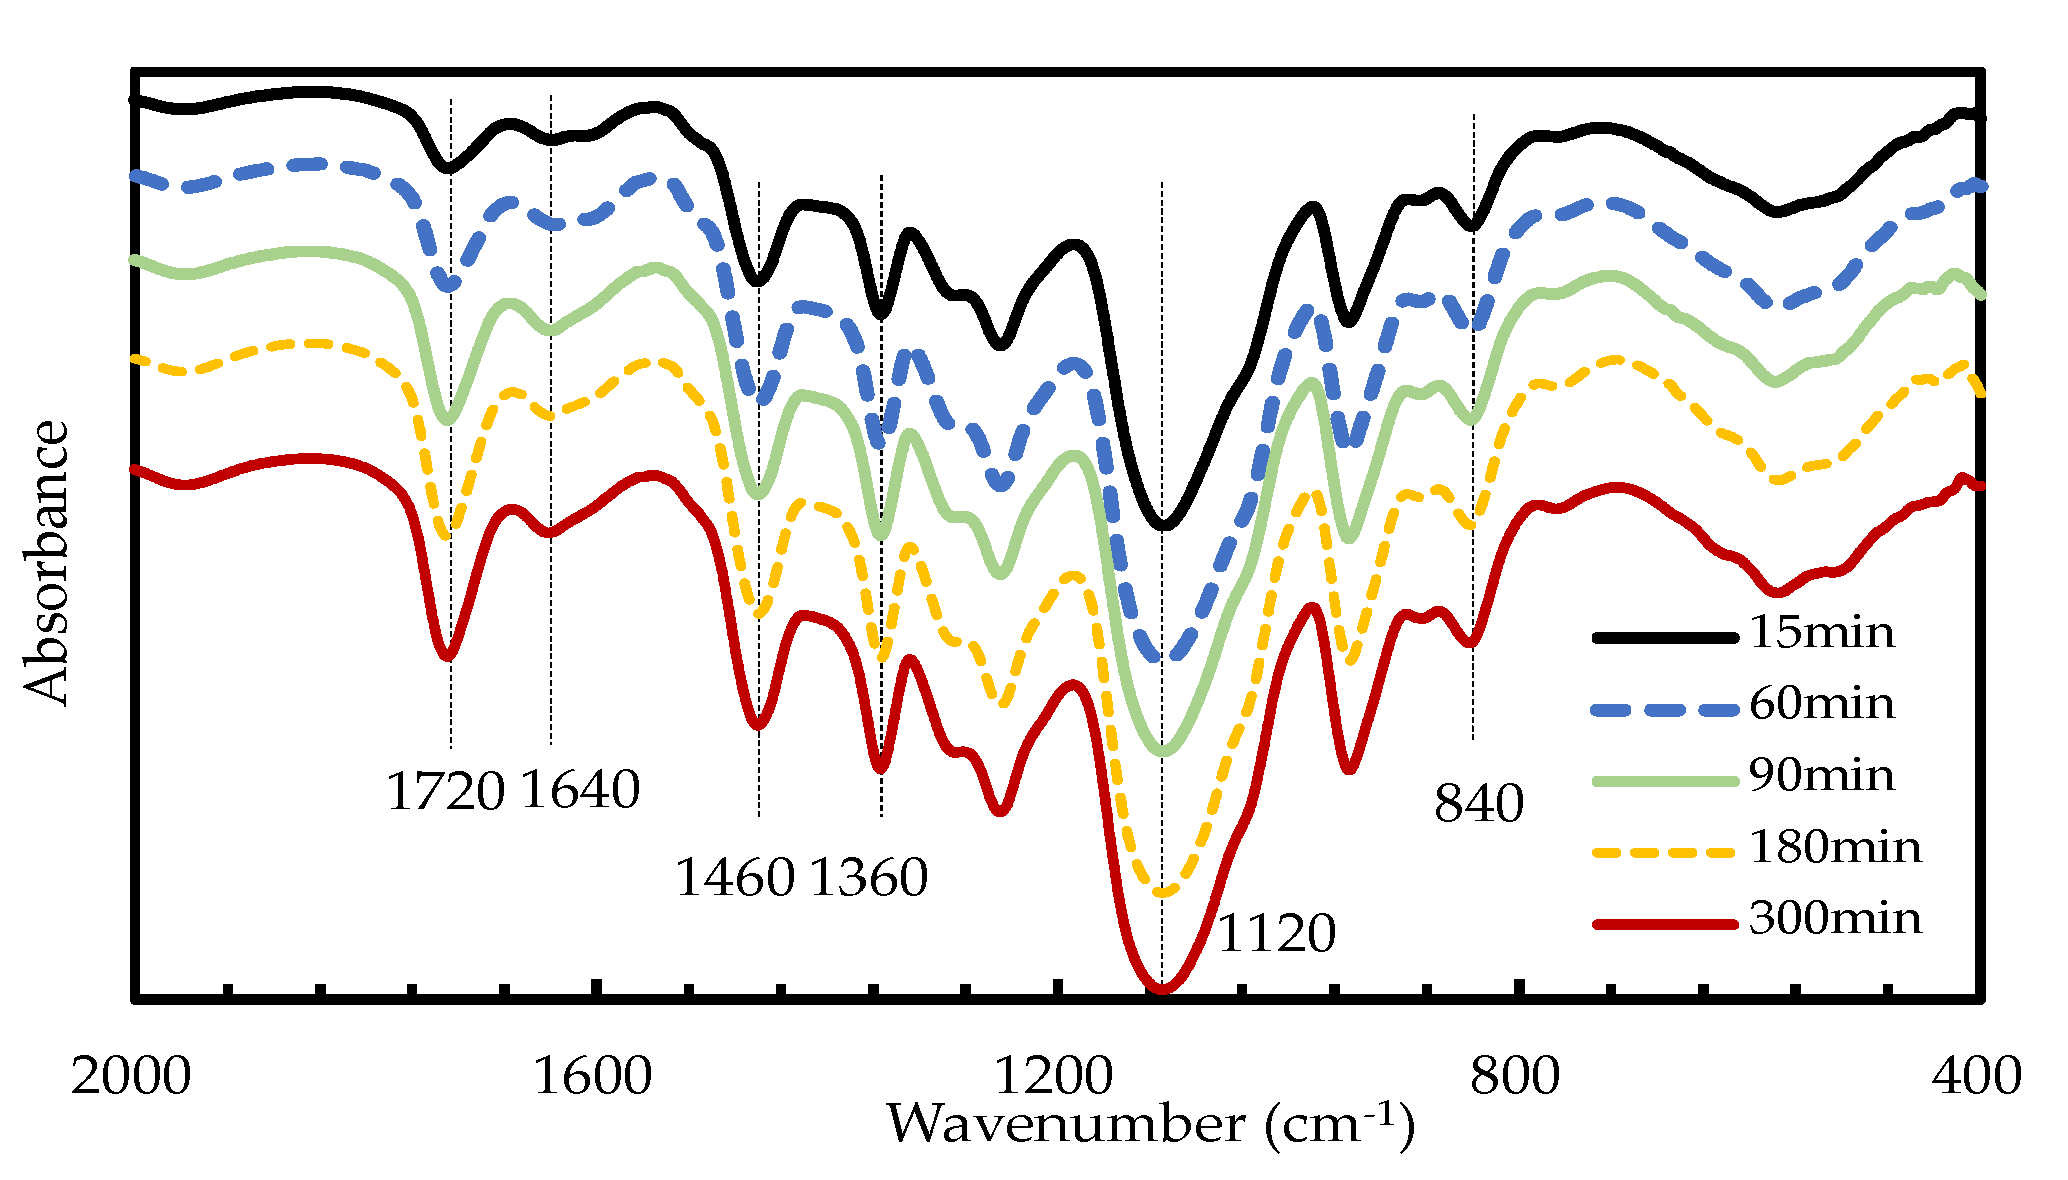
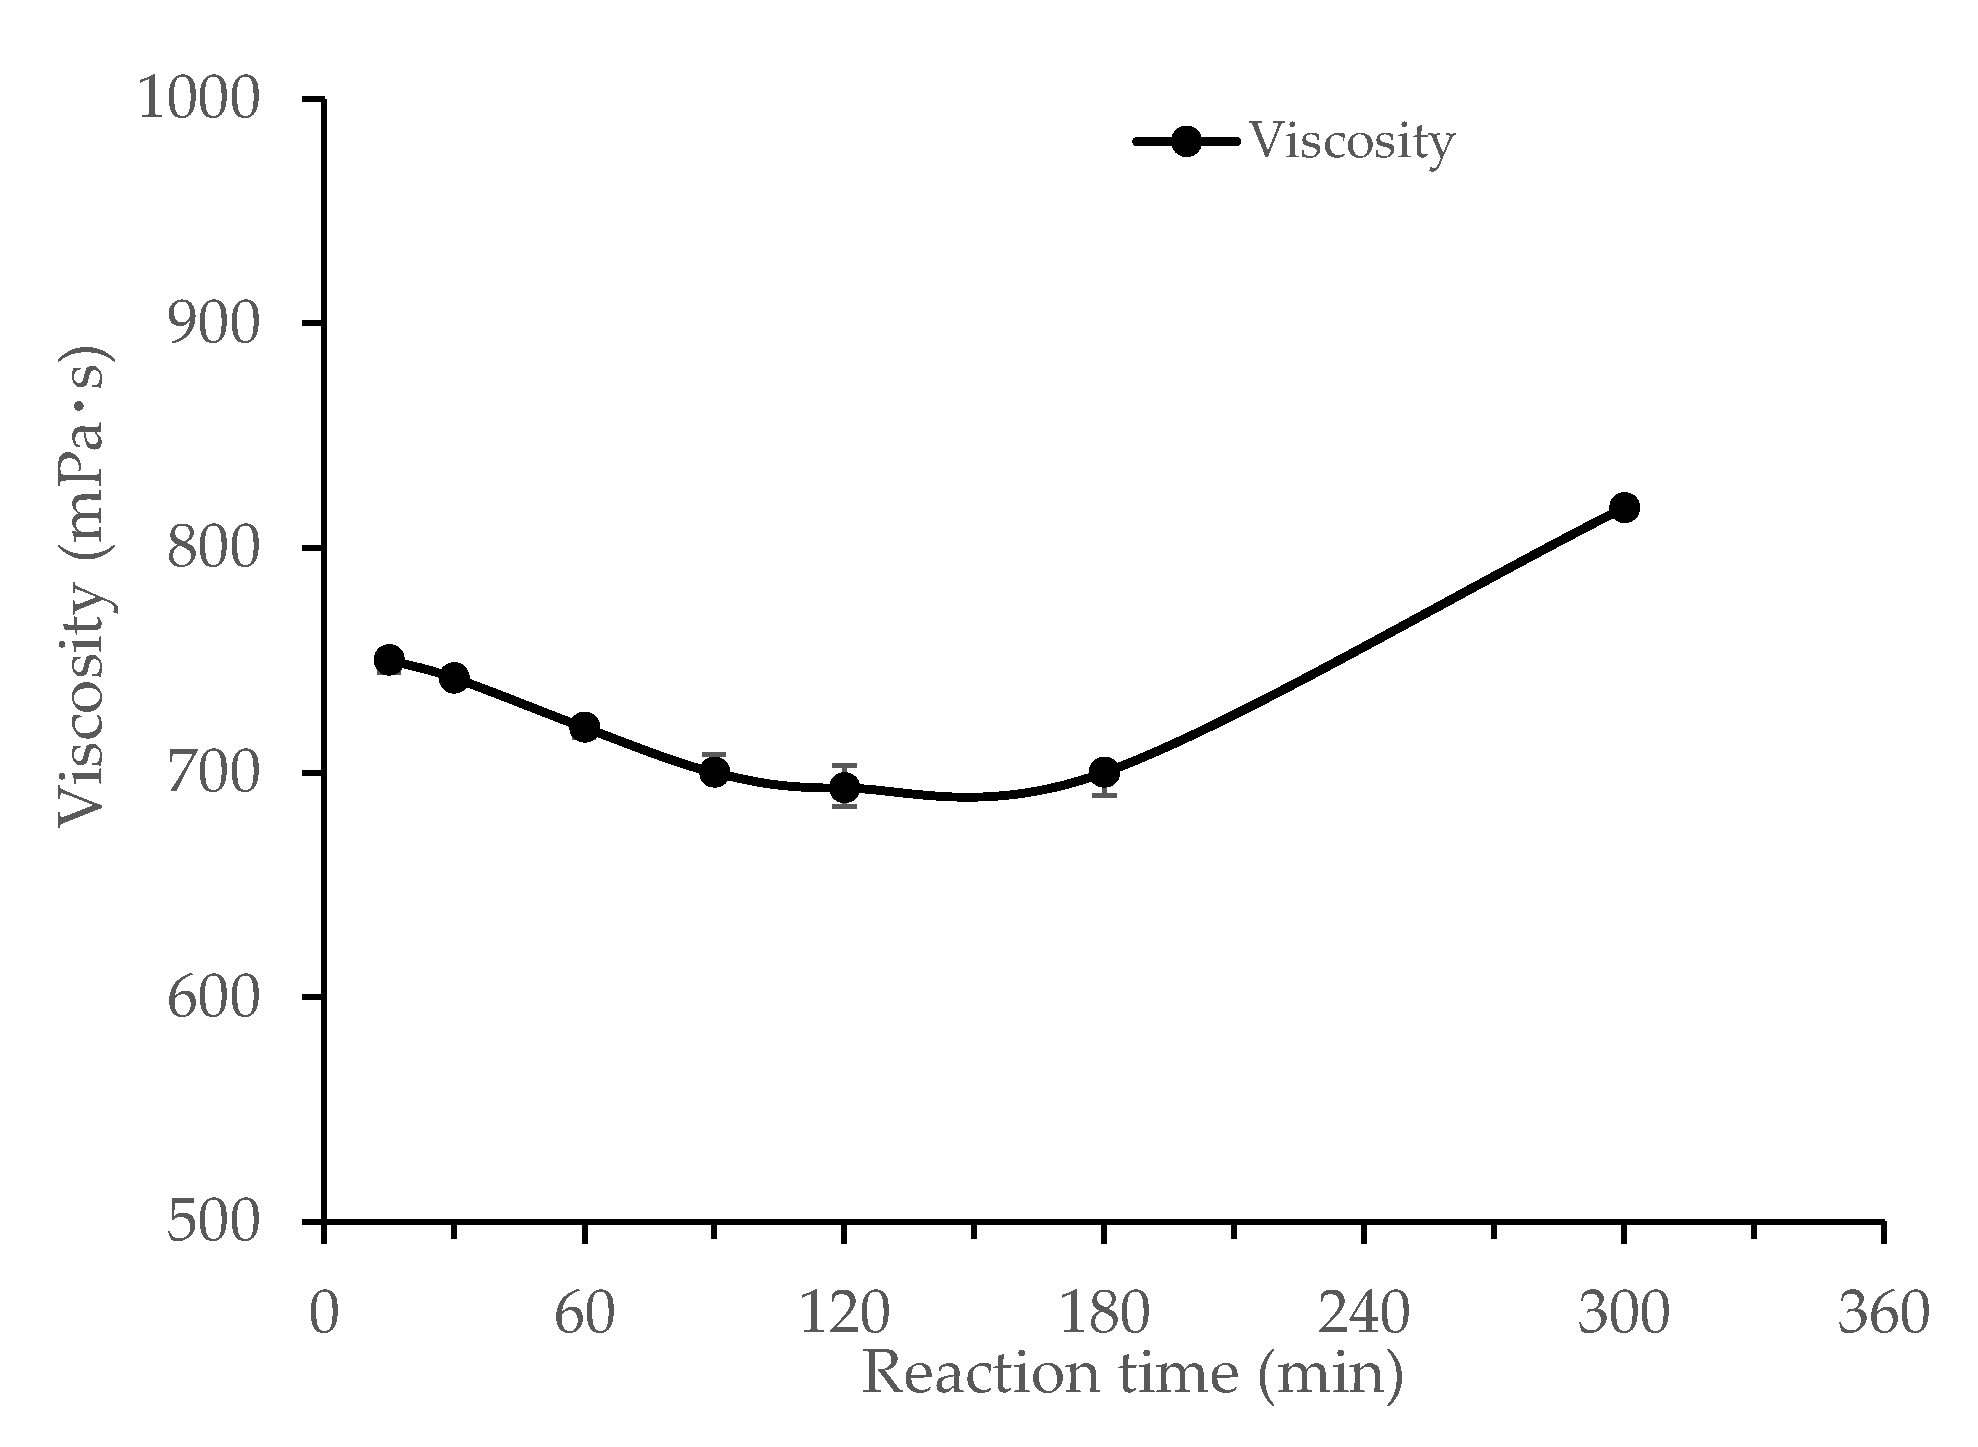
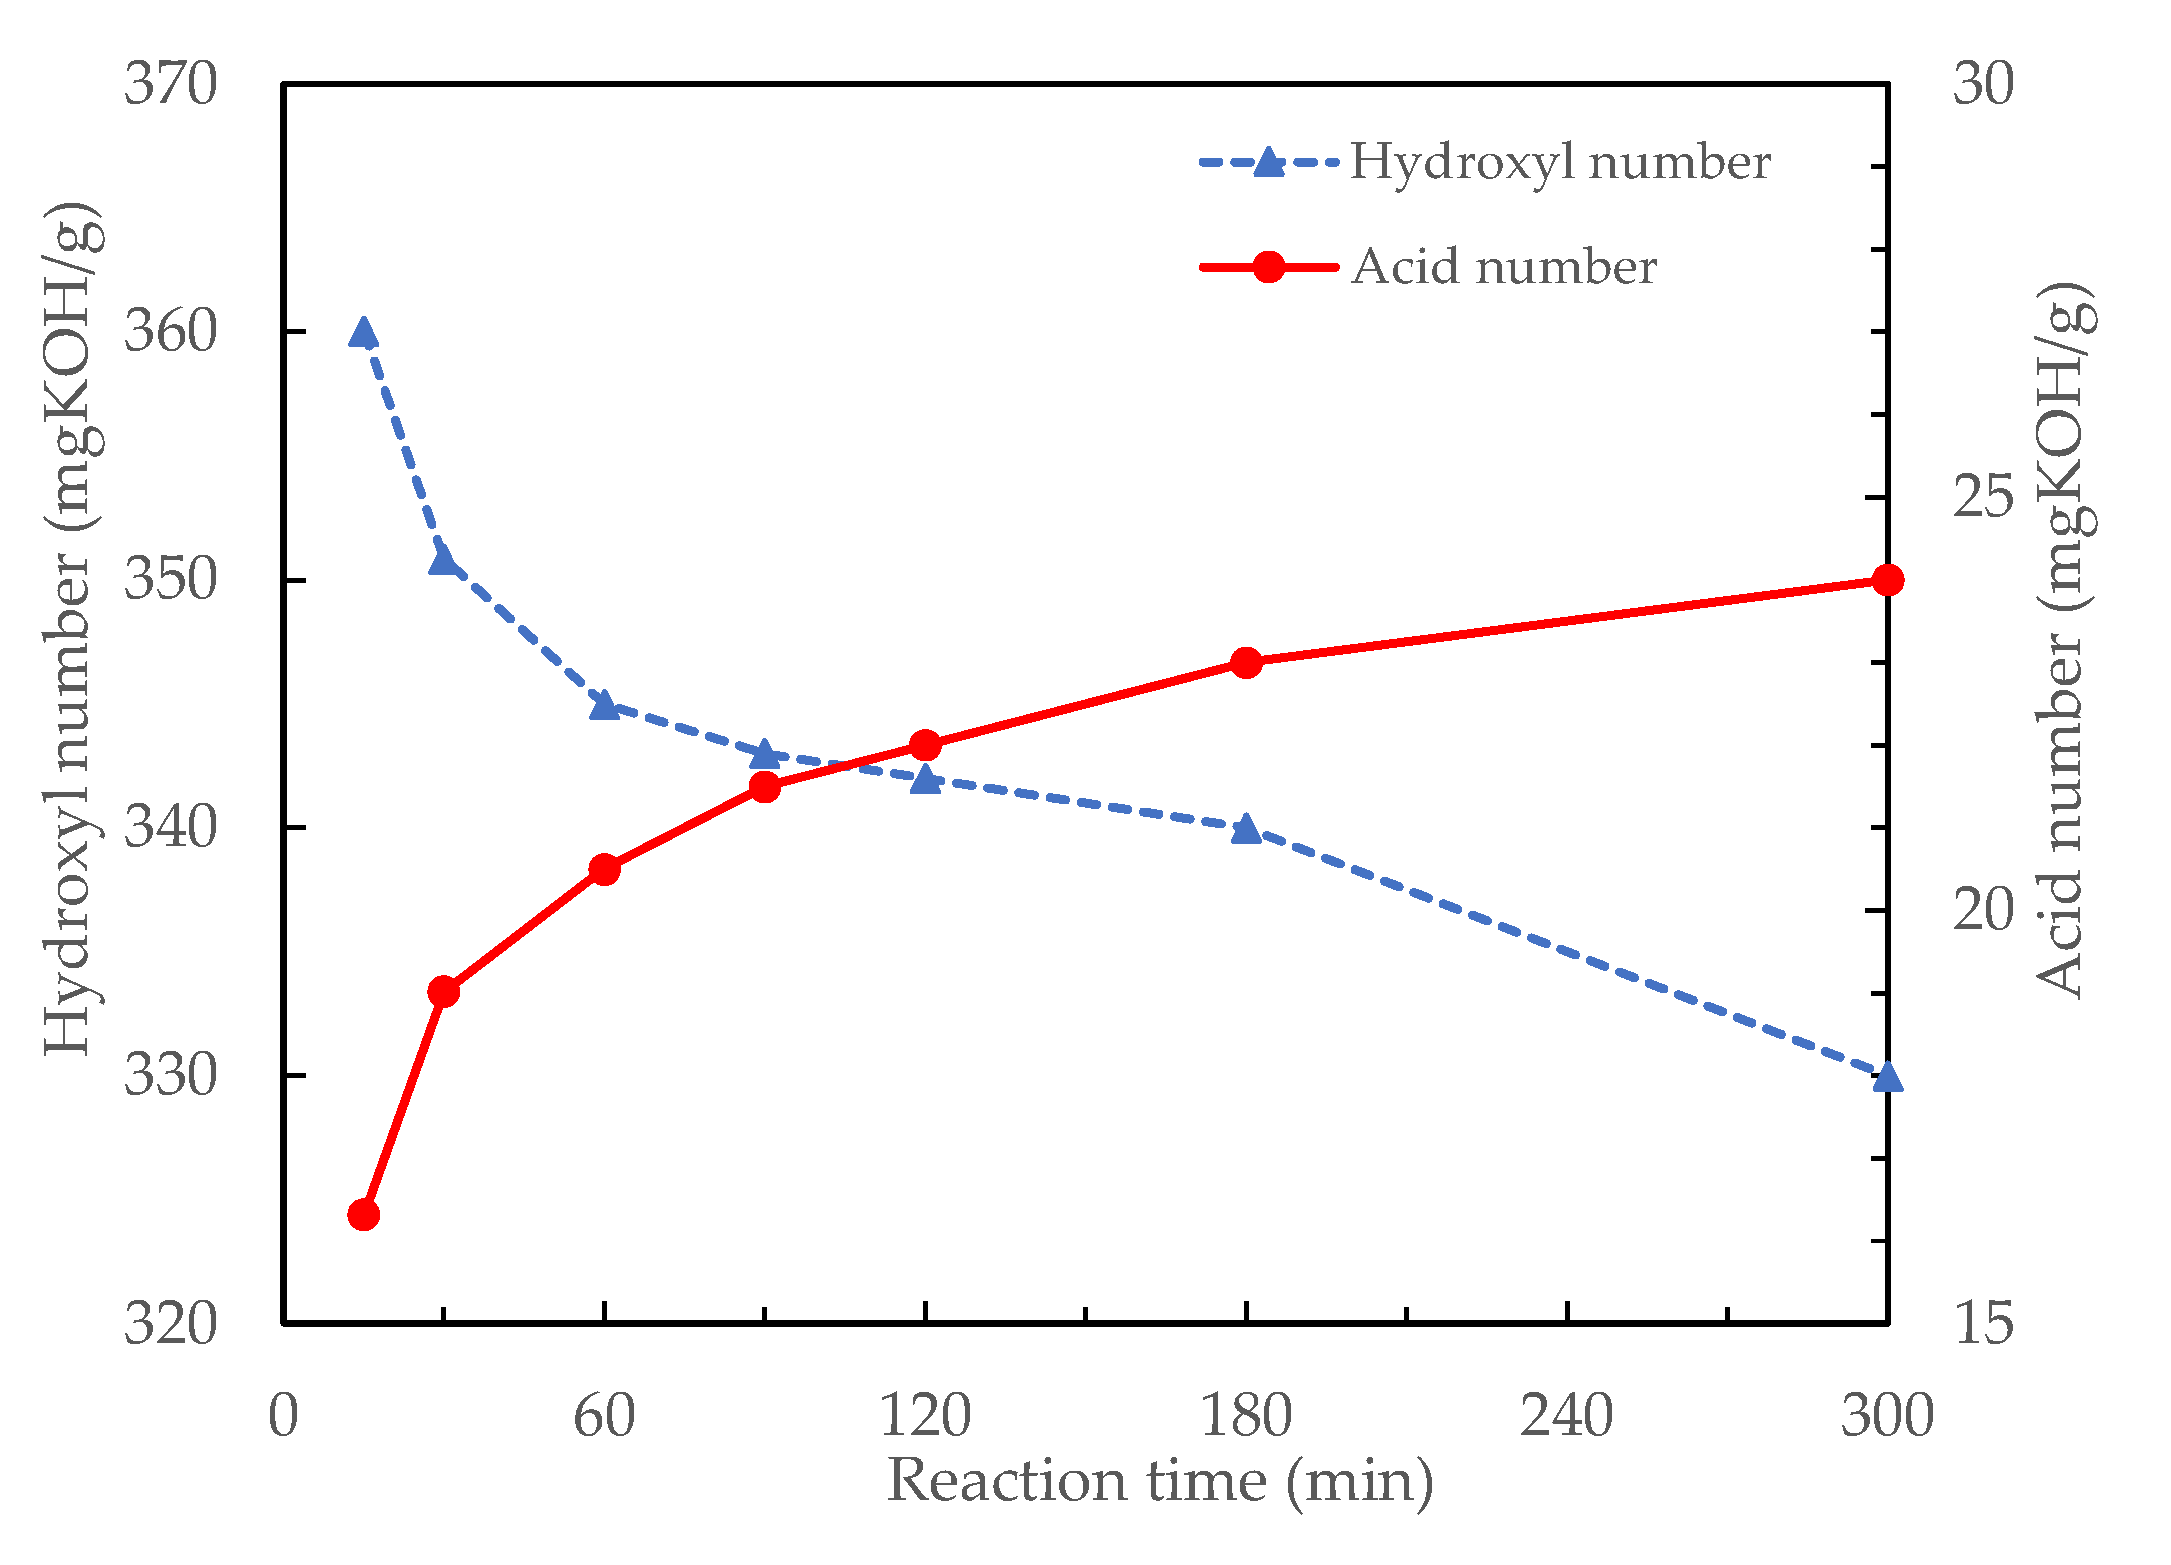
3.1.4. Effects of Reaction Time

GPC data showed that each liquefaction product consisted of two major fractions with different molecular weights. The molecular weight distribution of the liquefied cotton stalks for each reaction time at a reaction temperature of 150 °C, catalyst content of 3% and 1/5 fraction of cotton stalk to solvent are shown in Table 3. The chromatograms of the four products had a similar shape and position, indicating that they had similar molecular weight distributions. Here, Mp1 and Mp2 are the peak molecular weight of the high and low molecular weight fractions, respectively. The components with different molecular weights dissolved at a similar rate during liquefaction.
Wood liquefaction in presence of acid leads to decomposition of cellulose into small compounds due to acid hydrolysis, and other oxidation reactions take place on cellulose. The intensity of carbonyl in these compounds may reflect the degree of cellulose decomposition. Therefore, Figure 4 shows normalized FTIR spectra of the polyols obtained from liquefied cotton stalk at different liquefaction times and under optimal conditions. The broad absorption band at 1720 cm−1, that increased modestly with the reaction time, was attributed to the stretching vibration of carbonyl groups from levulinic acid (a decomposition product of cellulose). This confirms the occurrence of the reaction between the liquefaction solvents and the cotton stalk powder compounds or derivatives formed during liquefaction. The C=C bands at 1640 cm−1 were from aromatic compounds generated by lignin decomposition. The absorption bands at 1460–1330 cm−1 are attributable to CH2 in-plane bending vibrations; a sharp band near 1120 cm−1 is attributed to C−O stretching vibrations from an ether group, and C–H stretching vibration bands occurred at 840 cm−1. These peaks are considered important for resinification, and hence, their intensity values were compared [19]. The intensity of the carbonyl peak derived from the decomposition product of cellulose increased as the reaction proceeded, and reached its maximum at 90 min, after which the intensity did not change significantly.
The viscosity is an important fluid property for studying the rheological behavior of the polyols and their suitability for the preparation of polyurethane foams. Figure 5 shows the effect of liquefaction time on the viscosity at the reaction temperature of 150 °C, with a catalyst content of 3 wt.%, and a solvent volume of 1:5, for reaction times up to 300 min. The viscosity decreased drastically from 7950 to 950 mPa·s over the first 90 min, then increased with reaction time after 120 min. It is worth noting that this increase in viscosity followed the observed increase in residue fraction, which also showed a minimum at 90 min and then gradually increased due to the condensation reaction. The measured viscosity values were slightly larger than those of conventional polyols, but considered satisfactory for the preparation of polyurethane foams [19].
Polyurethane foams are prepared by the reaction of a polyisocyanate with a polyol in the presence of a blowing agent, surfactant, and catalyst. Therefore, the change in the acid number and hydroxyl number of liquefied cotton stalk as a function of reaction time were investigated, as shown in Figure 6. The acid number of the bio-polyol increased from 17 to 24 mg KOH/g with increasing reaction time. This was attributed to the progress of the decomposition reaction; acidic substances such as carboxylic acids from high-molecular-weight materials were formed, and a polyhydric alcohol or decomposition products could have been oxidized by the sulfuric acid [18]. Acidic substances often exist in the lignocellulosic components and can also be produced during the liquefaction by oxidation of carbohydrates and lignin [21]. In contrast, the hydroxyl number tended to decrease (from 360 to 325 mg KOH/g) as the reaction time increased. This was attributed to the dehydration and thermal-oxidative degradation of the liquefaction solvent, along with the reaction between the solvent and dissolved liquefied components. We concluded that the polyols prepared from liquefied cotton stalks were suitable for preparation of polyurethanes.

3.2. Properties of Polyurethane Foam

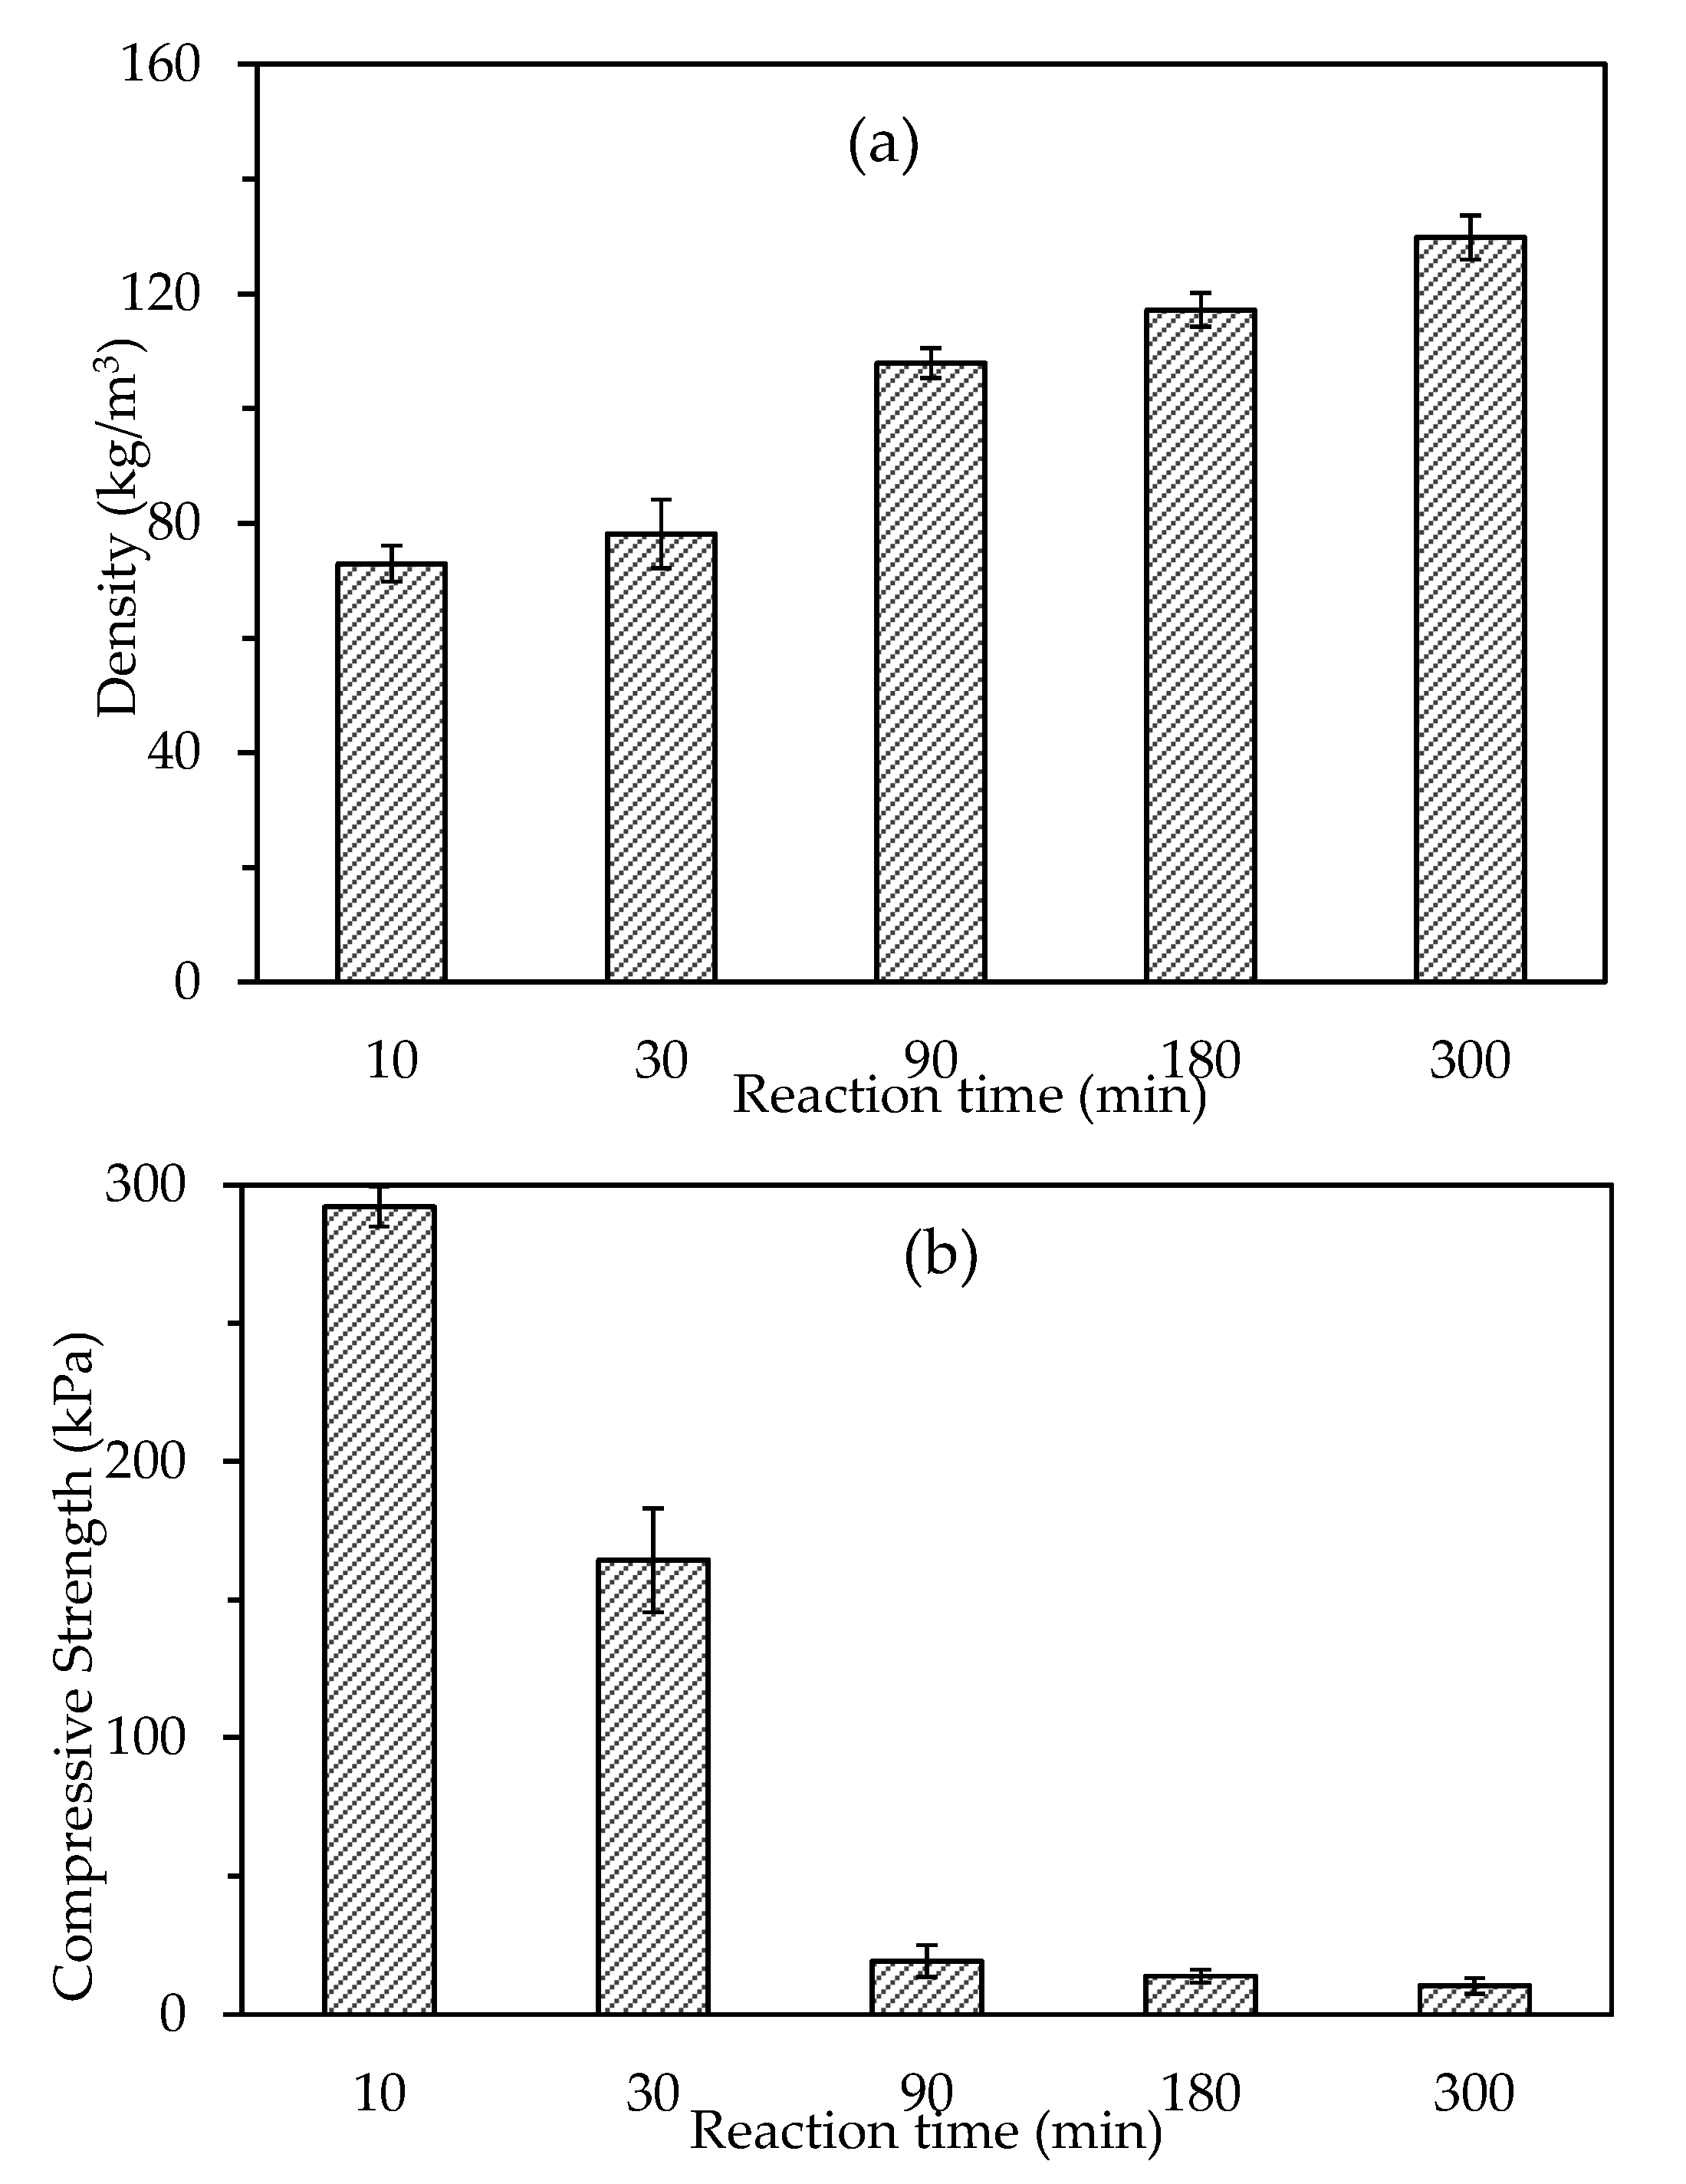
3.2.1. Density and Compressive Strength

The density of polyurethane foams synthesized from liquefaction products prepared at different reaction times is shown in Figure 7. The density was higher for liquefied products with longer reaction times. This is consistent with the GPC results showing that the viscosity increased with increasing molecular weight of the liquefied product. Reaction mixtures with higher viscosities inhibited the foaming reaction of polyurethane foams and increased the density. Interestingly, there seems to be an inverse relationship between the density and hydroxyl value, which is thought to be due to the varied qualities of the foaming reaction. Specifically, the foaming reaction started in the moment when the isocyanate was added to the system. The bio-polyol with the highest hydroxyl value was mixed with the highest amount of isocyanate ([NCO]/[OH] = 1), which resulted in the largest volume of generated gas, and subsequently a more complete foaming reaction and good expansion. Therefore, a lower foam density was observed compared to samples with lower hydroxyl numbers.
The compressive strength of the polyurethane foams was 28–267 kPa and decreased with increasing reaction time during liquefaction. The values plotted in the figures are mean values obtained from more than three repeated experiments, and errors are within 5%. In previous studies, prepared polyurethane foams from liquefied corn bran showed compressive strength between 70 and 142 kPa and density between 38 and 40 kg/m3) [10], while polyurethane foams prepared from liquefied wheat straw showed compressive strength and density varying from 169 to 212 kPa and from 30 to 56 kg/m3, respectively [19]. With increasing reaction time, the hydroxyl value decreased due to the formation of re-condensation molecules and the chain’s expansion reaction of polyurethane foam’s synthesis decrease, while the molecular weight of polyol that reacted with isocyanate increased. In this experiment, the isocyanate index was 1:1, where the polyol component was later used to prepare polyurethane foams due to the lower residue fraction. Therefore, the fraction of the soft component increased, and the compressive strength decreased accordingly.

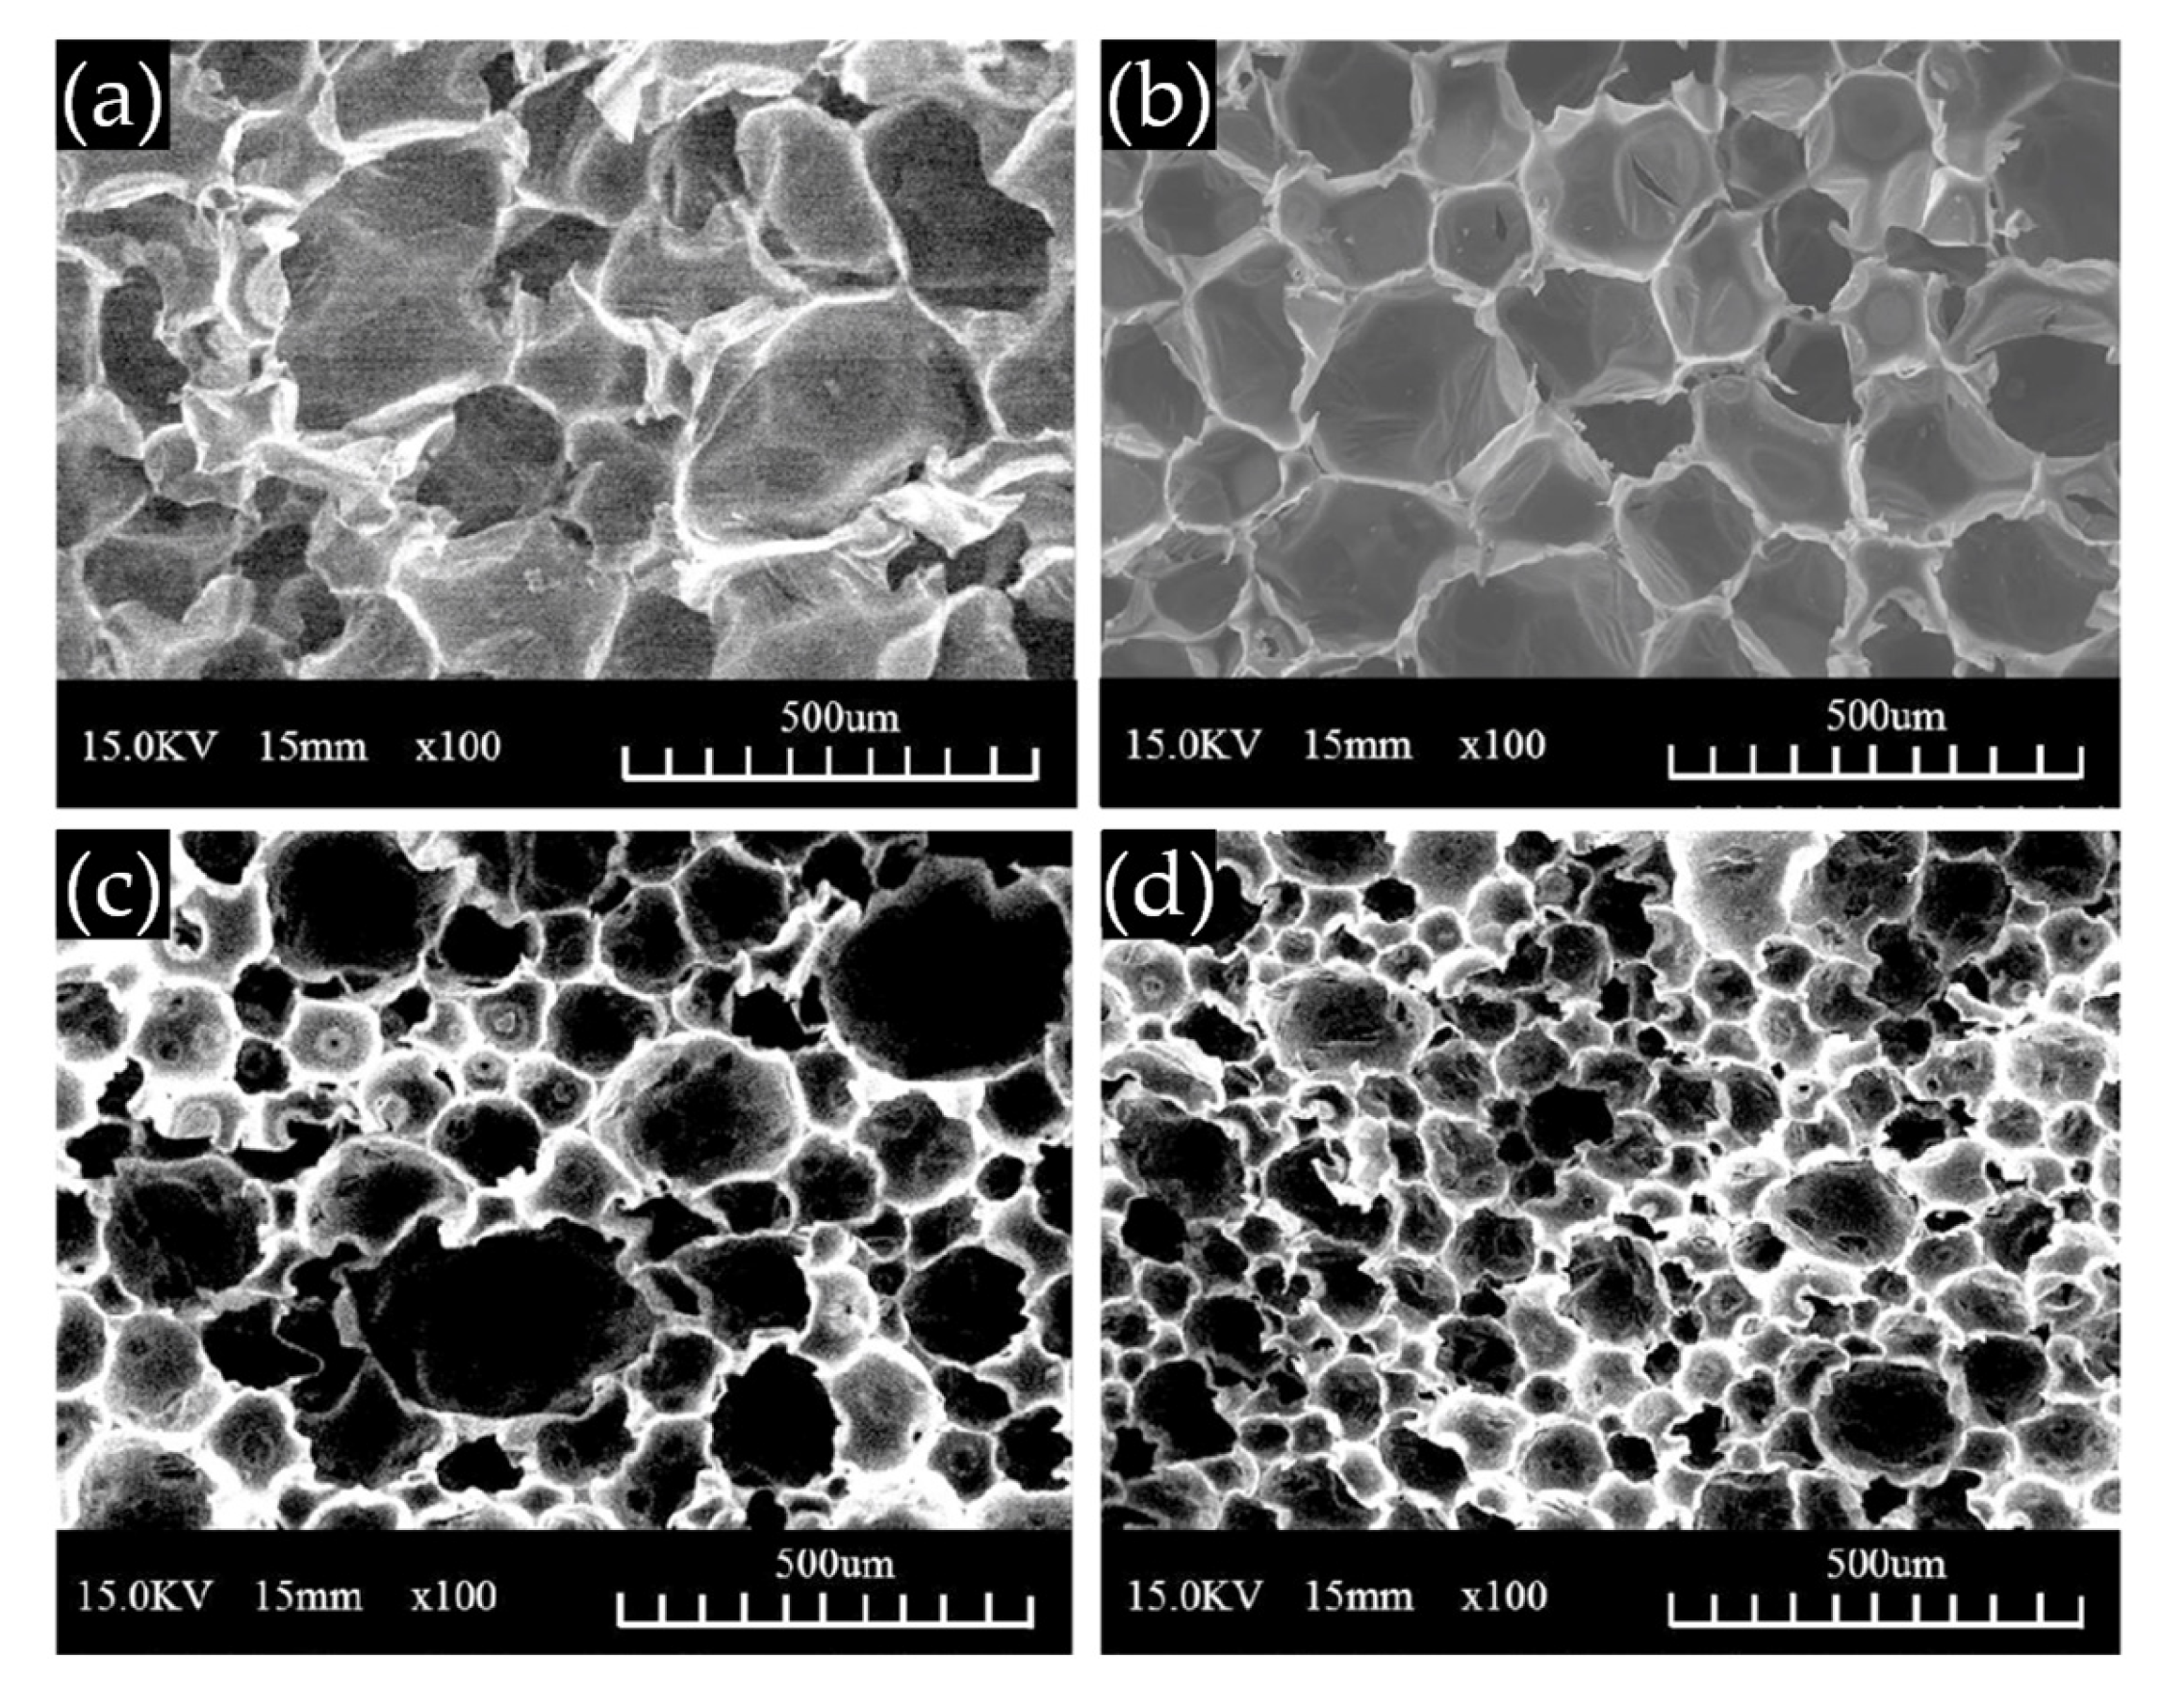
3.2.2. Foam Morphology

Figure 8 shows SEM images of the fracture surfaces of polyurethane foams manufactured from liquefied cotton stalks. The average pore diameter of the polyurethane foams decreased from 350 to 100 µm of foam as reaction time increased in the liquefaction process, and the cell wall became thicker. This is consistent with the observation that the foaming reaction was inhibited by an increase in the viscosity. One reason for the reduction in the compressive strength with increasing reaction time could not be clearly identified from these SEM images [22].

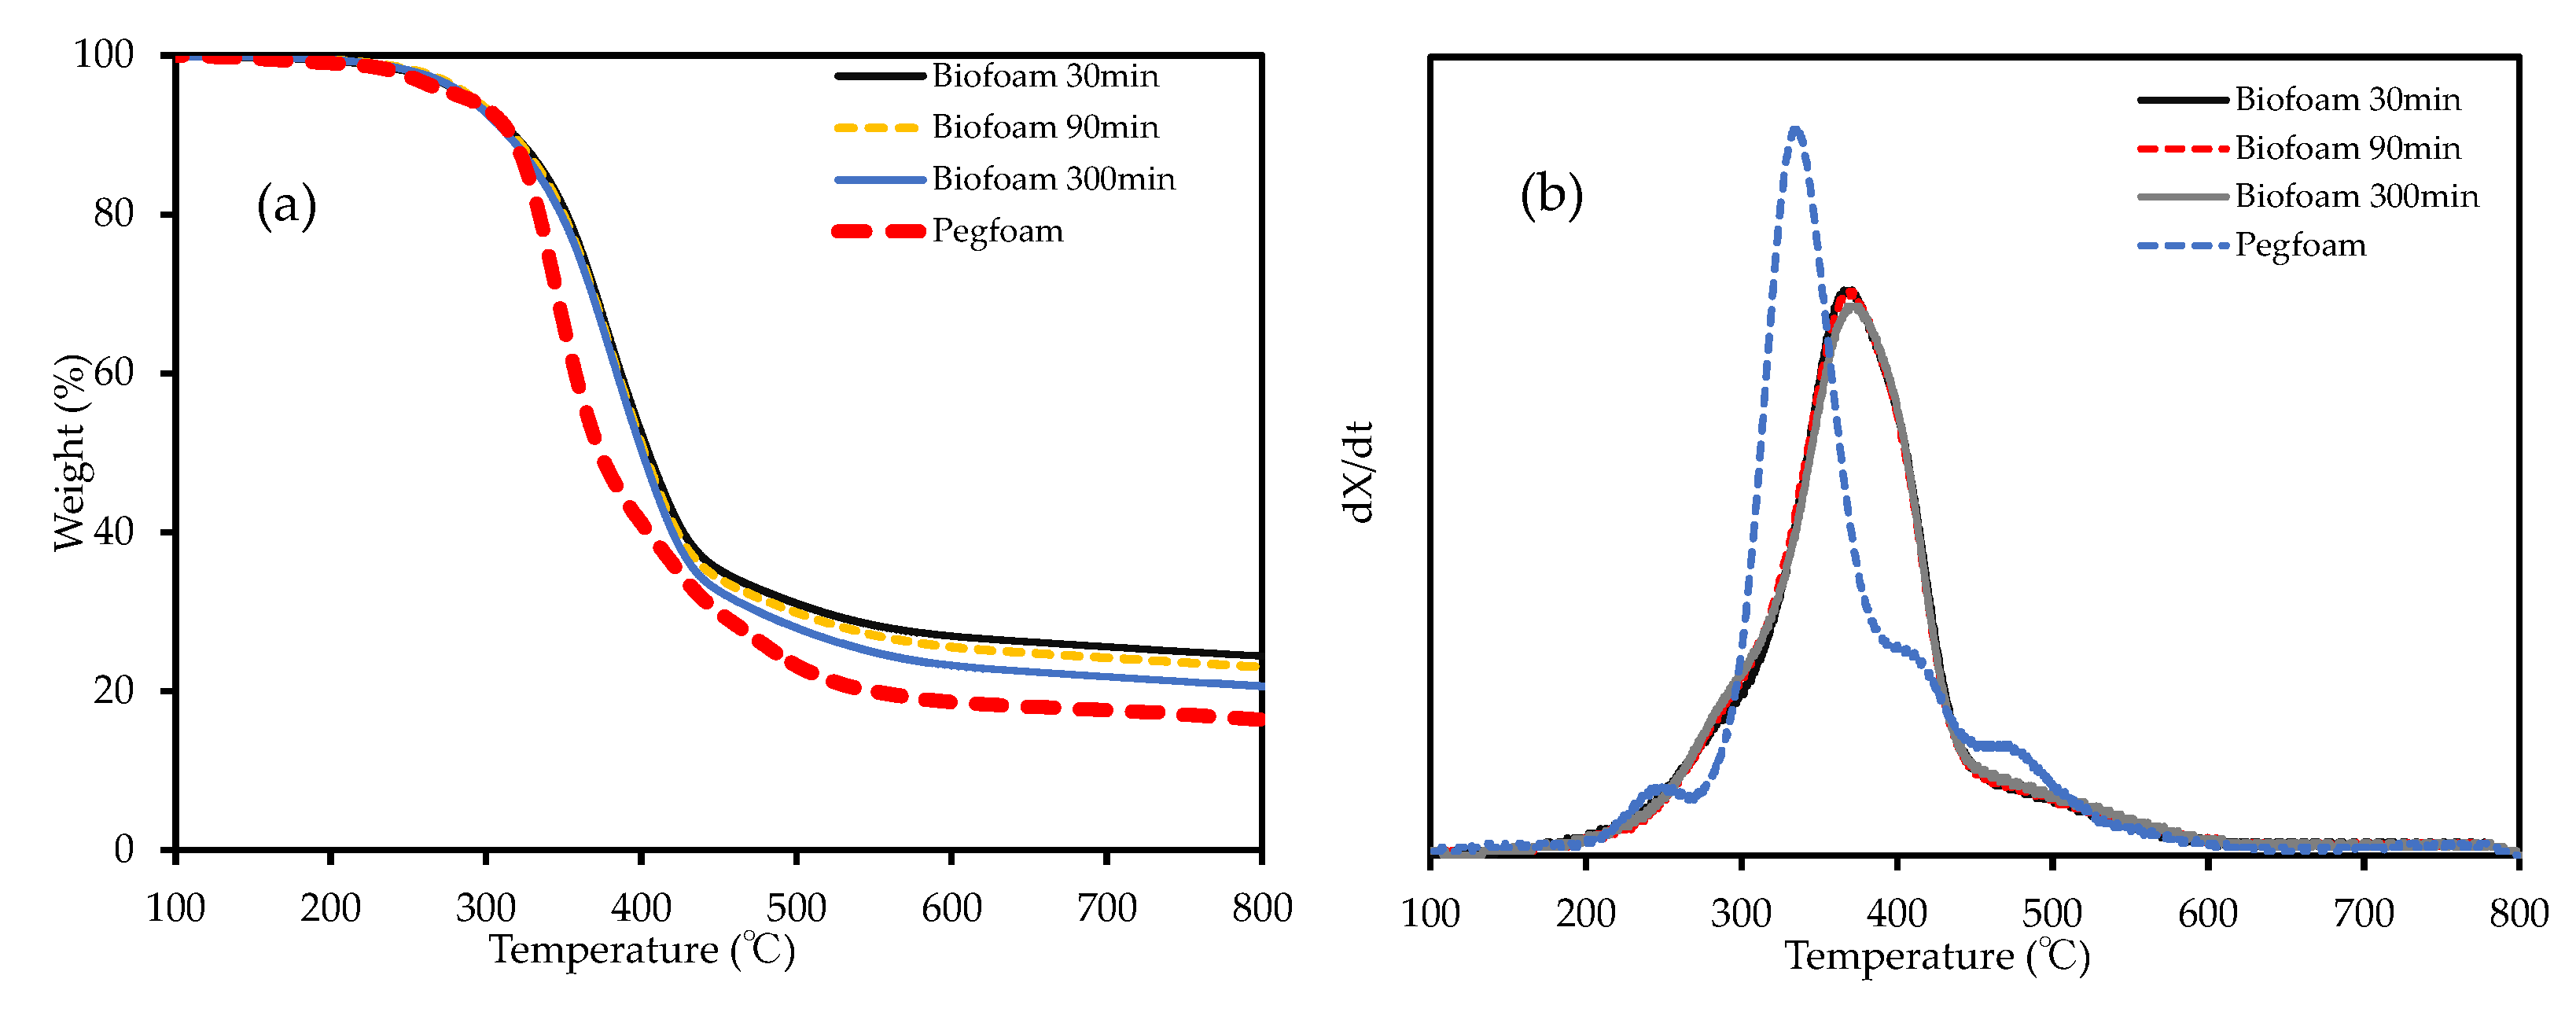
3.2.3. Thermal Stability

The thermal behavior of polyurethane foams is very important because they are mainly used as thermal insulation materials. The thermal decomposition of the polyurethane foams was performed at a heating rate of 20 °C/min under an argon or air atmosphere. Figure 9a,b shows the TG curve and time derivative of the weight loss of the polyurethane foam samples. The thermal decomposition of polyurethanes is a combination of random-chain scission, chain-end unzipping, and crosslinking reactions [23]. The urethane (200 °C) and urea (250 °C) linkages are the first to break and depolymerize into free isocyanate and alcohol. This is followed by degradation of the polyether polyols, and finally isocyanate, above 600 °C. Therefore, most of the weight loss occurred between 250 and 450 °C. Above this temperature, the weight loss was minimal as the structures were heavily crosslinked and resistant to degradation. Although there was no difference in the amount of decomposition residual, the decomposition start temperature tended to shift to a higher temperature as the reaction time of the liquefied material increased. The decomposition of the polyol main chain occurs at higher temperatures than that of urethane bonds [24]. The decomposition rate of the polyurethane foams derived from liquefaction was faster than that of PEG. This is because the polyol component of the liquefaction reaction is non-uniform and is easily decomposed, and the polyurethane foams’ combustibility has been improved.

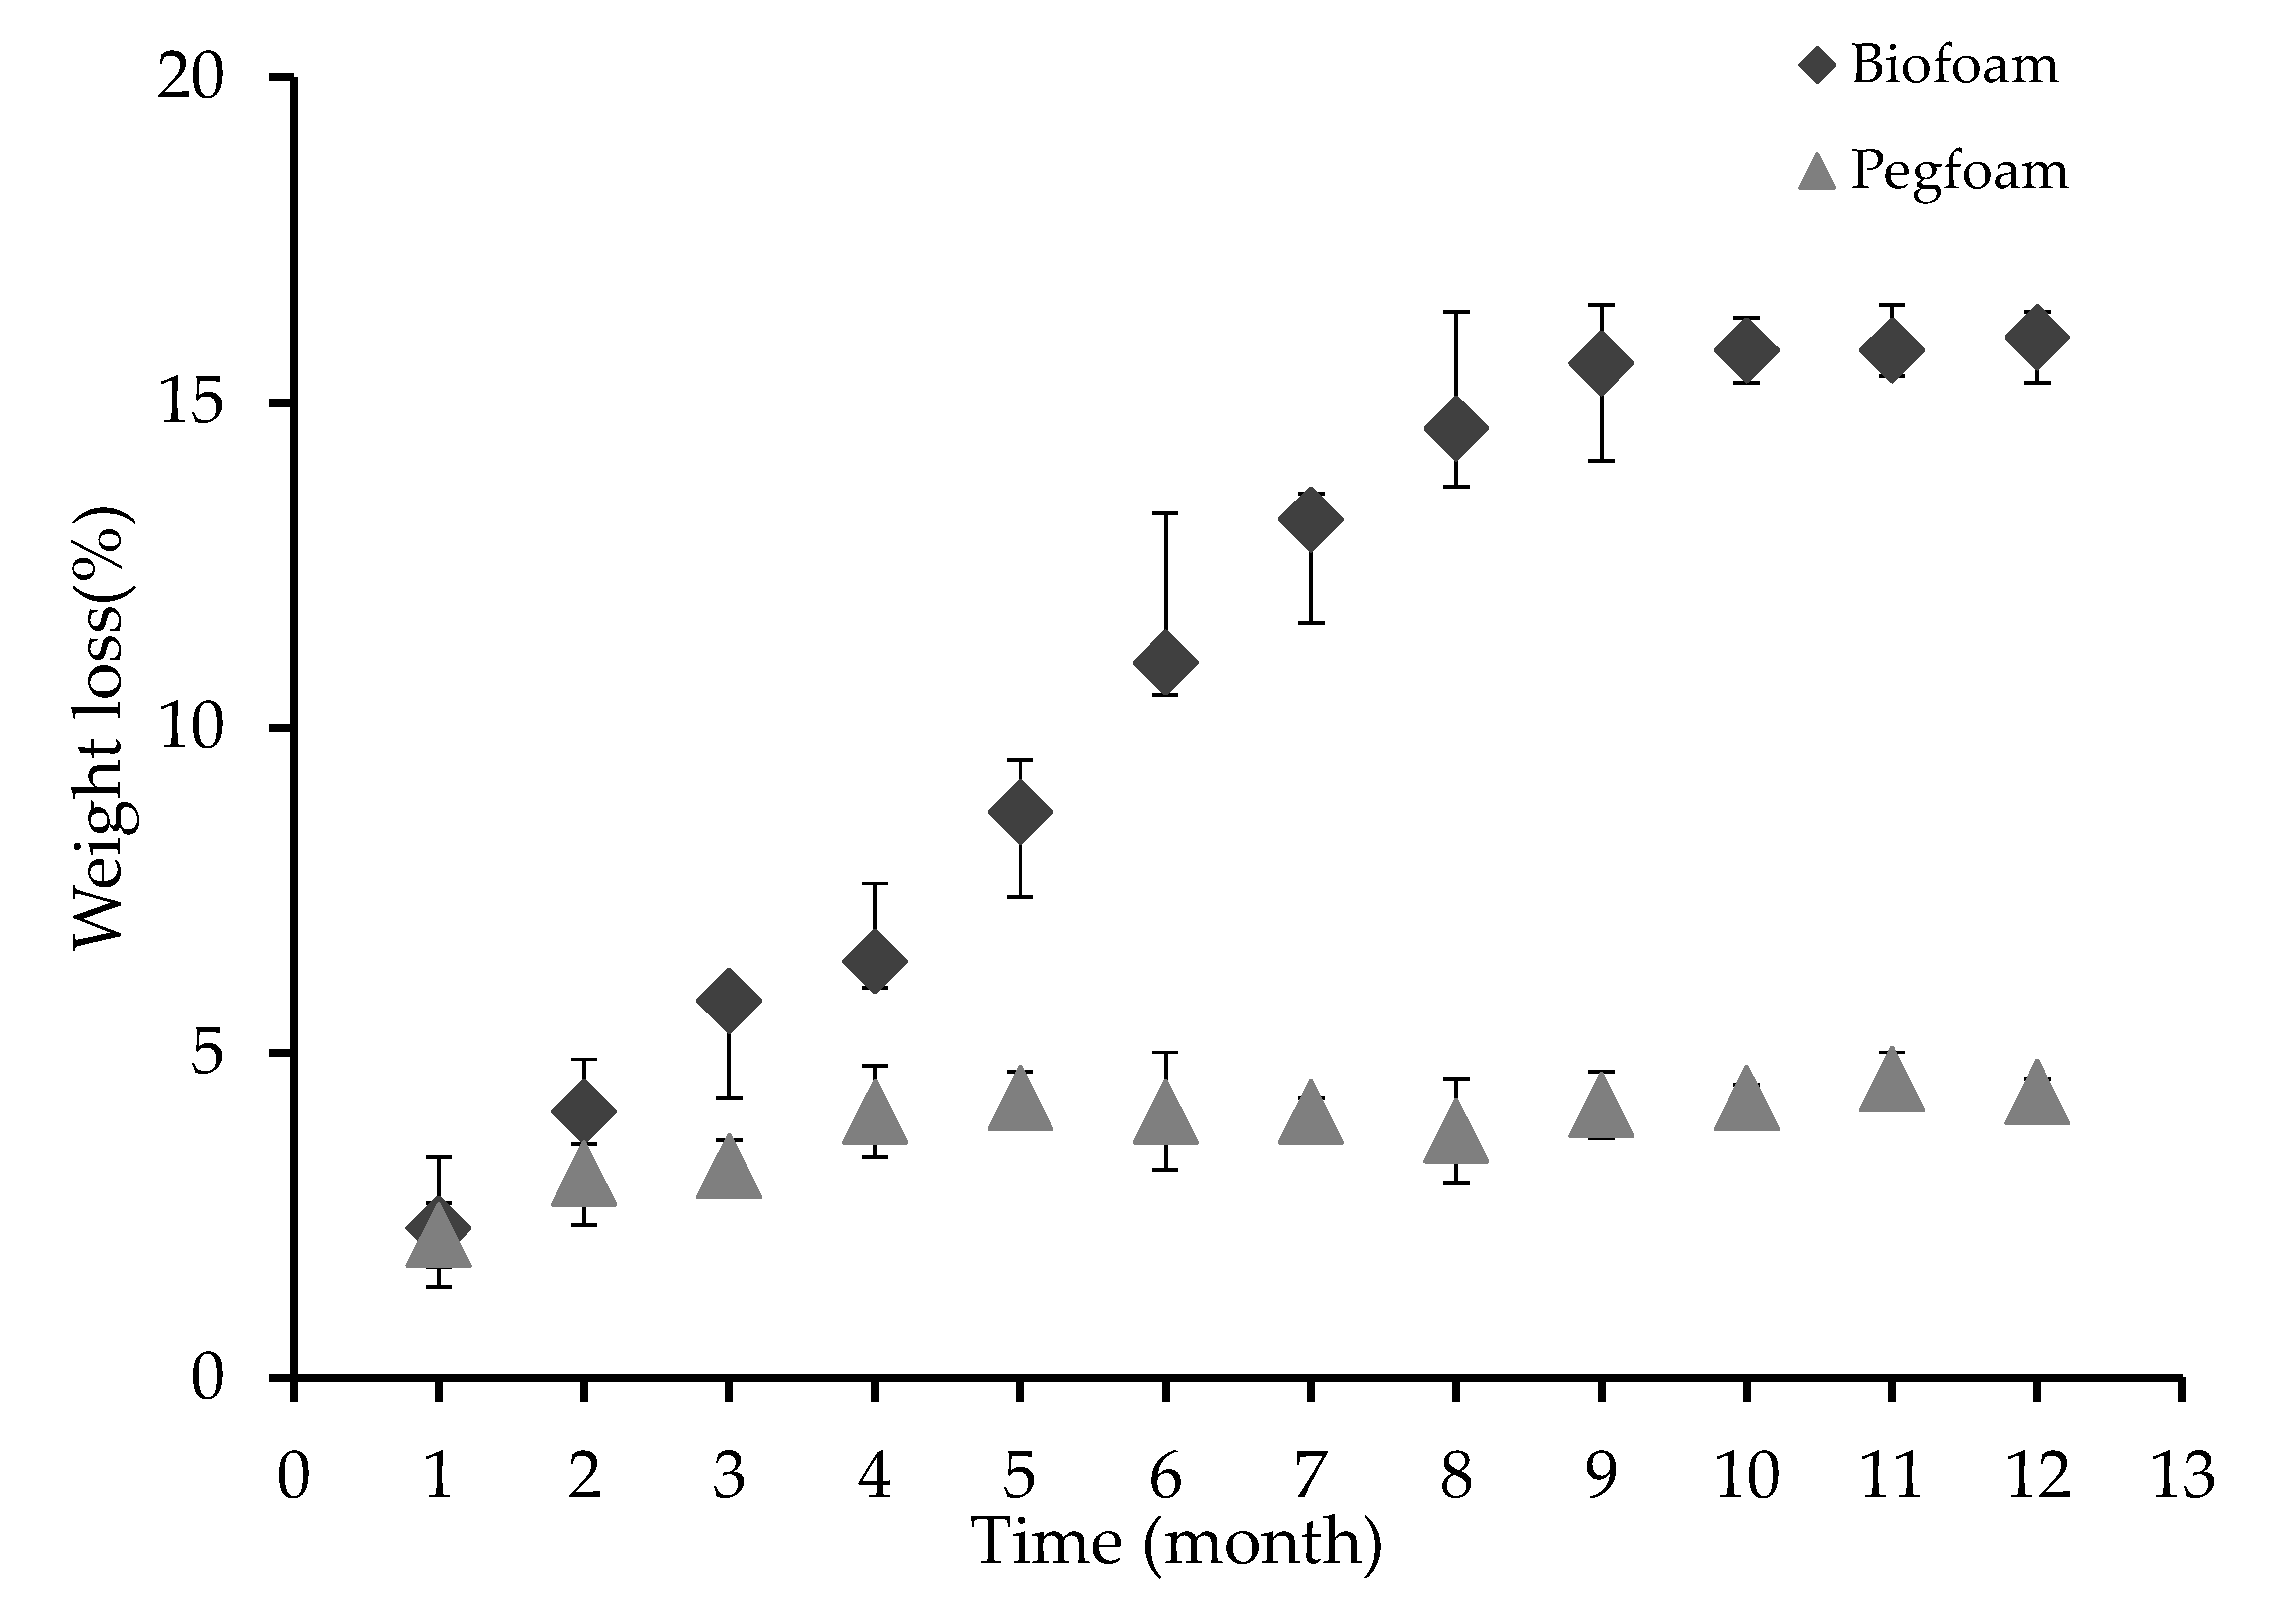
3.2.4. Biodegradation

The degree of biodegradation of the polyurethane foam samples buried in soil was assessed each month by measuring changes in the weight loss, as shown in Figure 10. The weight loss increased with time, giving a total loss of 15% over one year. The average values of three samples and error of samples were within 5%. The degradation velocity changed with different seasons. The degradability of polyurethane foams derived from liquefied matter and those derived from polyol showed a clear difference from the initial stage, which became more significant over time. It is clear from Figure 10 that the weight loss of the polyurethane foam from liquefied cotton stalk was faster than that containing polyol alone, which indicated that the wood component mainly contributed to the biodegradability of the foams.

4. Conclusions

The effects of the liquefaction conditions on the properties of the polyols and polyurethane foams produced using this feedstock were investigated. The optimal processing conditions for the liquefied product considering the quality of the polyurethane foams were studied as a function of the residue fraction. Bio-polyols with promising material properties were produced using liquefaction conditions of 150 °C, reaction time of 90 min, catalyst content of 3 wt.%, and 20 w/w% cotton stalk loading. Bio-polyols produced under preferential conditions showed hydroxyl numbers of 325–360 mg KOH/g, acid numbers below 5.00 mg KOH/g, and viscosities of 850–7950 mPa·s. Polyurethane foams produced under optimal conditions showed densities of 78–123 kg/m3 and compressive strength of 28–267 kPa. These results suggest that PEG–glycerin mixtures can be used as a liquefaction solvent to produce bio-polyols from agricultural waste biomass such as cotton stalk, which can subsequently be used to prepare polyurethane foams. The produced bio-polyols and polyurethane foams showed material properties comparable to their analogs from petroleum solvent-based liquefaction processes.

Author Contributions

Conceptualization, Q.W. and N.T.; methodology, Q.W. and N.T.; software, N.T.; validation, Q.W.; formal analysis, N.T.; investigation, N.T. and Q.W.; resources, Q.W.; data curation, N.T.; writing—original draft preparation, N.T.; writing—review and editing, Q.W.; visualization, N.T.; supervision, Q.W.; project administration, Q.W.; funding acquisition, Q.W. All authors have read and agreed to the published version of the manuscript.

Funding

This study was partially supported by the special funds for Basic Researches (B) (No. 15H05119, 376 FY2015~FY2017) of Grant-in-Aid Scientific Research of the Japanese Ministry of Education, Culture, Sports, 377 Science and Technology (MEXT), Japan.

Acknowledgments

N.T. would like to thank Japan Student Services Organizations for a grant that made it possible to complete this study.

Conflicts of Interest

We declare no conflict of interest.

References

  1. Fernando, S.; Adhikari, S.; Chandrapal, C.; Murali, N. Biorefineries: Current status, challenges, and future direction. Energy Fuels 2006, 20, 1727–1737. [Google Scholar] [CrossRef]
  2. Effendi, A.; Gerhauser, H.; Bridgwater, A.V. Production of renewable phenolic resins by thermochemical conversion of biomass: A review. Renew. Sustain. Energy Rev. 2008, 12, 2092–2116. [Google Scholar] [CrossRef]
  3. Wang, M.; Xu, C.C.; Leitch, M. Liquefaction of cornstalk in hot-compressed phenol-water medium to phenolic feedstock for the synthesis of phenol-formaldehyde resin. Bioresour. Technol. 2009, 100, 2305–2307. [Google Scholar] [CrossRef] [PubMed]
  4. Vargas-Gutiérrez, C.V.; Castro-Salazar, H.T.; Ríos-Reyes, C.A. Synthesis and properties of polyurethane foams obtained from cassava starch and rice by-products. J. Mex. Chem. Soc. 2018, 62, 1–8. [Google Scholar] [CrossRef]
  5. Huang, X.; De Hoop, C.F.; Xie, J.; Wu, Q.; Boldor, D.; Qi, J. High bio-content polyurethane (PU) foam made from bio-polyol and cellulose nanocrystals (CNCs) via microwave liquefaction. Mater. Des. 2018, 138, 11–20. [Google Scholar] [CrossRef]
  6. Yang, Z.; Peng, H.; Wang, W.; Liu, T. Crystallization behavior of poly(ε-caprolactone)/layered double hydroxide nanocomposites. J. Appl. Polym. Sci. 2010, 116, 2658–2667. [Google Scholar] [CrossRef]
  7. Lee, J.H.; Lee, J.H.; Kim, D.K.; Park, C.H.; Yu, J.H.; Lee, E.Y. Crude glycerol-mediated liquefaction of empty fruit bunches saccharification residues for preparation of biopolyurethane. J. Ind. Eng. Chem. 2016, 34, 157–164. [Google Scholar] [CrossRef]
  8. Yamada, T.; Aratani, M.; Kubo, S.; Ono, H. Chemical analysis of the product in acid-catalyzed solvolysis of cellulose using polyethylene glycol and ethylene carbonate. J. Wood Sci. 2007, 53, 487–493. [Google Scholar] [CrossRef]
  9. Hassan, E.; barbary, M.; Shukry, N. Polyhydric alcohol liquefaction of some lignocellulosic agricultural residues. Ind. Crop. Prod. 2008, 27, 33–38. [Google Scholar] [CrossRef]
  10. Lee, S.; Yoshioka, M.; Shiraishi, N. Liquefaction of Corn Bran (CB) in the Presence of Alcohols and Preparation of Polyurethane Foam from Its Liquefied Polyol. J. Appl. Polym. Sci. 2000, 78, 319–325. [Google Scholar] [CrossRef]
  11. Li, H.; Feng, S.; Yuan, Z.; Wei, Q.; Xu, C.C. Highly efficient liquefaction of wheat straw for the production of bio-polyols and bio-based polyurethane foams. Ind. Crop. Prod. 2017, 109, 426–433. [Google Scholar] [CrossRef]
  12. Wang, Q.; Chen, Q.; Mitsumura, N.; Animesh, S. Behavior of cellulose liquefaction after pretreatment using ionic liquids with water mixtures. J. Appl. Polym. Sci. 2014, 131. [Google Scholar] [CrossRef]
  13. Lu, X.; Wang, Y.; Zhang, Y.; Cheng, X.; Yu, Y.; Jin, Y. Preparation of bio-polyols by liquefaction of hardwood residue and their application in the modification of polyurethane foams. J. Wuhan Univ. Technol. Mater. Sci. Ed. 2016, 31, 918–924. [Google Scholar] [CrossRef]
  14. Wang, Q.; Kawamura, S. Decayed woody material from mushroom cultivation: Characterization of liquefaction. Wit Trans. Ecol. Environ. 2018, 217, 481–492. [Google Scholar]
  15. Wang, Q.; Takahashi, H.; Takahashi, Y.; Kurokawa, H.; Sekiguchi, K.; Sugiyama, K. Characterization of liquefied waste bamboo and white-rotted wood. Wit Trans. Ecol. Environ. 2015, 195, 63–74. [Google Scholar]
  16. Ertaş, M.; Fidan, M.S.; Alma, M.H. Preparation and characterization of biodegradable rigid polyurethane foams from the liquefied eucalyptus and pine woods. Wood Res. 2014, 59, 97–108. [Google Scholar]
  17. Zhu, H.; Peng, Z.; Chen, Y.; Li, G.; Wang, L.; Tang, Y.; Pang, R.; Khan, Z.U.H.; Wan, P. Preparation and characterization of flame retardant polyurethane foams containing phosphorus-nitrogen-functionalized lignin. RSC Adv. 2014, 4, 55271–55279. [Google Scholar] [CrossRef]
  18. Yao, Y.; Yoshioka, M.; Shiraishi, N. Water-absorbing polyurethane foams from liquefied starch. J. Appl. Polym. Sci. 1996, 60, 1939–1949. [Google Scholar] [CrossRef]
  19. Wang, H.; Chen, H.Z. A novel method of utilizing the biomass resource: Rapid liquefaction of wheat straw and preparation of biodegradable polyurethane foam (PUF). J. Chin. Inst. Chem. Eng. 2007, 38, 95–102. [Google Scholar] [CrossRef]
  20. Kobayashi, M.; Asano, T.; Kajiyama, M.; Tomita, B. Analysis on residue formation during wood liquefaction with polyhydric alcohol. J. Wood Sci. 2004, 50, 407–414. [Google Scholar] [CrossRef]
  21. Kurimoto, Y.; Koizumi, A.; Doi, S.; Tamura, Y.; Ono, H. Wood species effects on the characteristics of liquefied wood and the properties of polyurethane films prepared from the liquefied wood. Biomass Bioenergy 2001, 21, 381–390. [Google Scholar] [CrossRef]
  22. Kim, K.H.; Jo, Y.J.; Lee, C.G.; Lee, E.Y. Solvothermal liquefaction of microalgal Tetraselmis sp. biomass to prepare biopolyols by using PEG#400-blended glycerol. Algal Res. 2015, 12, 539–544. [Google Scholar]
  23. Dísouza, J.; Wong, S.Z.; Camargo, R.; Yan, N. Solvolytic Liquefaction of Bark: Understanding the Role of Polyhydric Alcohols and Organic Solvents on Polyol Characteristics. ACS Sustain. Chem. Eng. 2016, 4, 851–861. [Google Scholar] [CrossRef]
  24. Luo, X.; Mohanty, A.; Misra, M. Water-blown rigid biofoams from soy-based biopolyurethane and microcrystalline cellulose. J. Am. Oil Chem. Soc. 2012, 89, 2057–2065. [Google Scholar] [CrossRef]
Figure 1. Influence of solvent ratio and reaction time on the residue content (here, liquefaction agent: 80% PEG400 +20% glycerin; sulfuric acid ratio: 3 wt.%; temperature: 150 °C).
Sustainability 12 04214 g001
Figure 2. Influence of liquefaction temperature and reaction time on the residue content (here, liquefaction agent: 80% PEG400 +20% glycerin; sulfuric acid ratio: 3 wt.%; cotton stalk: solvent = 1:5).
Sustainability 12 04214 g002
Figure 3. Influence of acid content and reaction time on the residue content (here, liquefaction agent: 80% PEG400 +20% glycerin; cotton stalk: solvent = 1:5; temperature: 150 °C).
Sustainability 12 04214 g003
Figure 4. Normalized FTIR spectra of cotton stalk polyols prepared with different liquefaction times (here, liquefaction agent: 80% PEG400 +20% glycerin; cotton stalk: solvent = 1:5; sulfuric acid ratio: 3 wt.%; temperature: 150 °C).
Sustainability 12 04214 g004
Figure 5. Effect of liquefaction time on the viscosity (here, liquefaction agent: 80% PEG400 +20% glycerin; cotton stalk: solvent = 1:5; sulfuric acid ratio: 3 wt.%; temperature: 150 °C).
Sustainability 12 04214 g005
Figure 6. Hydroxyl number and acid number of liquefied cotton stalk as a function of time (here, liquefaction agent: 80% PEG400 +20% glycerin; cotton stalk: solvent = 1:5; sulfuric acid ratio: 3 wt.%; temperature: 150 °C).
Sustainability 12 04214 g006
Figure 7. Effect of reaction time on the (a) density and (b) compressive strength of polyurethane foams.
Sustainability 12 04214 g007
Figure 8. SEM images of polyurethane foam samples prepared with reaction times of (a) 15; (b) 90; (c) 180; and (d) 300 min.
Sustainability 12 04214 g008
Figure 9. (a) TG curve and (b) time derivative of the weight loss for polyurethane foams with different processing times. The heating rate of 20 °C/min from room temperature to 800 °C under Ar gas flow of 200 mL/min.
Sustainability 12 04214 g009
Figure 10. Weight loss of polyurethane samples over time in biodegradation experiments.
Sustainability 12 04214 g010
Table 1. Chemical composition and ultimate analysis of the raw cotton stalk material.
MethodsContentCotton Stalk
Composition analysis (wt.%)Lignin25.3
Hemicellulose17.4
a-Cellulose48.8
Ash6.8
The mean values were calculated based on experiments repeated more than three times.
Table 2. Gel permeation chromatography (GPC) analysis conditions.
GPCConditions
Mobile phaseTetrahydrofuran
Flow rate1 mL/min
Dilute concentration of sample0.1 w/v %
Tetrahydrofuran column temp.40 °C
Volume of sample loop100 µL
Table 3. Influence of reaction time on the molecular weights of liquefaction products.
Reaction Time (min)Mp1Mp2AreaP1: AreaP2MnMwd = Mw/Mn
30134010702.13102012001.18
60140010602.1103011501.2
90145010402.1210407401.22
300150010352.13103512801.23
Liquefaction agent: 80%PEG400+20% glycerin; sulfuric acid ratio: 3 wt.%; cotton stalk:solvent = 1:5; temperature: 150 °C.

