Article

Willingness-to-Pay for District Heating from Renewables of Private Households in Germany

1
Department of Management in the International Food Industry, University of Kassel, 34125 Kassel, Germany
2
DIL—Deutsches Institut für Lebensmitteltechnik e.V., 49610 Quakenbrück, Germany
3
AGFW | DerEnergieeffizienzverband für Wärme, Kälte und KWK e.V., 60596 Frankfurt am Main, Germany
*
Author to whom correspondence should be addressed.
Sustainability 2020, 12(10), 4129; https://doi.org/10.3390/su12104129
Submission received: 24 April 2020 / Revised: 13 May 2020 / Accepted: 15 May 2020 / Published: 18 May 2020

Abstract

:
Recent discussion about future energy production promotes the recovery of industrial heat as a potential solution to reduce carbon emissions. Experts call for an expansion of central heating by renewable energy systems to ensure a decarbonization of energy systems. In this context, district heating could play a significant role in city and district planning. Nonetheless, for private households, environmental aspects are only one factor amongst others as, e.g., capital costs, comfort and security. In this study, we focus on private household preferences and willingness-to-pay for district heating and district heating from renewables compared to gas condensing boilers and heat pumps. For the study, we decided to apply a discrete-choice experiment and collected data on attitudes towards sustainability, economic aspects and demands for providers of heat supply as dimensions for a factor and cluster analysis in order to apply a market segmentation. The results show that district heating by renewables is the most preferred heating option for households followed by district heating from fossil fuels, heat pumps and gas boilers. Furthermore, the study offers more profound insight into the willingness-to-pay for each heating option and reports interaction effects for the different market segments that could be identified in the analysis.

1. Introduction

The heating system is an essential component of the maintenance and improvement of comfort in a home, as heat energy is required for heating rooms, incoming air and domestic hot water. Space heating demand accounts for a significant fraction of the overall residential energy demand. Private households in Germany consumed about 1570 PJ for heating in 2015; this means more than 69% of the total final energy demand for residential purposes [1]. In Germany, residential heat supply is mainly based on two fossil fuels, heating oil and natural gas. According to the German federal ministry for economic affairs and energy [2], in 2016 about 47% of existing homes were using gas for heating, while about 24%, had an oil-based residential heating system (RHS). Moreover, 44% of the newly built homes were equipped with a gas-fired RHS [3].
Due to this vital role of oil and gas, residential heating is strongly linked to policy considerations related to global warming, the security of energy supplies and increasing energy prices [4]. Several studies emphasized the potential for renovations to reduce greenhouse gas emissions (GHG) [5]. Moreover, the expansion of district heating is an essential option for becoming independent of fossil fuels [6]. Studies show that in the future district heating will be more cost-efficient, and especially in large cities the capital costs will become rather low [7,8]. District Heating offers the possibility to use a variety of heat sources. On the one hand, it can use heat sources that are often wasted; on the other hand, heat from renewables can be used to produce carbon-neutral energy [9,10,11].
From many experts district heating from renewables is seen as one crucial path for decarbonizing the EU energy system [12,13,14]. Furthermore, studies show that district heating produced by a biomass-based combination of heat and power (CHP) is the most widely acceptable heating alternative in some areas [15,16,17]. Nonetheless, the renovation of building stocks, optimized isolations and passive houses can lead to new energy efficiency and therefore to a lower energy demand that can become challenging to district heating providers [18,19]. In this scenario, a gradual expansion of district heating to private households could be a future solution. For this purpose, it requires a long-term planning process that should include costs, resources and environmental and climate aspects [12,20]. In Germany, district heating is becoming more and more important [21,22]. While in the year 2000 only 7% of all new constructed private buildings were supplied by district heating, this value increased to 24% in 2016 [23].
Policy goals for GHG emission reductions and energy efficiency are lacking new policy measures in building new houses and renovating existing houses. For this purpose, it is crucial to identify the key determinants and heterogeneity of these choices. Besides newly constructed housing, in particular, old houses with oil boilers have a significant potential for the replacement of non-renewable fuel with some alternative heating system or fuel with lower GHG emissions [24]. In 2017, 0.49 million Germans indicated they would renovate their private heating systems within the next two years. Another 1.26 million are thinking of renovating, but the final decision has not yet been made [25]. Therefore, existing houses represent a significant potential source of emission reductions as well, compared to new house construction.
This paper is focused on private households’ preferences for district heating and district heating from renewables. Both homeowners and renters are included. We applied a Discrete-Choice Experiment (DCE) to compare the preferences and willingness-to-pay for different heating alternatives (district heating from fossil fuels, district heating from renewables, heat pump and gas condensing boiler). The DCE-method allows for a detailed analysis of household preferences for the different heating alternatives. From the results, the additional willingness-to-pay a price premium for district heating from renewables is derived.
In previous studies employing choice modelling, the focus was on customer, home and spatial characteristics, whereas heating system attributes have not been considered. Furthermore, these studies mostly relied on ownership data; in such cases, the choice is understood as ownership or availability rather than the actual or planned purchase of a heating system. For example, Vaage (2000) and Braun (2010) analyzed the determinants of (actually) owning the heating system, using Norwegian and German cross-sectional household data, respectively [26,27].
Our study extends previous works employing choice modelling by explicitly presenting environmental impacts for each labelled heating system as absolute emission levels and customizing the choice sets according to the availability of district heat. Utilizing our choice modelling results, we then aim to calculate the willingness-to-pay for different heating systems. In order to analyze the Willingness-to-Pay (WTP) for different household and market segments, a cluster analysis was carried out based on the attitudes of the households towards local providers, sustainability and economics of heating systems. The final clusters were connected to the WTP. Furthermore, we considered, concerning WTP changes, if the household is in the process of planning a renovation of the heating system.

2. Materials and Methods

2.1. Questionnaire and Sampling

The objective of this study is to analyze preferences of individuals who are making or planning heating system decisions. Correspondingly, the study sample comprises individuals who are currently building or planning a new detached house. Homeowners who are replacing or planning to replace their existing heating system enter the sample as well. A third group are renters who consider the heating system and the associated costs when they are looking for a new flat (i.e., all adult Germans potentially belong to this group). The consumer sample of the survey was drawn from an online panel from the company Respondi. Respondi is an international ISO-certified panel provider. The internationally valid ISO 26362 standard evaluates the design and the operating effectiveness of quality management. Four hundred and ninety-two respondents completed the survey. Table 1 presents descriptive statistics for the sample.
The data show that the sociodemographic of the sample is quite similar to the German population. Nonetheless, within the sample, the generations above 45 years old are underrepresented, and people in big cities are overrepresented.
Besides sociodemographic data, the questionnaire consists of data about households’ experiences with different forms of heating systems, images of different heating systems, attitudes about providers, price and sustainability of heating systems, scenarios about the future and discrete choice sets with varying prices and different selections of heating systems.

2.2. Discrete-Choice Experiment

In addition to questions on socio-demographic characteristics and agreements with statements on energy and heating systems, a DCE for heating systems was included in the questionnaire. After the DCE, respondents were asked about their current heating system, whether they had replaced the original heating system in the last years and whether they had any plans to replace or renovate the current primary heating system in the future.
The DCE method is based on microeconomic theory according to which individuals always try to maximize their benefit [28].
In a choice experiment, respondents indicate their preference through (repeated) decisions, with which they choose the one alternative out of different alternatives or goods (evoked set) that they prefer most. The choice can be interpreted as the discrete variable that possesses the characteristics ‘chosen’ or ‘not-chosen’. According to Lancaster (1966), a good or product can be understood as a bundle of different objective characteristics from which a consumer derives utility for this good [29]. The Nobel price winner McFadden (1974) refined this approach with recourse to the random utility theory of Thurstone (1927) [28,30]. Hereby, it was possible to calculate the utility that consumers derive from the different product characteristics based on choice decisions via logistic regression models. The DCE method has the advantage of accounting for the multi-attribute nature that characterises most behavioural decision-making processes.
As mentioned, in DCEs, individuals must choose from a set of different products offered at determined prices. The products differ regarding the tested product attributes (e.g., annual operation costs, etc.). According to microeconomic theory, participants will choose the product with the highest benefit. Employing DCEs, individuals’ benefit for each tested product attribute can be measured, as well as the influence of each product attribute on the probability of purchasing the product.
On the basis of the attributes in Table 2, an experimental design plan was developed for carrying out a discrete-choice experiment. A choice design consists of sets of several alternatives, and each set of alternatives is called a choice set. Each single alternative can be described by the different attributes and attribute levels. The chosen attribute levels are based on literature research and on expert judgment. The final choice task for the respondent is to choose the alternative she or he prefers most out of the given set.
The DCE of heating systems was conducted using choice sets offering three heating system alternatives with varying level attributes: (1) Annual operating cost, (2) investment cost, (3) primary energy factor, (4) CO2 emissions and (5) price risk (Table 2). The heating systems in the choice sets were (1) district heating from fossil fuels, (2) district heating from renewables, (3) ground heat/heat pump and (4) gas condensing boiler. The investment costs had the levels 4000 €, 6000 €, 8000 € and 10,000 € for private households.
The respondents were asked to choose for each choice set the heating option they would choose if they were to buy/construct a new house or renovate their actual systems, and if there were no other options available. Moreover, they were told that they should assume that their house or flat was currently either located near a heating network or connected to such a network. The investment costs were related to a house/flat measuring 120 m2.
The choice of attributes and their levels (Table 2) was based on earlier studies, on feedback from experts and on a pre-test of the questionnaire. The same levels of investment cost and required own work for both house size classes were chosen, as these attributes vary significantly. The annual operating cost and CO2 and fine particle emissions were calculated based on the energy consumption of an average detached house, the efficiency of a heating system and the unit price/emission of a fuel and expressed as annual totals in the choice experiments.
In total, 12 different (unlabeled) choice sets were generated using the Software NGene [31], allowing for the main effects to be identified and estimated without confounding. For that purpose, all parameters mentioned in Table 2 were used to set up an efficient design by using priors based on expert judgement (e.g., negative priors for cost parameters).
Each choice set consisted of three alternatives and each respondent had to make all 12 choice decisions. Nonsensical choices were eliminated by using restrictions in the generating process of the experimental design. The choice sets had different orderings of the heating systems to eliminate possible ordering effects in choices. See Table 3 for a choice set example.
Our model is estimated in WTP space using a DCE that accounts for unobserved heterogeneity in correlated WTP coefficients and observable user group and demographic (homeowners vs renters) characteristics. Train and Weeks [32] recommend this approach and reparametrize the random parameter (mixed) logit model (RPL) by defining the distribution of WTP directly. Thus a generalized multinomial logit model (GMNL) is applied [33]. Interaction terms for WTP measures and user group and demographic variables are included in it. Consequently, significant differences in monetary valuations of product traits can also be explained based on observable respondent-specific attributes. The calculated WTPs relate to the annual operation costs per m2 and year because this parameter was used for GMNL estimation for the monetary evaluation. In the Supplementary Materials a detailed overview about the applied model is given.
As a further important feature, unlike most other WTP space studies, we allow for correlations between the random WTP coefficients of different attributes.

2.3. Cluster Analysis

During the survey, attitudinal statements were given to the respondents on a five-point rating scale from “important (1)” to “unimportant (5)”. Overall, 13 variables were used to learn about the attitudes of the consumers towards local providers, sustainability and economics of heating systems. For market segmentation of the households, these 13 variables were reduced to a lower number of latent variables, utilizing principle component analysis. The aim is to display the high quantity of variables while simultaneously obtaining a low loss of variance. The final number of factors was determined by the Kaiser criterion (Eigenvalue > 1) and crosschecked by plotting a scree plot [34]. For a more straightforward interpretation of the factors, varimax rotation was applied. Finally, Cronbach’s alpha scores were used as a measure for internal scale reliability.
In order to achieve a customer segmentation, k-means clustering was applied to the factors. Cluster analysis was used for the minimization of variance within different groups of costumers in the dataset. For calculating the distance between the individuals, squared Euclidean distance was used. For the determination of the final number of clusters, the Ward method was performed beforehand. Additionally, outliers were eliminated by single linkage clustering. Initially, the dendrogram and the elbow criterion were observed to determine the final number of clusters.

3. Results

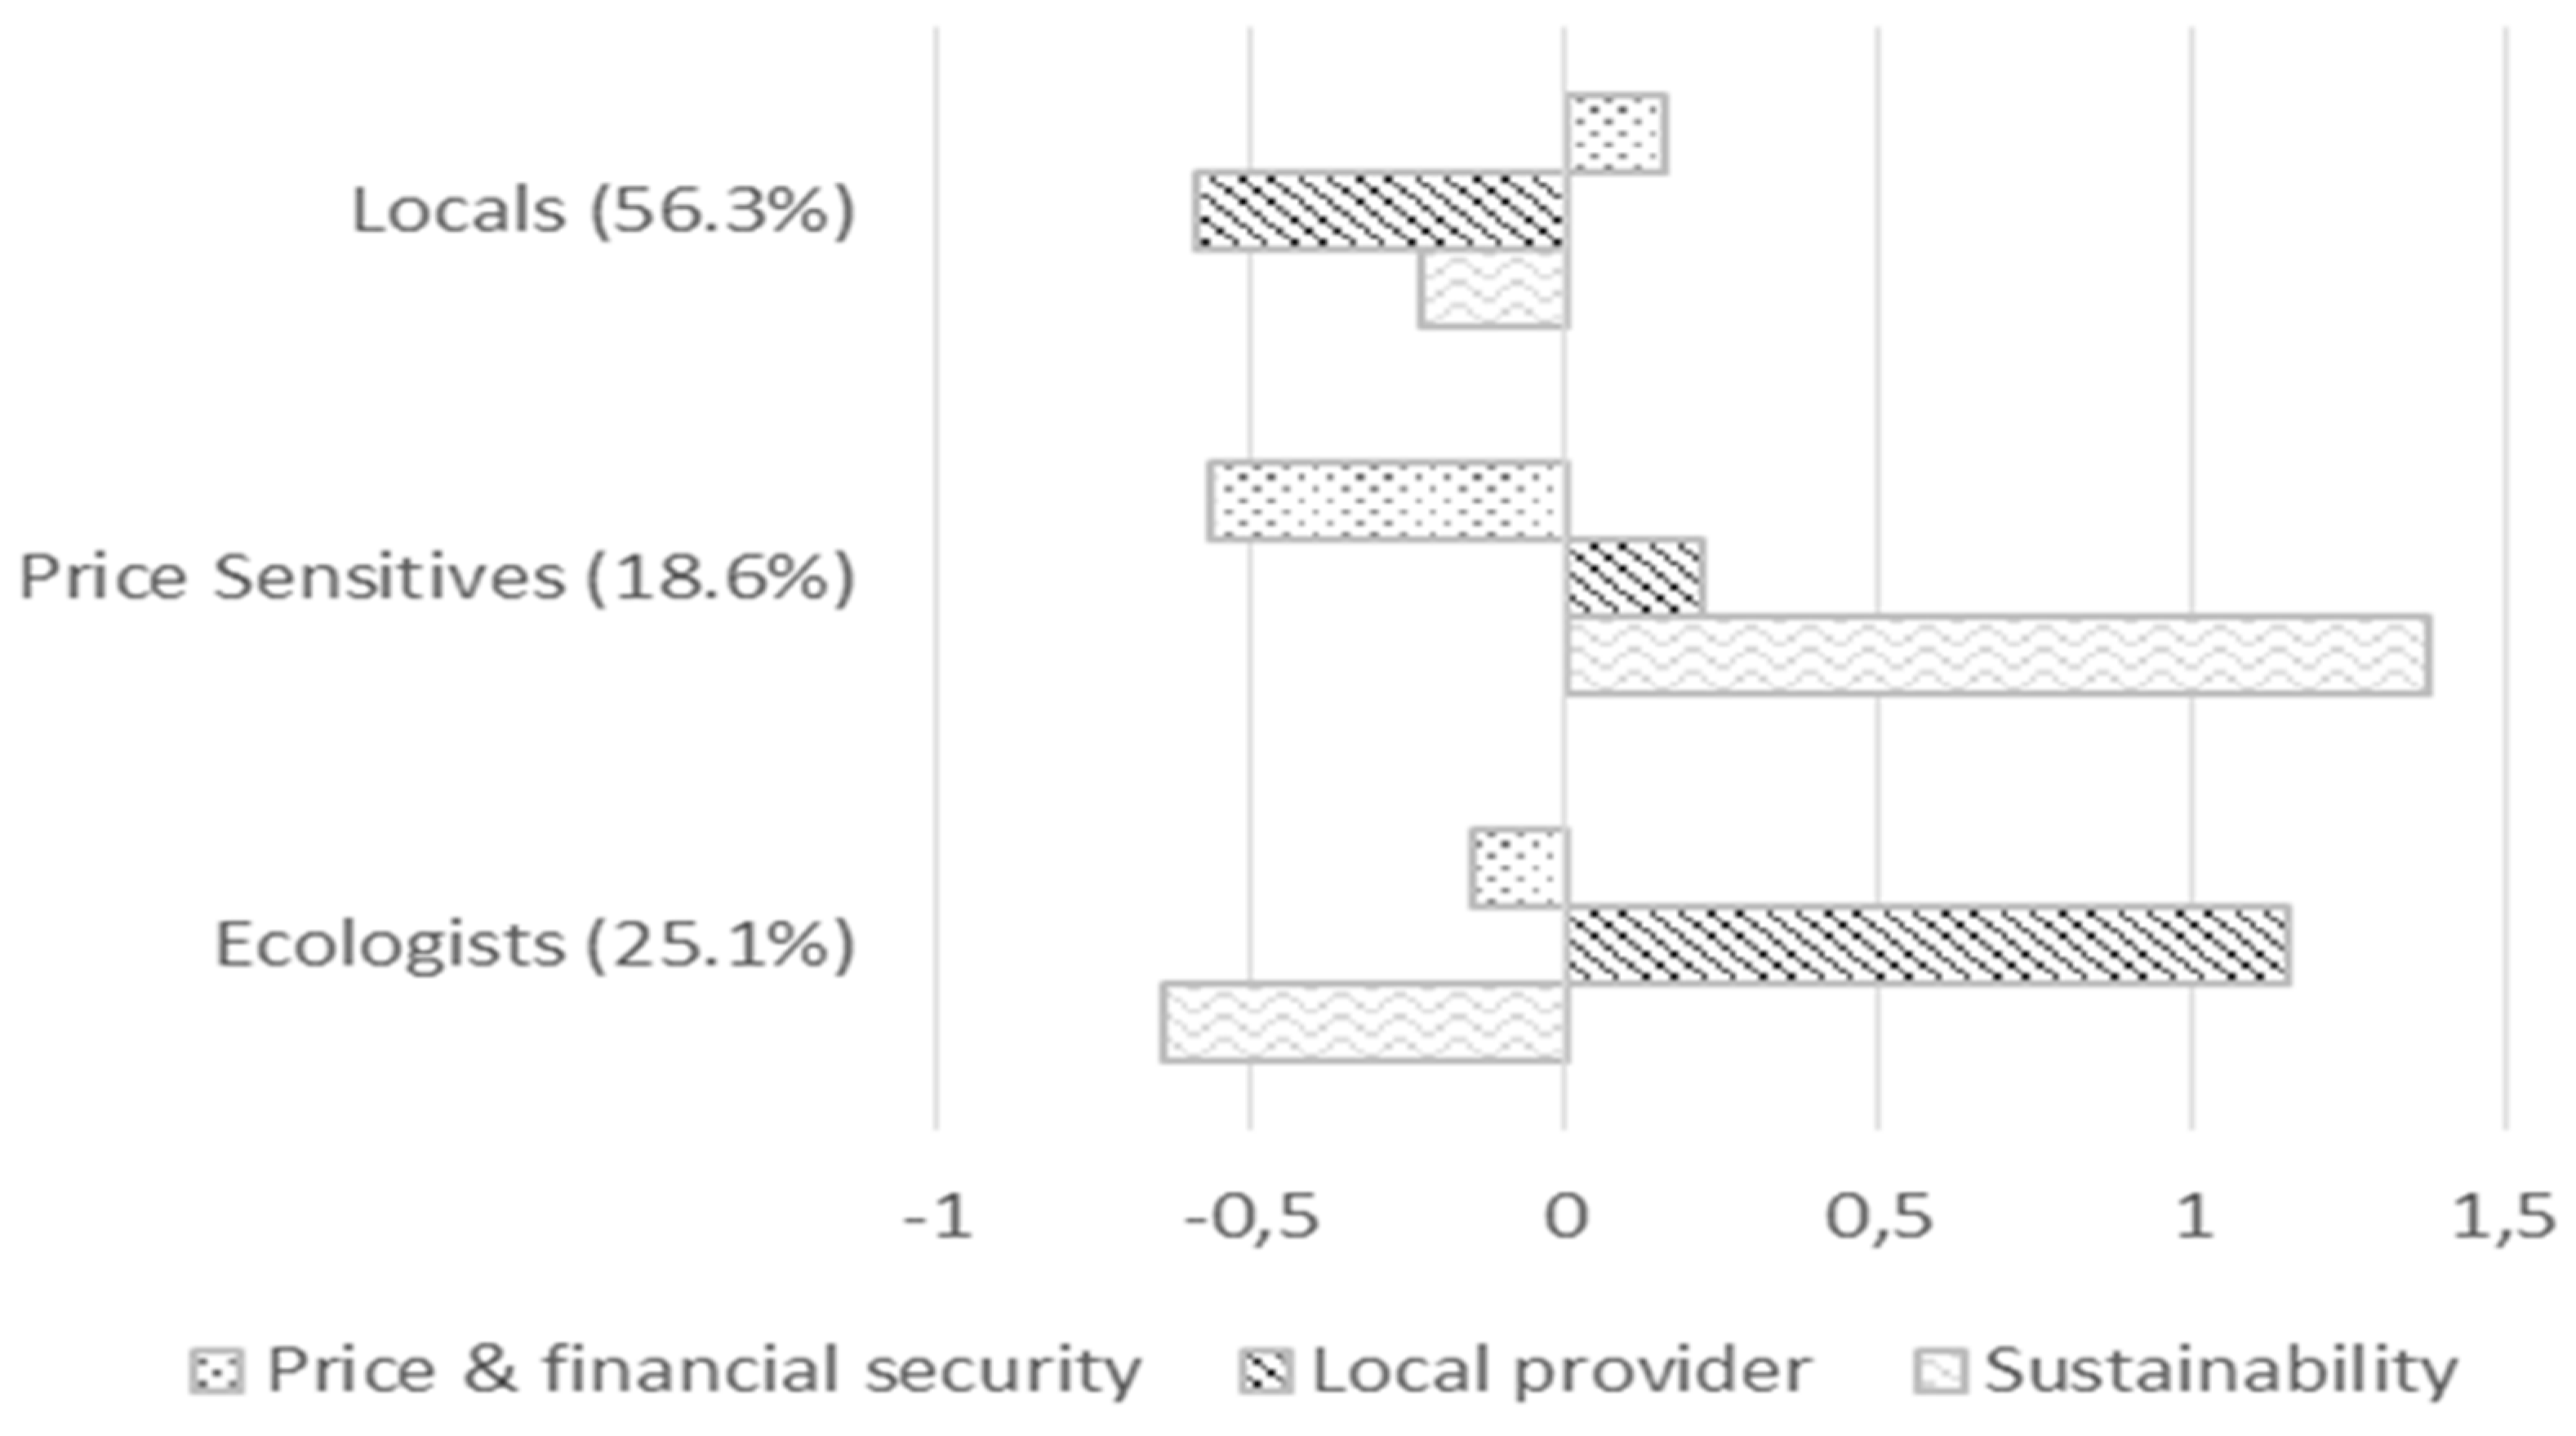
3.1. Cluster Analysis

In a first step, the analyses focused on participants’ expectations about energy suppliers. These expectations were analyzed by 13 items concerning price, transparency, form of partnership and environmental impact (see Table 4). For each item, a five-point-rating scale was used with a range from important to unimportant. A principal component factor analysis was conducted on the 13 items with varimax rotation. The Kaiser–Meyer–Olkin (KMO) measure verified the sampling adequacy for the analysis, KMO = 0.904, and all KMO values for individual items were higher than 0.84, which is well above the acceptable limit of 0.5 [35]. As the criterion for extracting the final factor solution, an initial analysis was run to obtain eigenvalues for each factor in the data. Three factors had eigenvalues over Kaiser’s criterion of 1 and in combination explained 67.11% of the variance.
Table 4 shows the factor loadings after varimax rotation. The items that cluster on the same factor suggest that factor 1 represents a preference for price and financial security (F1), factor 2 represents a preference for local providers (F2) and factor 3 represents responsibility for the environment and sustainability (F3). Cronbach’s α measured the reliability of the factors. All factors had high reliability; all Cronbach’ α were above 0.78, which is considered “good” regarding internal scale reliability.
Factor 1 combines positive attitudes towards price and financial security. The variables reflecting these factors mainly include reasonable pricing, transparency and stable prices. Further variables of this factor are high trust in the provider and high security of the supply. The second factor identifies mainly locally attitudes towards the important characteristics of heating systems. Direct contact to a local provider and a long-term partnership belong to factor 2. F3 pools items which display the importance of sustainability (e.g., pollution of a high share of renewable energies).
Based on the three factors, three clusters were identified after eliminating six outliers (see Figure 1). The results confirm the existence of different consumer segments regarding attitudes towards heating systems. The first and largest cluster, “The Locals”, represents 56.3% of the sample. These consumers show less sensibility for prices and prefer a local provider. At the same time, they show some preferences for sustainability.
The second cluster, “The Price Sensitives”, is characterized by high scores for the factor “price and financial security”; the factors “local provider” and “sustainability” are not as relevant as in the other clusters. The third cluster “The Ecologists” consists of people who take care of environmental aspects. People in this cluster exhibit a relatively high sense of responsibility for environmental issues, but do not care about a local provider.

3.2. Discrete-Choice Experiment

The results in Table 5 demonstrate that district heating from renewables is the most preferred heating system in this study based on the annual operation costs and under the assumption of identical investment costs for the heating systems under consideration. The households indicated a WTP of 10.32 € per m2/a for this alternative, compared to the reference gas condenser boiler. In second place follows district heating from fossil fuels with a WTP of 5.43 € per m2/a. Compared to the reference, ground heating had a positive and significant WTP as well.
The parameter for the investment costs revealed that for an increase of these costs of 10,000 €, the households must be compensated with decreased annual operation costs of 3.45 €/m2/a for evaluating both as equivalent. For a house or flat with 120 m2 and an assumed physical life of 20 years for all components of the heating system, this compensation adds up to 8,280 € (120 m2 × 20a × 3.45€/m2/a). The uniform lifetime was assumed for better comparability, and it is known that some individual components of the heating system have a significantly longer lifetime. These investment costs are more critical for the household choice of the heating system compared to the annual operation costs.
If the fact that investment costs for access to district heating are in general lower in comparison to investment costs for gas condensing boiler is accounted for, the WTP for district heating is reduced; e.g. if the difference is 10.000 €, the calculated 3.45 € must be subtracted (WTP-district-heating fossil fuels reduced = 5.43 € – 3.45 € = 1.98 €). In Germany in 2018, the cost difference between district heating and gas condenser boiler was on average about 2.30 € per m2/a [36]. Therefore, the revealed WTP in the survey for district heating from fossil fuels reduced by the difference in investment costs is about the cost difference that can be found in the market. Nevertheless, full cost accountings for gas boilers and district heating show smaller cost difference between the heating systems, especially for multi-family housing [37].
It should be highlighted that in this study households stated a significant additional price premium just for the fact that the district heating is coming from renewables instead of fossil fuels. However, it has to be considered that households could have overstated their WTP because they were only making a hypothetical choice. Despite this fact, the results are still a good indicator for the preference ranking of the different heating system. All standard deviations of the random parameter coefficients in the GMNL model are significantly different from zero. Respondents weight the attributes differently and averaging these weights across respondents leads to statistical insignificance.

3.2.1. Interaction Effects

Concerning the different clusters, a high degree of heterogeneity between the segments can be found, as can be seen from the numerous significant interactions. It appears plausible that Ecologists revealed a significantly higher WTP for district heating from renewables (Δ+1.41 €), whereas they pay less for district heating from fossil fuels (Δ–1.71 €). This finding is in line with research for green electricit; e.g., Hille et al. [38] found that ecologically orientated people are willing to pay a price premium for electricity produced from renewable energy sources.
Price sensitives show a lower WTP for district heating from fossil fuels (Δ–3.03 €) and district heating from renewables (Δ–3.34€). For this group, it can be hypothesized that these do not want to be bound for a long time on only one system so that they can switch to the cheapest heating option or cheapest supplier. Interestingly, house owners had a below-average WTP for each kind of district heating (ΔWTPfossil: –2.38 €, ΔWTPrenewables: –2.53 €). The reasons for that behaviour are unclear. It could hypothesize that house owners have a higher need to be free in their energy supplier choice or that they are satisfied with the current heating system.
Respondents in the process of planning a new heating system revealed an above-average WTP for district heating from fossil fuels (Δ+1.58 €) and the WTP for district heating from renewables is not reduced in comparison to the rest of the sample. Therefore, it can be stated that even when it comes to the real-world decision, district heating is still highly preferred.
It should be noted that, concerning calculation of the WTP, for one of the mentioned segments, the interaction effects have to sum up to the main effect; e.g., for the price sensitives and district heating from renewables, the calculation is:
WTP for district heating from renewables for the segment price sensitives =
WTP district heating from renewables + WTP district heating from renewables × price sensitives
For the mentioned case, the WTP for district heating from renewables for the segment price sensitives is 6.98 € (10.32 €–3.34 €) and 2.40 € (5.43 €–3.03 €) for district heating from fossil fuels.

3.2.2. Interactions between Attribute Preferences

The random parameters are defined as being correlated with each other. Table 6 presents the full correlation matrix of the random parameters for the GMNL-WTP-space model. There is a statistically significant positive association between the preference for district heating from fossil fuels and district heating from renewables, i.e., those respondents who exhibit a higher WTP district heating from fossil fuels are more likely to value district heating from renewable alternative as well. This correlation is less strong between ground heating and the district heating options.

3.2.3. Scale Heterogeneity

Besides preference heterogeneity, we also find statistically significant scale heterogeneity. Therefore, the assumption of identical scales across individuals should be rejected. The value of the parameter of scale heterogeneity (0.639) showed a considerable scale heterogeneity for respondents (Table 5). The rather quantitatively tremendous value implies that a certain degree of randomness existed in their choice decisions, and hence a certain degree of uncertainty. A plausible explanation for this specific degree of uncertainty was that many respondents might not be able to disentangle sophisticated ecological and environmental attributes and discern the utility changes associated with different heating options.

4. Discussion

The results clearly show that ‘district heating from renewable energies’ is the most preferred heating option for the analyzed households. The ranking of the other alternatives is ‘district heating from fossil fuels’, ‘heat pump’ and ‘gas’. It should be highlighted that the participants revealed a significant additional WTP for ‘district heating’ just for the fact that it is from renewable energies. The WTP is about 5 € higher for this option than for ‘district heating from fossil fuels’. Nevertheless, the WTP differs between different consumer segments in the market. During the study, we could identify more than 18% of the participants in our survey as price sensitive. Within this group, the WTP for district heating from renewables but also district heating from fossil fuels is much lower than for the average participant in the survey. On the other hand, we can see a segment of more than 25% that has an above average WTP. We call this segment “The Ecologists”; this cluster of people stated a high preference for low pollution and a high share of renewable energy. Furthermore, the cluster we called “The Locals” also has a high WTP for district heating, especially for district heating from renewables. “The Locals” represents about half of the sample.
Even if we reconsider that the probability of overestimating the WTP is very high in a discrete choice experiment, the data show significant preferences for district heating and renewable energy systems. Another issue is the representativeness of the sample. In our sample we have an overrepresentation of people age 45 and younger and an underrepresentation of people age 45 and older. This may affect the results in both ways; on one hand, older people do usually have a better financial background; on the other hand, younger people often have a more positive attitude towards ecofriendly technology. Nevertheless, the findings demonstrate that house owners and renters in Germany are aware of the association of energy and global warming and are willing to pay a higher price for ecofriendly energy. Thus, from a demand side, most parts of the population do already favour district heating. Therefore the discussions about using district heating for decarbonization [6,9,10] seem to be supported by the German population. Especially people who plan to build a new heating system prefer district heating, while house owners have a lower WTP for district heating. Considering the review of Werner [24], which shows that especially old houses with oil boilers have a high potential for reducing greenhouse gas emissions, the results show the positive attitudes of consumers towards this potential. On the other hand, house owners, in general, seem to be more sceptical. This could mean that house owners who do not plan to renew their heating systems are satisfied with their current situation. In general, it seems to be possible to use district heating for decarbonization from the demand side.
“The Price Sensitives” show a low WTP for district heating. Based on the current study, we cannot explain the reasons for this behaviour. It seems obvious that, especially in this cluster, the estimated installation and operating costs play a major role. It is possible that district heating is seen as a complex system that deals with long-lasting contracts up to 10 years (maximum contract period in AVBFernwärmeV §32). This could give rise to fears that this would be expensive in the long term. However, district heating is characterized by stable prices, which may only be adjusted according to defined rules (Preisänderungsklausel AVBFernwärmeV §24). The volatile prices of energy sources such as gas or oil only lead to minor price fluctuations due to the pro-rata consideration. To analyse the different motives and drivers for the different clusters of consumers, more research is necessary.
This study was conducted under the assumption that the various heating alternatives are available to all end customers and that the decision is primarily based on economic and ecological aspects and personal preference. In reality, however, in addition to the willingness of the customer, the technical and organizational requirements must also be met. One condition is the existence of a district heating network to connect to, which is usually possible mainly in urban areas. About 30% of the total German population live in the 70 largest German cities, and at the same time more than 50% of the total district heating sales are generated there [39]. This is because district heating has its advantages above all when as many heat consumers as possible can be connected per meter of pipeline, so densely populated urban areas with apartment buildings are particularly suitable. However, especially in the case of apartment buildings, the individual cannot determine his or her own type of heat supply independently of the other occupants/co-owners of the house owner.
Since the energy supplier must ensure that its heat generation units can meet the customer’s heat requirements, the expansion of the district heating grid needs to be planned in detail, especially because the construction of a new production plant and new pipeline is associated with high investment costs. In order to minimize the entrepreneurial risk, analyses of potential customers are an important part of the planning process, also because the connection rate has a massive influence on the heat generation costs of the individual system [40].
In recent years, the importance of district heating networks for achieving climate targets has been demonstrated in numerous studies. European legislators have also taken note of this and no longer concentrate solely on electricity and transport, but recognize that a successful energy turnaround is not possible without the heat sector. Large unused potential has been identified in the heating sector. Today, heating and cooling are seen as the key to accelerated decarburization of the energy system [41]. This has also led to demands for corresponding investments at the political level national and in Europe [42].
If today large amounts of heat are still obtained from highly efficient CHP processes, the integration of renewable energies is particularly important for the future. The 40/40 strategy drawn up by the German District Heating Association shows that, in combination with the energetic renovation of buildings, a reduction of CO2 emissions by approximately 80% can be achieved by 2050 (compared to 1990). This requires innovative systems and solutions, which are predominantly accompanied by massive investments and thus make it more difficult to achieve economic viability and, above all, to compete with conventional fossil supply alternatives. Through suitable support programs and investment incentives, these potentials can be better utilized in the future [43].
From a technical point of view, numerous renewable alternatives are already available as potential heat sources (e.g., solar thermal, biomass, geothermal, power to heat, surplus or waste heat from industrial companies, etc.). The challenge in many places is to adapt existing district heating systems so that the technical integration of volatile sources (solar radiation can vary greatly) is possible at the required temperature level. That this is possible has already been demonstrated by successful lighthouse projects [44] and the steadily growing number of solar thermal heat sources. The thermal capacity of solar heat in German district heating grew by around 50% in 2019 to a total of 70 MW [45]. The continuing need for research is underlined by ongoing national and international research projects in the field of renewable energies (e.g., Upgrade DH, ReUseHeat, Solnet 4.0, etc.). It is also an important part of the 7th German Federal Government’s energy research programme [46].
At the end we would highlight the fact that in surveys respondents sometimes tend to give answers that they think are expected or favoured by those conducting the survey, which may lead to a gap between the stated WTP and actual the WTP. Furthermore, DCE studies have shown that respondents often ignore one or more attributes when making choices, which may lead to biased WTP estimations [47,48]. Therefore, it is planned to merge the collected data with data from other sources to calibrate and to identify an appropriate scaling factor for the found WTPs. Nonetheless, we assume that the measured preference structure of the household, that is the relative importance of the attributes to each other, is stable.

Supplementary Materials

Author Contributions

Conceptualization, H.H., S.G., T.K. and A.P.; methodology, T.K. and A.P.; validation, A.P., S.G. and H.H.; formal analysis, T.K. and A.P.; resources, H.H.; data curation, T.K. and A.P.; writing—original draft preparation, T.K. and A.P.; writing—review and editing, T.K. and A.P; supervision, S.G. and H.H.; project administration, H.H. and S.G.; funding acquisition, H.H. All authors have read and agreed to the published version of the manuscript.

Funding

This research was funded by European Union’s Horizon 2020 research and innovation programme under grant agreement number 691624.

Conflicts of Interest

The authors declare no conflict of interest.

Abbreviations

RHSResidential Heating Systems
WTPWillingness-to-Pay
GHGGreenhouse Gas
CHPCombined Heat and Power
DCEDiscrete-Choice Experiment
RPLRandom Parameter Logit Model
GMNLGeneralized Multinominal Logit Model
KMOKaiser–Mayer–Olkin Measure

References

  1. AGEB. Anwendungsbilanzen. Stand 10/2016. 2016. Available online: https://www.ag-energiebilanzen.de (accessed on 24 April 2020).
  2. Bundesministerium für Wirtschaft und Energie. Energiedaten: Gesamtausgabe. 2018. Available online: https://www.bmwi.de/Redaktion/DE/Artikel/Energie/energiedaten-gesamtausgabe.html (accessed on 24 September 2019).
  3. BDEW. Beheizungsstruktur im Wohnungsneubau in Deutschland. 2017. Available online: https://www.bdew.de (accessed on 24 April 2020).
  4. European Commission. An EU Strategy on Heating and Cooling; COM (2016)51; The European Comission: Brussels, Belgium, 2016. [Google Scholar]
  5. Eriksson, L.; Morandin, M.; Harvey, S. A feasibility study of improved heat recovery and excess heat export at a Swedish chemical complex site. Int. J. Energy Res. 2018, 42, 1580–1593. [Google Scholar] [CrossRef]
  6. Rezaie, B.; Rosen, M.A. District heating and cooling: Review of technology and potential enhancements. Appl. Energy 2012, 93, 2–10. [Google Scholar] [CrossRef]
  7. Persson, U.; Werner, S. Heat distribution and the future competitiveness of district heating. Appl. Energy 2011, 88, 568–576. [Google Scholar] [CrossRef]
  8. Paiho, S.; Reda, F. Towards next generation district heating in Finland. Renew. Sustain. Energy Rev. 2016, 65, 915–924. [Google Scholar] [CrossRef]
  9. Sayegh, M.A.; Danielewicz, J.; Nannou, T.; Miniewicz, M.; Jadwiszczak, P.; Piekarska, K.; Jouhara, H. Trends of European research and development in district heating technologies. Renew. Sustain. Energy Rev. 2017, 68, 1183–1192. [Google Scholar] [CrossRef] [Green Version]
  10. Lake, A.; Rezaie, B.; Beyerlein, S. Review of district heating and cooling systems for a sustainable future. Renew. Sustain. Energy Rev. 2017, 67, 417–425. [Google Scholar] [CrossRef]
  11. Ghafghazi, S.; Sowlati, T.; Sokhansanj, S.; Melin, S. A multicriteria approach to evaluate district heating system options. Appl. Energy 2010, 87, 1134–1140. [Google Scholar] [CrossRef]
  12. Lund, H.; Möller, B.; Mathiesen, B.V.; Dyrelund, A. The role of district heating in future renewable energy systems. Energy 2010, 35, 1381–1390. [Google Scholar] [CrossRef]
  13. Connolly, D.; Lund, H.; Mathiesen, B.V.; Werner, S.; Möller, B.; Persson, U.; Boermans, T.; Trier, D.; Østergaard, P.A.; Nielsen, S. Heat Roadmap Europe: Combining district heating with heat savings to decarbonise the EU energy system. Energy Policy 2014, 65, 475–489. [Google Scholar] [CrossRef]
  14. Brocklebank, I.; Styring, P.; Beck, S. Heat mapping for district heating. Energy Procedia 2018, 151, 47–51. [Google Scholar] [CrossRef]
  15. Kontu, K.; Rinne, S.; Olkkonen, V.; Lahdelma, R.; Salminen, P. Multicriteria evaluation of heating choices for a new sustainable residential area. Energy Build. 2015, 93, 169–179. [Google Scholar] [CrossRef]
  16. Kim, H.-J.; Lim, S.-Y.; Yoo, S.-H. Public preferences for district heating system over individual heating system: A view from national energy efficiency. Energy Effic. 2019, 12, 723–734. [Google Scholar] [CrossRef]
  17. Lichtenwoehrer, P.; Erker, S.; Zach, F.; Stoeglehner, G. Future compatibility of district heating in urban areas—A case study analysis in the context of integrated spatial and energy planning. Energy Sustain. Soc. 2019, 9, 5. [Google Scholar] [CrossRef] [Green Version]
  18. Lygnerud, K. Challenges for business change in district heating. Energy Sustain. Soc. 2018, 8, 10. [Google Scholar] [CrossRef]
  19. Sameti, M.; Haghighat, F. Optimization approaches in district heating and cooling thermal network. Energy Build. 2017, 140, 121–130. [Google Scholar] [CrossRef]
  20. Erker, S.; Lichtenwoehrer, P.; Zach, F.; Stoeglehner, G. Interdisciplinary decision support model for grid-bound heat supply systems in urban areas. Energy Sustain. Soc. 2019, 9, 22. [Google Scholar] [CrossRef]
  21. Lottner, V.; Schulz, M.E.; Hahne, E. Solar-Assisted District Heating Plants: Status of the German Programme Solarthermie-2000. Sol. Energy 2000, 69, 449–459. [Google Scholar] [CrossRef]
  22. Günther, M.; Greller, M.; Fallahnejad, M. Evaluation of Long-Term Scenarios for Power Generation and District Heating at Stadtwerke München. Informatik Spektrum 2015, 38, 97–102. [Google Scholar] [CrossRef]
  23. BDEW. Erneuerbare Energien und das EEG: Zahlen, Fakten, Grafiken (2016). 2016. Available online: https://www.bdew.de/energie/erneuerbare-energien-und-das-eeg-zahlen-fakten-grafiken/ (accessed on 24 September 2019).
  24. Werner, S. International review of district heating and cooling. Energy 2017, 137, 617–631. [Google Scholar] [CrossRef]
  25. Arbeitsgemeinschaft Verbrauchs- und Medienanalyse. Konsumenten punktgenau erreichen. Basisinformationen für fundierte Mediaentscheidungen. VuMA Touchpoints 2018. Available online: https://www.vuma.de/fileadmin/user_upload/PDF/berichtsbaende/VuMA_Berichtsband_2018.pdf (accessed on 24 September 2019).
  26. Vaage, K. Heating technology and energy use: A discrete/continuous choice approach to Norwegian household energy demand. Energy Econ. 2000, 22, 649–666. [Google Scholar] [CrossRef]
  27. Braun, F.G. Determinants of households’ space heating type: A discrete choice analysis for German households. Energy Policy 2010, 38, 5493–5503. [Google Scholar] [CrossRef]
  28. McFadden, D. Conditional logit analysis of qualitative choice behavior. In Frontiers in Econometrics; Zarembka, P., Ed.; Academic Press: New York, NY, USA, 1974; pp. 105–142. [Google Scholar]
  29. Lancaster, K.J. A New Approach to Consumer Theory. J. Political Econ. 1966, 74, 132. [Google Scholar] [CrossRef]
  30. Thurstone, L.L. A law of comparative judgement. Psychol. Rev. 1927, 34, 273–286. [Google Scholar] [CrossRef]
  31. ChoiceMetrics. Ngene 1.1.1. User Manual & Reference Guide; ChoiceMetrics: Sydney, Australia, 2012. [Google Scholar]
  32. Train, K.; Weeks, M. Discrete Choice Models in Preference Space and Willingness-to-Pay Space. In Applications of Simulation Methods in Environmental and Resource Economics: The Economics of Non-Market Goods and Resources, 6th ed.; Scarpa, R., Alberini, A., Eds.; Springer: Dordrecht, The Netherlands, 2005; pp. 1–16. [Google Scholar]
  33. Fiebig, D.G.; Keane, M.P.; Louviere, J.; Wasi, N. The Generalized Multinomial Logit Model: Accounting for Scale and Coefficient Heterogeneity. Mark. Sci. 2010, 29, 393–421. [Google Scholar] [CrossRef]
  34. Cattell, R.B. The scree test for the number of factors. Multivar. Behav. Res. 1966, 1, 245–276. [Google Scholar] [CrossRef]
  35. Field, A. Discovering Statistics Using IBM SPSS Statistics. And Sex and Drugs and Rock ’n’ Roll, 4th ed.; Sage Publications Inc: Los Angeles, CA, USA, 2013. [Google Scholar]
  36. CO2online. Heizspiegel Deutschland. 2019. Available online: https://www.heizspiegel.de (accessed on 24 April 2020).
  37. Fränkle, C. Heizkostenvergleich nach VDI 2067: Musterrechnung. Available online: https://www.agfw.de/energiewirtschaft-recht-politik/wirtschaft-und-markt/markt-preise/heizkostenvergleich/ (accessed on 24 April 2020).
  38. Hille, S.; Weber, S.; Brosch, T. Consumers’ preferences for electricity-saving programs: Evidence from a choice-based conjoint study. J. Clean. Prod. 2019, 220, 800–815. [Google Scholar] [CrossRef] [Green Version]
  39. Blesl, M.; Eikmeier, B. Die 70/70-Strategie: Konzept und Ergebnisse. Available online: https://www.agfw.de/energiekonzepte/7070-4040-strategie/ (accessed on 24 April 2020).
  40. AGFW e.V. EnEff:Wärme- Kassel Zum Feldlager. GeosolareNahwärmeversorgung für die Siedlung ‘Zum Feldlager’; AGFW Heftreihe Forschung und Entwicklung—Heft; 2018. Universität Kassel: Kassel, Germany.
  41. Moczko, D. Die neue Erneuerbare-Energien-Richtlinie und die Fernwärme. Available online: https://www.energie.de/euroheatpower/news-detailansicht/nsctrl/detail/News/die-neue-erneuerbare-energien-richtlinie-und-die-fernwaerme-201961/ (accessed on 24 April 2020).
  42. Europäische Kommission. Länderbericht Deutschland 2020. Available online: https://ec.europa.eu/info/sites/info/files/2020-european_semester_country-report-germany_de.pdf (accessed on 24 April 2020).
  43. Blesl, M.; Koziol, M.; Ludwig, M.C.; Rapp, H.; Tenberg, B.; Vautz, S.; Wolf, S. 40/40-Strategie: Unser Konzept für die Wärmewende. Available online: https://www.agfw.de/energiekonzepte/7070-4040-strategie/ (accessed on 24 April 2020).
  44. Roth, T.; Grimm, S.; Rutz, D. Upgrading the Performance of District Heating Network: Best Practice Examples on Upgrading Projects. Available online: https://www.upgrade-dh.eu/images/Publications%20and%20Reports/D2.1_2019-04-30_Upgrade%20DH_final_AGFW.PDF (accessed on 24 April 2020).
  45. Solar District Heating. Stuttgart. 2020. Available online: https://www.solar-district-heating.eu/de/aktuelles/presse/# (accessed on 24 April 2020).
  46. Bundesministerium für Wirtschaft und Energie. Innovationen für die Energiewende: 7. Energieforschungsprogramm der Bundesregierung. Available online: https://www.bmwi.de/Redaktion/DE/Publikationen/Energie/7-energieforschungsprogramm-der-bundesregierung.pdf?__blob=publicationFile&v=14 (accessed on 24 April 2020).
  47. Carlsson, F.; Kataria, M.; Lampi, E. Dealing with Ignored Attributes in Choice Experiments on Valuation of Sweden’s Environmental Quality Objectives. Environ. Resource Econ. 2010, 47, 65–89. [Google Scholar] [CrossRef] [Green Version]
  48. Hensher, D.A.; Rose, J.M.; Greene, W.H. Applied Choice Analysis: A Primer; Cambridge University Press: Cambridge, UK, 2005. [Google Scholar]
Figure 1. Cluster centres of the k-means cluster analysis in Germany.
Sustainability 12 04129 g001
Table 1. Demographics of end-users in Germany.
CharacteristicSampleGermany
Gender(n = 482)(Genesis 2018)
Male49.2%49.35%
Female50.8%50.65%
Income
< 1,300€21.1%22.9%
1,300–2,600€37.0%39.2%
2,600–3,600€23.5%17.6%
3,600–5000€12.5%12.6%
> 5000€5.9%7.8%
Age
18–3022.4%18,4%
31–4526.6%21,9%
46–6542.9%35,6%
> 658.1%24,1%
Place of residence
Small Town (pop. <5000)16.2%14.2
Small City (5,000–20,000)19.9%26.4
Medium City (20,000–100,000)22.8%27.5
Big City (> 100,000), centre18.7%31.9
Big City (> 100,000), periphery22.4%
Table 2. Attribute and characteristics in the Discrete-Choice Experiment (DCE).
AttributeCharacteristic 1Characteristic 2Characteristic 3Characteristic 4
Heating systemDistrict heating from fossil fuelsDistrict heating
from renewables
Ground heat/heat pumpGas condensing boiler
Annual operation costs/m2 6 €8 €10 €12 €
Investment costs in € *4 k6 k8 k10 k
Primary energy factor0.00.70.81.1
CO2-emission in kg CO2/ m2/a0.4131420
Price risklowmiddlehigh
* (without 3 k € for ventilation system).
Table 3. Choice set example.
Alternative 1Alternative 2Alternative 3
CharacteristicDistrict heating renewablesDistrict heating fossil fuelsHeat pump
Annual operation costs/m212 €12 €6 €
Investment costs6000 €6000 €8000 €
Primary energy factor0,00,70,8
CO2 emissions in kg CO2/m2/year0,41413
Price risklowlowhigh
Table 4. Factor loadings from principal component factor analysis: Communalities, eigenvalues, percentages of variance, and alpha value for items of preferences of heating systems (N = 492), KMO = 0.904.
Factor Loading
Item1
Price and Financial Security
2
Local Provider
3
Sustainability
Communality
Reasonably priced heating system0.840.110.100.72
Reasonably priced initial outlay0.780.200.120.66
High security of supply 0.750.130.330.69
Low fluctuations in prices0.700.350.100.61
Transparent accounting0.700.200.310.63
High trust in provider0.520.450.380.61
Local contact person0.250.820.040.73
Local provider0.010.750.330.68
Direct contact to the provider0.330.700.170.62
Long-term partnership0.280.680.230.55
Low pollution0.170.210.860.80
High share of renewable Energy0.180.230.830.77
Future efficiency of energy source0.460.210.620.64
Eigenvalue6.131.461.14
Variance explained in %47.1311.208.78
α0.830.780.79
Note. Boldface indicates the highest factor loadings.
Table 5. Results estimation in Willingness-to-Pay (WTP) space.
Parameters and InteractionsWTP in €/m2/a
(coeff.)
Std. Errorz-Value
mean estimates random parameters
district heating from fossil fuels5.43 ***0.4611.89
district heating from renewables10.32 ***0.4423.45
ground heat/heat pump3.29 ***0.3210.29
investments costs * 10.000−3.45 ***0.48−7.13
sd. mean estimates random parameters
district heating from fossil fuels3.03 ***0.329.49
district heating from renewables3.29 ***0.2314.23
ground heat/heat pump2.10 ***0.248.89
investments costs * 10.0002.08 ***0.563.69
mean estimates interaction ‘ecos’
district heating from fossil fuels × ecos−1.71 **0.59−2.91
district heating from renewables × ecos1.41 ***0.373.78
ground heat/heat pump × ecos0.260.340.77
mean estimates interaction ‘price sensitives’
district heating from fossil fuels × price sensitives−3.03 ***0.68−4.43
district heating from renewables × price sensitives−3.34 ***0.36−9.18
ground heat/heat pump × price sensitives−1.03 **0.37−2.79
mean estimates interaction ‘locals’
district heating from fossil fuels × locals−0.370.31−0.79
district heating from renewables × locals0.310.470.93
ground heat/heat pump × locals−1.05 ***0.31−3.39
mean estimates interaction ‘house owner’
district heating from fossil fuels × house owner−2.38 ***0.47−5.07
district heating from renewables × house owner−2.53 ***0.28−8.92
ground heat/heat pump × house owner−0.73 **0.26−2.82
mean estimates interaction ‘plan’
district heating from fossil fuels × plan1.58 **0.602.63
district heating from renewables × plan−0.380.37−1.04
ground heat/heat pump × plan−1.17 **0.36−3.26
sd. mean estimates correlated random parameters
district heating from fossil fuels/district heating from r.1.02 **0.323.23
district heating from fossil fuels/ground heat0.99 ***0.224.59
district heating from fossil fuels/investment costs−6.10 ***0.42−14.53
district heating from r./ground heat3.26 ***0.2413.83
district heating from r./investment costs−6.27 ***0.32−19.46
ground heat./investment costs0.753.110.24
scale (mean)−3.83 ***0.08-5.12
scale heter (τ)0.90 ***0.0714.02
observations5,784
Log likelihood−4,077.20
Note: ***, **, * significant at the 0.1%, 1% and 5% levels, respectively.
Table 6. Correlation matrix random parameters.
Parametersd.c. from Fossil Fuelsd.c. from RenewablesGround HeatInvestments Costs
d.c. from fossil fuels1.000.850.44−0.89
d.c. from renewables0.851.000.58−0.89
ground heat0.440.581.00−0.24
investments costs−0.89−0.89−0.241.00

