Article

Impacts of Climate Change on the Potential Productivity of Eleven Staple Crops in Rwanda

1
RTI International, Durham, NC 27709, USA
2
Vanguard Economics, Kigali 20093, Rwanda
3
Independent researcher, Kigali 20093, Rwanda
*
Author to whom correspondence should be addressed.
Sustainability 2020, 12(10), 4116; https://doi.org/10.3390/su12104116
Submission received: 3 April 2020 / Revised: 30 April 2020 / Accepted: 11 May 2020 / Published: 18 May 2020
(This article belongs to the Section Environmental Sustainability and Applications)

Abstract

:
This study quantifies the potential responses of 11 staple crop yields to projected changes in temperature and precipitation in Rwanda, using a cross sectional model based on yield data collected across more than 14,000 villages. We incorporated a relatively high spatial resolution dataset on crop productivity, considered a broad range of crops relevant to national agricultural production priorities, used environmental data developed specifically for Rwanda, and reported uncertainty both from our estimation model and due to uncertainty in future climate projections. We estimate that future climate change will have the largest impacts on potential productivity of maize, bush bean, and Irish potato. All three crops are likely to experience a reduction in potential yields of at least 10% under Representative Concentration Pathway (RCP) 4.5 and at least 15% under RCP 8.5 by 2050. Notably, these are important crops nationally, and three of the crops targeted by Rwanda’s Crop Intensification Program. We find that the most severe reductions in potential crop yields will occur in the drier eastern savannah and plateau regions, but that the impacts of climate change could be neutral or even positive in the highlands through mid-century. The refined spatial scale of our analysis allows us to identify potentially vulnerable regions where adaptation investments may need to be prioritized to support food security and climate resilience in Rwanda’s agricultural sector.

1. Introduction

Climate change poses a substantial challenge to feeding nine billion people by 2050, by impacting food and nutrition availability, access, and security [1,2,3]. The impacts of climate change in sub Saharan Africa are of critical concern, as low-input and small-scale mixed cropping systems predominate in this region [4,5]. In addition, small-scale farmers in the region are particularly vulnerable to climate change, as they have few resources to adapt at their disposal, and are less resilient in the face of catastrophic crop losses [6,7].
Agricultural production in sub Saharan Africa is threatened by warming temperatures, less predictable rainfall patterns, and more extreme events including heat waves, droughts, and floods [8,9]. There is a broad consensus that the impacts of climate change on agricultural production in Africa will be substantially negative [10]. Uncertainty surrounding the magnitude of these impacts remains high, and there is a dearth of actionable knowledge on the impacts of climate change on regionally and nationally relevant cropping systems [11,12]. This is particularly true in Rwanda, where previous studies reported wide ranges in potential climate change impacts on staple crop yields (Figure A1).
Rwanda’s economy is largely dependent on agriculture, employing three-quarters of all Rwandans and contributing almost one-third of the nation’s GDP [13]. Given that the livelihoods of the majority of the country’s population are based on rain-fed subsistence agriculture [14], and that unprecedented changes in climate are expected in the region, it is critical to improve our understanding of the potential responses of Rwandan crops to climate change. This will support decision makers to identify vulnerable populations, formulate adaptation strategies across farming systems, target research and development for climate-tolerant varieties of impacted staple crops, and direct investments to appropriate regions.
This study quantifies the potential yield response of 11 staple crops, accounting for more than half of agricultural production in Rwanda, to projected changes in temperature and precipitation. We first generated a crop productivity model using newly available data on crop yields collected across more than 14,000 villages by the National Institute of Statistics of Rwanda (NISR), along with maps of topography, climate, and soil characteristics developed specifically for Rwanda. We then predicted climate change impacts on potential yields using climate projections in 2050 from the Coupled Model Intercomparison Project 5 (CMIP5). We conducted our analysis at a highly refined spatial scale in order to identify subnational hotspots of concern, and to inform where adaptation investments may need to be prioritized to support food security and climate resilience in Rwanda’s agricultural sector.

2. Materials and Methods

2.1. Study Context

Rwanda is a landlocked country in East Africa spanning just over 26,300 km2. The country has the second highest population density in Africa [15], and its population of 12.5 million is expected to continue growing through 2050 [16]. The country has a tropical climate, averaging 20 °C and 1000 mm rainfall annually, and experiences two rainy seasons: a longer rainy season from late February to late May, and a shorter rainy season from late September to early December [17]. Rwanda hosts 10 agroecological zones characterized by wide ranges in climate, topography and resulting vegetation (Figure 1). The Congo-Nile, Birunga, and Buberuka regions have the highest elevations, steepest slopes, and the lowest average temperatures nationally (18.1 °C, 15.4 °C, and 19.3 °C, respectively). These regions have relatively fertile volcanic soils and higher precipitation, and are more attractive for farmers despite the steeply sloped terrain and soil erosion challenges [18]. The southwestern agroecological zones of Impala and Imbo are warm and rainy, with average monthly precipitation of 106 and 116 mm, respectively. In the eastern plateau and savannah regions the elevation is lower, the topography is flatter, and the climate is warmer and drier, with temperatures ranging from 21.7–22 °C and average monthly rainfall from 56–63 mm.
There are three growing seasons throughout the year; seasons A and B correspond to the short and long rainy seasons, respectively. Crop production is similar between these two seasons, though maize is the primary crop produced during season A. Season C falls in between the two rainy seasons (roughly July to September), and is used to supplement household diets with crops including sweet potatoes, beans, peas, soybeans, and vegetables. Most crops are grown to some degree in all provinces of Rwanda, though paddy rice and cassava are less common in the north, sorghum is less common in the west, and climbing beans are less common in the east [19].
Cassava, Irish potatoes, sweet potatoes, maize, and bananas account for over half of agricultural production in Rwanda [20]. Although small in terms of overall production, beans are cultivated by 92% of households and are an important source of protein [21]. Importantly, mixed cropping systems are common among small-scale farmers, and almost two-thirds of cultivated land is under mixed cropping during growing seasons A and B.

2.2. Input Data

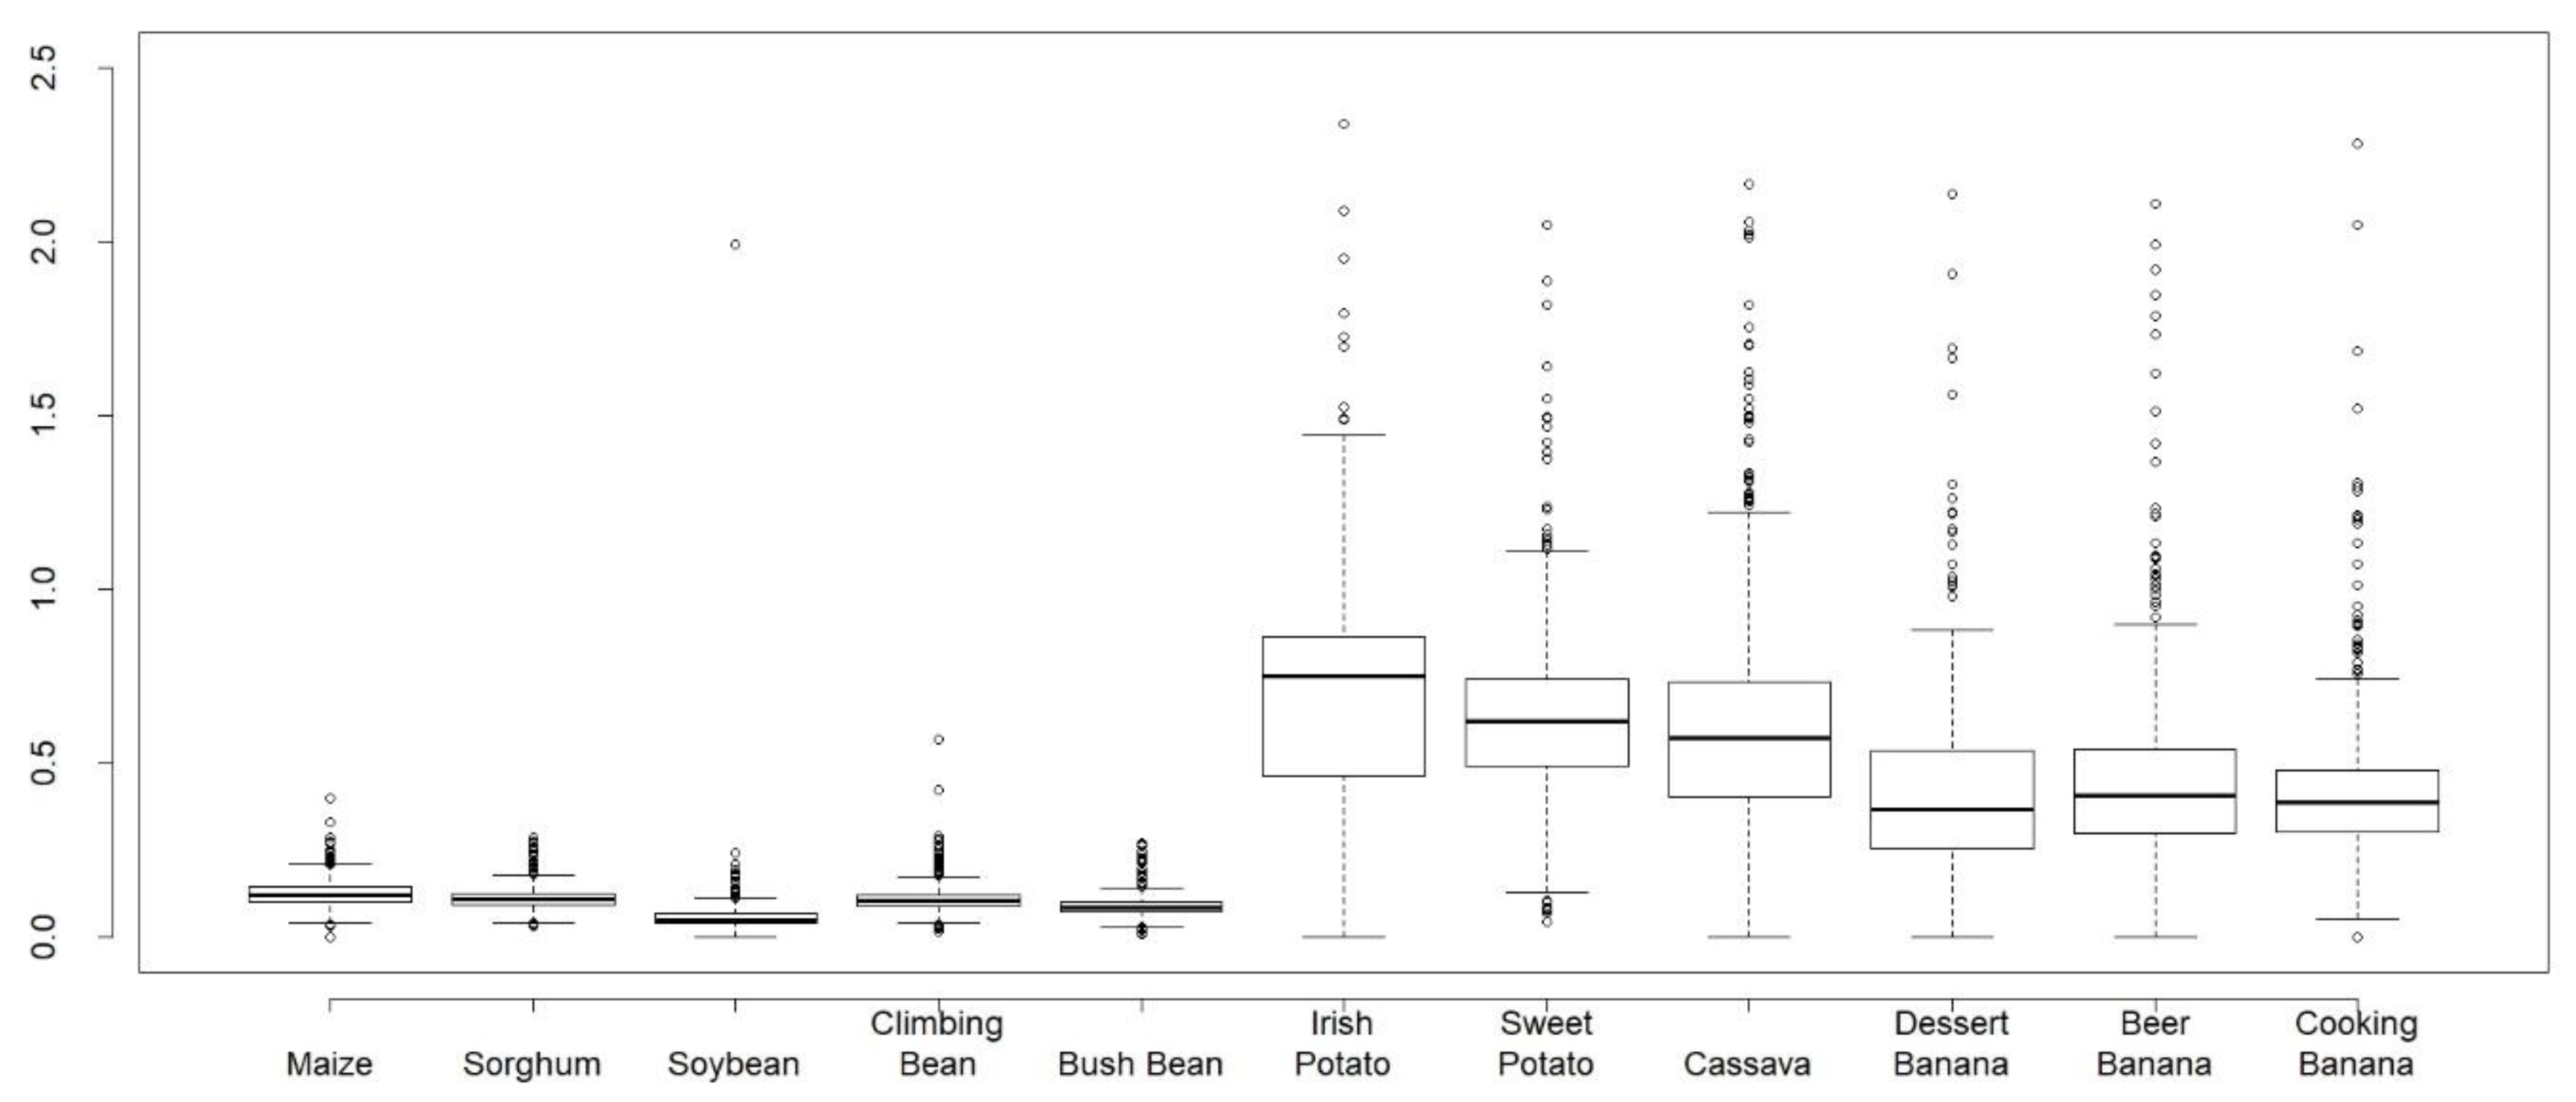
We used average yields (kg/m2) at the scale of the village administrative unit for 11 priority staple crops as our response variable (Figure 2). NISR, an agency of the Ministry of Finance and Economic Planning, conducts seasonal surveys to characterize agricultural production in Rwanda. NISR has conducted a Seasonal Agricultural Survey annually since 2013, but 2017 was the first year NISR collected data representative at the district level and reported yields at the village level. This Upgraded Seasonal Agricultural Survey (USAS) provides data on agricultural production, practices, and inputs for each of Rwanda’s three seasons [9]. The survey collects data on crop yields nationally, including for the 11 staple crops included in this study: maize, sorghum, climbing bean, bush bean, soybean, sweet potato, cassava, Irish potato, dessert banana, beer banana, and cooking banana.
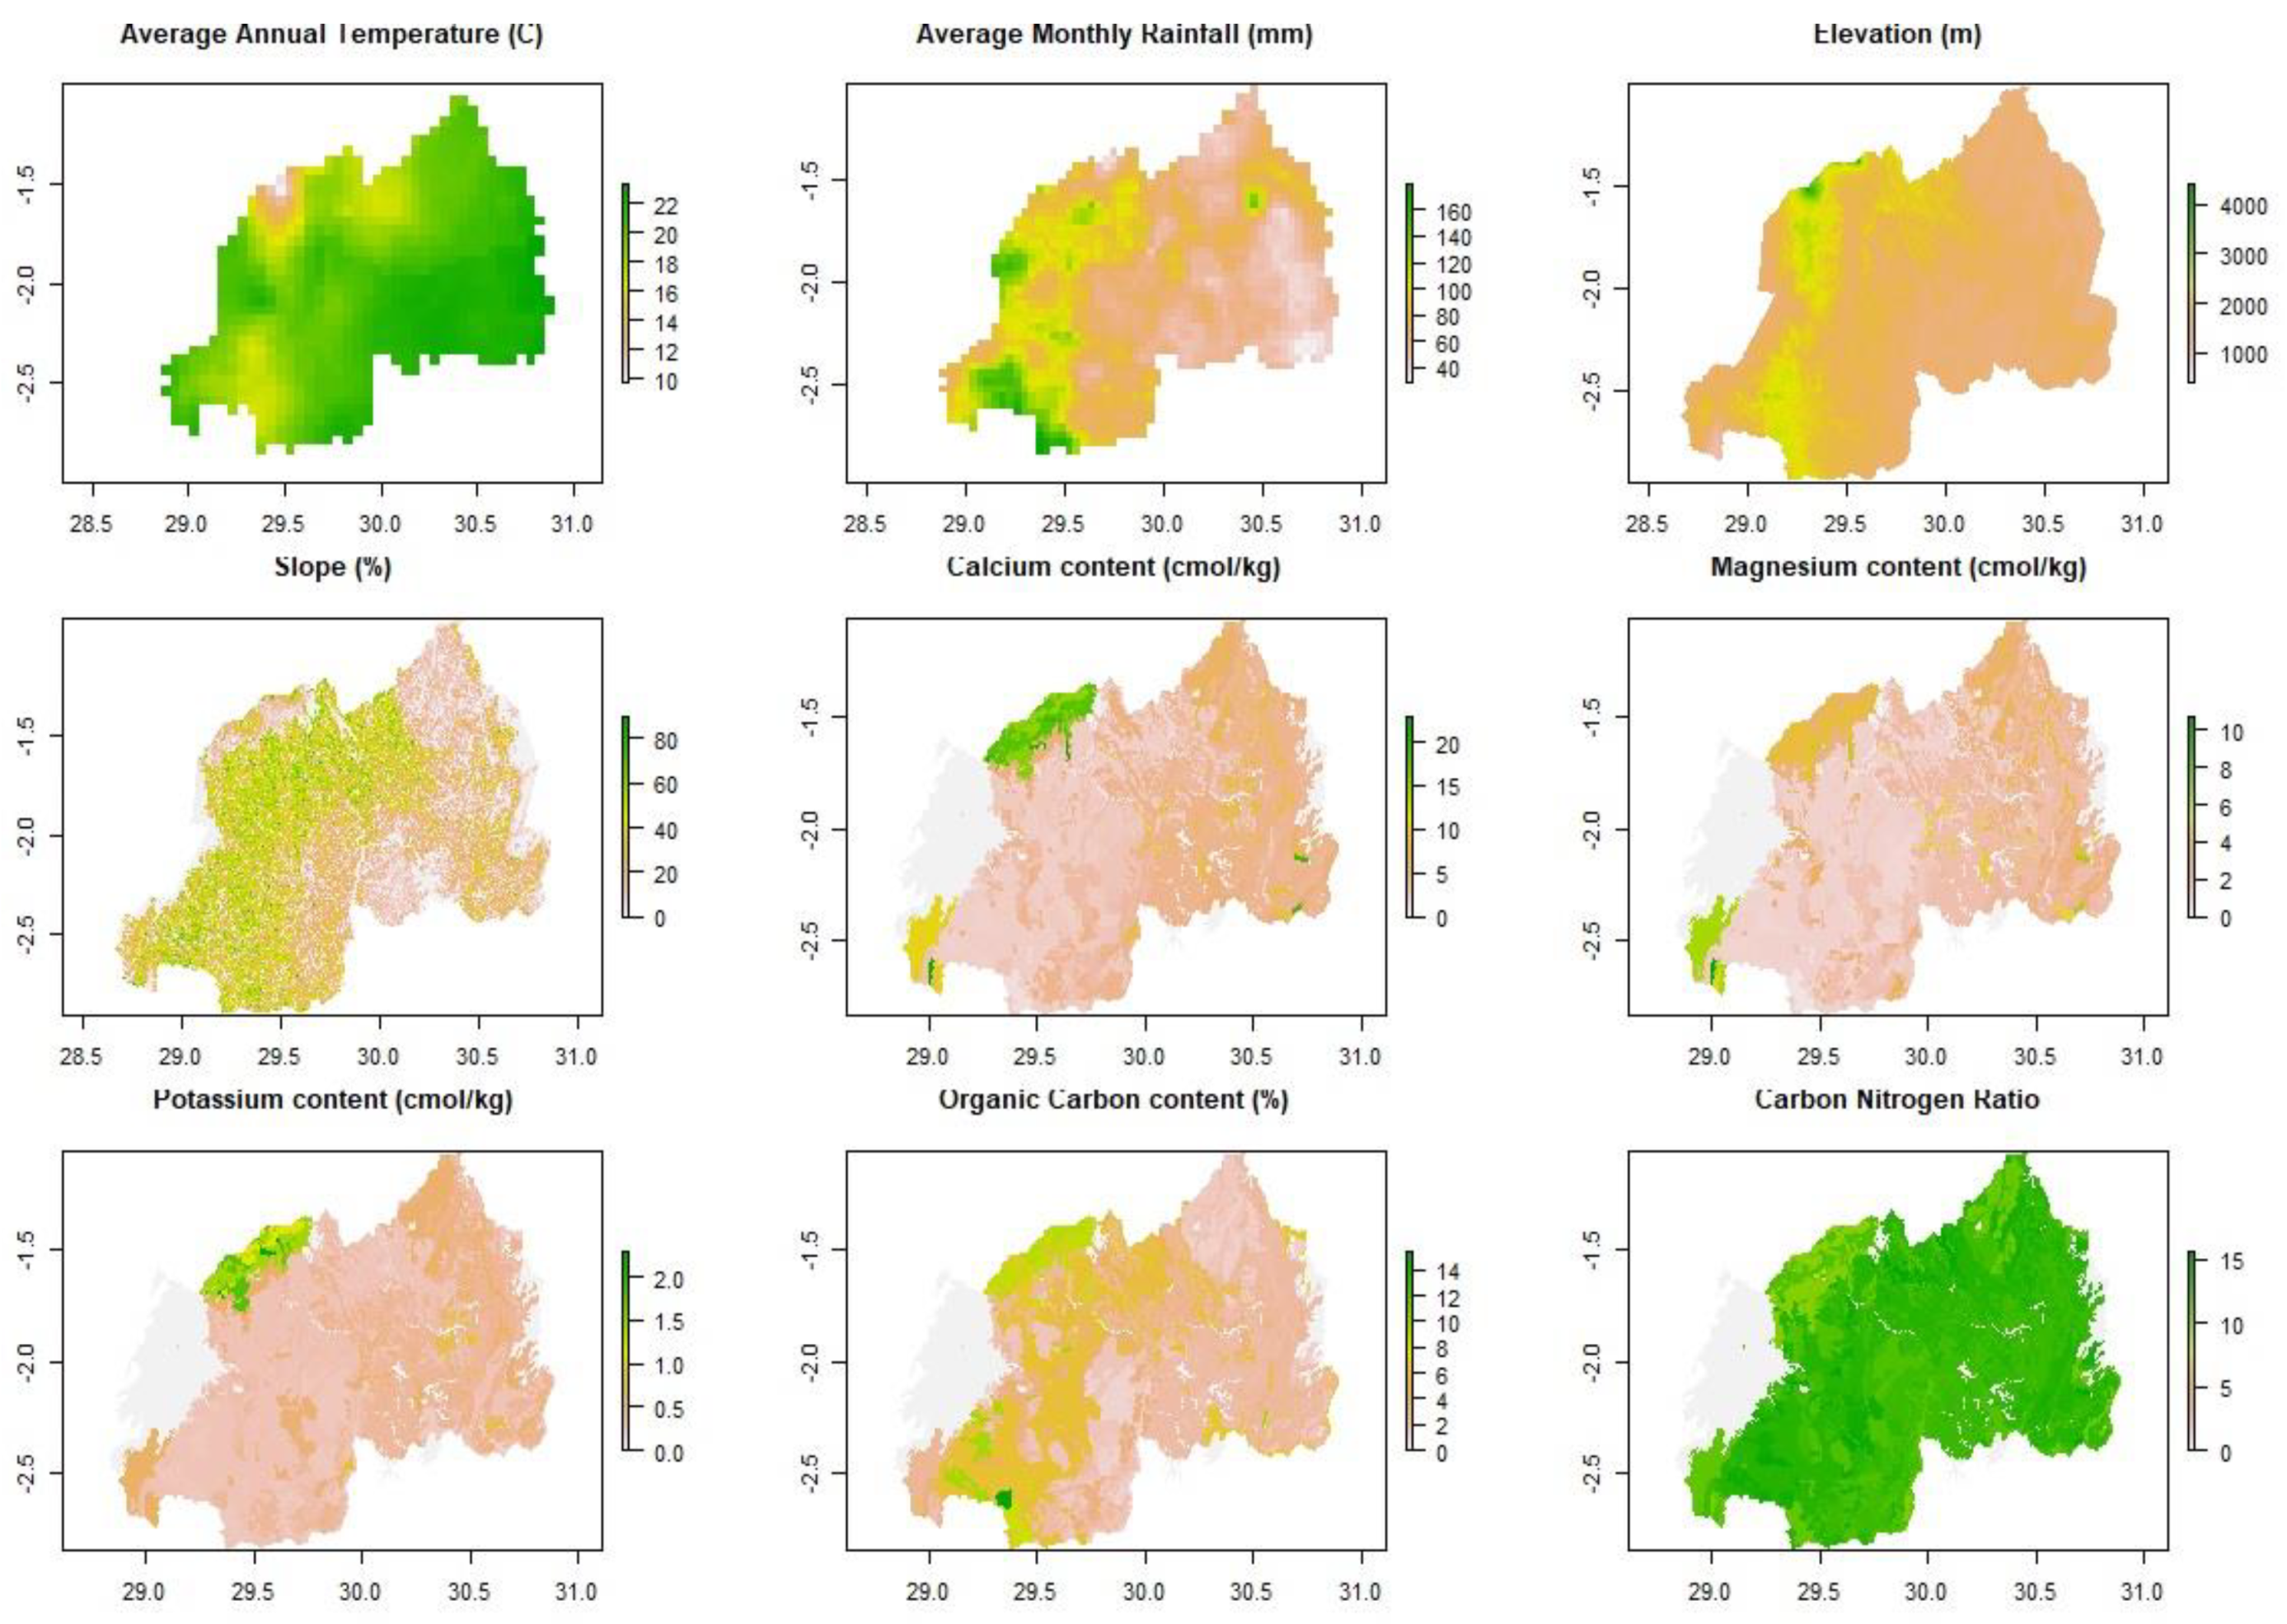
We used data representing nine explanatory variables from three primary datasets (Figure 3). We acquired a 10-meter resolution map of terrain from Swedesurvey [22], which we used to calculate slope at the same resolution. We acquired all publicly available data on temperature and precipitation from Meteo Rwanda [23], including 4 km resolution maps of temperature reported on the 6th, 16th, and 26th of each month over the 2003–2016 period, and precipitation reported daily over 2016–2018. We used these data to calculate average annual temperature and average monthly precipitation. We acquired maps of soil characteristics based on a soil survey of Rwanda finalized in 1994 [24], which includes data on soil carbon nitrogen ratio, and organic carbon, calcium, potassium and magnesium content. We additionally included dummy variables representing 10 agroecological zones nationally (Figure 1), in order to account for variation by region that is not represented by the set of environmental covariates.
We calculated the average of each of the explanatory variables at the level of the village administrative unit [25], using the raster package [26] in R version 3.5.0 [27]. We then linked this village level climate and environmental dataset to the NISR yield estimates also reported at the village level. We calculated the log of crop yields to correct for skewness in our response variables, and screened for collinearity among explanatory variables. Since temperature and precipitation often have nonlinear impact on yields (i.e., higher temperatures lead to higher yields up to an optimal point, above which higher temperatures lead to lower yields), we additionally included the quadratic terms of both average annual temperature and average monthly precipitation.

2.3. Yield Model Specification

We developed models of potential crop yields as the response variable and current environmental characteristics as the predictor variables. We used a cross sectional model based on six seasons of yield data collected across two years, taking advantage of spatial as well as temporal information. We used the lm function in R to generate linear regression models predicting potential crop yields nationally. We omitted calcium from our models due to strong correlations with magnesium and potassium (>0.9). In addition, we tested for large variance inflation factors (VIF), which provides a gauge of correlation in the multivariate sense [28]. Based on VIF > 5 we omitted soil acidity (pH) from our final models, resulting in VIFs <5 and generally <2 on the final set of explanatory variables. The omission of pH had a negligible impact on the remaining model coefficients. We retained the remaining explanatory variables in our model, regardless of significance, to reduce the risk of omitted variables bias in which coefficients on variables included in the model are influenced by variables that are excluded from the model [29].
We assessed the predictive power of the resulting regression models by computing the adjusted R2. The adjusted R2 is a modified version of the commonly used coefficient of determination for gauging model performance that adjusts for the number of predictors in the model. We reported robust standard errors which correct for heteroskedasticity of the error term using the sandwich package [30]. We compared these robust standard errors to standard errors calculated via bootstrap resampling of the input data 100 times with replacement using the simpleboot package [31]. Robust standard errors fell within 5% (and often within 2%) of the bootstrapped standard errors, suggesting that model fit is adequately represented with robust standard errors.

2.4. Predicting Climate Change Impacts

There is consensus that Rwanda’s future climate will be substantially warmer [32], increasing 1.3 °C–1.9 °C by mid-century according to CMIP5 projections [33]. Projections of future precipitation in Rwanda are more variable, with estimates of the change in annual average rainfall ranging from a 10% decrease to a 22% increase by mid-century [14,15]. In the face of uncertainty, a common approach to evaluating the potential impact of climate change is to use an ensemble of climate predictions that represent the range in model variability [34,35].
We used data on projected changes in mean annual temperature and total annual precipitation in 2050 under Representative Concentration Pathways (RCP) 4.5 and 8.5 from the WorldClim CMIP5 downscaled climate projections database at 5-min resolution [20]. RCP 4.5 reflects a lower bound case in which greenhouse gas emissions begin to level off by 2050. RCP 8.5 reflects an upper bound case in which emissions continue to rise through the study period. To calculate projected potential crop yields at the village level under these future climate scenarios, we substituted future temperature and precipitation under each of the 17 CMIP5 climate models across the two RCPs, resulting in 34 future projections.
To estimate the impact of climate change, we first predicted potential yields in a reference case under current climate conditions. We compared this reference to predictions of yields under future climate for both RCP 4.5 and RCP 8.5. We addressed uncertainty in three ways; first, by comparing our reference range to the predicted range, with ranges based on model standard errors. Next, we compared our reference fitted prediction to the average fitted prediction under the upper and lower quartiles of the 17 future climate predictions. Finally, we combined sources of uncertainty by comparing the fitted model predictions and its upper and lower bounds to the average prediction under future climate and the upper and lower quartile future climate predictions. We calculate and report the proportion of uncertainty due to model uncertainty versus uncertainty due to the range in future climate projections.

3. Results

Our resulting models all explain significantly more variability than a null model, with adjusted R2s ranging from 0.05–0.45 (Figure 4). These R2s fall within the range of other crop models in the literature. Crop models with the highest R2 are Irish potato (adjusted R2 of 0.45) and sorghum (0.18), while crop models with lowest R2 are bush bean (0.05) and beer banana (0.06).
We find that crop yields generally decrease with increasing elevation and steeper slopes and increase with higher levels of soil nutrients. The exceptions are Irish potato and sweet potato, which have higher yields at higher elevations, and dessert banana, beer banana, and bean varieties, which have higher yields in more steeply sloped areas.
All crop yields initially increase at higher temperatures, though across all crops this positive relationship diminishes, and eventually becomes negative, as temperatures increase beyond optimal levels (evidenced by the negative coefficient on the squared terms). All crops also have a positive relationship with precipitation, except for bush bean and soybeans, which are sensitive to heavy rainfall. The coefficients on the squared precipitation terms are all very small, but generally significantly negative, suggesting that the effect of increasing precipitation on yields levels off above an optimal amount.

Climate Change Impacts

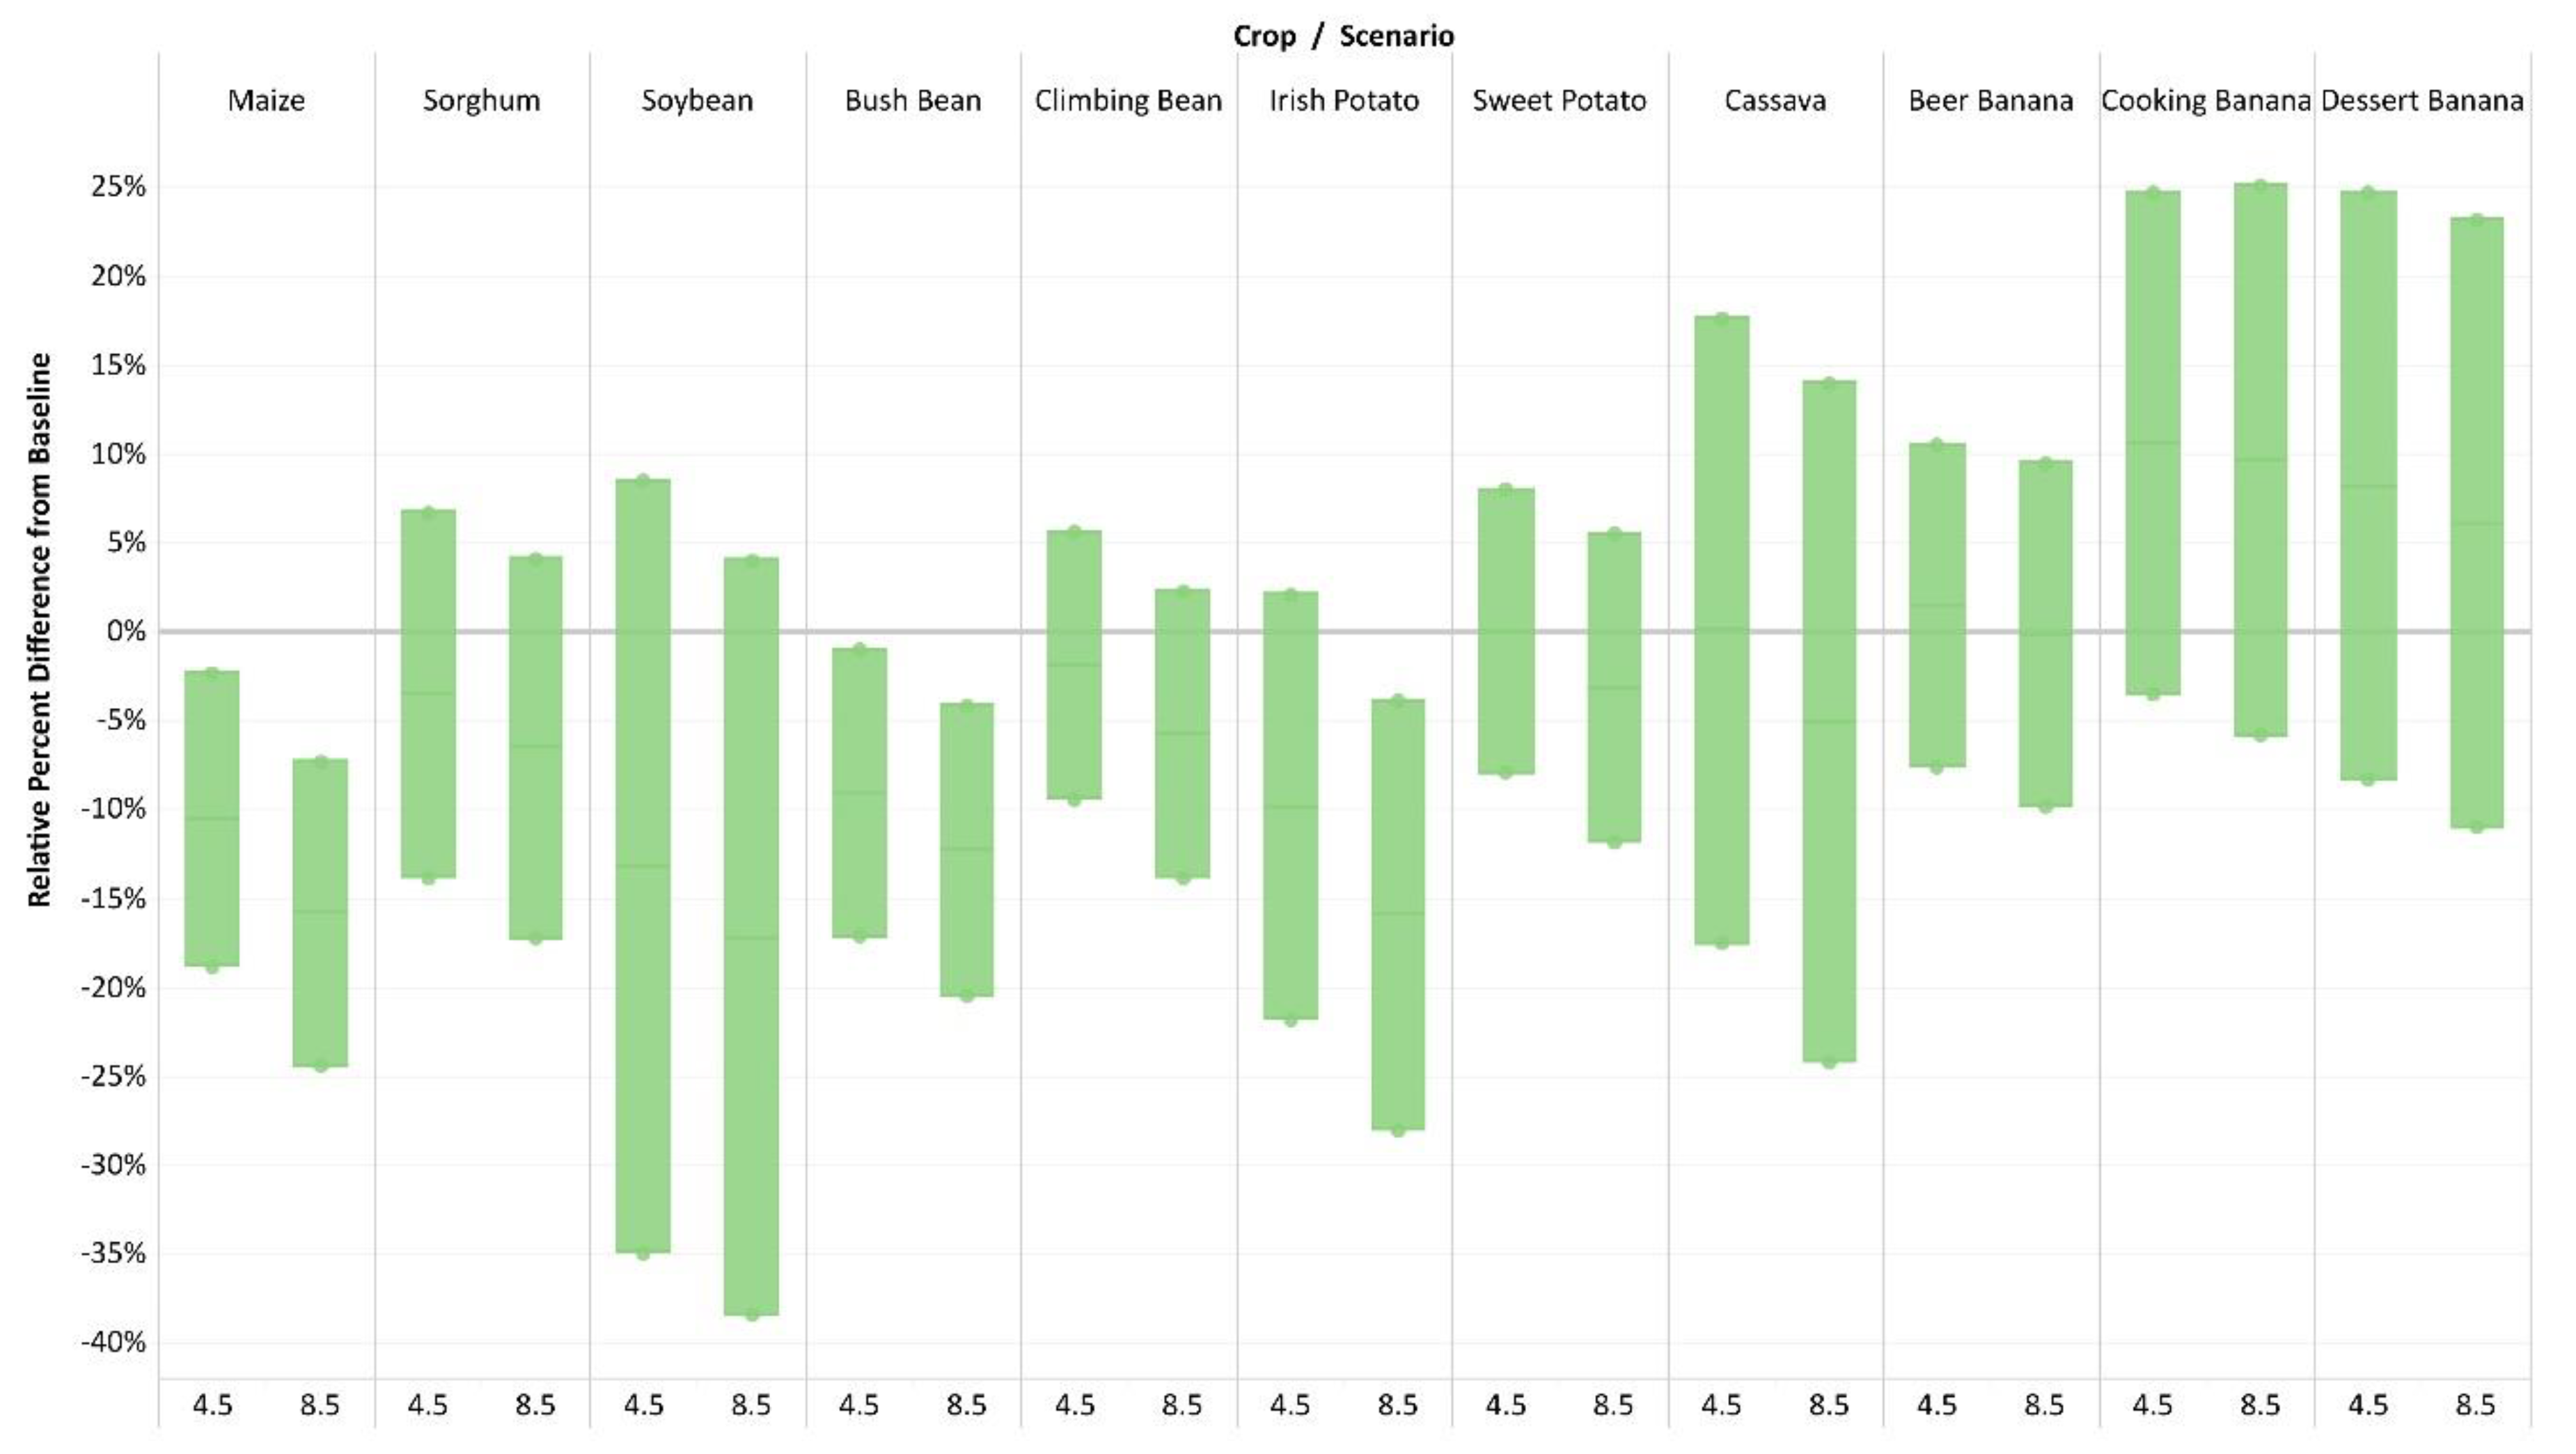
We estimate that future climate change under both RCP 4.5 and RCP 8.5 will have, on average, a negative impact on all the crops in the study, with the exception of the three banana varieties (Figure 5). The future climate will have the largest impacts on bush bean, Irish potato, and maize yields. All three crops are likely to experience a reduction in yields of at least 10% under RCP 4.5 and at least 15% under RCP 8.5. Uncertainty is substantial, and the influence of future climate on yields for the remaining crops is not significantly different than zero.
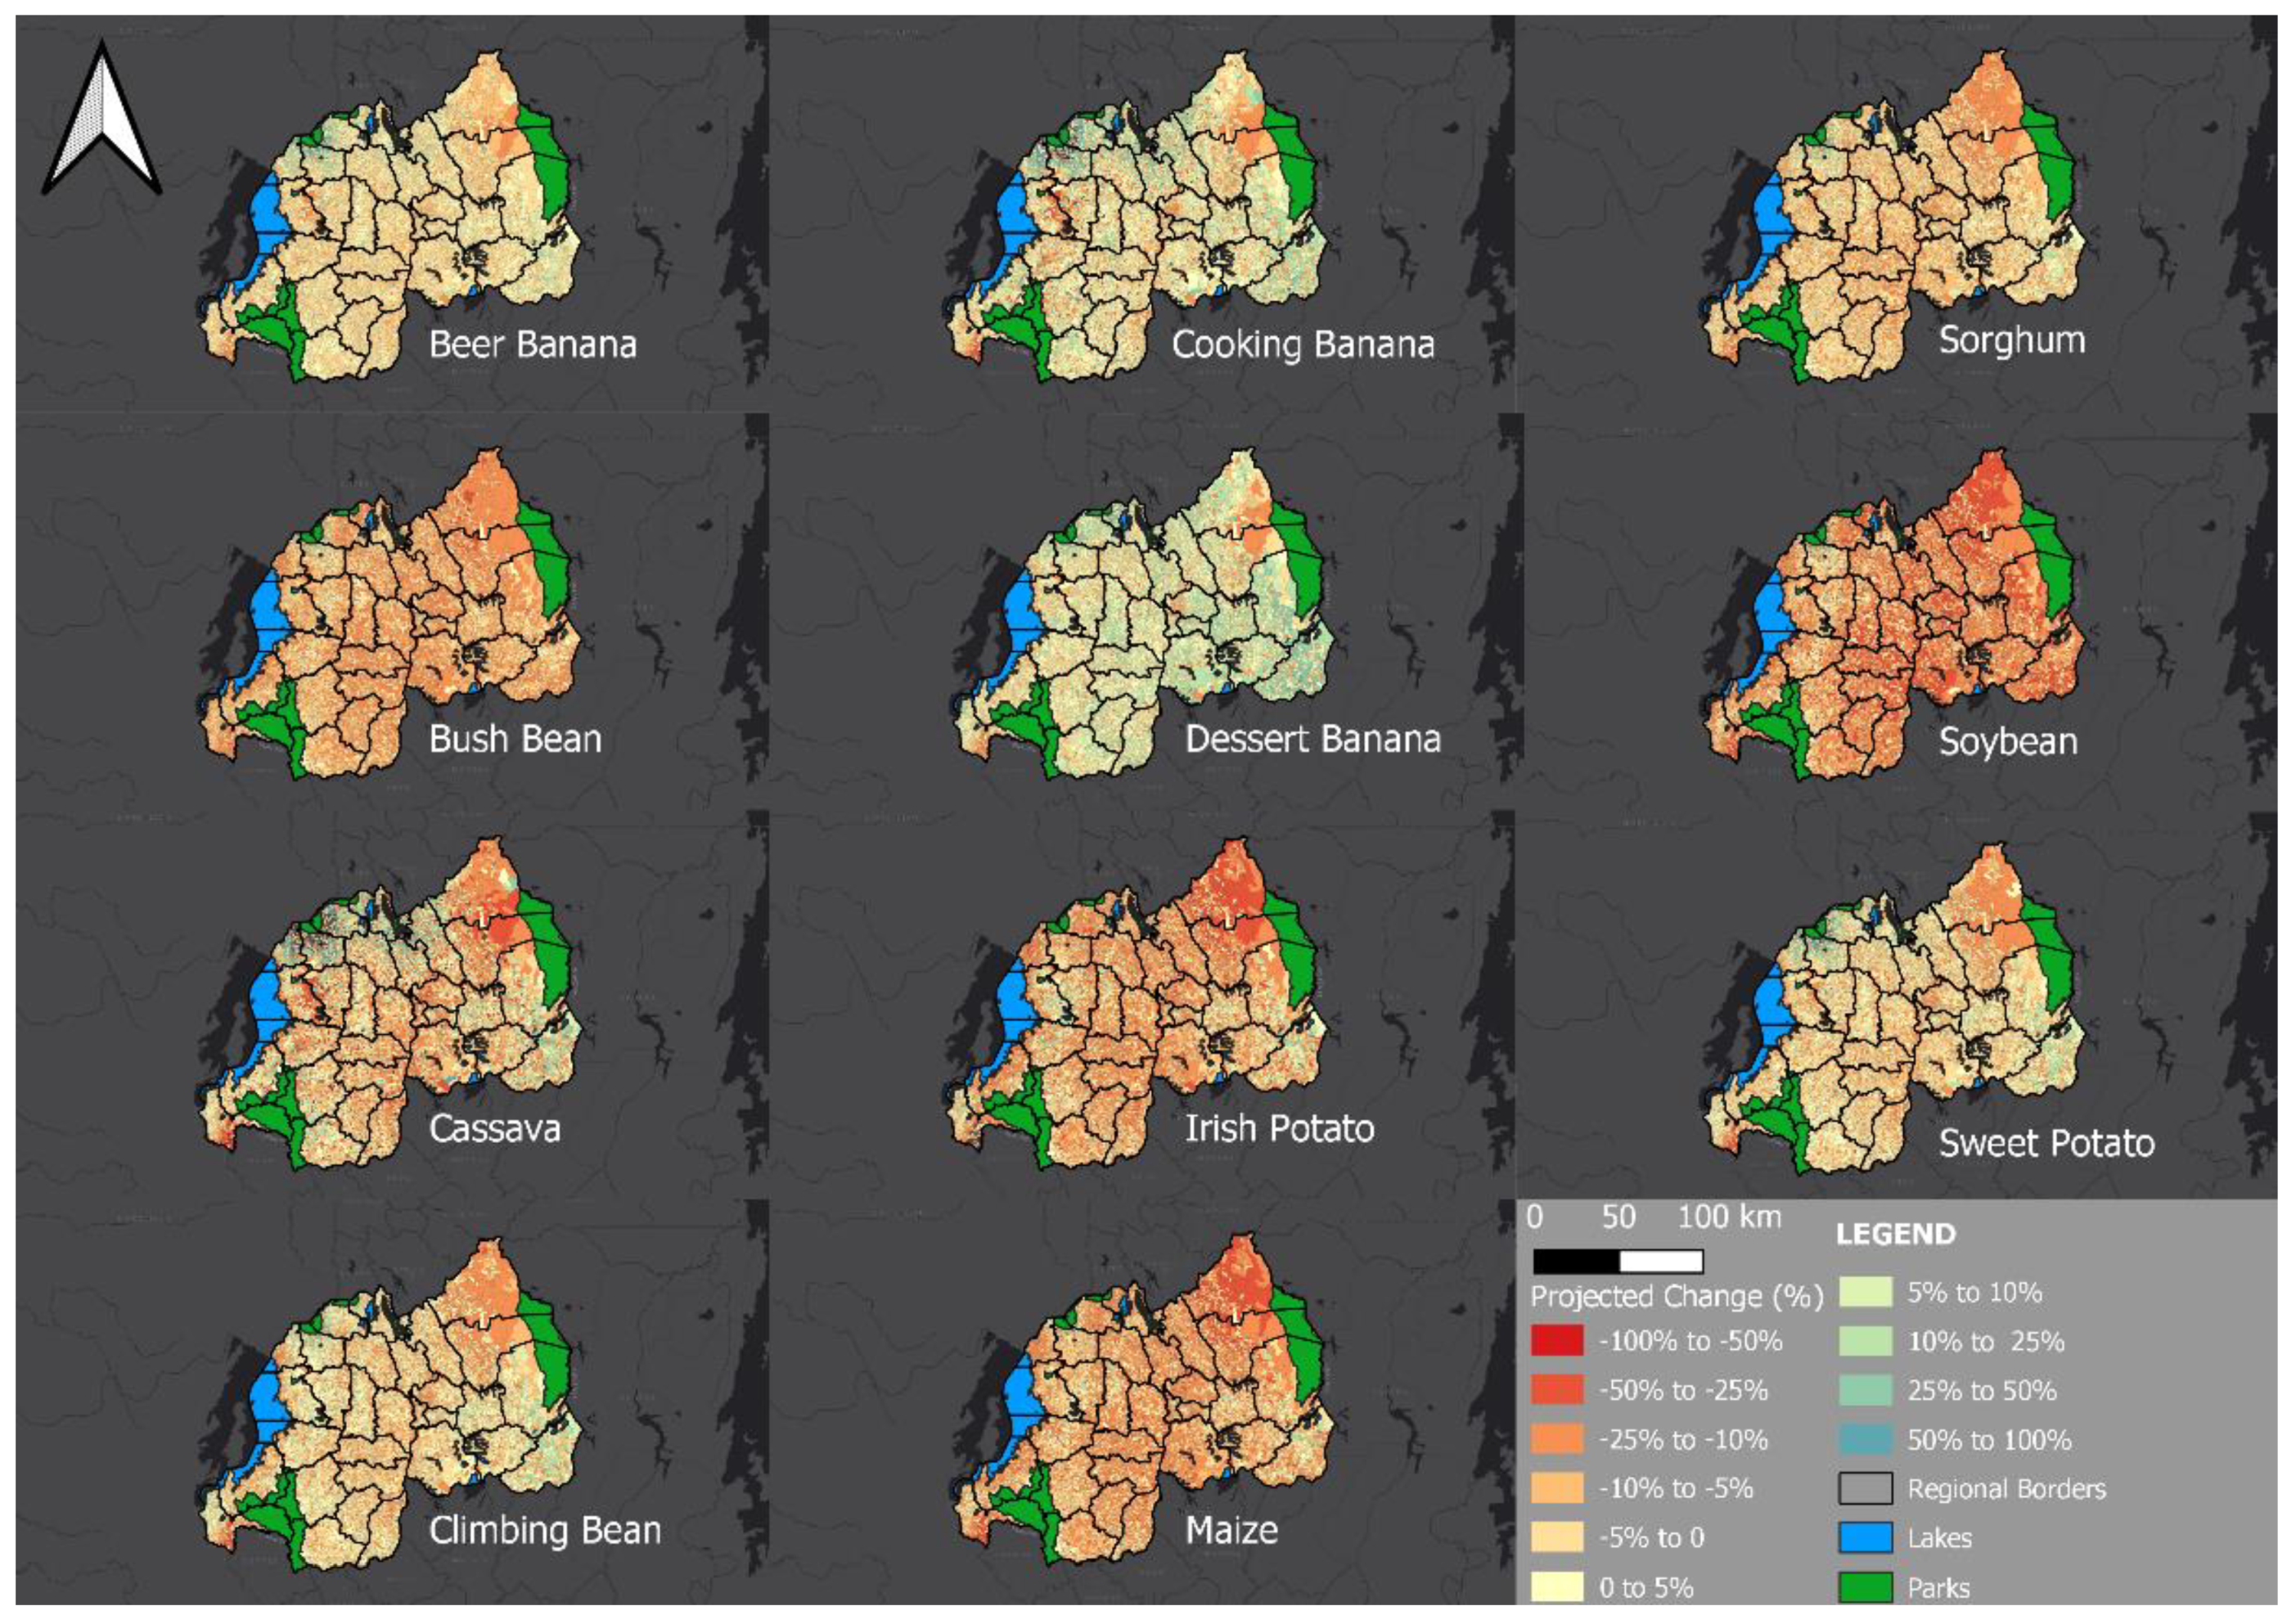
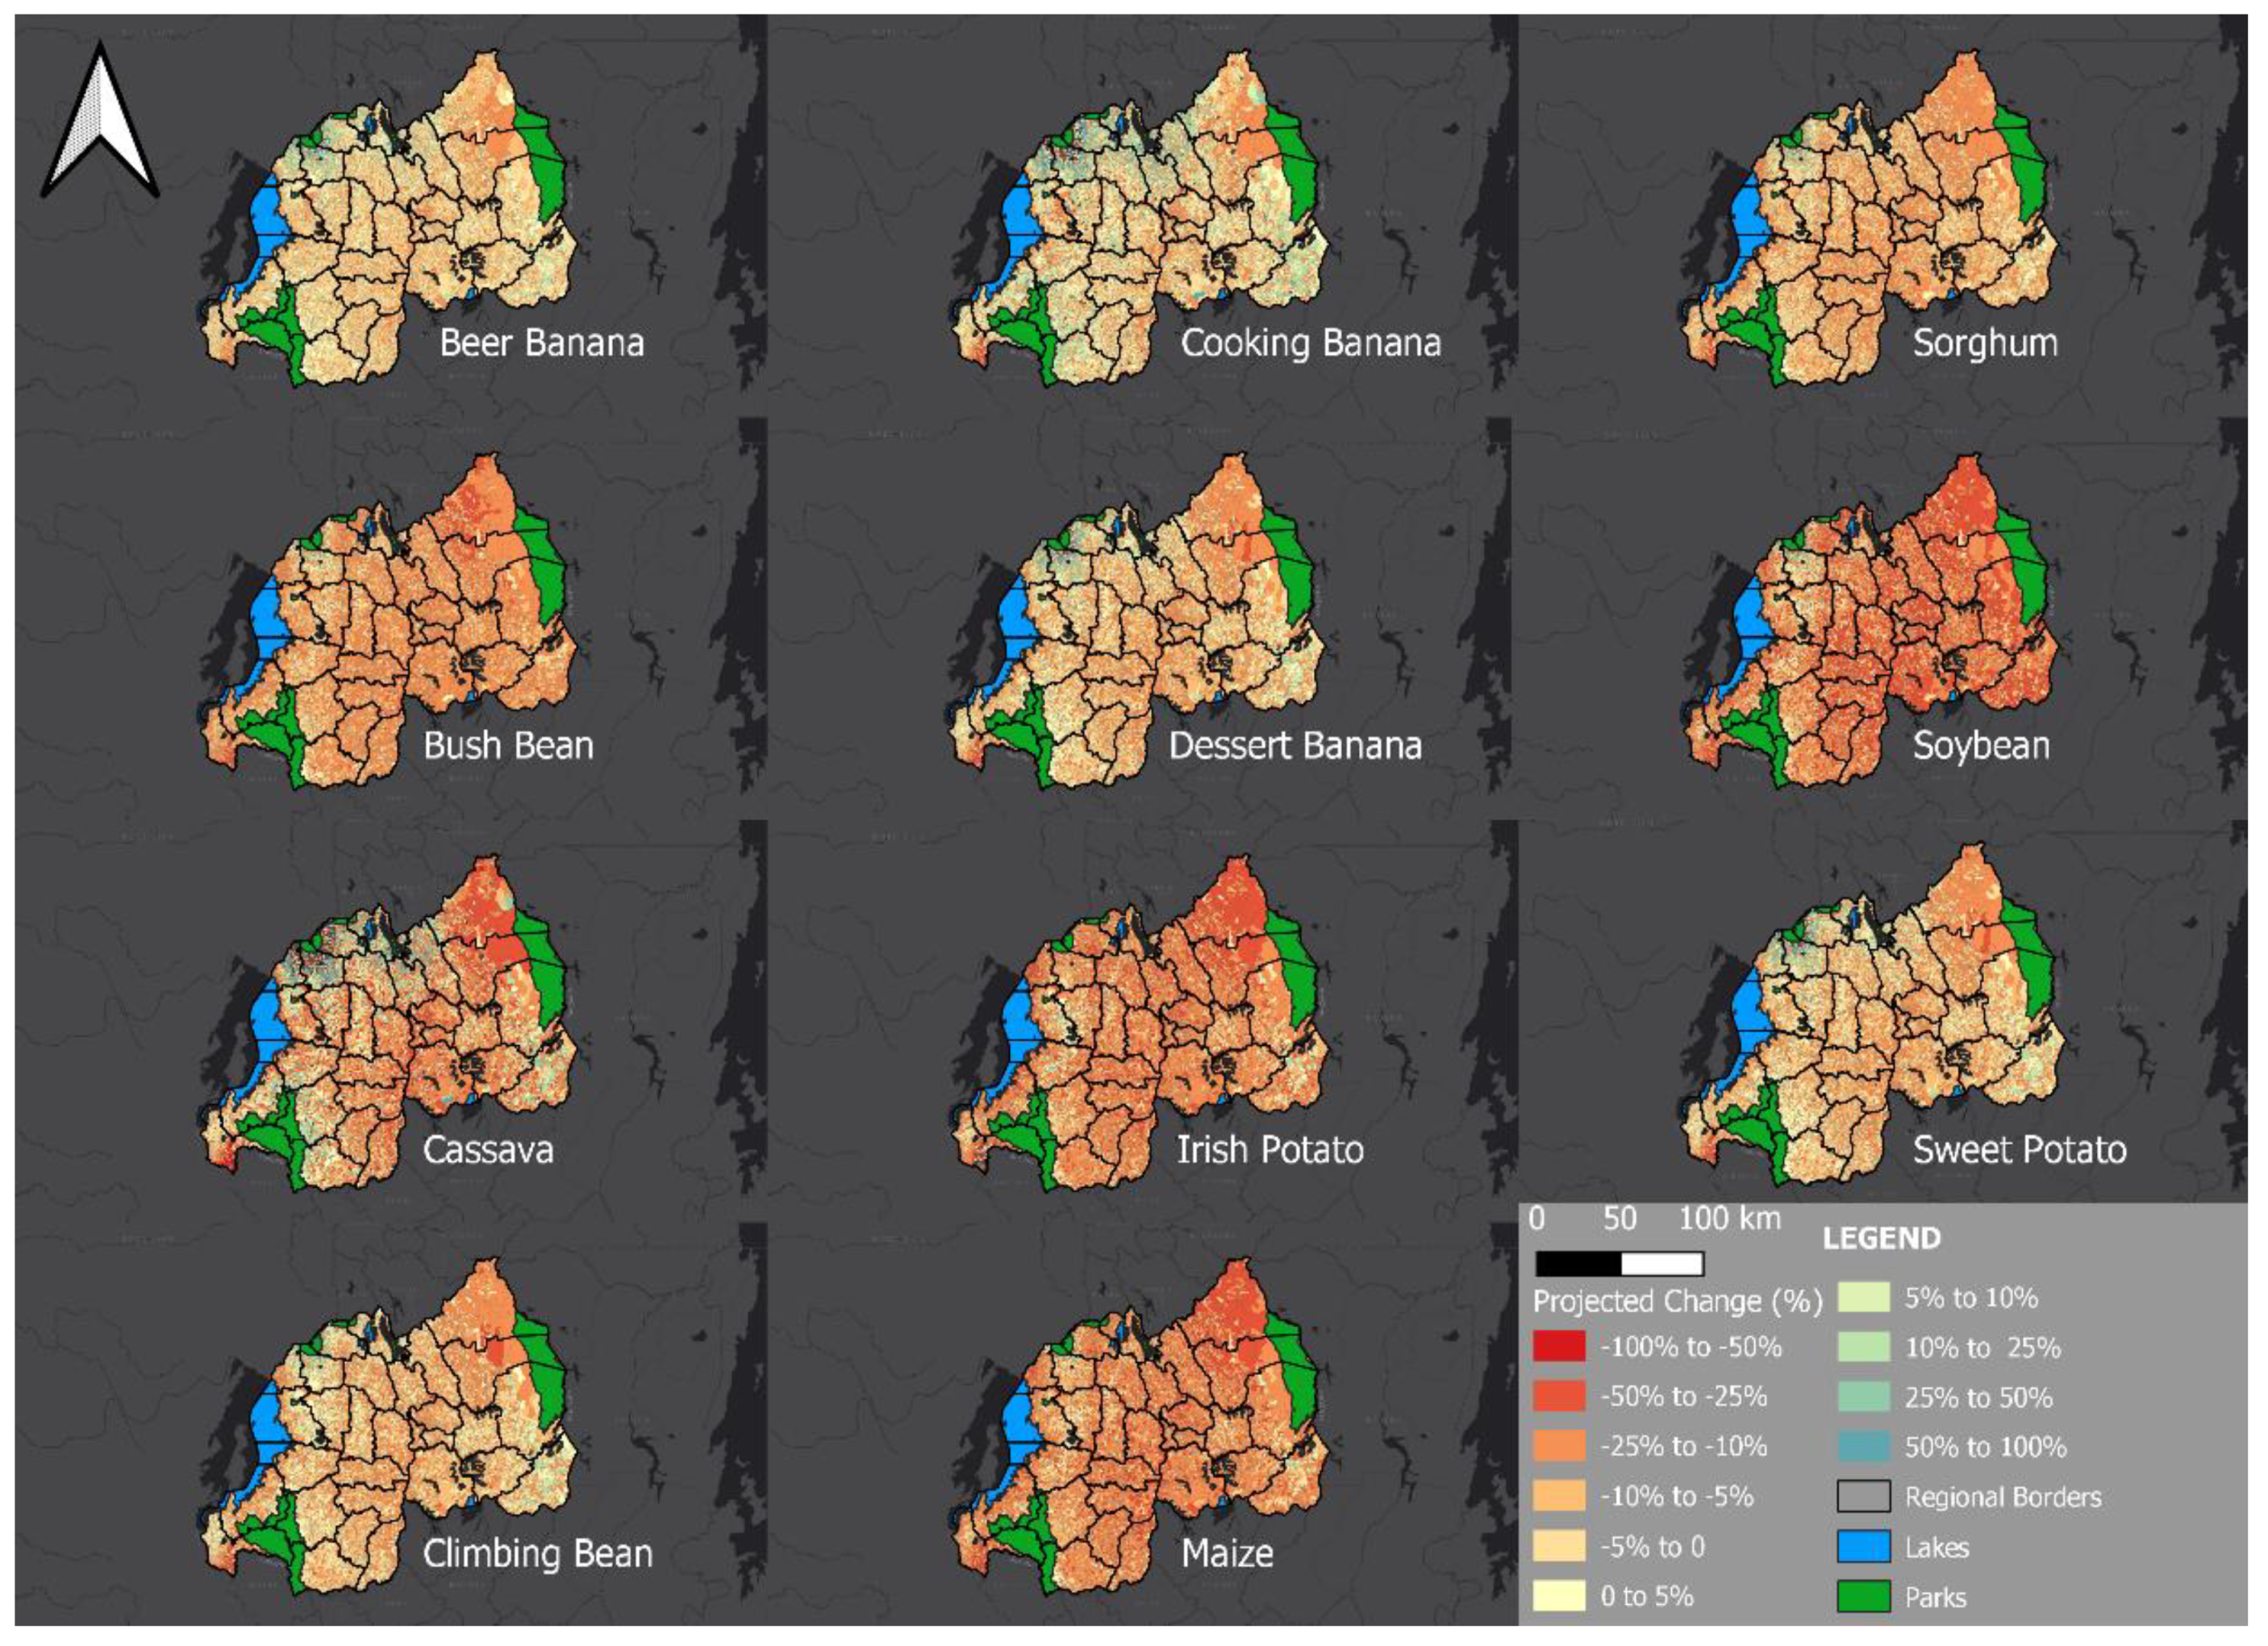
The impacts of future climate change vary over space, with the most severe reductions in potential crop yields in the Eastern Savannah and Central Bugesera agroecological zone (Figure 6 and Figure 7). This is expected, as the eastern region of the country is relatively warmer and drier than elsewhere in Rwanda. On the other hand, we predict that crop yields may increase somewhat in Birunga and the Buberuka Highlands, where temperatures are lower and may not yet be at their optimum for crop productivity.
Although we estimate average negative effects of future climate on potential crop yields, uncertainty due to our yield models and future climate projections is substantial. In almost all cases the range of uncertainty spans zero (Figure 5). Only two crops—maize and bush beans—have consistently negative relationships to future climate across the range of uncertainty under RCP 4.5, and only three crops—maize, bush beans, and Irish potato—have consistently negative relationships to future climate across the range of uncertainty under RCP 8.5.
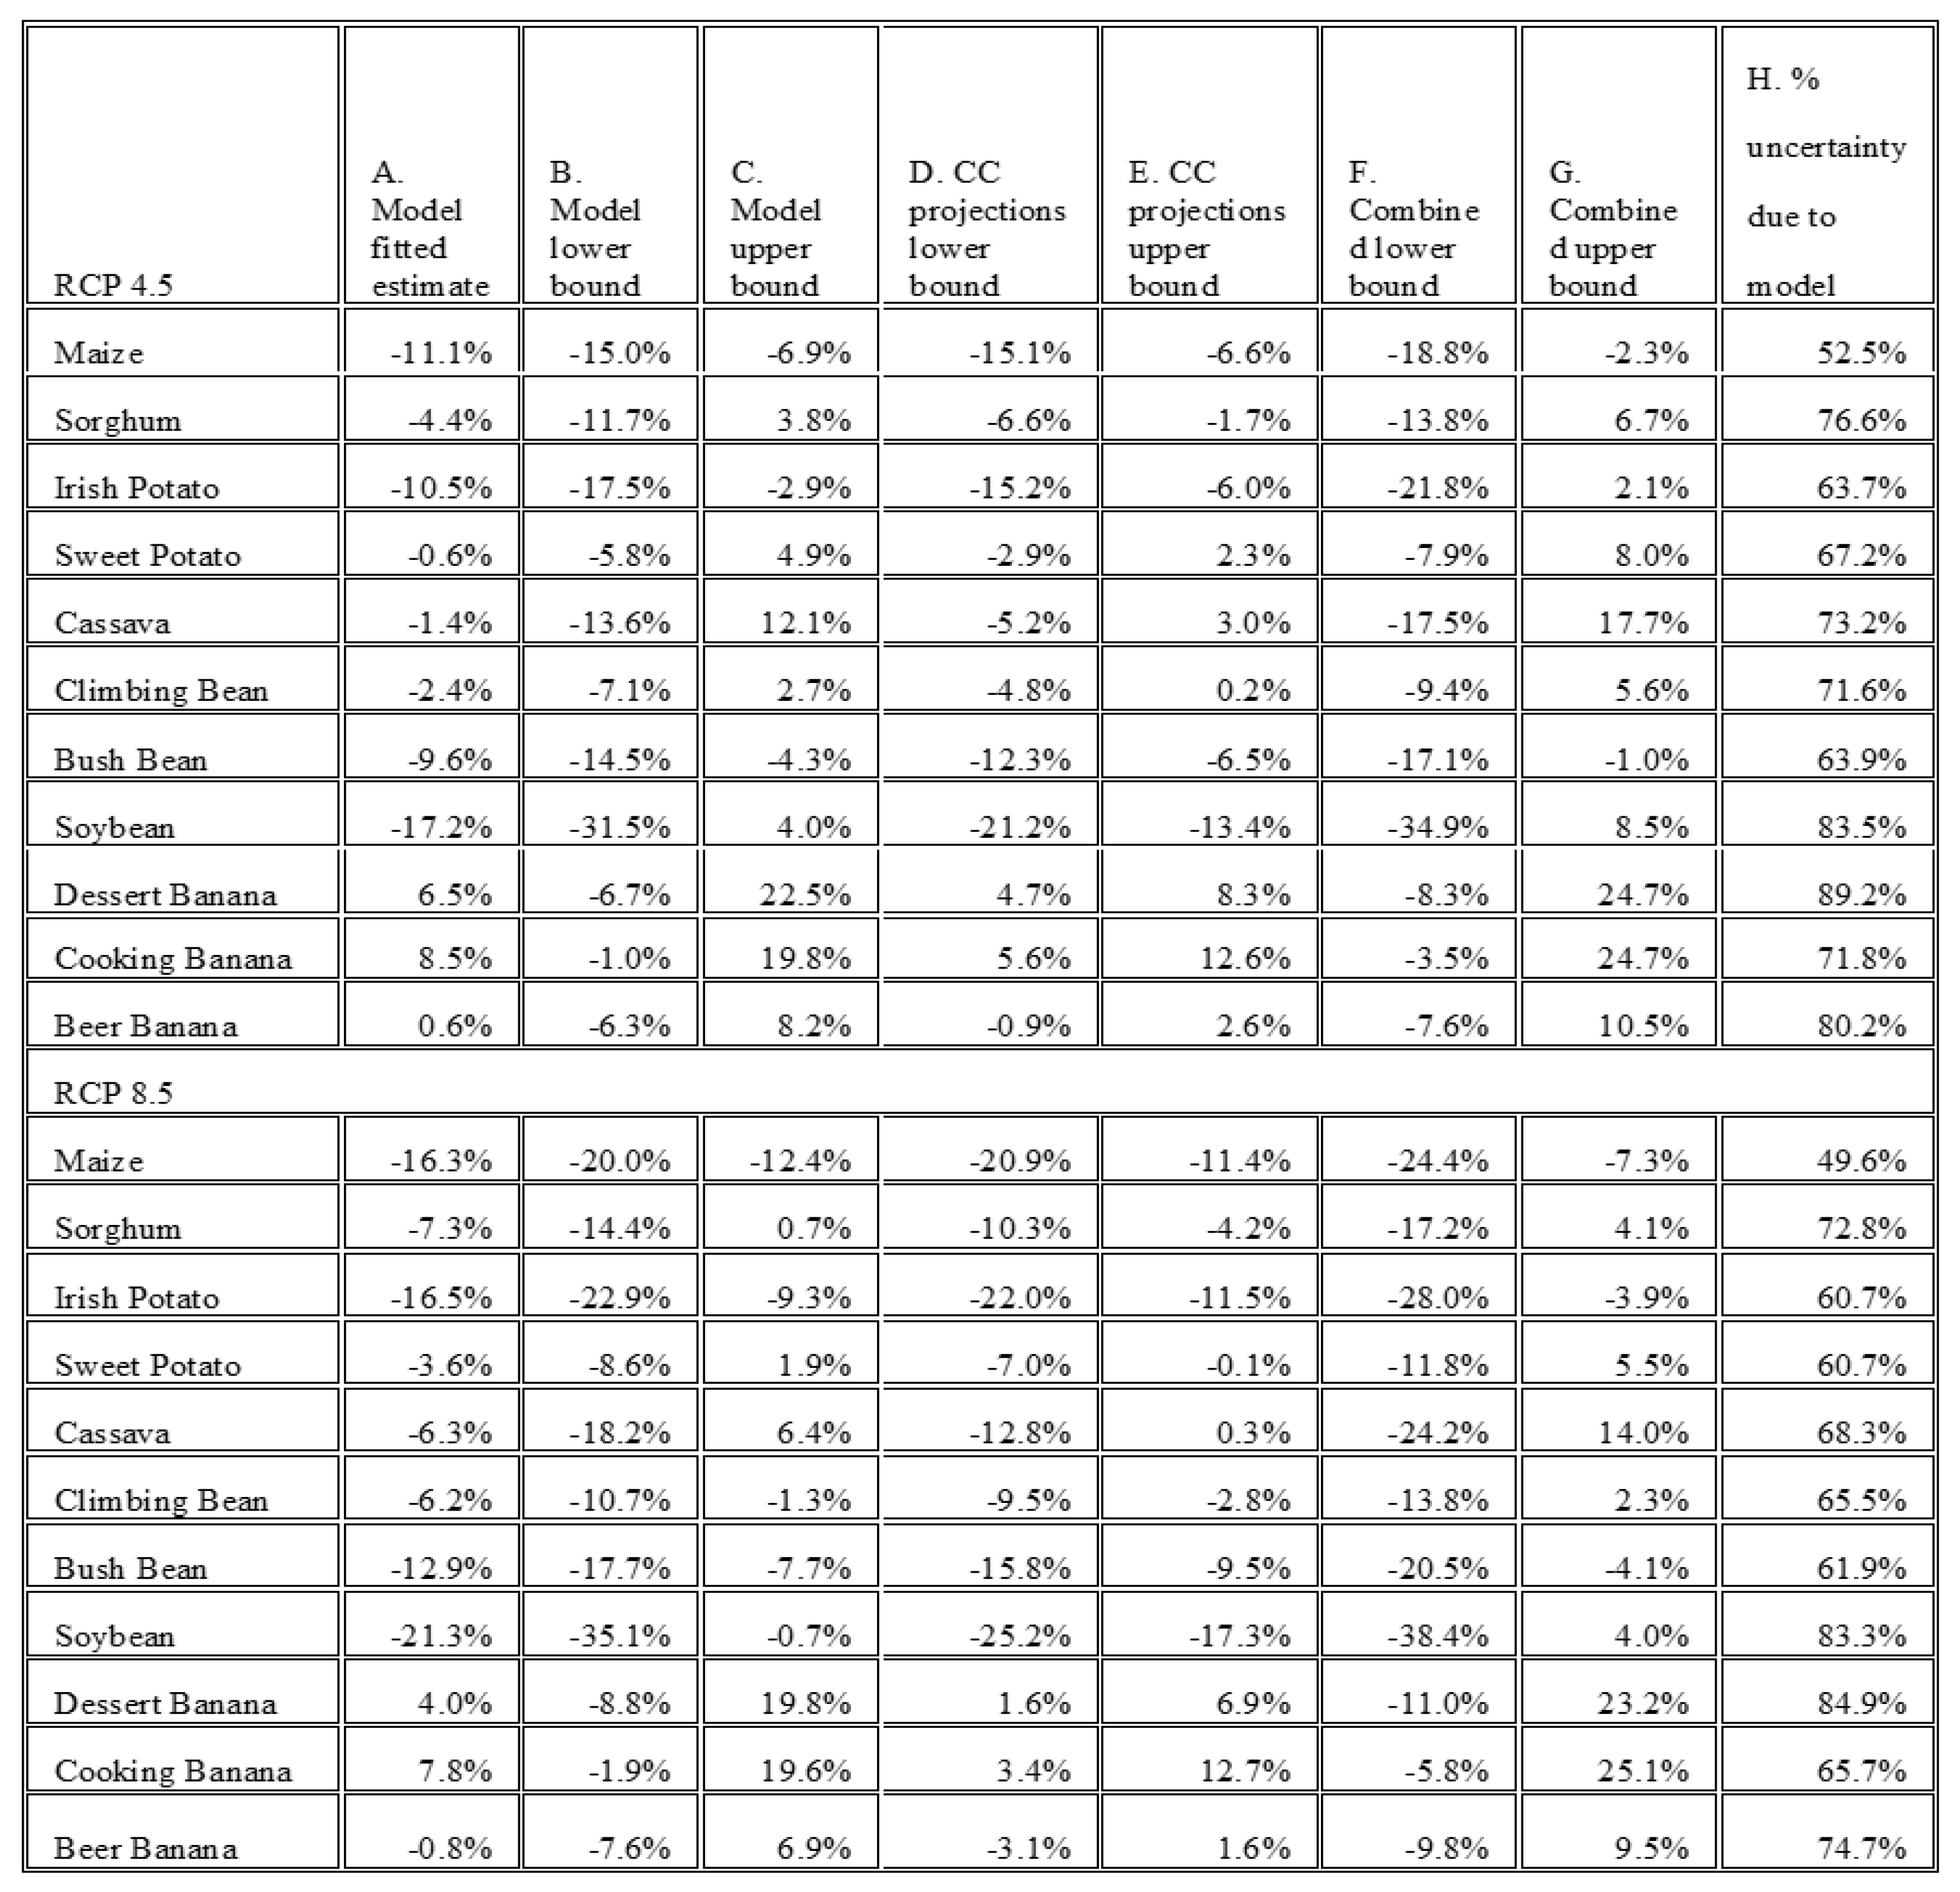
Our approach allows us to disaggregate the source of uncertainty in modelled outcomes (Figure 5, Figure A2). We separately report uncertainty based on the standard error of the linear models, uncertainty based on the interquartile range of the CMIP5 projections, and combined uncertainty from both sources (Figure A2). In almost all cases the uncertainty due to model specification dominates the combined uncertainty, contributing at least 60% of uncertainty for all crop yield predictions except maize.

4. Discussion

This study improves on previous estimates of the impact of climate change on potential crop yields in Rwanda by integrating the best available village-level data on crop yields from the NISR, along with high spatial resolution climate data. Our estimates of the impact of climate change on potential crop productivity in Rwanda largely fall within the range of previous estimates (Figure A1) but provide greater differentiation across crops and regions. We find that the potential yields of three important staple crops -- maize, bush bean, and Irish potato -- are likely to decline under future climate. Notably, these are widely cultivated crops nationally and are three of the crops targeted by Rwanda’s Crop Intensification Program, which aims to boost productivity via improved inputs and extension services [36]. Thus, this program may face additional challenges to achieving target yields posed by future climate change. Further work linking potential impacts of climate change on household nutrition will be valuable for informing food security planning, including under Rwanda’s Strategic Plan for Agricultural Transformation (2018–2024) and the Green Growth and Climate Resilience National Strategy [6].
We conducted our analysis at a highly refined spatial scale in order to identify subnational regions that are potentially at greater risk to due shifts in future climate. Not unsurprisingly, we note that potential crop yields are most likely to decline in the already warmer eastern savannah and plateau regions, but that they could be neutral or even positive in the highlands (Figure 6 and Figure 7). This informs where adaptation investments may need to be prioritized to support food security and climate resilience in the agricultural sector. It also suggests that highland regions could become more attractive for farming, leading to increased population pressure on land and exacerbating environmental degradation, including for example soil erosion, sediment transport, and landslide risk, in these regions [18].
Our estimates of the impact of climate change on potential crop productivity in Rwanda are characterized by wide uncertainty intervals. We consider uncertainty from both our modelled estimates of potential yield, and the range in future projections of climate change. However, we do not account for the potential for climate change to exacerbate pests and diseases that further contribute to reductions in crop yields [37], or for the possibility that CO2 fertilization could improve yields. Importantly, our analysis considers the impact of future changes in average annual temperature and precipitation but does not consider the potential impact of future climate extremes, such as droughts and floods, on crop yields. Indeed, extreme events may become more likely in the future, with catastrophic impacts on crop production [20]. In addition, this study does not account for the potential for adaptation to alleviate the impacts of climate change on agricultural households. Farmers may be able to improve management practices to compensate for climate change impacts, including via crop switching, technological improvements, shifting planting or harvesting dates, or relocating to new regions.

Author Contributions

Conceptualization, K.G.A., R.H.B., D.L., M.E.S., N.J.T., M.K., N.U.; methodology, K.G.A, R.H.B., D.L., M.E.S.; formal analysis, K.G.A.; resources, R.H.B., D.L., M.K., N.U.; writing—original draft preparation, K.G.A., N.J.T.; writing—review and editing, K.G.A., R.H.B., D.L., M.S., N.J.T., M.K., N.U.; visualization, K.G.A.; project administration, R.H.B., D.L. All authors have read and agreed to the published version of the manuscript.

Funding

This research received no external funding.

Acknowledgments

We would like to express our thanks to the National Institute of Statistics Rwanda (NISR) for providing the data on which this study is based.

Conflicts of Interest

The authors declare no conflict of interest.

Appendix A

Figure A1. Range of reported estimates of the potential change in crop yields due to climate change in Rwanda. Differences may be due to variation in methodologies, climate change projection models and scenarios, and geographic scope (with some studies estimating continental impacts but reporting projections separately by country) [38,39].
Sustainability 12 04116 g0a1
Figure A2. Relative changes in potential crop yields under RCP 4.5 and RCP 8.5. The fitted, lower bound, and upper bound model predictions, along with the average impact of climate change across all CMIP5 projections, are presented in columns A–C. The lower and upper bound estimates based on the interquartile range of the climate change (CC) projections are presented in columns D and E. The combination of both the standard error of the modelled predictions and the interquartile range of the climate change projections are presented in columns F and G. The proportion of the uncertainty due to the model is presented in column H.
Sustainability 12 04116 g0a2

References

  1. Niang, I.R.; Abdrabo, O.C.; Essel, M.A.; Lennard, A.; Padgham, C.; Urquhart, J.; Africa, P. Climate Change Impacts, Adaptation, and Vulnerability. Part B: Regional Aspects. Contribution of Working Group II to the Fifth Assessment Report of the Intergovernmental Panel on Climate Change; Cambridge University Press: Cambridge, UK; New York, NY, USA, 2014. [Google Scholar]
  2. Godfray, H.C.J.; Beddington, J.R.; Crute, I.R.; Haddad, L.; Lawrence, D.; Muir, J.F.; Pretty, J.; Robinson, S.; Thomas, S.M.; Toulmin, C. Food Security: The Challenge of Feeding 9 Billion People. Science 2010, 327, 812–818. [Google Scholar] [CrossRef] [Green Version]
  3. Schmidhuber, J.; Tubiello, F.N. Global food security under climate change. Proc. Natl. Acad. Sci. USA 2007, 104, 19703–19708. [Google Scholar] [CrossRef] [PubMed] [Green Version]
  4. Thornton, P.K.; Herrero, M. Adapting to climate change in the mixed crop and livestock farming systems in sub-Saharan Africa. Nat. Clim. Chang. 2015, 5, 830–836. [Google Scholar] [CrossRef]
  5. Thierfelder, C.; Chivenge, P.; Mupangwa, W.; Rosenstock, T.S.; Lamanna, C.; Eyre, J.X. How climate-smart is conservation agriculture (CA)? Its potential to deliver on adaptation, mitigation and productivity on smallholder farms in southern Africa. Food Secur. 2017, 9, 537–560. [Google Scholar] [CrossRef] [Green Version]
  6. Dube, T.; Moyo, P.; Ncube, M.; Nyathi, D. The Impact of Climate Change on Agro-Ecological Based Livelihoods in Africa: A Review. J. Sustain. Dev. 2016, 9, 256–267. [Google Scholar] [CrossRef]
  7. Brown, M.E.; Funk, C.C. Food Security Under Climate Change. Science 2008, 319, 580–581. [Google Scholar] [CrossRef] [PubMed] [Green Version]
  8. Müller, C.; Cramer, W.; Hare, W.L.; Lotze-Campen, H. Climate change risks for African agriculture. Proc. Natl. Acad. Sci. USA 2011, 108, 4313–4315. [Google Scholar] [CrossRef] [Green Version]
  9. Wheeler, T.; von Braun, J. Climate Change Impacts on Global Food Security. Science 2013, 341, 508–513. [Google Scholar] [CrossRef]
  10. Müller, C. African Lessons on Climate Change Risks for Agriculture. Annu. Rev. Nutr. 2013, 33, 395–411. [Google Scholar] [CrossRef]
  11. Knox, J.; Hess, T.; Daccache, A.; Wheeler, T. Climate change impacts on crop productivity in Africa and South Asia. Environ. Res. Lett. 2012, 7, 034032. [Google Scholar] [CrossRef]
  12. Descheemaeker, K.; Oosting, S.J.; Homann-Kee Tui, S.; Masikati, P.; Falconnier, G.N.; Giller, K.E. Climate change adaptation and mitigation in smallholder crop–livestock systems in sub-Saharan Africa: A call for integrated impact assessments. Reg. Environ. Chang. 2016, 16, 2331–2343. [Google Scholar] [CrossRef] [Green Version]
  13. Niyitanga, F.; Kabayiza, A.; Niyonzima, J. Assessment of Yield Gaps in Main Staple Crops in Rwanda. IJAIR 2015, 3, 1267–1271. [Google Scholar]
  14. Rwanda Ministry of Agriculture and Animal Resources. Strategic Plan for Agriculture Transformation 2018-24; Ministry of Agriculture and Animal Resources: Kigali, Rwanda, 2018.
  15. The World Bank. Rwanda Economic Update: Sustaining Growth by Building on Emerging Export Opportunities; The World Bank: Rwanda Kigali, Rwanda, 2017. [Google Scholar]
  16. Republic of Rwanda. Green Growth and Climate Resilience: National Strategy for Climate Change and Low Carbon Development; Republic of Rwanda: Kigali, Rwanda, 2011.
  17. Ndayisaba, F.; Guo, H.; Isabwe, A.; Bao, A.; Nahayo, L.; Khan, G.; Kayiranga, A.; Karamage, F.; Muhire, E.N. Inter-Annual Vegetation Changes in Response to Climate Variability in Rwanda. J. Environ. Prot. 2017, 8, 464–481. [Google Scholar] [CrossRef] [Green Version]
  18. Bagstad, K.J.; Ingram, J.C.; Lange, G.-M.; Masozera, M.; Ancona, Z.H.; Bana, M.; Kagabo, D.; Musana, B.; Nabahungu, N.L.; Rukundo, E.; et al. Towards ecosystem accounts for Rwanda: Tracking 25 years of change in flows and potential supply of ecosystem services. People Nat. 2020, 2, 163–188. [Google Scholar] [CrossRef]
  19. National Institute of Statistics of Rwanda. Seasonal Agricultural Survey; National Institute of Statistics of Rwanda: Kigali, Rwanda, 2018.
  20. Giertz, A.; Mudahar, M.S.; Gray, G.; Rubaiza, R.; Galperin, D.; Suit, K. Rwanda: Agricultural Sector Risk Assessment; World Bank Group: Kigali, Rwanda, 2015. [Google Scholar]
  21. National Institute of Statistics of Rwanda. EICV3 Thematic Report—Agriculture; Republic of Rwanda: Kigali, Rwanda, 2012.
  22. Swedesurvey. Report for Production of ortho photo in Rwanda, Rwanda National Land Use and Development Master Plan; Rwanda National Land Centre, Ministry of Natural Resources: Kigali, Rwanda, 2010.
  23. Meteo Rwanda. Meteo Rwanda Map Room. Available online: http://maproom.meteorwanda.gov.rw/maproom/index.html (accessed on 1 July 2019).
  24. Verdoodt, A.; Van Ranst, E. Environmental assessment tools for multi-scale land resources information systems: A case study of Rwanda. Agric. Ecosyst. Environ. 2006, 114, 170–184. [Google Scholar] [CrossRef]
  25. Global Administrative Areas. GADM Database of Global Administrative Areas, Version 2.0. Available online: www.gadm.org (accessed on 1 July 2019).
  26. Hijmans, R.J. Raster: Geographic Data Analysis and Modelling, R package version 2.6-7; 2016; Available online: https://cran.r-project.org/web/packages/raster/raster.pdf (accessed on 15 May 2020).
  27. R Core Team. R: A Language and Environment for Statistical Computing; R Foundation for Statistical Computing: Vienna, Austria, 2011. [Google Scholar]
  28. O’brien, R.M. A Caution Regarding Rules of Thumb for Variance Inflation Factors. Qual. Quant. 2007, 41, 673–690. [Google Scholar] [CrossRef]
  29. Jeffrey, M.W. Introductory Econometrics; South-Western Cengage Learning: Mason, OH, USA, 2009. [Google Scholar]
  30. Zeileis, A. Econometric Computing with HC and HAC Covariance Matrix Estimators. J. Stat. Softw. 2004, 11, 1–17. [Google Scholar] [CrossRef]
  31. Peng, R.D. Simpleboot: Simple Bootstrap Routines, R package version 1.1-7; 2019; Available online: https://cran.r-project.org/web/packages/simpleboot/simpleboot.pdf (accessed on 15 May 2020).
  32. Ward, P.S.; Florax, R.J.G.M.; Flores-Lagunes, A. Climate change and agricultural productivity in Sub-Saharan Africa: A spatial sample selection model. Eur. Rev. Agric. Econ. 2013, 41, 199–226. [Google Scholar] [CrossRef]
  33. World Bank Group. Climate Change Knowledge Portal: Rwanda. Available online: https://climateknowledgeportal.worldbank.org/country/rwanda/climate-data-projections (accessed on 12 March 2020).
  34. Tebaldi, C.; Knutti, R. The use of the multi-model ensemble in probabilistic climate projections. Philos. Trans. R. Soc. A Math. Phys. Eng. Sci. 2007, 365, 2053–2075. [Google Scholar] [CrossRef]
  35. Hawkins, E.; Sutton, R. The potential to narrow uncertainty in projections of regional precipitation change. Clim. Dynam. 2011, 37, 407–418. [Google Scholar] [CrossRef]
  36. Kathiresan, A. Strategies for Sustainable Crop Intensification in Rwanda; Ministry of Agriculture and Animal Resources: Kigali, Rwanda, 2011.
  37. Deutsch, C.A.; Tewksbury, J.J.; Tigchelaar, M.; Battisti, D.S.; Merrill, S.C.; Huey, R.B.; Naylor, R.L. Increase in crop losses to insect pests in a warming climate. Science 2018, 361, 916–919. [Google Scholar] [CrossRef] [Green Version]
  38. Muhire, I.; Tesfamichael, S.G.; Ahmed, F.; Minani, E. Spatio-Temporal Trend Analysis of Projected Temperature over Rwanda. J. Environ. Sci. Toxicol. Food Technol. 2015, 9, 64–71. [Google Scholar]
  39. Tenge, N.G.; Alphonse, M.; Thomas, T.S. Chapter 9, Rwanda. In East African Agriculture and Climate Change: A Comprehensive Analysis; International Food Policy Research Institute: Washington, DC, USA, 2013; pp. 247–278. [Google Scholar]
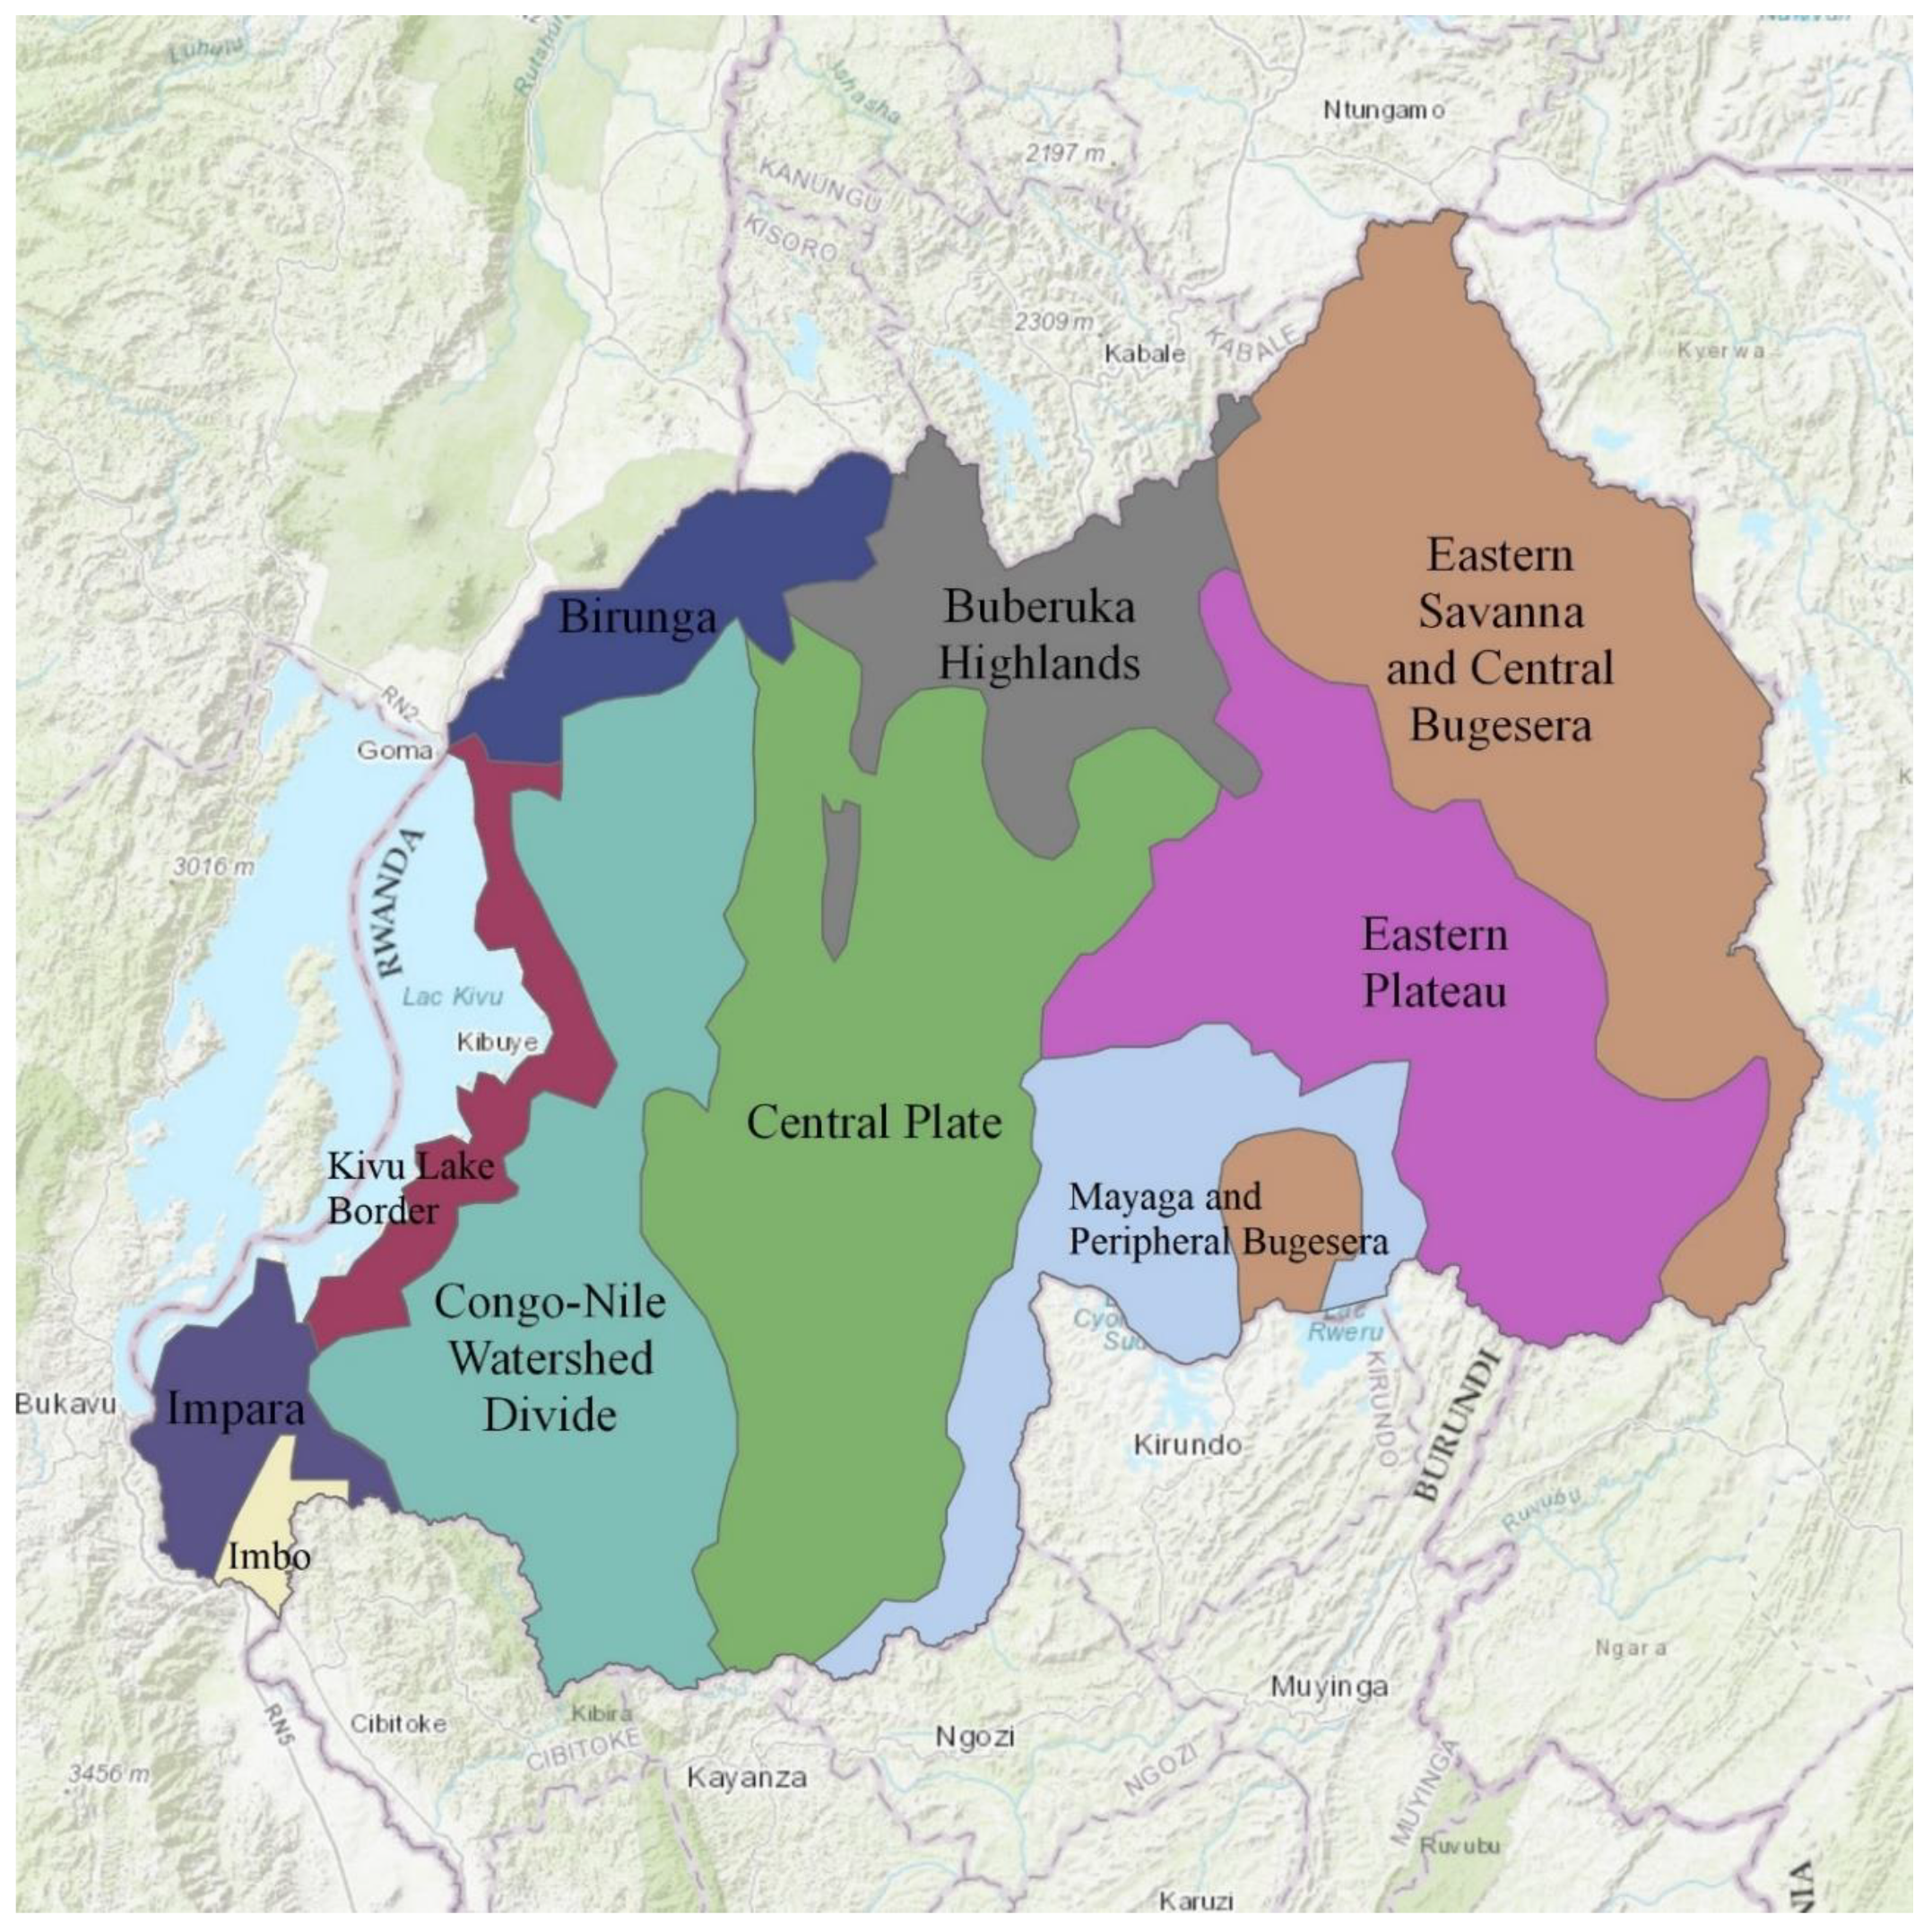
Figure 1. Agroecological zones of Rwanda.
Sustainability 12 04116 g001
Figure 2. Distribution of average crop yields (kg/m2) across Rwandan villages, according to the National Institute of Statistics of Rwanda (NISR) seasonal agricultural surveys 2017–2018.
Sustainability 12 04116 g002
Figure 3. Maps of the nine explanatory variables included in the crop yield models.
Sustainability 12 04116 g003
Figure 4. Results of the general linear model of crop yield as a function of environmental covariates. All models include fixed effects for agroecological zones.
Sustainability 12 04116 g004
Figure 5. Predicted changes in average crop yields by 2050 relative to average yields modelled using climatic conditions from the recent past, under Representative Concentration Pathway (RCP) 4.5 and RCP 8.5. Range represents the standard errors from the modelled predictions in combination with the interquartile range of the 17 Coupled Model Intercomparison Project 5 (CMIP5) climate change projections.
Sustainability 12 04116 g005
Figure 6. Projected change in potential crop yields under climate in 2050 based on RCP 4.5.
Sustainability 12 04116 g006
Figure 7. Projected change in potential crop yields under climate in 2050 based on RCP 8.5.
Sustainability 12 04116 g007