Article

Sustainability of Educational Technologies: An Approach to Augmented Reality Research

by
Emilio Abad-Segura
1,*,
Mariana-Daniela González-Zamar
2,*,
Antonio Luque-de la Rosa
2 and
María Belén Morales Cevallos
3
1
Department of Economics and Business, University of Almeria, 04120 Almeria, Spain
2
Department of Education, University of Almeria, 04120 Almeria, Spain
3
Department of Education and Social Psychology, University Pablo de Olavide, 41013 Sevilla, Spain
*
Authors to whom correspondence should be addressed.
Sustainability 2020, 12(10), 4091; https://doi.org/10.3390/su12104091
Submission received: 23 April 2020 / Revised: 14 May 2020 / Accepted: 15 May 2020 / Published: 16 May 2020
(This article belongs to the Special Issue Teacher Training in Active Methodologies for Ecosystem Learning)

Abstract

:
Technological advancements have posed a challenge to educational institutions in the sustainability of management, research and teaching activities. Virtual technologies have allowed digital transformation to be incorporated into university education—among them, augmented reality (AR). The study examined the evolution of global research on this topic in the period 2005–2019. A bibliometric analysis of 1977 articles was performed, obtaining results of scientific productivity. The evidence showed a growing interest in studying the sustainability of AR in higher education. According to the results, the main category was computer science; the most productive journal was Computer and Education; the authors with the largest number of publications were Nee and Ong, while Wang was the most frequently cited author; the most productive institution was the National Taiwan University of Science and Technology; the United States was the country with the largest number of publications and citations; and, finally, the United States and Spain were the countries with the largest number of international collaborations in their articles. Five lines of research were identified, among which those oriented to the topics of technological resources, computer, simulation, education and learning stand out. It was verified that this research topic has a growing and dynamic interest in scientific activity, and its sustainable approach is confirmed by being linked to the Sustainable Development Goals (SDGs).

Graphical Abstract

1. Introduction

Information and communications technology (ICT) has revolutionised communication, training and work processes [1]. Similarly, since a few years ago, universities are undergoing a transformation process derived, mainly, from globalisation, internationalisation, the characteristics of the students and information and communication technologies. This process poses a challenge to higher education institutions regarding the competences that faculty members and students must acquire and, consequently, the adaptation of the curricula to these new competences [2,3,4]. Hence, the university must assume an innovative role in line with the new emerging technologies, among which augmented reality (AR) stands out [5], as is shown in the Horizon 2012 report, and again in the 2016 report [6,7], thus indicating its importance in the field of education. AR has become an emerging technology with great possibilities for use in education [8,9,10,11,12].
Recently, AR in university education has been widely studied from different perspectives. In the context of higher education (HE), the management of the implementation of the set of technologies comprised by AR is key to its development as an educational tool.
In the early 1960s, AR appeared in informatics and science, as a consequence of the advances in technologies based on computers with faster and more efficient processors, real-time rendering techniques and the development of position tracking systems and artificial vision [13,14]. The combination of these gave rise to the development of applications that superimpose images, 3D models, texts and other digital elements on real-time video, which is captured by video cameras.
Since then, AR has been considered a paradigm based on composing a real-time view that combines the physical world with digital objects. This offers high levels of natural interaction, since the artificial vision techniques used by AR allow the user to detect simple interactions [15]. Considering the phenomenon of digital information ubiquitousness, which is increasingly present in our daily activities, we can perceive that the limits between the physical and virtual worlds are less and less clear.
AR refers to the presentation of digital information in the real world. With the use of AR technologies, digital information can be presented in the real world directly to the user, without requiring the latter to pay explicit attention to the screen of a device [16,17].
Therefore, unlike other interaction paradigms, AR allows the users to remain in contact with their contexts, hence their attention is in the real world, which implies that there is no context isolation, i.e., an augmented real world is generated [18]. By exploiting the visual and spatial abilities of the user, AR brings additional information to the real world, rather than introducing the user into a virtual world that exists inside a computer.
In this order, the HE sector evolves along with technological development, adapting the pedagogical models to the development proposed by digitalisation. Digital literacy must be transversal in all educational levels and, mainly, in the last stage of the education of citizens, since their training must be in line with a job market that is at constant digital transformation [19,20]. Thereby, it is necessary to analyse how the implementation of technological advancements, particularly in AR, is being managed by educational institutions [21,22], which is fundamental for achieving the productive adaptation of means, contents and objectives.
AR technology is used in the field of HE to promote student learning, so that it becomes a tool that allows you to observe physical elements of reality through mobile devices through a fun and playful interaction facilitating study of the contents.
Likewise, AR provides greater retention of information to the student, thus acting as a tool at the service of teaching and learning, and it offers the opportunity to carry out sustainable practices with the purpose of improving the understanding of complex phenomena [11,20]. In other words, the sustainable use of educational technologies seeks to visualise the change so that it is subsequently viable and possible.
On the other hand, the sustainability of this technology is linked to the Sustainable Development Goals (SDGs), adopted by the United Nations in 2015, mainly with the goals (4) Quality Education, (9) Industry, Innovation and Infrastructure and (11) Sustainable Cities and Communities.
In addition to its application in various areas of the entertainment industry, AR has a high potential to be used in educational settings, favouring learning and evaluating the knowledge acquired. In this way, students verify that what they learn is not only relevant but can also be applied in the real world and can be used immediately in real situations.
As an example of the usefulness of AR, some architecture students explain that the use of 3D modelling technologies, together with AR and virtual reality—a related concept that will be defined later—make complex classes of structures more accessible to knowledge [3,18]. In these cases, AR technological resource allows the creation of interactive 3D environments rich in information that, combined with immersive applications, allow recognizing the construction techniques used in each historical period. That is, exploring the AR implementation has the advantage of developing the creative potential for interactivity of an environment in real time.
Our research questions were the following. What is the knowledge structure for the sustainability of educational technologies and AR? Which are the most productive authors, institutions and countries? In addition, what are the main current and future lines of research in this field?
Consequently, the objective of this study was to examine the evolution of scientific production related to the sustainability of educational technologies with a focus on AR and to detect current and future trends. Therefore, this overview provides a reflective and descriptive analysis of the specific research published to date and future lines of research on this topic. Likewise, the motivation of this work was to clarify future lines of research on the applications of AR in universities, to increase the understanding of the conditions that determine a series of specific results.
During this review, we found documents that address this topic from different approaches, therefore the research question is aimed at determining whether the development of technology related to AR has contributed to the increasing interest in academic production in the last years.
The main limitation of this study was that it is not clear whether, among other variables, the number of publications is due to digitalisation, the application of new teaching and learning methodologies or the link between education and leisure. Similarly, the main objective of this study was to analyse the research trends about the sustainability of educational technologies with a focus on AR in HE at the global level for the period of 2005–2019.
To obtain answers to these research questions, we analysed a sample of 1977 articles in scientific journals selected from the Scopus database. This review followed the bibliometric method to synthesise the knowledge base of the sustainability of educational technologies with a focus on AR in HE. The results showed the contributions of this research line, which allowed identifying the main driving agents and their future trends, as well as revealing certain gaps of critical knowledge. To this respect, it can be concluded that educational technologies and, among them, AR have been established as a tool with numerous applications in university education, becoming a research field with exponential growth. Lastly, it is necessary to highlight that future studies in this research line must analyse the effectiveness of AR in the improvement of the use of remote laboratories in the field of engineering education, link AR to augmented virtuality and evaluate the use of AR in the diagnosis of the attitudes and characteristics of future educators.

2. Research Scope

The study of the sustainability of educational technologies and, among them, AR in HE is supported by the analysis of a series of theoretical fundamentals that, along with the basic concepts, define the reference framework in this research field. Thereby, these explanatory bases describe the behaviour of a set of phenomena to generalise and provide a differentiated abstraction of particular cases.

2.1. Backgrounds

AR first emerged as a project to improve the quality of life of people and progressively gained strength, opening new paths and reaching several sectors, such as education, marketing, tourism, entertainment, videogames and activities of daily life [23,24,25]. Since its inception in the 1990s, it has evolved as a knowledge support tool and its maturation in the last years has brought communities together through the development of specific actions and activities of different areas of knowledge, such as architecture, education, science, engineering and museums, among others [26,27]. Figure 1 shows the phases of the theoretical–practical model of AR [3,8,11,12,13,14,16,28].
The literature review of the research topic obtained the documents that contain the intrinsic knowledge related to the study approach. In this way, we identified the scientific articles that have mainly contributed to establish the theoretical foundations and the basic terminology of the sustainability of AR in the educational context.
The identification and selection of the documents were defined through an inclusion–exclusion process based, firstly, on the keywords of the articles and, secondly, on the reading and analysis of the texts.
Consequently, Table 1 presents the main results of the literature review on the state of the art publications in this field of research. These documents have made it possible to formulate the research questions and determine the purpose and objective of this study, in addition to establishing the key concepts to apply the methodology to the total sample of documents.
The review of the documents allowed us to establish that AR is an emerging technology that can be used to complement the way in which individuals perceive the world around them, and introduces users to an augmented real environment that is generated by a computer [39,40].
AR applications in education have a significant contribution to the area of knowledge, as they contribute to facilitating the teaching of didactic content that would otherwise be more difficult to transmit. Therefore, the inclusion of this technology in educational practices favours obtaining better quality standards [41,42,43,44].
Likewise, most of the articles about the educational use of AR are recent; the number of publications in this topic has increased in the last years, providing findings that justify the incorporation of this technology to the educational practice.

2.2. Theoretical and Conceptual Frameworks

The sustainable link between AR and HE must be established in accordance with the cognitive approach, according to the axioms of the theories related to learning, with the aim of unifying the association of this technology with the teaching–learning process.
From the approach of the learning theories and the mechanisms that allow the generation of knowledge, Mayer’s cognitive theory of multimedia learning (CTML) states that people learn more significantly from words combined with images than from words alone [45,46,47]. In this way, the theory proposes three main notions regarding multimedia learning. On the one hand, there are two separate channels (audition and vision) to process information, each with a limited capacity. On the other hand, learning is a process of active filtering, selection, organisation and integration of information based on previous knowledge [48].
However, the CTML supports the idea that the brain does not interpret a multimedia presentation of words, images and auditory information in an exclusive manner; it rather selects and organises these elements dynamically to produce logical mental constructs. In this case, human beings process a limited amount of information through one channel at a given time and make sense of that information by actively creating mental representations [49,50].
In this context, the teaching–learning process should incorporate the use of an appropriate combination of graphs and words that support each other, allowing the students to retain the information for a longer time through logical structures. Moreover, the CTML favours teaching by fragmenting the information into smaller loads, which allows students to process smaller amounts of information and integrate them before tackling the next load of information [51,52].
Hence, the CTML is based on the appropriate use of the means to become an effective learning tool. In this way, faculty members and students can rely on the optimisation of learning derived from the design of contents that are based on learning patterns and cognitive processes.
Similarly, the reviewed literature provides definitions for the basic concepts of this research topic. Therefore, we included a series of reflections on the terms and concepts used in the context of this study.
AR is a technology that can complement the perception of and interaction with the real world, offering the user a real scenario augmented with additional information generated by pedagogical and technological interventions [53,54]. Other authors consider that AR is the term used to define a direct or indirect vision of a physical environment in the real world, whose elements are combined with other virtual elements to create a mixed reality in real-time. That is, it allows users to see and interact in real time with virtual images superimposed on the real world, which requires the participation of the individual for the precision and elaboration of messages and technological products [55]. Among its main characteristics, it is worth highlighting that AR is a mixed and interactive reality integrated in real-time that offers levels of interaction and modifies the information of the physical reality in which it is used [56,57].
In this context, virtual reality (VR), as one of the most important technological changes of recent times, consists of the sensorial immersion in a world that is based on real and unreal environments (generated artificially) that can be perceived through the use of accessories. A more formal concept defines it as the representation of scenes or images of objects produced by a computer system, which makes them look real [58,59].
In any case, VR, mainly in developed countries, has gained a presence in educational environments as an alternative approach to the traditional learning experiences [60], since it offers students an interactive three-dimensional environment with characteristics of the real world. Moreover, this allows students not only to experiment with the feeling of being present in the environment with the possibility of interacting with objects within it, but also to observe elements reacting to actions that are not necessarily those of the user [61,62].
While VR creates a completely virtual world, transporting the user into that reality, and creates digital contexts that imitate the real world, AR introduces digital information into the real world to allow the users to interact with virtual content in the real world and differentiate them [63,64]. On the other hand, VR is more surrounding and presents a first-person view where the objects are displayed in 3D; on the other, AR offers greater freedom for the user to make decisions [65,66].
Mixed reality (MR) refers to a combination of VR and AR. It is an environment that mixes the aspects of both technologies, unifying the experience to require a single device. Thereby, MR merges both concepts to allow the user to interact with real objects within a virtual world, to be totally immersed in a completely virtual world or to reproduce virtual elements in the real environment [67,68]. Although MR has appeared relatively recently, certain companies with technological value are supporting its development, with the aim of democratising its use [69].
To sum up, AR is characterised by complementing the real environment with digital elements, with the ability to reproduce objects, animations and data that are not present in that environment [70]. Nowadays, one of the main causes of the increased use of AR is due to the diversification of interaction spaces outside of the computer, since it simply requires an interface that uses AR on mobile devices [71].
Most studies about AR in education are based on learning theories, especially on the constructivist learning and situated learning theories [72,73]. It is important to highlight that the constructivist approach encourages students to understand and build their knowledge using the information they perceive from the outside world [74]. In this context, AR technology employs real environments, inciting students to develop knowledge in collaboration with their classmates [75].
Likewise, the advancement of digital technology has a direct influence on HE. Consequently, the educational actions proposed by institutions of higher education must consider the rate at which these technologies evolve [76,77]. In this order of ideas, the application of AR has facilitated developing competences derived from the use of ICT, such as teamwork capacity, and discovering new didactic resources related to immersive technology that enable the development of new teaching processes from an inquiring and ubiquitous perspective [78,79].
In this sense, Figure 2 shows two practical applications of AR advantages in the education sector. Figure 2(a) displays the artist Picasso explaining, virtually, the details of his mural “Guernica” in the Spanish Museum Reina Sofía Art Centre (Madrid, Spain), where it is shown to the general public. Figure 2(b) presents, through the AR tool, the artist Picasso explaining to students the process of artistic creation as part of a university subject of the degree of arts education.

2.3. Sustainable Approach

In this research study, the concept of sustainability has been understood as a way of acting, thinking and being, both of people and of institutions. The approach proposed by the "Our Common Future" report, published in 1987 by the World Commission on Environment and Development (WCED), and identified as the Brundtland Report, was the first to use the term sustainable development.
This concept was defined as “development that meets the needs of present generations without compromising the ability of future generations to meet their own needs”. Since then, this concept has been incorporated into all United Nations programs and has served as the basis, for example, for the United Nations Conference on Environment and Development (UNCED) (the Earth Summit held in Rio de Janeiro, Brazil in 1992) or the SDGs of the 2030 Agenda [80].
Consequently, in this research study, sustainability is addressed as a holistic concept, considered a cross-cutting element, the challenge of which is to live in harmony, attending to environmental, social and economic variables, and to build a responsible and plural future over time.
In essence, the research aligns the concept of sustainability as a transversal and strategic commitment and includes training and education as an ally. In this way, it is considered an essential aspect to manage a long-term comprehensive action, thus relying on the conviction that sustainability is a shared responsibility of communities and institutions [81].
The concept of sustainable development has evolved, thanks to its recognition in various international conventions, towards the need to integrate the environmental, economic, social and institutional dimensions, consequently acquiring a multidisciplinary meaning. Hence, sustainability does not only attend to environmental issues, but it also proposes general economic and social value in institutions and societies.
In this context, the sustainable development approach arises from the need to generate solution proposals to the impacts generated by capitalist economic systems, with an emphasis on the free market. These systems are based on maximum production, consumption, unlimited and irrational exploitation of resources and profit, as the only criteria for good economic performance.
Currently, society is changing at a frenetic pace, with the appearance of new products and applications, which also impacts the educational sector. Sometimes, this means that the institutions compete to determine which has the best technological innovation in its university students, as a symbol of prestige and power, making management inadequate.
On the other hand, it is well known that technological advances applied in certain research areas (chemistry, engineering, etc.) directly translate into greater scientific production, better financing of research projects or patents, generating strong conditions for competition between institutions. However, these actions should not compromise the survival of organizations and the development of university communities.
In this way, it is important to make responsible use of resources, including technological resources. From the perspective of the quality and excellence of institutions, sustainability aims to increase levels of competitiveness and efficiency, without falling into inappropriate use. In other words, it refers to a commitment to the sustainable development of institutions and communities, considering technology as an innovation tool that can improve the quality of life and the socio-economic progress of society.
The use of AR has been useful in building emerging competences on the use of ICT and the capacity for teamwork. Furthermore, this has allowed the discovery of new immersive teaching resources useful in education settings, which can help the development of new training processes, from an investigative, constructivist and ubiquitous perspective.
Therefore, the lack of sustainability in the use of resources and educational technologies would mean a setback in the use of one of the pillars of progress, created with the aim of promoting human activity. In addition, there would be a blur in the strategy and implementation of ICT, in relation to the needs of present generations. In this sense, the application of technology must be sustainable and responsible to ensure concrete improvement and the involvement of all social actors.
In the context of this research, the sustainability of educational technologies, including AR, is linked to the SDGs of the 2030 Agenda for Sustainable Development, adopted by the United Nations in 2015. Among the 17 SDGs, this research is mainly related to (4) Quality Education, (9) Industry, Innovation and Infrastructure, and (11) Sustainable Cities and Communities.
SDG 4 indicates that education is the foundation for improving people’s lives and sustainable development. Furthermore, access to inclusive and equitable education must help supply the local population with the tools necessary to create innovative solutions to the biggest problems. Therefore, it is necessary to increase efforts to achieve more progress to achieve the goals of universal education [3,40]. In line with this study, quality education is related to the competencies of teachers to offer advanced education and in parallel with the advancement of technology and digital transformation, in order to transfer these improvements globally.
Regarding SDG 9, the growth of the economy linked to sustainable development needs investment in information and communication technologies, to strengthen societies and achieve greater social cohesion. In this way, AR technology contributes to innovation and development, so investment in technological products will facilitate scientific research, communications and diversification at a global level [42].
Regarding SDG 11, education shapes the development of cities, in relation to the flow of ideas, culture, science, productivity and economic and social development. Consequently, the sustainability of AR in the educational context will contribute to cities with greater employment options and resources; that is, the sustainable future must include societies that promote opportunities for the greatest number of people. For all these reasons, technology must provide access to accessible and sustainable systems with special emphasis on the needs of people in vulnerable situations [80,81].

3. Method

3.1. Bibliometric Method

Scientometrics is the scientific and empirical study of science and its results, and also the research field that studies scientific production with the aim of measuring and analysing its evolution and impact. In practice, scientometrics overlaps with other scientific fields, such as bibliometrics, information systems, information science and science policy [82]. It is based on the works of Solla Price and E. Garfield, who created the Institute for Scientific Information (ISI) in 1960. Later, in 1998, they founded the journal Scientometrics, dedicated to the measurement and analysis of scientific production [83,84].
Bibliometrics is a part of scientometrics that applies mathematical and statistical methods to the scientific literature and to the authors that produce it, with the aim of examining and analysing scientific production. The instruments used to measure the aspects of scientific activity are bibliometric indicators, which provide information about the results of scientific activity in any of its manifestations [85]. Since its introduction by E. Garfield in the mid-20th century, bibliometrics has been generalised in scientific research and has contributed for decades to the revision of knowledge in multiple disciplines [86]. Thereby, both types of studies have co-evolved from the reflection on scientific development and the availability of numerous databases for researchers [87].

3.2. Data Collection and Processing

The aim of the present work was to show a view of the general research dynamics regarding the sustainability of educational technologies, focusing on AR in HE. To this end, we conducted a quantitative analysis utilising bibliometrics. The explicit objective of this methodology is to search, identify, organise and analyse the trends of the research theme. In the last decades, bibliometrics has contributed to the revision of scientific knowledge, and it has been used successfully in different scientific fields, such as medicine, engineering, administration, finance, education and biology [88,89,90].
Based on the reviewed literature of the study topic, mainly in Table 1, the terms chosen in the search string were “augmented reality”, “sustainability”, “management”, “higher education”, “education”, “teaching”, “learning” and “training”.
The choice of this database was due to the fact that, when performing the first search in the Web of Science (WoS) and Scopus databases, there was a significant difference in the volume of articles in the analysed period 2005–2019; that is, WoS contained 635 articles and Scopus contained 1977 articles.
Furthermore, Scopus has greater advantages over other databases, such as WoS or Google Scholar, among which are (i) it is considered the largest repository of peer-reviewed literature; (ii) it minimises the risk of losing documents during the search; (iii) it is easily accessible and offers some tools for data visualisation and analysis, in addition to presenting the option of downloading content in different formats; and (iv) it presents a variety of data.
The process followed in the selection of the sample conforms to the flowchart of Figure 3, according to the Preferred Reporting Items for Systematic Reviews and Meta-Analyses (PRISMA) [91].
Thereby, in phase 1 (identification), 42,058 records were identified from the Scopus database, considering all the fields for each of the search key terms (augmented reality, sustainability, management, higher education, education, teaching, learning and training), all types of documents and all the data in the data range (all years—April 2020).
In the following phase 2 (screening), the option of “article title, abstract and keywords” was chosen in the field of each term, so that 33,664 records were excluded.
Then, in phase 3 (eligibility), only the articles were selected as the type of document, to guarantee the quality derived from the peer review process. In this phase, 6178 documents were excluded, so that it had 2216 records.
Regarding the period covered by this research, initially, a first search was carried out with the key terms from the revised documents in Table 1. A total of 2216 articles were obtained for the period 1997—April 2020, that is, from the publication of the first article on this subject (1997) until the last full year (2019). Likewise, in the 2005 Horizon Report [92] on challenges, trends and technologies in university education—an event carried out with the joint collaboration of the New Media Consortium and EDUCAUSE Learning Initiative—emerging technologies and use in teaching, learning and creative inquiry, where AR was highlighted, were examined. For this reason, this study adjusted the time horizon of analysis to the period from 2005 to 2019, both included.
For these reasons, in the last phase (included), 239 documents were excluded, so that the final sample included 1977 articles.
Essentially, the search selected records from subfields title, abstract and keywords, in the period that contains the last 16 years, in the same way that it has been successfully applied in several studies that have used bibliometric methodology [93,94].
The representation of this sample of documents is supported by the proven quality of the Scopus database, regarding the indexing protocol, in addition to the systematic procedures of the search criteria.
The method used consisted in performing a complete search of the Scopus database, using a search string with the terms that make up this research: “augmented reality”, “sustainability”, “management”, “higher education”, “education”, “teaching”, “learning” and “training”. The aim was to examine the subthemes of the title, abstract and keywords in a period of 15 years, that is, from 2005 to 2019, as is described in previous bibliometric works [93,94]. The sample of articles analysed was obtained from a search conducted in April 2020, which only included scientific articles, both open access and non-open access. The final sample included a total of 1977 documents. The variables analysed were the year of publication, thematic area, journal, author, author’s country of affiliation, institution where the author is affiliated and the keywords that define the publication.
In this study, the indicators of scientific production were both the distribution of the analysed documents by year of publication and the productivity of the authors, countries and institutions. The indicators of quality used, which refer to the impact of the different agents of this research area, were the h-index, the total number of citations, the quality of scientific journals included Scopus database (SCImago Journal Rank, SJR, 2018) and the quartile (Q) of the journal [95,96].
Similarly, the indicators of the structure of collaboration, which measure the links between authors and countries, were analysed by processing tools and network maps due to their reliability and suitability in bibliometric analyses [97,98]. Therefore, the software tool VOSviewer (v1.6.15, University of Leiden, Leiden, Netherlands) was used for the mapping, enabling the processing of keywords and the grouping analysis, with the aim of visualising maps by co-authorship and co-occurrence [99]. Moreover, VOSviewer revealed the indicators of collaborative structure, which measure the network links among authors, institutions and countries, as well as the identification of research trends based on the use of keywords [100].
In this way, the obtained results are useful to researchers, academics, analysts, managers of higher education institutions and stakeholders, since they provide evaluative information about scientific activity in this field of research.

4. Results and Discussion

4.1. Evolution of Scientific Activity

Table 2 shows the evolution of the main characteristics of articles about the sustainability of educational technologies with a focus on AR in HE from 2005 to 2019. In this period, the interest in this research topic increased, especially in the last 6 years, as can be observed in the analysed variables. Thence, in the first period studied (2005–2007), only 47 articles on this topic were published, whereas in the last three years (2017–2019) the number increased to 1119 articles, that is, practically 24 times more publications. The increase in the number of publications was especially pronounced in this last triennium, during which 56.50% of all the articles of the studied period were published. The year with the largest number of publications was 2019, with 528 articles on the study topic.
Regarding the research topics where the articles published in the Scopus database are classified, it is noteworthy that computer science occupied the first position in all the periods analysed (2005–2019). Engineering, for its part, ranked second in four of the five triennia examined, that is, except in 2014–2016. Meanwhile, social sciences was among the three main subject areas, except in the second triennium (2008–2010), in which the subject area of medicine occupied the third position. It is important to note that one article can be classified in more than one category, which will depend on the publisher and the author. This is represented in the last column of Table 2, where the three main thematic areas listed in the articles published in each triennium are listed in order.
Figure 4 shows the evolution of the number of articles and its percentage of variation between each of the examined triennia. In addition to the considerable increase in the number of articles published in the last six years, there was a remarkable percentage growth in the second (2008–2010) and third (2011–2013) periods analysed. The percentage growth in the number of publications in 2008–2010 was due to the fact that it was the first triennium in which the number of articles exceeded 100 (105), whereas 2013 was the first year with over 100 articles (117).
Similarly, the total number of authors also increased in the last six years (2014–2019), representing 79.73% of all authors, that is, 6846 authors. There were 163 authors were registered in the period 2005–2007, in the last period examined, 2017–2019, the number increased to 3843 authors. This increase was like that experienced by the number of articles published, and the average number of authors per article has remained practically constant throughout the period analysed. In the first triennium (2005–2007), the average number of authors per article was 3.5, and in the last period, it was almost 3.4.
The number of journals where articles about the sustainability of AR in HE was published increased from 43 in the first triennium to 743 in the last triennium. The growth became more intense in the second, third and last triennium. The period of 2017–2019 included 51.67% of all the journals that published studies on this topic.
Likewise, the number of countries involved in the publication of articles about the sustainability of AR in HE increased from 31 in the first triennium to 182 in the last triennium, which is 37.22% of the countries that have contributed to this research field.
The number of citations per analysed triennium also increased, from 2236 in the first triennium (2005–2007) to 7399 in the fourth triennium (2014–2016). The last period included a total of 4271 citations, which will increase with the citations from the articles that will be published in the following years. The average annual number of citations per article has decreased from 47.57 in the first subperiod of three years to 16.26 and 3.82 in the fourth and last triennia, respectively. This is mainly related to the fact that the theoretical and conceptual base articles about the sustainability of AR in HE were published in the first years of the studied period, whereas in the following periods the contributions were mostly oriented to the analysis of particular cases [101,102,103].
Lastly, the number of references increased throughout the entire period, with peaks in the third subperiod (2011–2013) and in the last three years (2017–2019). On that account, the total number of references in 2005–2007 was 1530, whereas in 2017–2019 it was 34,662. The average number of references per article decreased from 32.55 to 30.98.

4.2. Distribution of Publications per Thematic Area and Journal

For the analysed period (2005–2019), the published articles about the sustainability of AR in HE were found in different categories. According to the classification of the Scopus database, the 1977 articles analysed in the present study fall within a total of 28 thematic areas. As mentioned above, an article can be classified in more than one category, depending on the interest of the author and the editorial.
Figure 5 shows the evolution of the thematic classification of the articles on the sustainability of AR in HE between 2005 and 2019. The category of computer science stands out for the entire period, with 27% of the published articles on the study topic, followed by social sciences and engineering, with 19% each one. Medicine (6%); mathematics (4%); business, management and accounting (3%); and arts and humanities (3%) were the following categories, ordered by relevance. The seven most important categories displayed in Figure 5 represent 80% of the published documents on this research field for the 15-year period analysed. The rest of the thematic areas were below 3% of the published works.
The association of the publications in this research field with the categories of computer science and social sciences is logical, since the present study addresses the tendencies of the contributions related to the sustainability of AR and its link to HE in terms of generating quality and sustainable education along with technological advancements [104,105].
Table 3 shows the characteristics of the articles of the main journals in the publications about the sustainability of AR in HE. In the selection of the 10 journals with the largest number of articles on this research topic, most of them (70%) belonged to the first quartile (Q1) of the SJR index of 2018. Over the years, this research topic has gained an increasing number of journals and authors, as is reflected by the increase in the number of published articles and the variety of interested journals.
In terms of countries, among the 10 most important journals in the publication of this research topic, European journals stand out: the United Kingdom (four), Netherlands (two), Germany (one), and Switzerland (one).
The journal with the largest number of articles about the sustainability of AR in HE was Computers and Education, with 35 publications. Moreover, this journal has maintained the first position of the ranking for the last three of the five analysed periods. It also stands out for concentrating great interest among academics and researchers, with the largest number of citations (3239), and the largest average number of citations per published article (92.54). Furthermore, it is the journal with the highest h-index for articles about this research topic (27), although this is quite far from the general h-index of this journal (149). It is also the one with the greatest SJR: 2.32(Q1), followed by Computers in Human Behavior, with 1.71(Q1), and Automation in Construction, with 1.41(Q1). However, the journal with the longest period of publications on this research topic in this ranking, i.e., 2006–2019, was Virtual Reality, and, 2009–2019, were Computers and Education, IEEE Transactions on Visualization and Computer Graphics.
Regarding the link to the thematic areas (TAs) of the articles published in the 10 most productive journals in this research topic, it is noteworthy that in several of them, the articles are also associated with more than one thematic area. These are the cases of Computers and Education (computer science and social sciences), Interactive Learning Environments (computer science and social sciences), Multimedia Tools and Applications (computer science and engineering), International Journal of Emerging Technologies in Learning (engineering and social sciences), Eurasia Journal of Mathematics Science and Technology Education (mathematics and social sciences), Applied Sciences (chemical engineering and computer science), and Computers in Human Behavior (arts and humanities, computer science, psychology). It is also worth mentioning that in 70% of the journals in this ranking, the articles were mainly associated with computer science.

4.3. Productivity of Authors, Institutions and Countries

Table 4 presents the main variables of the articles of the 10 most productive authors in the publication of articles about the sustainability of AR in HE for the analysed period 2005–2019.
The authors with the largest number of publications on this research topic were Nee and Ong, both affiliated to the National University of Singapore, with 16 documents each, followed by Billinghurst (University of South Australia), Navab (Technische Universität München and Johns Hopkins University) and Wang (Curtin University), with nine contributions each.
However, the author with the largest number of citations related to the sustainability of AR in HE was Wang, of Curtin University (Australia), with a total of 499 citations, thus being also the author with the largest average number of citations per article (55.44). Hwang, of the National Taiwan University of Science and Technology (Taiwan), is in the second position, with 348 citations and an average of 43.50 citations per article.
The highest h-index (11) corresponded to Nee and Ong, both from the National University of Singapore, who published their first article on this topic in 2006. It is worth highlighting that six of the 10 most prolific authors in the publication of articles on this research theme are from Asia: Taiwan (4) and Singapore (2). Of the other four authors, two were European (Germany and Spain) and two were Australian. Likewise, eight authors published their last article in 2019, which indicates the importance of and interest in this research topic [106,107,108].
Likewise, the main thematic area (TA) associated with the work of each of the most productive authors was identified, which reflect the motivations in the scientific field and the inclinations of the journals for the publication of these lines of research. Five authors published their articles on this research topic in the computer sciences subject area (Billinghurst, M.; Chen, C.H.; Juan, M.C.; Hsiao, K.F. and Huang, T.C.), three in engineering (Nee, A.Y.C.; Ong, S.K. and Wang, X.) and the other two in medicine (Navab, N.) and social sciences (Hwang, G.J.).
Figure 6 shows the collaboration map among the main authors who have published articles about this topic, based on co-authorship. The different colours represent the different clusters constituted by the work groups in the production of articles, and the circle size varies as a function of the number of articles of each author. The main authors are grouped into seven clusters.
Cluster 1 (red) presents the collaboration of Abolmaesumi, Ahmed, Bai, Bergig, Billinghurst, Bordegoni, Callaghan, Chai, Chang, Chen, Cheok, Choi, Diao, Ferrise, Hagbi, Gao, Guan, He, Hou, Kang, Kloos, Li and Zuo, among others. Cluster 2 (green) includes Cha, Endo, Gill, Harders, Hong, Hyun, Izadi, Shin, Rho, Tian, Urata and Yoo, among others. Cluster 3 (pink) is formed by Cai, Duh, Dong, Hsieh, Chiang, Kao, Lee, Lu, Peng, Sun and Tsai. Cluster 4 (yellow) shows the collaboration of Batdi, Fan, Hu, Jia, Keshav, Yuan and Zhu. Cluster 5 (violet) is constituted by Abele, Bork, Diotte, Eck, Euler, Maier, Ma, Kato, Khan, Navab, Orlosky, Sandor, Ong and Sahin. Cluster 6 (blue) includes Chemlal, Gan, Liew, Ng, Xiao, Tee and Wu, among others. Lastly, cluster 7 (orange) is formed by Anderson, Lee, Park, Yoon, Elinich, and Lin. The grouping based on co-authorship indicates a wide variety, with an outstanding Asian authorship in line with the affiliations of these authors [109,110].
Table 5 presents the 10 most productive institutions in the publication of articles related to the sustainability of AR in HE for the analysed period. Taiwan and Spain, with five institutions each, were the countries with a greater presence in this ranking. Among these institutions, the National Taiwan University of Science and Technology (Taiwan) was in the first position, with 25 articles and 1417 citations. Moreover, this institution had the largest average number of articles per year (56.68) and the highest h-index (15).
Furthermore, it is also worth highlighting that nine of the 10 most productive institutions contributed to this research topic in 2019, which confirms the interest in the sustainability of AR in university education [111,112]. In addition to this, except for the National University of Singapore (Singapore) and the Technical University of Munich (Germany), which published their first articles on this topic in 2006, and the National Cheng Kung University (Taiwan), in 2009, the rest of the institutions in this ranking made their first contribution in the last decade. This confirms the evolution of this research area, since numerous institutions have joined the contribution of publications on the development of this technology and its link with teaching and learning in the university context [32,113,114].
Regarding the link to the thematic areas (TAs) of the articles published by the 10 most prolific institutions, in five they are associated with computer science and four with social sciences, while only one is associated with engineering.
Table 6 gathers the main variables of the countries with greater scientific production in the sustainability of AR in HE for the period of 2005–2019. Firstly, the United States appears in the first position, with a total of 358 articles, the largest total number of citations (6583), that is, an average of 18.39 citations per article on this research topic, and the highest h-index (41). It was also the country with the largest number of published articles in each of the analysed triennia, with 12 in the first subperiod (2005–2007) and 194 in the last subperiod (2017–2019), which demonstrates its research power. The second country with the largest number of articles was Spain, with a total of 195, also showing the second largest total number of citations (3361) and the third-highest h-index (27). These two countries are followed by Taiwan (175), China (138) and South Korea (124). This indicates the interest of the American and Spanish publications about the sustainability of AR in HE [115,116].
At the global level, 50% of the contributions about the sustainability of AR in university education, that is, 982 articles, were published by five countries: United States, Spain, Taiwan, China and South Korea. The remaining five countries (United Kingdom, Italy, Germany, Australia and Malaysia) promoted 23% of the articles on this topic. Among these, only the United Kingdom (120) and Italy (100) exceeded 100 publications for this period.
It is also important to highlight that, of this second group of countries, the United Kingdom, despite being in the sixth position in the number of published articles (120), had the fourth-largest number of citations (2098), the third-largest average number of citations per article (17.48), and the fourth-highest h-index (23).
Regarding the link to the thematic areas (TAs) of the articles published by the most prolific countries, it is noteworthy that 80% are associated with computer science, except Spain, which does so with social sciences, and Malaysia, with engineering, in the same line as Figure 5.
Table 7 shows the international collaboration in the 10 most productive countries. The country with the highest collaboration in its contributions was the United States (37) with, mainly, the United Kingdom, China, Germany, Canada and Australia, followed by Spain, with 29 collaborating countries, among which Colombia, Italy, Germany, the United Kingdom and Venezuela stand out.
Interestingly, among the 10 countries with greater international collaboration in the analysed period, except for the United States and Australia, four were European (Spain, the United Kingdom, Italy and Germany) and four were Asian (Taiwan, China, South Korea and Malaysia).
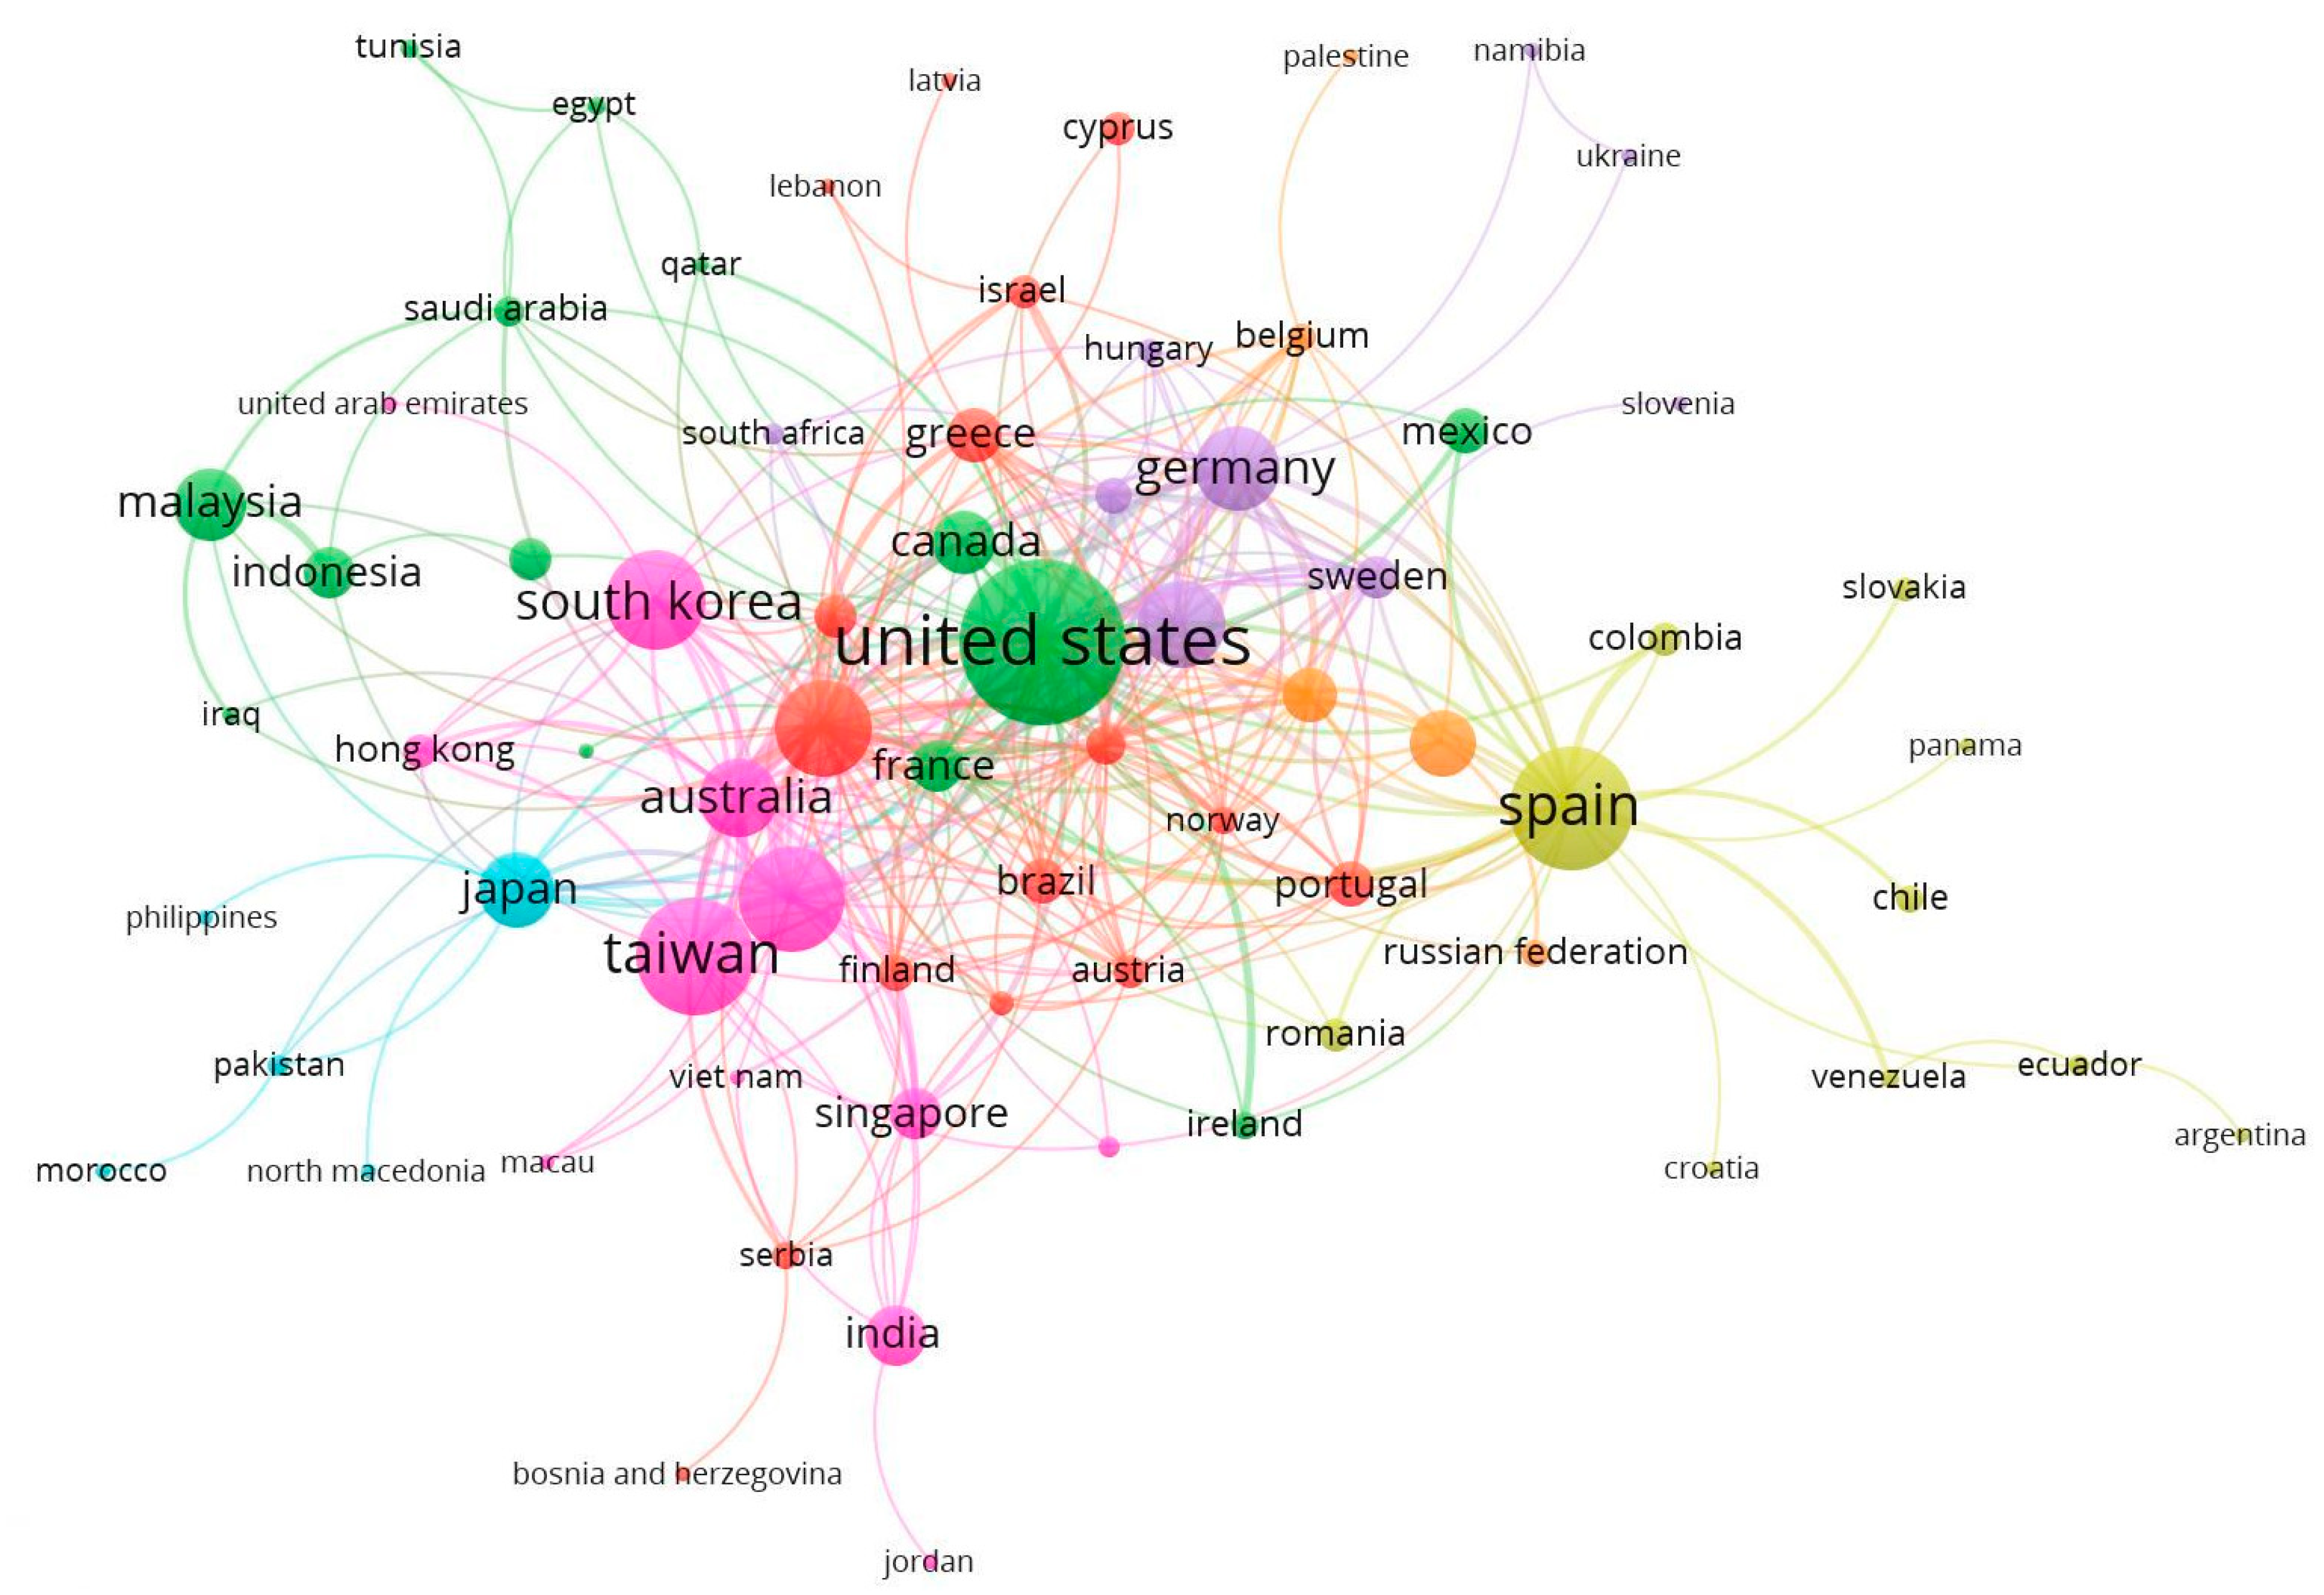
Figure 7 shows a collaboration map between the main countries based on the co-authorship method. The different colours represent the different clusters formed by the groups of countries, whereas the circle size varies depending on the number of articles of each country. Hence, the larger the circle of a country, the larger the number of articles whose authorship it represents. The countries were grouped into seven clusters.
Cluster 1 (red), the largest one, is led by the United Kingdom, which associates with Austria, Bosnia and Herzegovina, Brazil, Cyprus, Denmark, Finland, Greece, Israel, Latvia, Lebanon, New Zealand, Norway, Portugal, Serbia and Switzerland. Cluster 2 (green), led by the United States, is also constituted by Algeria, Canada, Egypt, France, Indonesia, Iraq, Ireland, Malaysia, Mexico, Qatar, Saudi Arabia, Thailand and Tunisia. Cluster 3 (pink) is headed by Taiwan and includes Australia, China, the Czech Republic, Hong Kong, India, Jordan, Macau, Singapore, South Korea, the United Arab Emirates and Vietnam. Cluster 4 (yellow) is led by Spain and includes Argentina, Chile, Colombia, Croatia, Ecuador, Panama, Romania, Slovakia and Venezuela. Cluster 5 (violet) is headed by Germany, which associates with Hungary, Italy, Namibia, Poland, Slovenia, South Africa, Sweden and Ukraine. Cluster 6 (blue) is led by Japan and includes Morocco, North Macedonia, Pakistan and the Philippines. Lastly, cluster 7 (orange) is headed by Turkey and is also constituted by Belgium, Netherlands, Palestine and the Russian Federation.

4.4. Keyword Analysis

Table 8 gathers the 10 keywords which most frequently appeared in the 1977 analysed articles about the sustainability of AR in HE for the period of 2005–2019. It shows the ratio for the entire 15-year period and for the different three-year subperiods.
The term “augmented reality” is in the first position, appearing in 1490 documents, which is 75.4% of the total number of articles that make up the sample of this study. “Virtual reality” is in the second position, appearing in 461 documents (23.3%). Except for the first period (2005–2007), in which the first position was occupied by “virtual reality”, the most popular term in each of the analysed triennia was “augmented reality”. As was observed in the revised literature, numerous articles are focused on analysing the differences, similarities and characteristics of these two technologies from multiple approaches [63,64,117,118]. The following three, and fifth and tenth positions were occupied by terms related to the teaching–learning process of HE, which are, in order of relevance: “education” (245 articles, 12.4%), “teaching” (149, 7.6%), “learning” (100, 5.0%), “e-learning” (92, 4.7%) and “mobile learning” (77, 3.9%). This result shows the interest of the scientific and academic community in the holistic analysis of the link between technology and education [119,120]. The other terms were related to technology: “user-computer interface” (93, 4.7%), “computer simulation” (85, 4.3%) and “visualization” (82, 4.1%). These keywords corroborate the inclusion of AR in the processes of HE in relation to the new educational methodologies involved [17,121,122].
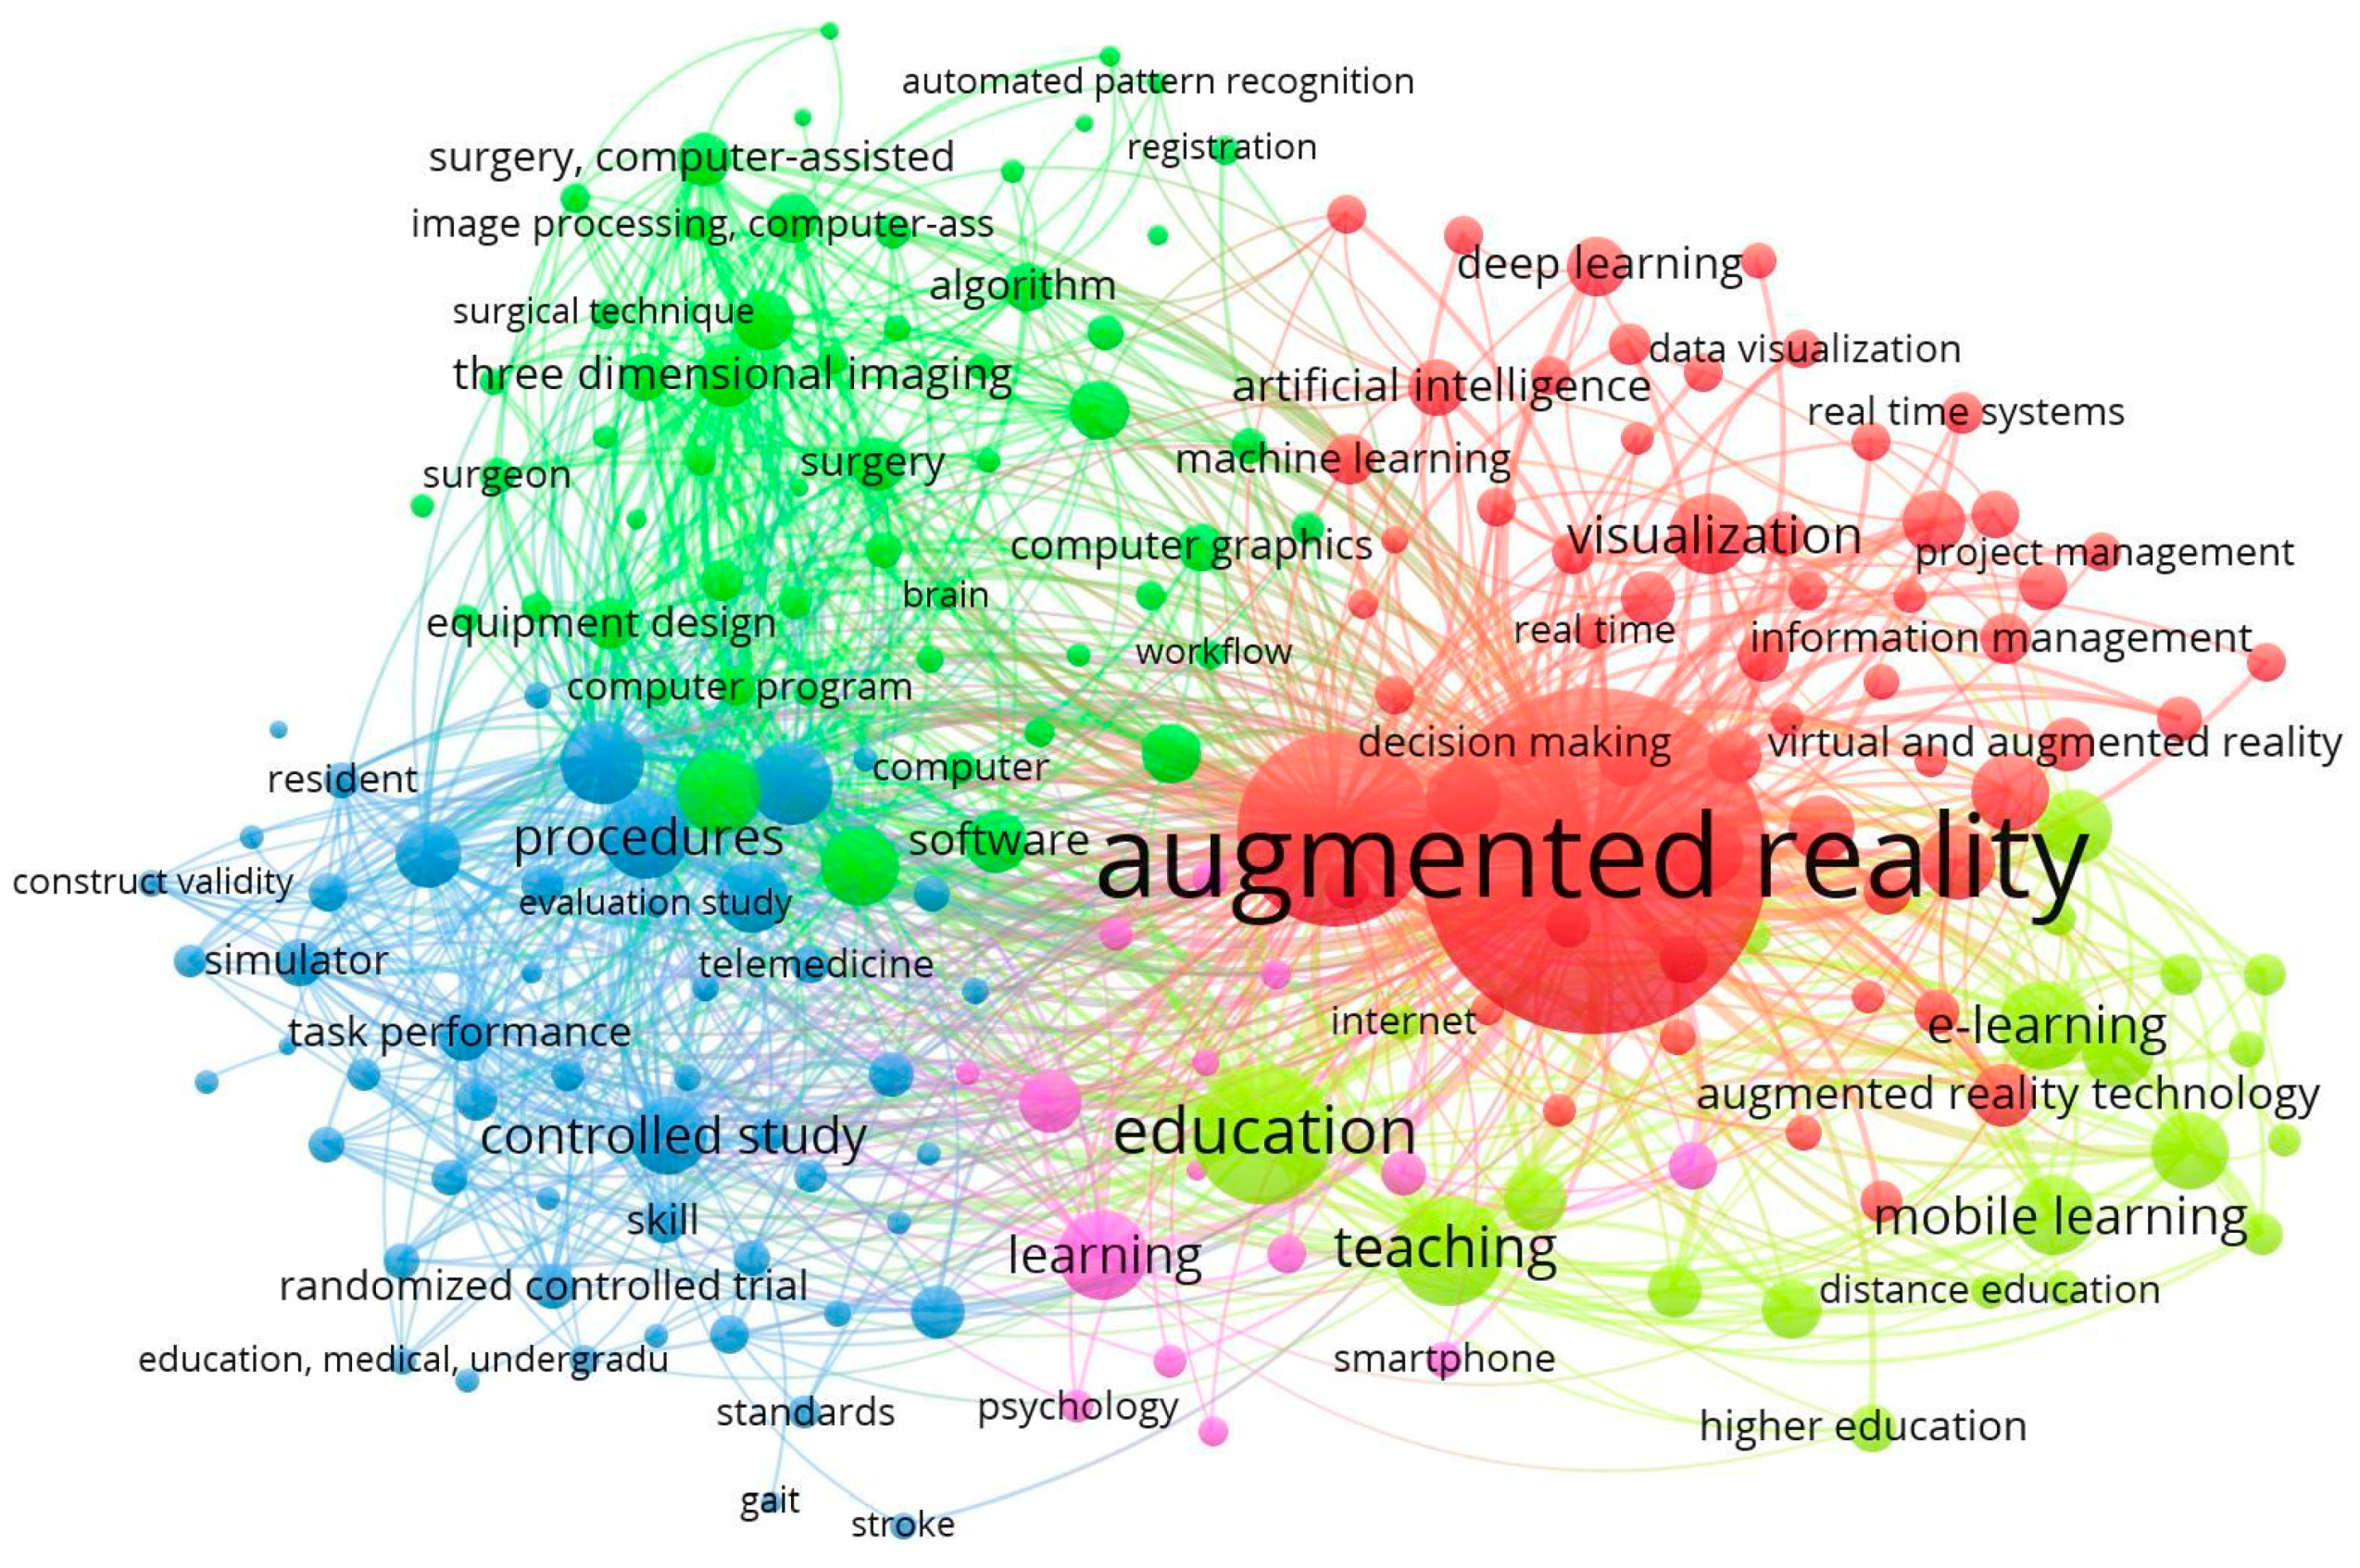
Figure 8 shows the network map for the keywords of the articles about the sustainability of AR in HE for the period of 2005–2019. The colour of the nodes differentiates the groups according to the number of co-occurrences, whereas their size varies depending on the number of repetitions. In consequence, some research lines developed by the different communities were detected. Five main research lines can be distinguished, which are grouped under the following terms: “augmented reality”, “computer”, “simulation”, “education” and “learning”.
The first research line, associated with the term “augmented reality” (red), includes keywords such as “architectural design”, “artificial intelligence”, “cloud computing”, “communication”, “computer aided design”, “computer vision”, “data visualization”, “decision making”, “deep learning”, “design”, “display devices”, “flow visualization”, “gesture recognition”, “image enhancement”, “information management”, “information technology”, “learning algorithms”, “machine learning”, “maintenance”, “mobile augmented reality”, “mobile computing”, “navigation”, “neural networks”, “object recognition”, “problem solving”, “product design”, “real time”, “project management”, “real time system”, “user experience”, “user interfaces”, “virtual reality”, “virtual and augmented reality” and “visualization”.
The second research line, associated with the term “computer” (green), includes keywords such as “algorithm”, “automation”, “brain”, “camera”, “computer graphics”, “computer interface”, “computer program”, “computer system”, “depth perception”, “equipment design”, “image analysis”, “image display”, “image processing”, “image quality”, “in vivo study”, “learning algorithm”, “nonhuman”, “professional competences”, “signal processing”, “sensitivity and specificity”, “software”, “spine”, “treatment planning”, “user-computer interface”, “video recording” and “workflow”.
The third research line, related to the term “simulation” (blue), associates keywords such as “audiovisual equipment”, “computer simulation”, “construct validity”, “education, medical”, “evaluation study”, “feasibility study”, “feedback, sensory”, “gait”, “google glass”, “internship and residency”, “learning curve”, “manikin, “motion”, “motor performance”, “outcome assessment”, “performance”, “pilot projects”, “pilot study”, “priority journal”, “residency education”, “scoring system”, “sensor”, “sensory feedback”, “simulation training”, “simulator”, “skill”, “stroke”, “time factors”, “validation study” and “visual feedback”.
The fourth research line, led by the term “education” (yellow), includes keywords such as “computer aided instruct”, “distance education”, “e-learning”, “education computing”, “educational technology”, “higher education”, “innovation”, “internet”, “laboratories”, “learning environments”, “learning experiences”, “learning performance”, “learning systems”, “mobile learning”, “motivation”, “multimedia systems”, “teaching” and “technology”.
Lastly, the fifth research line, headed by the term “learning” (pink), is associated with “cognition”, “human experiment”, “information processing”, “mobile application”, “mobile phone”, “perception”, “psychology”, “smartphone”, “video game”, “vision” and “visual perception”.
These five research lines gather all the concepts related to the sustainability of AR in HE, since this includes different aspects related to technologies [123], their applications in different economic sectors [124,125], the application in HE [126,127], and the application of technologies in the education sector [128,129].
As an additional advantage, it was observed that research in this topic has advanced at the global level, with the addition of other concepts and strategies related to technologies, education, and educational management, such as “knowledge management”, “augmented virtuality”, “virtuality continuum”, “interactive learning environment”, “mixed reality”, “internet of things” (IoT), “ubiquitous computing”, “ubicomp”, “pervasive computing”, “ambient intelligence”, “calm technology”, “things that think”, “immersive technology”, “everyware”, “wearable computing”, “tactile feedback”, “robotics” and “image segmentation”.
Figure 9 shows the maturity, or development, of each cluster, differentiating the period in which they were studied during the last decade, that is, from 2010 to 2019. Therefore, the blue and green clusters belong mainly to the period of 2010–2015, whereas the red, yellow and pink clusters have keywords mostly associated with the period of 2015–2018 and other keywords that appeared more recently. In the latter clusters, there are keywords associated with the last year and related to the effect of this technology on the management of learning, such as “project management”, “deep learning” and “mobile learning”. This analysis allows for understanding the importance of keywords based on the time of appearance, since the most pioneering keywords are more influential and will be a reference for the more recent ones. Consequently, the presence of five different clusters allows us to deduce that the sustainability of educational technologies and AR in HE includes different lines of research.
This demonstrates that institutions of HE are working on education for a sustainable development that guarantees quality teaching, since, according to the SDGs, education is one of the most effective instruments to induce the necessary changes with the aim of achieving sustainable development [81,130,131,132].
A maturity is observed in the development of the research topic that has led to an increase in the number of contributions in relation to sustainable policies on AR in the educational context. Likewise, there is an evolution in terminology that is accompanied by the emergence of new lines of research, such as those that are linked, among others, with knowledge management, interactive learning environment, ubiquitous computing, immersive technology, wearable computing, tactile feedback or robotics [28,30,32,37].

5. Conclusions

The aim of this study was to analyse the research trends on the sustainability of educational technologies with a focus on AR in HE at the global level in the last 15 years (2005–2019). To this end, a bibliometric analysis was conducted with 1977 articles obtained from the Scopus database, identifying the most productive thematic areas, journals, authors, institutions and countries in the publications of this research field.
The number of scientific articles per year for the analysed period increased especially in the last three years, with the publication of 1119 articles, which represent 56.60% of the total contributions on this research topic.
Five thematic axes on which the research is based to date have been detected. These lines of research focus on the main characteristics and contributions of AR. Two other lines analyse the approach of this tool in the educational context, such as the axis of education and learning. On the other hand, the other two thematic axes focus on the technical analysis of this set of technologies that allow the student to visualise the real world with added graphic information on a technological device.
Likewise, it has been observed that most of the scientific production is associated with the categories of computer science, social sciences and engineering. Thus, the thematic axes related to AR, computer and simulation are associated with the areas of computer science and engineering, while the research lines of education and learning are with social sciences.
AR has been applied mainly in HE settings and compulsory levels of education, as a resource to motivate students. For this reason, this work is relevant since it allows us to know, in addition to the evolution of scientific production on the sustainability of educational technologies and AR in HE, which are the subject areas where it has been most applied and to detect the academic degrees that have obtained the best results with the use of this technology. In this way, the contribution of this study is aimed at offering university teachers a more direct way to inquire and explore how this resource is applied among their students.
For its part, this study allowed us to deduce studies on the impact of AR at different educational levels, which is a contribution to the advancement of science. Furthermore, from the main objective, AR has become during this period a tool that, together with an adequate educational methodology, allows explaining the content of a topic of interest, providing additional information that favours student learning. In this sense, the research points to the application of AR in educational games and laboratory experiments as growing research topics.
This research highlighted the sustainability of educational technologies and AR in HE, in an interactive and participatory context. In addition, the literature reviewed highlighted among its AR limitations in the education sector, its consideration of intrusive technology. Likewise, it indicated that the use of AR favours more motivating and interactive activities for students, in addition to promoting a more sustainable, equitable and equal education.
The future research lines in this topic will be focused on analysing the AR environments in contexts of learning, communication and HE management, the application of AR in language learning and designing evaluation programmes for the initial training of faculty members. Furthermore, it is also important to develop contributions that support the mobile applications of AR for the services of university libraries, to introduce new students to the campus, to improve the relationship between AR and inclusive education in HE and to connect m-learning and AR with the aim of optimising the performance and motivation of students in HE. Consequently, these are the new challenges that must be studied to further develop the sustainability of educational technologies and AR in HE.
In this sense, other research studies must also be addressed regarding the evolution of the terminology and of the technological advances, highlighting the ones related to augmented virtuality, ubiquitous computing, pervasive computing, virtuality continuum, ambient intelligence or wearable computing. In addition, these could focus on the analysis of the sustainability of educational technologies and AR in the cognitive, inclusive and emotional processes of the students, as a sustainable tool in line with the targets of the SDGs. Finally, it was observed that the trends of the research on the sustainability of educational technologies and AR in HE at the global level have followed an upward tendency, with optimal indices of publication in the last years.

Author Contributions

Conceptualization, methodology, software, formal analysis, investigation, resources, data curation and writing—original draft preparation, E.A.-S. and M.-D.G.-Z.; validation, writing—review and editing, visualization, supervision, project administration, E.A.-S., M.-D.G.-Z., A.L.-d.l.R., and M.B.M.C.; funding acquisition, A.L.-d.l.R. All authors have read and agreed to the published version of the manuscript.

Funding

This research received no external funding.

Conflicts of Interest

The authors declare no conflict of interest.

References

  1. Vázquez-Cano, E.; León Urrutia, M.; Parra-González, M.E.; López Meneses, E. Analysis of 454 Interpersonal Competences in the Use of ICT in the Spanish University Context. Sustainability 2020, 12, 476. [Google Scholar] [CrossRef] [Green Version]
  2. Veretekhina, S.V.; Novikova, V.A. Transformation of Education in the Digital Economy. Contemp. Probl. Soc. Work 2019, 5, 30–37. [Google Scholar] [CrossRef]
  3. Tereliansky, P.V.; Kuznetsov, N.V.; Ekimova, K.V.; Lukyanov, S.A. Transformation of education in the digital age. Univ. Manag. Pract. Anal. 2019, 22, 36–43. [Google Scholar] [CrossRef] [Green Version]
  4. Huang, J.; Karduck, A. A Methodology for Digital Government Transformation. J. Econ. Bus. Manag. 2017, 5, 246–254. [Google Scholar] [CrossRef]
  5. Bacca Acosta, J.L.; Baldiris Navarro, S.M.; Fabregat Gesa, R.; Kinshuk, K. Framework for designing motivational augmented reality applications in vocational education and training. Australas. J. Educ. Technol. 2019, 35. [Google Scholar] [CrossRef]
  6. Durall, E.; Gros, B.; Maina, M.; Johnson, L.; Adams, S. Perspectivas Tecnológicas: Educación Superior en Iberoamérica 2012–2017; The New Media Consortium: Austin, TX, USA, 2012; Available online: http://openaccess.uoc.edu/webapps/o2/handle/10609/17021 (accessed on 28 February 2020).
  7. Johnson, L.; Adams, S.; Cummins, M.; Estrada, V.; Freeman, A.; Hall, C. NMC Horizon Report: Edición Superior de Educación 2016; The New Media Consortium: Austin, TX, USA, 2016; Available online: http://www.aprendevirtual.org/centro-documentacion-pdf/2016-nmc-horizon-report-HE-ES.pdf (accessed on 5 March 2020).
  8. Cabero-Almenara, J.; García, F.; Barroso, J. La producción de objetos de aprendizaje en “Realidad Aumentada”: La experiencia del SAV de la Universidad de Sevilla. IJERI Int. J. Educ. Res. Innov. 2016, 6, 110–123. [Google Scholar]
  9. Alkhattabi, M. Augmented reality as E-learning tool in primary schools’ education: Barriers to teachers’ adoption. Int. J. Emerg. Technol. Learn. 2017, 12, 91–100. [Google Scholar] [CrossRef] [Green Version]
  10. Cabero-Almenara, J.; Barroso-Osuna, J.; Llorente-Cejudo, C.; Fernández-Martínez, M.M. Educational Uses of Augmented Reality (AR): Experiences in Educational Science. Sustainability 2019, 11, 4990. [Google Scholar] [CrossRef] [Green Version]
  11. Blas-Padilla, D.; Vázquez-Cano, E.; Morales-Cevallos, M.B.; López-Meneses, E. Uso de apps de realidad aumentada en las aulas universitarias. Campus Virtuales 2019, 8, 37–48. Available online: http://uajournals.com/ojs/index.php/campusvirtuales/article/view/379 (accessed on 10 May 2020).
  12. Dube, T.J.; İnce, G. A Novel Interface for Generating Choreography Based on Augmented Reality. Int. J. Hum. Comput. Stud. 2019, 132, 12–24. [Google Scholar] [CrossRef]
  13. Edwards, C. Better than reality? [augmented reality]. Eng. Technol. 2013, 8, 28–31. [Google Scholar] [CrossRef]
  14. Park, K.D.; Chung, J.H. A study on the Image Augmented Reality Card using Augmented Reality. J. Digit. Converg. 2014, 12, 467–474. [Google Scholar] [CrossRef]
  15. Wong, E.Y.; Kwong, T.; Pegrum, M. Learning on mobile augmented reality trails of integrity and ethics. Res. Pract. Technol. Enhanc. Learn. 2018, 13, 22. [Google Scholar] [CrossRef] [PubMed]
  16. Kun, A.L.; Meulen, H.; van der Janssen, C.P. Calling while Driving Using Augmented Reality: Blessing or Curse? PRESENCE Virtual Augment. Real. 2019, 27, 1–14. [Google Scholar] [CrossRef] [Green Version]
  17. Liberati, N. Augmented reality and ubiquitous computing: The hidden potentialities of augmented reality. AI Soc. 2014, 31, 17–28. [Google Scholar] [CrossRef]
  18. Liarokapis, F. An augmented reality interface for visualizing and interacting with virtual content. Virtual Real. 2006, 11, 23–43. [Google Scholar] [CrossRef]
  19. Du Toit, J.; Verhoef, A.H. Embodied digital technology and transformation in higher education. Transform. High. Educ. 2018, 3. [Google Scholar] [CrossRef]
  20. Veretekhina, S.V.; Krapivka, S.A.; Kireeva, O. Digital University, Student’s Digital Footprint, Digital Education Currency in the System of Modern Higher Education. Int. J. Psychosoc. Rehabil. 2020, 24, 1878–1889. [Google Scholar] [CrossRef]
  21. Müller, A.; Parzych, D. Determinants of Entrepreneurial Intentions at Universities. Warsaw University of Technology Case. Probl. Zarz. 2019, 16, 11–26. [Google Scholar] [CrossRef]
  22. Szewczyk, P. Application of Blockchain Technology in Supply Chain Management. Scientific Papers of Silesian University of Technology. Organ. Manag. Ser. 2019, 2019, 591–600. [Google Scholar] [CrossRef]
  23. Feiner, S.; Macintyre, B.; Seligmann, D. Knowledge-based augmented reality. Commun. ACM 1993, 36, 53–62. [Google Scholar] [CrossRef]
  24. Bajura, M.; Neumann, U. Dynamic registration correction in video-based augmented reality systems. IEEE Comput. Graph. Appl. 1995, 15, 52–60. [Google Scholar] [CrossRef] [Green Version]
  25. Carmigniani, J.; Furht, B. Augmented reality: An overview. In Handbook of Augmented Reality; Springer: New York, NY, USA, 2011; pp. 3–46. [Google Scholar] [CrossRef]
  26. Ling, H. Augmented Reality in Reality. IEEE Multimed. 2017, 24, 10–15. [Google Scholar] [CrossRef]
  27. Wang, X. Augmented Reality: A new way of augmented learning. eLearn 2012, 2012, 1. [Google Scholar] [CrossRef]
  28. Squires, D.R. Immersive Learning Experiences: Technology Enhanced Instruction, Adaptive Learning, Augmented Reality, and M-Learning in Informal Learning Environments. i-Manag. J. Educ. Technol. 2019, 15, 17. [Google Scholar] [CrossRef]
  29. Koçak, Ö.; Yilmaz, R.M.; Küçük, S.; Göktaş, Y. The Educational Potential of Augmented Reality Technology: Experiences of Instructional Designers and Practitioners. J. Educ. Future 2019, 17–36. [Google Scholar] [CrossRef]
  30. Sung, N.J.; Ma, J.; Choi, Y.J.; Hong, M. Real-Time Augmented Reality Physics Simulator for Education. Appl. Sci. 2019, 9, 4019. [Google Scholar] [CrossRef] [Green Version]
  31. Yuliono, T.; Rintayati, P. The Promising Roles of Augmented Reality in Educational Setting: A Review of the Literature. Int. J. Educ. Methodol. 2018, 4. [Google Scholar] [CrossRef] [Green Version]
  32. Tsekeris, C. Surviving and thriving in the Fourth Industrial Revolution: Digital skills for education and society. Homo Virtualis 2019, 2, 34. [Google Scholar] [CrossRef] [Green Version]
  33. Radosavljevic, S.; Radosavljevic, V.; Grgurovic, B. The potential of implementing augmented reality into vocational higher education through mobile learning. Interact. Learn. Environ. 2018, 1–15. [Google Scholar] [CrossRef]
  34. Akçayır, M.; Akçayır, G. Advantages and challenges associated with augmented reality for education: A systematic review of the literature. Educ. Res. Rev. 2017, 20, 1–11. [Google Scholar] [CrossRef]
  35. Wu, H.K.; Lee, S.W.Y.; Chang, H.Y.; Liang, J.C. Current status, opportunities and challenges of augmented reality in education. Comput. Educ. 2013, 62, 41–49. [Google Scholar] [CrossRef]
  36. Yuen, S.C.Y.; Yaoyuneyong, G.; Johnson, E. Augmented reality: An overview and five directions for AR in education. J. Educ. Technol. Dev. Exch. 2011, 4, 11. [Google Scholar] [CrossRef]
  37. Dunleavy, M.; Dede, C.; Mitchell, R. Affordances and limitations of immersive participatory augmented reality simulations for teaching and learning. J. Sci. Educ. Technol. 2009, 18, 7–22. [Google Scholar] [CrossRef]
  38. Pang, Y.; Nee, A.Y.C.; Khim Ong, S.K.; Yuan, M.; Youcef-Toumi, K. Assembly feature design in an augmented reality environment. Assem. Autom. 2006, 26, 34–43. [Google Scholar] [CrossRef]
  39. Poupyrev, I.; Tan, D.S.; Billinghurst, M.; Kato, H.; Regenbrecht, H.; Tetsutani, N. Developing a generic augmented-reality interface. Computer 2002, 35, 44–50. [Google Scholar] [CrossRef]
  40. Billinghurst, M.; Duenser, A. Augmented reality in the classroom. Computer 2012, 45, 56–63. [Google Scholar] [CrossRef]
  41. Martín-Gutiérrez, J.; Fabiani, P.; Benesova, W.; Meneses, M.D.; Mora, C.E. Augmented reality to promote collaborative and autonomous learning in higher education. Comput. Hum. Behav. 2015, 51, 752–761. [Google Scholar] [CrossRef]
  42. Diao, P.H.; Shih, N.J. Trends and Research Issues of Augmented Reality Studies in Architectural and Civil Engineering Education—A Review of Academic Journal Publications. Appl. Sci. 2019, 9, 1840. [Google Scholar] [CrossRef] [Green Version]
  43. Billinghurst, M. Augmented reality in education. New Horiz. Learn. 2002, 12, 1–5. [Google Scholar] [CrossRef]
  44. Miller, D. Implementing Augmented Reality in the Classroom. Issues Trends Educ. Technol. 2015, 3. [Google Scholar] [CrossRef] [Green Version]
  45. Robinson, K. An introduction to the cognitive theory of multimedia learning. Appl. Cogn. Psychol. 2011, 25, 174. [Google Scholar] [CrossRef]
  46. Muhammad, S. Application of Cognitive Theory of Multimedia Learning in Undergraduate Surgery Course. Int. J. Surg. Res. Pract. 2018, 5. [Google Scholar] [CrossRef] [Green Version]
  47. Triono, M.; Retnowati, E. Validity assessment of a multimedia based on cognitive load theory for undergraduate plane geometry learning. J. Phys. Conf. Ser. 2019, 1320, 012084. [Google Scholar] [CrossRef]
  48. Skuballa, I.T.; Dammert, A.; Renkl, A. Two kinds of meaningful multimedia learning: Is cognitive activity alone as good as combined behavioral and cognitive activity? Learn. Instr. 2018, 54, 35–46. [Google Scholar] [CrossRef]
  49. Sezgin, M.E.; Coşkun, M. The Effects of Multimedia Courseware Design Based on Cognitive Theory of Multimedia Learning on Academic Achievement and Instructional Efficiency. Cukurova Univ. Fac. Educ. J. 2016, 45, 405–422. [Google Scholar] [CrossRef]
  50. Kirschner, F.; Kester, L.; Corbalan, G. Cognitive load theory and multimedia learning, task characteristics and learning engagement: The Current State of the Art. Comput. Hum. Behav. 2011, 27. [Google Scholar] [CrossRef]
  51. Jiang, D.; Renandya, W.A.; Zhang, L.J. Evaluating ELT multimedia courseware from the perspective of cognitive theory of multimedia learning. Comput. Assist. Lang. Learn. 2017, 30, 726–744. [Google Scholar] [CrossRef]
  52. Park, B.; Plass, J.L.; Brünken, R. Cognitive and affective processes in multimedia learning. Learn. Instr. 2014, 29, 125–127. [Google Scholar] [CrossRef]
  53. Azuma, R.T. A survey of augmented reality. Presence Teleoperators Virtual Environ. 1997, 6, 355–385. [Google Scholar] [CrossRef]
  54. Tom Dieck, M.C.; Jung, T. A theoretical model of mobile augmented reality acceptance in urban heritage tourism. Curr. Issues Tour. 2018, 21, 154–174. [Google Scholar] [CrossRef]
  55. Gladston, A.; Duraisamy, A. Augmented Reality Indoor Navigation Using Handheld Devices. Int. J. Virtual Augment. Real. 2019, 3, 1–17. [Google Scholar] [CrossRef]
  56. Schraffenberger, H.; Van der Heide, E. Everything Augmented: On the Real in Augmented Reality. J. Sci. Technol. Arts 2014, 6, 17. [Google Scholar] [CrossRef] [Green Version]
  57. Elmqaddem, N. Augmented Reality and Virtual Reality in Education. Myth or Reality? Int. J. Emerg. Technol. Learn.(iJET) 2019, 14, 234–241. [Google Scholar] [CrossRef] [Green Version]
  58. Heller, L. Crafting virtual reality. Virtual Creat. 2018, 8, 189–202. [Google Scholar] [CrossRef]
  59. Yang, L.; Dong, W.; Jin, H.; Feng, T.; Hong’an, W.; Guozhong, D. Influence of multi-modality on moving target selection in virtual reality. Virtual Real. Intell. Hardw. 2019, 1, 303. [Google Scholar] [CrossRef] [Green Version]
  60. Abdullah, J.; Mohd-Isa, W.N.; Samsudin, M.A. Virtual reality to improve group work skill and self-directed learning in problem-based learning narratives. Virtual Real. 2019, 23, 461–471. [Google Scholar] [CrossRef]
  61. Rangelova, S.; Andre, E. A Survey on Simulation Sickness in Driving Applications with Virtual Reality Head-Mounted Displays. PRESENCE Virtual Augment. Real. 2019, 27, 15–31. [Google Scholar] [CrossRef]
  62. Minocha, S. The State of Virtual Reality in Education –Shape of Things to Come. Int. J. Eng. Res. 2015, 4, 596–598. [Google Scholar] [CrossRef]
  63. Dodevska, Z.A.; Mihić, M.M. Augmented Reality and Virtual Reality Technologies in Project Management: What Can We Expect? Eur. Proj. Manag. J. 2018, 8, 17–24. [Google Scholar] [CrossRef]
  64. Lee, C. Novel Augmented Reality/Virtual Reality Interface Using A Self-Powered Triboelectric-Based Virtual Reality 3D Control Sensor. Sci. Trends 2018. [Google Scholar] [CrossRef]
  65. Hughes, I. Virtual worlds, augmented reality, blended reality. Comput. Netw. 2012, 56, 3879–3885. [Google Scholar] [CrossRef]
  66. Richir, S.; Fuchs, P.; Lourdeaux, D.; Millet, D.; Buche, C.; Querrec, R. How to design compelling Virtual Reality or Augmented Reality experience? Int. J. Virtual Real. 2015, 15, 35–47. [Google Scholar] [CrossRef] [Green Version]
  67. Park, T.; Zhang, M.; Lee, Y. When Mixed Reality Meets Internet of Things: Toward the Realization of Ubiquitous Mixed Reality. Comput. Commun. 2018, 21, 10–14. [Google Scholar] [CrossRef]
  68. El Jamiy, F.; Marsh, R. Survey on depth perception in head mounted displays: Distance estimation in virtual reality, augmented reality, and mixed reality. IET Image Process. 2019, 13, 707–712. [Google Scholar] [CrossRef]
  69. Chang, C.Y.; Debra Chena, C.L.; Chang, W.K. Research on Immersion for Learning Using Virtual Reality, Augmented Reality and Mixed Reality. Enfance 2019, N°3, 413. [Google Scholar] [CrossRef]
  70. Tom Dieck, M.C.; Jung, T.H.; Rauschnabel, P.A. Determining visitor engagement through augmented reality at science festivals: An experience economy perspective. Comput. Hum. Behav. 2018, 82, 44–53. [Google Scholar] [CrossRef]
  71. Kim, S.J.; Bae, Y.M.; Choi, Y.J. Design and Implementation of Real-time Augmented Reality Building Information System Combined with 3D Map. J. Korea Comput. Graph. Soc. 2018, 24, 39–54. [Google Scholar] [CrossRef]
  72. Joe, Y. Comparing Augmented Reality and Collage in the view of remediation theory. J. Digit. Des. 2011, 11, 153–162. [Google Scholar] [CrossRef]
  73. Tzima, S.; Styliaras, G.; Bassounas, A. Augmented Reality Applications in Education: Teachers Point of View. Educ. Sci. 2019, 9, 99. [Google Scholar] [CrossRef] [Green Version]
  74. Azuma, R. Tracking requirements for augmented reality. Commun. ACM 1993, 36, 50–52. [Google Scholar] [CrossRef]
  75. Tom Dieck, M.C.; Jung, T.H.; Tom Dieck, D. Enhancing art gallery visitors’ learning experience using wearable augmented reality: Generic learning outcomes perspective. Curr. Issues Tour. 2018, 21, 2014–2034. [Google Scholar] [CrossRef]
  76. Sırakaya, M.; Alsancak Sırakaya, D. Augmented reality in STEM education: A systematic review. Interact. Learn. Environ. 2020, 1–14. [Google Scholar] [CrossRef]
  77. Kyza, E.A.; Georgiou, Y. Scaffolding augmented reality inquiry learning: The design and investigation of the TraceReaders location-based, augmented reality platform. Interact. Learn. Environ. 2018, 27, 211–225. [Google Scholar] [CrossRef]
  78. Mthembu, N. Information and Communication Technology (ICT) and Its Mixed Reality in the Learning Sphere. Int. J. Virtual Augment. Real. 2018, 2, 26–37. [Google Scholar] [CrossRef]
  79. Sampaio, D.; Almeida, P. Pedagogical Strategies for the Integration of Augmented Reality in ICT Teaching and Learning Processes. Procedia Comput. Sci. 2016, 100, 894–899. [Google Scholar] [CrossRef] [Green Version]
  80. Cassen, R.H. Our common future: Report of the World Commission on Environment and Development. Int. Aff. 1987, 64, 126. [Google Scholar] [CrossRef]
  81. Barbier, E.B.; Burgess, J.C. Sustainable development goal indicators: Analyzing trade-offs and complementarities. World Dev. 2019, 122, 295–305. [Google Scholar] [CrossRef]
  82. De Solla Price, D. The analysis of scientometric matrices for policy implications. Scientometrics 1981, 3, 47–53. [Google Scholar] [CrossRef]
  83. Garfield, E. Derek Price and the Practical World of Scientometrics. Sci. Technol. Hum. Values 1988, 13, 349–350. [Google Scholar] [CrossRef]
  84. Prathap, G. Eugene Garfield: From the metrics of science to the science of metrics. Scientometrics 2017, 114, 637–650. [Google Scholar] [CrossRef]
  85. Chubin, D.; Garfield, E. Is citation analysis a legitimate evaluation tool? Scientometrics 1980, 2, 91–94. [Google Scholar] [CrossRef]
  86. Garfield, E. A Century of Citation Indexing. Collnet J. Scientometr. Inf. Manag. 2012, 6, 1–6. [Google Scholar] [CrossRef]
  87. Glänzel, W.; Abdulhayoǧlu, M.A. Garfield number: On some characteristics of Eugene Garfield’s first and second order co-authorship networks. Scientometrics 2017, 114, 533–544. [Google Scholar] [CrossRef]
  88. Abad-Segura, E.; González-Zamar, M.D. Effects of Financial Education and Financial Literacy on Creative Entrepreneurship: A Worldwide Research. Educ. Sci. 2019, 9, 238. [Google Scholar] [CrossRef] [Green Version]
  89. Belmonte-Ureña, L.J.; Garrido-Cardenas, J.A.; Camacho-Ferre, F. Analysis of World Research on Grafting in Horticultural Plants. HortScience 2020, 55, 112–120. [Google Scholar] [CrossRef]
  90. Abad-Segura, E.; González-Zamar, M.D.; Infante-Moro, J.C.; Ruipérez García, G. Sustainable Management of Digital Transformation in Higher Education: Global Research Trends. Sustainability 2020, 12, 2107. [Google Scholar] [CrossRef] [Green Version]
  91. Fleming, P.S.; Koletsi, D.; Pandis, N. Blinded by PRISMA: Are Systematic Reviewers Focusing on PRISMA and Ignoring Other Guidelines? PLoS ONE 2014, 9, e96407. [Google Scholar] [CrossRef]
  92. EDUCAUSE Learning Initiative (ELI). 2005 Horizon Report. Available online: https://library.educause.edu/resources/2005/1/2005-horizon-report (accessed on 2 January 2020).
  93. Abad-Segura, E.; Cortés-García, F.J.; Belmonte-Ureña, L.J. The sustainable approach to corporate social responsibility: A global analysis and future trends. Sustainability 2019, 11, 5382. [Google Scholar] [CrossRef] [Green Version]
  94. González-Zamar, M.D.; Ortiz Jiménez, L.; Sánchez Ayala, A.; Abad-Segura, E. The Impact of the University Classroom on Managing the Socio-Educational Well-being: A Global Study. Int. J. Environ. Res. Public Health 2020, 17, 931. [Google Scholar] [CrossRef] [Green Version]
  95. Prathap, G. Quantity, quality, and consistency as bibliometric indicators. J. Assoc. Inf. Sci. Technol. 2013, 65, 214. [Google Scholar] [CrossRef]
  96. Bornmann, L.; Haunschild, R.; Hug, S.E. Visualizing the context of citations referencing papers published by Eugene Garfield: A new type of keyword co-occurrence analysis. Scientometrics 2017, 114, 427–437. [Google Scholar] [CrossRef] [PubMed] [Green Version]
  97. Fellnhofer, K. Visualised bibliometric mapping on smart specialisation: A co-citation analysis. Int. J. Knowl. Based Dev. 2018, 9, 76. [Google Scholar] [CrossRef]
  98. Zhou, S.; Tao, Z.; Zhu, Y.; Tao, L. Mapping theme trends and recognizing hot spots in postmenopausal osteoporosis research: A bibliometric analysis. PeerJ 2019, 7, e8145. [Google Scholar] [CrossRef]
  99. Van Eck, N.J.; Waltman, L. Software survey: VOSviewer, a computer program for bibliometric mapping. Scientometrics 2009, 84, 523–538. [Google Scholar] [CrossRef] [PubMed] [Green Version]
  100. Van Eck, N.J.; Waltman, L. Citation-based clustering of publications using CitNetExplorer and VOSviewer. Scientometrics 2017, 111, 1053–1070. [Google Scholar] [CrossRef] [Green Version]
  101. Yuan, M.L.; Ong, S.K.; Nee, A.Y.C. A generalized registration method for augmented reality systems. Comput. Graph. 2005, 29, 980–997. [Google Scholar] [CrossRef]
  102. Uluyol, Ç. Augmented Reality in Education. Education 2019. [Google Scholar] [CrossRef]
  103. Sarıgöz, O. Augmented reality, virtual reality and digital games: A research on teacher candidates. Educ. Policy Anal. Strateg. Res. 2019, 14, 41–63. [Google Scholar] [CrossRef]
  104. Del Cerro Velázquez, F.; Morales Méndez, G. Augmented Reality and Mobile Devices: A Binominal Methodological Resource for Inclusive Education (SDG 4). An Example in Secondary Education. Sustainability 2018, 10, 3446. [Google Scholar] [CrossRef] [Green Version]
  105. Khalid Obeidy, W.; Arshad, H.; Yao Huang, J. A Proposed Model of Acceptance for Smart Glasses based Outdoor Augmented Reality Applications at UNESCO World Heritage Sites. Int. J. Eng. Technol. 2018, 7, 354. [Google Scholar] [CrossRef]
  106. Kongsilp, S.; Dailey, M.N. User Behavior and the Importance of Stereo for Depth Perception in Fish Tank Virtual Reality. PRESENCE Virtual Augment. Real. 2020, 27, 206–225. [Google Scholar] [CrossRef]
  107. Egodagamage, R.; Tuceryan, M. Distributed monocular visual SLAM as a basis for a collaborative augmented reality framework. Comput. Graph. 2018, 71, 113–123. [Google Scholar] [CrossRef] [Green Version]
  108. Muhammad Nur Affendy, N.; Ajune Wanis, I.; Affendy, N.; Ajune Wanis, I. A Review on Collaborative Learning Environment across Virtual and Augmented Reality Technology. In IOP Conference Series: Materials Science and Engineering; IOP Publishing: Bristol, UK, 2019; Volume 551, p. 012050. [Google Scholar] [CrossRef] [Green Version]
  109. Salar, M.A.F. An Augmented Reality System for Malaysian STPM Students Studying Chemistry. Int. J. Psychosoc. Rehabil. 2019, 23, 1355–1362. [Google Scholar] [CrossRef]
  110. Lee, Y.H.; Zhan, T.; Wu, S.T. Prospects and challenges in augmented reality displays. Virtual Real. Intell. Hardw. 2019, 1, 10–20. [Google Scholar] [CrossRef]
  111. Elmqaddem, N. Augmented Reality and Virtual Reality in Education. Myth or Reality? Int. J. Emerg. Technol. Learn. 2019, 14, 234. [Google Scholar] [CrossRef] [Green Version]
  112. Cook, M.J. Augmented Reality: Examining its value in a music technology classroom. Practice and potential. Waikato J. Educ. 2019, 24, 23–38. [Google Scholar] [CrossRef]
  113. Chandrasekera, T.; Yoon, S.Y. The Effect of Augmented and Virtual Reality Interfaces in the Creative Design Process. Int. J. Virtual Augment. Real. 2018, 2, 1–13. [Google Scholar] [CrossRef]
  114. Feriyadi, N. The Augmented Reality 3D Object Augmented Reality. Kopertip J. Ilm. Manaj. Inform. Dan Komput. 2018, 2, 76–83. [Google Scholar] [CrossRef]
  115. Davydov, D.S. Innovation in the Sphere of Augmented and Virtual Reality Technologies in EU Member States and Other Countries of the World. Probl. Econ. 2019, 1, 5–11. [Google Scholar] [CrossRef] [Green Version]
  116. Blanco-Pons, S.; Carrión-Ruiz, B.; Luis Lerma, J.; Villaverde, V. Design and implementation of an augmented reality application for rock art visualization in Cova dels Cavalls (Spain). J. Cult. Herit. 2019, 39, 177–185. [Google Scholar] [CrossRef]
  117. Minh, V.T.; Katushin, N.; Pumwa, J. Motion tracking glove for augmented reality and virtual reality. Paladyn J. Behav. Robot. 2019, 10, 160–166. [Google Scholar] [CrossRef]
  118. Li, X.; Yi, W.; Chi, H.L.; Wang, X.; Chan, A.P.C. A critical review of virtual and augmented reality (VR/AR) applications in construction safety. Autom. Constr. 2018, 86, 150–162. [Google Scholar] [CrossRef]
  119. Wang, Y.H. Using augmented reality to support a software editing course for college students. J. Comput. Assist. Learn. 2017, 33, 532–546. [Google Scholar] [CrossRef]
  120. Aziz, K.A.; Siang, T.G. Virtual Reality and Augmented Reality Combination as a Holistic Application for Heritage Preservation in the UNESCO World Heritage Site of Melaka. Int. J. Soc. Sci. Humanit. 2014, 4, 333–338. [Google Scholar] [CrossRef] [Green Version]
  121. Abad-Segura, E.; González-Zamar, M.D. Análisis de las competencias en la educación superior a través de flipped classroom. Rev. Iberoam. Educ. 2019, 80, 29–45. [Google Scholar] [CrossRef]
  122. González-Zamar, M.D.; Abad-Segura, E. El aula invertida: Un desafío para la enseñanza universitaria. Virtualidad Educ. Cienc. 2020, 11, 75–91. [Google Scholar]
  123. Van Krevelen, D.W.F.; Poelman, R. A Survey of Augmented Reality Technologies, Applications and Limitations. Int. J. Virtual Real. 2010, 9, 1–20. [Google Scholar] [CrossRef] [Green Version]
  124. Quandt, M.; Knoke, B.; Gorldt, C.; Freitag, M.; Thoben, K.D. General Requirements for Industrial Augmented Reality Applications. Procedia Cirp 2018, 72, 1130–1135. [Google Scholar] [CrossRef]
  125. Yuniarto, D.; Helmiawan, M.A.; Firmansyah, E. Technology Acceptance in Augmented Reality. J. Online Inform. 2018, 3, 10. [Google Scholar] [CrossRef]
  126. Su, C.H. The Effect of Users’ Behavioral Intention on Gamification Augmented Reality in STEM (GAR-STEM) Education. J. Balt. Sci. Educ. 2019, 18. [Google Scholar] [CrossRef]
  127. Challenor, J.; Ma, M. A Review of Augmented Reality Applications for History Education and Heritage Visualisation. Multimodal Technol. Interact. 2019, 3, 39. [Google Scholar] [CrossRef] [Green Version]
  128. Ahmed, S. A review on using opportunities of augmented reality and virtual reality in construction project management. Organ. Technol. Manag. Constr. Int. J. 2018, 10, 1839–1852. [Google Scholar] [CrossRef] [Green Version]
  129. Bona, S.; Donvito, G.; Cozza, F.; Malberti, I.; Vaccari, P.; Lizio, A.; Lunetta, C. The development of an augmented reality device for the autonomous management of the electric bed and the electric wheelchair for patients with amyotrophic lateral sclerosis: A pilot study. Disabil. Rehabil. Assist. Technol. 2019, 1–7. [Google Scholar] [CrossRef]
  130. Truby, J. Governing Artificial Intelligence to benefit the UN Sustainable Development Goals. Sustain. Dev. 2020. [Google Scholar] [CrossRef]
  131. Ayer, S.K.; Messner, J.I.; Anumba, C.J. Augmented Reality Gaming in Sustainable Design Education. J. Archit. Eng. 2016, 22, 04015012. [Google Scholar] [CrossRef] [Green Version]
  132. Tekin, A.K. How to achieve quality early childhood education for all: Goal 4 of the United Nations Sustainable Development. J. Sustain. Dev. Educ. Res. 2019, 3, 71. [Google Scholar] [CrossRef]
Figure 1. Theoretical–practical model in the educational application of augmented reality.
Sustainability 12 04091 g001
Figure 2. Augmented reality (AR) educational applications: (a) Picasso explains his Guernica work exhibited in the museum; (b) Picasso exposes the process of artistic creation in the university classroom.
Sustainability 12 04091 g002
Figure 3. Flowchart of the methodology (Preferred Reporting Items for Systematic Reviews and Meta-Analyses (PRISMA)).
Sustainability 12 04091 g003
Figure 4. Evolution of the number of articles and percentage of variation between three-year periods.
Sustainability 12 04091 g004
Figure 5. Main thematic areas on sustainability of AR in HE (2005–2019).
Sustainability 12 04091 g005
Figure 6. Network of cooperation between authors based on co-authorship analysis (2005-2019).
Sustainability 12 04091 g006
Figure 7. Network of cooperation between countries based on co-authorship analysis (2005–2019).
Sustainability 12 04091 g007
Figure 8. Keywords network based on co-occurrence (2005–2019).
Sustainability 12 04091 g008
Figure 9. Evolution of keywords network based on co-occurrence (2005–2019).
Sustainability 12 04091 g009
Table 1. Main literature reviewed of the object of research.
YearAuthor(s)Title [Reference]Journal
2019Squires, D. R.Immersive Learning Experiences: Technology Enhanced Instruction, Adaptive Learning, Augmented Reality, and M-Learning in Informal Learning [28]i-Manager’s Journal of Educational Technology
2019Koçak, Ö.; Yilmaz, R. M.; Küçük, S.; Göktaş, Y.The Educational Potential of Augmented Reality Technology: Experiences of Instructional Designers and Practitioners [29]Journal of Education and Future
2019Sung, N.-J.; Ma, J.; Choi, Y.-T.; Hong, M.Real-Time Augmented Reality Physics Simulator for Education [30]Applied Sciences
2018Yuliono, T.; Rintayati, P.The promising roles of augmented reality in educational setting: A review of the literature [31]International Journal of Educational Methodology
2018Shahroom, A.; Hussin, N.Industrial revolution 4.0 and education [32]International Journal of Academic Research in Business and Social Sciences
2018Radosavljevic, S.; Radosavljevic, V.; Grgurovic, B.The potential of implementing augmented reality into vocational higher education through mobile learning [33]Interactive Learning Environments
2017Akçayır, M.;Akçayır, G.Advantages and challenges associated with augmented reality for education: A systematic review of the literature [34]Educational Research Review
2013Wu, H. K.; Lee, S. W.Y.; Chang, H. Y.; Liang, J. C.Current status, opportunities and challenges of augmented reality in education [35]Computers & education
2011Yuen, S. C. Y.; Yaoyuneyong, G.; Johnson, E.Augmented reality: An overview and five directions for AR in education [36]Journal of Educational Technology Development and Exchange
2009Dunleavy, M.; Dede, C.; Mitchell, R.Affordances and limitations of immersive participatory augmented reality simulations for teaching and learning [37]Journal of Science Education and Technology
2006Pang, Y.; Nee, A. Y. C.; Khim Ong, S. K.; Yuan, M.; Youcef-Toumi, K.Assembly feature design in an augmented reality environment [38]Assembly Automation
Table 2. Major characteristics of the articles on sustainability of AR in higher education (HE) (2005–2019).
PeriodAAUCJTCAU/ATC/AR/ATA
2005–200747163314322363.4747.5732.55CS—E—SC
2008–2010105348559834373.3132.7325.44CS—E—ME
2011–20132518778819468043.4927.1026.07CS—E—SC
2014–20164551,61513336073993.5516.2628.04CS—SC—E
2017–20191119384318274342713.433.8230.96CS—E—SC
A: number of articles; AU: number of authors; C: number of countries; J: number of journals; TC: number of citations; AU/A: average authors by article; TC/A: average citations by article; R/A: average references by article; TA: main thematic areas of research; CS: computer science; E: engineering; SC: social sciences; ME: medicine.
Table 3. Main journals in number of articles on sustainability of AR in HE (2005–2019).
JournalATCTC/AHaHjSJR(Q)CTAA
2005–072008–102011–132014–162017–19
Computers and Education35323992.54271492.32(Q1)UKCS—SC0113912
Multimedia Tools and Applications311705.48850.34(Q1)NetherlandsCS—E004819
Interactive Learning Environments2238017.2710340.90(Q1)UKCS—SC001615
Virtual Reality2247321.508370.48(Q2)UKCS234211
Automation in Construction1950526.5813951.41(Q1)NetherlandsE00928
Eurasia Journal of Mathematics Science and Technology Education1922311.738250.33(Q3)TurkeyMA-SC000019
IEEE Transactions on Visualization and Computer Graphics1929215.37111180.96(Q1)USACS01468
International Journal of Emerging Technologies in Learning19512.684150.22(Q2)GermanyE—SC001315
Applied Sciences18181.003230.38(Q1)SwitzerlandCE—CS000018
Computers in Human Behavior1769140.65121371.71(Q1)UKAH—CS—P00278
A: number of articles; TC: number of citations for all articles; TC/A: number of citations by article; Ha: h-index in articles; Hj: h-index in journal; SJR (Q): Scimago Journal Rank (Quartile); C: country; TA: main thematic area of research; CS: Computer Science; SC: Social Sciences; E: Engineering; MA: Mathematics; CE: Chemical Engineering; AH: Arts and Humanities; P: Psychology.
Table 4. Main authors in number of articles on sustainability of AR in HE (2005–2019).
AuthorATCTC/AInstitutionC1st ALast AHTA
Nee, A.Y.C.1632820.50National University of SingaporeSingapore2006201911Engineering
Ong, S.K.1632820.50National University of SingaporeSingapore2006201911Engineering
Billinghurst, M.918120.11University of South AustraliaAustralia201120196Computer Science
Navab, N.9485.33Technische Universität MünchenGermany201520195Medicine
Wang, X.949955.44Curtin UniversityAustralia200720189Engineering
Chen, C.H.813516.88National Cheng Kung UniversityTaiwan201120196Computer Science
Hwang, G.J.834843.50National Taiwan University of Science and TechnologyTaiwan201320196Social Sciences
Juan, M.C.823629.50Universitat Politècnica de ValènciaSpain201320194Computer Science
Hsiao, K.F.79513.57Ming Chuan UniversityTaiwan201020155Computer Science
Huang, T.C.711216.00National Taichung University of Science and TechnologyTaiwan201320193Computer Science
A: number of articles; TC: total number of citations; TC/A: number of citations by article; C: country; 1st A: first article in research topic; Last A: last article in research topic; H: Hirsch index in research topic; TA: main thematic area of research.
Table 5. Main institutions in number of articles on sustainability of AR in HE (2005–2019).
InstitutionCATCTC/Ah-index1st ALast ATA
National Taiwan University of Science and TechnologyTaiwan25141756.681520122019Social Sciences
National University of SingaporeSingapore2475931.631320062019Engineering
National Taiwan Normal UniversityTaiwan23100243.571020132019Social Sciences
National Cheng Kung UniversityTaiwan171659.71720092019Computer Science
Universidad Carlos III de MadridSpain1665840.56920112019Computer Science
Universitat Politècnica de ValènciaSpain1646729.19820102019Computer Science
Technical University of MunichGermany1621913.69820062019Computer Science
University of SevilleSpain15261.73420162019Social Sciences
Universidad de la LagunaSpain1448434.57920102019Social Sciences
University of Central FloridaUSA1329822.921020052019Computer Science
C: country; A: number of articles; TC: number of citations for all articles; TC/A: number of citations by article; h-index: Hirsch index in the research topic; 1st A: first article; Last A: last article; TA: main thematic area of research.
Table 6. Main countries in number of articles on sustainability of AR in HE (2005–2019).
CountryATCTC/Ah-indexMain Thematic AreaA
2005–072008–102011–132014–162017–19
United States358658318.3941Computer Science12284680194
Spain195336117.2327Social Sciences123152109
Taiwan175322218.4129Computer Science16314889
China13810567.6514Computer Science21042795
South Korea124131510.6019Computer Science15293851
UK120209817.4823Computer Science119152263
Italy10010089.9816Computer Science16152454
Germany94112012.0418Computer Science210102154
Australia81130516.1117Computer Science14102244
Malaysia751451.936Engineering0011658
A: number of articles; TC: number of citations for all articles; TC/A: number of citations by article; h-index: Hirsch index in the research topic.
Table 7. Main countries and international collaboration (2005–2019).
CountryNumber of CollaborationsMain Collaborators
United States37United Kingdom, China, Germany, Canada, Australia
Spain29Colombia, Italy, Germany, France, United Kingdom, Venezuela
Taiwan16China, Australia, United Kingdom, Canada, South Korea
China21United States, Australia, United Kingdom, Taiwan, Singapore
South Korea15Taiwan, China, Hong Kong, United Kingdom, Canada
United Kingdom36Germany, China, Italy, Australia, Greece
Italy18United Kingdom, Spain, United States, Germany, Belgium
Germany13United States, United Kingdom, Netherlands, Switzerland, France
Australia29China, United Kingdom, South Korea, Taiwan, United States
Malaysia7Indonesia, Iraq, Saudi Arabia, Australia, Japan, Libyan Arab Jamahiriya, United Kingdom
Table 8. Main keywords on sustainability of AR in HE (2005–2019).
Keyword2005–20192005–20072008–20102011–20132014–20162017–2019
A%A%A%A%A%A%
Augmented Reality149075.42246.87268.620079.735076.984675.6
Virtual Reality46123.32859.65754.36626.38017.623020.6
Education24512.424.31413.32510.07616.712811.4
Teaching1497.60076.7249.64710.3716.3
Learning1005.00076.7124.8275.9544.8
User-Computer Interface934.7510.61514.3135.2316.8292.6
E-learning924.70021.9176.8286.2454.0
Computer Simulation854.31225.51615.2166.4214.6201.8
Visualization824.148.532.993.6224.8443.9
Mobile Learning773.90000166.4224.8413.7
A: number of articles; %: percentage of articles in which it appears.

