Article

A Modular Approach for Steel Reinforcing of 3D Printed Concrete—Preliminary Study

1
Dept. of Civil and Environmental Engineering, Faculty of Engineering, University of Balamand, Al Kourah PO Box 100, Lebanon
2
Dept. of Civil and Environmental Engineering, Faculty of Engineering, American University of Beirut, Beirut PO Box 1107 2020, Lebanon
3
Dept. of Civil and Environmental Engineering, Faculty of Engineering, University of Alberta, Edmonton, AB T6G 1H9, Canada
4
Hole School of Construction Engineering, Faculty of Engineering, University of Alberta, Edmonton, AB T6G 1H9, Canada
*
Author to whom correspondence should be addressed.
Sustainability 2020, 12(10), 4062; https://doi.org/10.3390/su12104062
Submission received: 15 April 2020 / Revised: 10 May 2020 / Accepted: 14 May 2020 / Published: 15 May 2020

Abstract

:
3D concrete printing technology has considerably progressed in terms of material proportioning and properties; however, it still suffers from the difficulty of incorporating steel reinforcement for structural applications. This paper aims at developing a modular approach capable of manufacturing 3D printed beam and column members reinforced with conventional steel bars. The cubic-shaped printed modules had 240 mm sides, possessing four holes on the corners for subsequent insertion of flexural steel and grouting operations. The transverse steel (i.e., stirrups) was manually incorporated during the printing process. The reinforced 3D printed beams were built by joining the various modules using high-strength epoxy resins. Test results showed that the compressive and flexural strengths of plain (i.e., unreinforced) 3D printed specimens are higher than traditionally cast-in-place (CIP) ones, which was mostly attributed to the injected high-strength grout that densifies the matrix and hinders the ease of crack propagation during loading. The flexural moment capacity of 3D reinforced printed beams were fairly close to the ACI 318-19 code provisions; however, about 22% lower than companion CIP members. The reduction in peak loads was attributed to the modular approach used to construct the 3D members, which might alter the fundamentals and concepts of reinforced concrete design, including the transfer and redistribution of stresses at ultimate loading conditions.

1. Introduction

3D concrete printing (3DcP) technology has attracted the interest of many researchers and practitioners in the construction and building industries [1,2]. Benefits associated to sustainability include freedom in geometry during construction, reduced formwork costs, faster production, low-waste generation, and improved safety and working conditions. The process typically involves the extrusion of a visco-plastic material (whether cementitious-based or geopolymer), layer-by-layer, to form complex geometries without additional labor costs [3,4]. From the material point of view, considerable work was carried out to satisfy the stringent printability criteria (i.e., extrusion, open time, and buildability) as well as performance in the hardened state [5,6]. For example, the use of nano-fillers, set-regulators, and thixotropy-enhancers were found efficient to improve buildability [1,6,7]. Sakka et al. [8] showed that the addition of polymeric latexes could extend the open time, and most importantly, mitigate the drop in interfacial bond strengths due to the layer-by-layer application process.
Although the interest in 3DcP rapidly progressed, the technology still suffers from the difficulty of incorporating steel reinforcement during the printing process. In fact, the presence of reinforcement is essential in concrete structures to compensate the weakness in tensile strength as well as limit crack widths and ensure sufficiently ductile behavior under service and ultimate conditions [9,10,11]. Different reinforcing methods and methodologies have been exploited so far. For instance, the contour crafting method consists of depositing series of concrete filaments (with 20–50 mm width and 10–30 mm height) that provide permanent integrated “formwork” [12,13]. The horizontal and vertical reinforcement are then installed, and “formwork” filled with flowable grouts. The horizontal reinforcement can be individually positioned (i.e., bar after bar) after depositing the consecutive layers, or steel wires can be simultaneously laid from the printhead during the extrusion process. Khoshnevis [14] explored the feasibility of post-installed steel elements assembled step-by-step on the outer side of the printed structure, albeit such approach was found quite elaborated and expensive. The 3DcP process adopted by the Chinese firm, HuaShang Tengda Ltd., involved pre-installing steel mats, while a forked nozzle used to deposit the concrete layer-by-layer on both sides of the reinforcement [15]. This method proved efficient for building only vertical elements (i.e., walls and columns), while its shortcomings include the limited height of individual steel mats and manual erection of reinforcement that needs to be held in place during printing [2,15,16].
Salet et al. [17] used a post-tensioning technique for reinforcing a 3D printed concrete bridge. The method consisted of printing the bridge in multiple parts and, then joining them together using tendons. A reinforcement cable was automatically entrained into the filament in order to avoid brittle failure due to torsion. Asprone et al. [18] followed a similar approach, which consisted of printing concrete segments and assembling them. The printed elements contained holes where external steel rebars were inserted for tying the segments together. The authors reported comparable flexural stiffness to equivalent cast-in-place reinforced concrete beams, with no yielding of the external reinforcement system. Yet, shear damage occurred at the interface between the anchorage and concrete segments, which increased deflection and compromised the overall performance of the beam. The concerns raised by Asprone et al. [18] were related to overall ductility, comparison with standard requirements, size effect related to the 3DcP technology, environmental degradation, and steel rebar embedment and fire resistance.
Knowing the complexity of integrating steel reinforcement in 3DcP, several researchers considered the possibility of introducing steel fibers in the concrete mix design, which would partly accommodate the tensile stresses and flexural cracking occurring in the binder matrix [19,20]. Yet, such fibers are relatively short and cannot provide continuity in reinforcement to enable proper transfer and redistribution of stresses. Moreover, such fibers do not generally cross the interface between successive filaments, making the interfacial joints particularly weak in the system [21,22,23]. Bos et al. [24] considered entraining a continuous steel reinforcing cable within the extruded layer. Although this technique provided better continuity and higher strength compared to dispersed fibers, the issue of reinforcement not crossing the interlayers still persists. Recently, Marchment and Sanjayan [16] developed a new nozzle that allows insertion of a continuous mesh of reinforcement in the middle part of the filament, simultaneously while the printed layer is being extruded. Nevertheless, it is worth noting that the rigidity of the mesh should be low to allow incorporation and feeding through the nozzle, which therefore hinders the use of this technique with conventional steel bars [16].
Although some of the reinforced 3DcP methods look promising, the approaches are still in preliminary stages, mainly requiring additional versatility to produce vertical and horizontal members in automated manners and complying to relevant international building codes [10,23]. Theoretically speaking, the mechanical behavior of reinforced 3DcP members should not differ from conventionally built ones, whereby the concrete’s relatively low tensile strength and ductility are counteracted by the inclusion of steel reinforcement. Nevertheless, the design concepts and models should be carefully reviewed to account for the 3D printing process, including the shape-related mechanics, anisotropy, weak interfacial layers, and eventual slip and reduced bond strength between the concrete and steel [25,26]. In addition, many design provisions (especially related to shear strength) are semi-empirical, requiring adaptation to fit within the mechanical behavior of 3DcP members [25,27,28].
This paper is part of a comprehensive research project undertaken to develop a versatile modular approach capable of manufacturing 3D printed beam and column members reinforced with conventional steel bars. The experimental program consists of two phases; the first evaluates the compressive and flexural strengths of 3D printed plain (i.e., unreinforced) specimens, including the effect of loading direction (i.e., parallel or perpendicular) with respect to the deposited filaments. The mortar mix design was optimized to achieve moderate thixotropy [8], leading to adequate buildability and interfacial bonding strength between successive filaments. The second phase assesses the shear and flexural strengths of reinforced 3D printed beams built by joining the various modules using high-strength epoxy resins. The transverse steel (i.e., stirrups) was manually incorporated during the printing process, while the flexural steel was inserted in the voids created across the section, and then, grouted after joining the various modules together. Comparison with ACI 318-19 building code provisions at the cracking level and ultimate loading conditions is realized. Such an approach can be of interest to researchers and practitioners seeking the use of 3D printed structural members reinforced with conventional steel bars.

2. Experimental Program

2.1. Materials

Portland cement conforming to ASTM C150 Type I was used; its Blaine surface area, median particle size, and specific gravity were 390 m2/kg, 27.3 μm, and 3.15, respectively. Continuously graded siliceous fine aggregate (i.e., natural sand) complying with ASTM C33 specification was employed; its nominal particle size, fineness modulus, and bulk specific gravity were 4.75 mm, 2.4, and 2.63, respectively. Naphthalene sulphonate-based high-range water-reducer (HRWR) complying with ASTM C494 Type F was used; its specific gravity, sulfate content, and solid content were 1.19, 6.3%, and 38%, respectively. Ribbed (i.e., deformed) steel reinforcing bars with 8 mm and 14 mm nominal diameter were employed as reinforcement; their Young moduli and yield strengths were 210 ± 10 GPa and 480 ± 15 MPa, respectively.

2.2. Mortar Proportions and Properties

As shown in Table 1, the mortar mixture contained 615 kg/m3 cement and 0.43 water-to-cement ratio (w/c). The HRWR was adjusted to ensure cohesive consistency that is suitable for extrusion using the 3D printing machine; a flow of 150 ± 10 mm after 10 drops on the flow table, as per ASTM C230, was selected [8]. This mixture can be considered to have a moderate thixotropy level (i.e., AThix = 0.55 Pa/sec), which would maximize the open time and reduce the loss in interfacial bond strengths between successive filaments [8].
The mixing sequence consisted of homogenizing the sand with half of the mixing water, then gradually introducing the cement, remaining water, and HRWR over 2 min. After a 30 sec rest period, the mixing was resumed for 2 additional minutes. The ambient temperature and relative humidity (RH) during mixing were 23 ± 3 °C and 55% ± 5%, respectively.
The density of 28 days aged specimens was 2090 kg/m3, determined in accordance to the ASTM C642 Test Method [29] (Table 1). The compressive strength (f’c) and flexural strength (fr) determined as per EN 196-1 [30] using 40×40×160 mm prisms were 42.5 and 5.7 MPa, respectively. The specimens were demolded after 24 h from casting, and cured in lime-saturated water until testing age. The pull-off interfacial bond strength between consecutive filaments was 4.1 MPa, determined following the procedure suggested by Sakka et al. [8].
  • Phase 1: Testing of plain (i.e., unreinforced) 3D printed modules
Production of plain modules—A fully automated Computer Numerical Control (CNC) 3D printer was used. The machine is controlled using Linux and Slic3r software that convert 3D models into instructions that are fed into the printer. The extrusion mechanism is due to pressure exerted by a Putzmeister pump connected to the nozzle. Right after mortar mixing, the printing started layer-by-layer at a rate hovering 6 L/min, following the path shown in Figure 1. The fresh mortar was applied at a nozzle standoff distance of 20 mm, while the average width and thickness of the filament sections were 40 and 24 mm, respectively. The nozzle was continuously depositing fresh mortar, and automatically raised by 24 mm when the printing of each layer was completed.
The module had a cross-sectional area of 240×240 mm2 (Figure 1), possessing 4 holes on the corners for subsequent insertion of steel reinforcement and grouting operations, as discussed later. Ten mortar layers were deposited on each other, thus creating a cubic-shaped module with 240 mm each side. The total time needed for printing each module was about 150 ± 10 s. The symmetrical configuration of printed modules could practically be advantageous on construction sites, as it can be rotated left-or-right or upside-down during the erection process. Curing of produced modules started 24 h after printing; the specimens were covered using moist burlap sheets and left in a controlled environment, where temperature ranged between 23 ± 3 °C for a period of 28 days.
Evaluation of compressive strength—The f’c was determined on 3D printed modules, and results compared to cast-in-place (CIP) specimens with similar dimensions. As shown in Figure 2, the 4 holes located on the corners of printed modules were filled using ready-to-use high-early strength and flowable cementitious grout complying with ASTM C928 Type R2 [31]. The grout flow time determined using the modified Marsh cone was about 15 sec, while its 1 and 28 days f’c were 38.5 and 43 MPa, respectively. The grout was allowed to cure and harden for a minimum of 7 days in the 3D printed modules. In the case of CIP specimens, the plywood forms with 240 mm sides were filled and slightly vibrated using a low-frequency poker. The molds were demolded after 24 h, and allowed to cure as earlier described until the testing age.
To evaluate the effect of loading direction, the 3D printed modules were laid either horizontally or vertically in the loading frame of the compression machine. Hence, as summarized in Table 2, the 3D(H) and 3D(V) specimens refer to the direction of module layers in the loading frame, whereby the H and V letters refer to horizontal or vertical direction, respectively. All specimens were capped with sulfur compounds on their respective surfaces to ensure leveling of the contact area for uniform distribution of stresses during loading. The shortening of specimens during the compression loading was monitored using linear-variable differential transducers (LVDTs). The loading was continuously applied at a rate of 0.25 MPa/sec.
Evaluation of flexural strength—As shown in Figure 3, the fr of printed plain specimens was determined by third-point loading [32,33]. The modules were bonded together using high-strength epoxy resin compounds, complying with ASTM C881 Type IV [34]; the setting time and 3 day f’c of the epoxy resin were about 2 h and 52 MPa, respectively. The modules were carefully reversed on top of each other, while keeping the holes aligned for later grouting, as earlier described. The grout was allowed to cure and harden for a minimum 7 days, prior to testing. The length of built specimens was 480 mm (i.e., twice the length of one module), as summarized in Table 2. The control CIP specimens were cast in plywood forms with similar dimensions (i.e., 240 mm2 cross-section and 480 mm length). The mortar was slightly vibrated to ensure complete filling of the form. The specimens were demolded after 24 h, and allowed to cure until testing age.
The lateral surfaces of 3D printed specimens were carefully ground to ensure that the load and support blocks remain parallel to the direction of applied forces at all times during testing. The load was applied continuously without shock at a rate of 1 MPa/min until failure. LVDTs were placed at midspan of the specimens to measure the deflection during loading (Figure 3). The fr was calculated as the ratio between the maximum load indicated by the testing machine multiplied by the length (i.e., 450 mm), divided by bd2 (i.e., 240 mm3).
  • Phase 2: Testing of reinforced bonded 3D printed modules
Production of modules containing transverse steel—Three transverse reinforcing bars (i.e., stirrups) were manually installed during the printing process of each module into predefined layers, as shown in Figure 4. Hence, the 8 mm diameter steel bars were cut and bent in closed forms to fit within the module cross-section with clear cover of 40 mm from each side. The stirrups were installed right after printing the second mortar layer (i.e., just before the nozzle transition to the upper level), then, after the fifth and eighth layers; these correspond to around 48, 120, and 192 mm from the bottom, respectively. The mortar composition and printing configuration (i.e., path, speed, nozzle standoff distance, etc.) were similar to those described earlier.
Insertion of longitudinal steel—After 28 days curing, four reinforced modules were used to build a beam with 960 mm length (i.e., 4×240 mm) and 240×240 mm2 cross-section. As shown in Figure 4, the bonding of adjacent modules placed on top of each other was realized using the high-strength epoxy compound, while ensuring that the 4 holes located across the printed modules would remain aligned for subsequent insertion of longitudinal steel reinforcement. The epoxy resin used for bonding the various modules was left to cure for 3 days. The longitudinal reinforcement consisted of four bars with 14 mm diameter, each inserted in the corner holes and extending throughout the complete beam length. While still in vertical position (as shown in Figure 4), the corner holes were filled using the flowable cementitious grout at a rate hovering 1 min per hole; the steel reinforcement was slightly oscillated to ensure complete encapsulation of the void extending throughout the member. The grout was allowed to cure and harden for 7 days minimum, prior to testing.
The control reinforced CIP specimens were cast in plywood forms with 240 mm2 cross-section and 960 mm length. The longitudinal and transverse reinforcing bars including their arrangement and spacings were similar to those placed in the 3D printed member. The mortar was vibrated to ensure complete filling of the form. The specimens were demolded after 24 h, and allowed to cure until testing age.
Testing by third-point loading—Universal testing machine capable of exerting 500 kN load was used. As schematically shown in Figure 5, the two concentrated equal loads were located at one-third and two-thirds of the 860 mm clear span between the support centerlines. The loads were continuously applied using a steel spreader in increments of 0.02 mm/sec until failure. The crack patterns and widths were monitored during loading, while LVDTs were installed at the center to measure the midspan deflections.

3. Test Results and Discussion

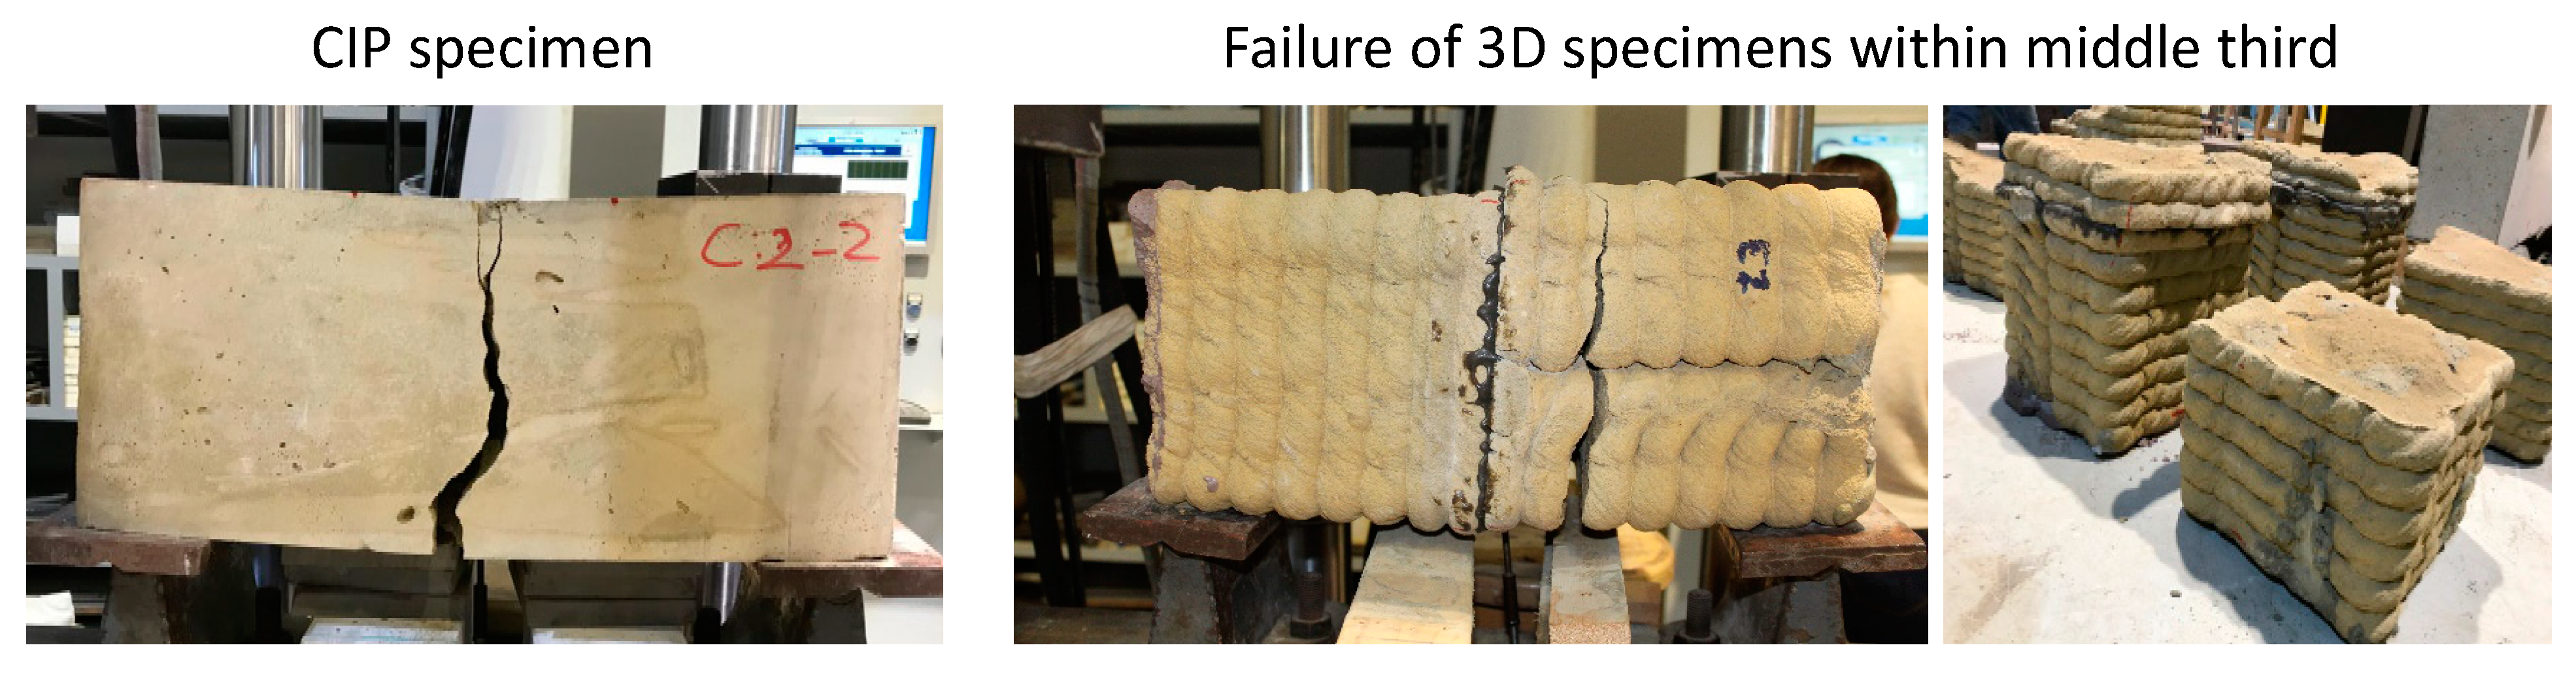
3.1. Compressive Strength of Plain (i.e., Unreinforced) Specimens

The load vs. displacement curves for the various CIP and 3D printed specimens are plotted in Figure 6. As noted earlier, the 3D(H) and 3D(V) refer to the compression load direction with respect to the deposited module layers; hence, the load in the H-specimens is perpendicular to the deposited layers, while the load is parallel in the case of V-specimens. Table 3 summarizes the f’c values were determined by dividing the ultimate load at failure by the specimen cross-section (i.e., 240×240 mm2) and secant modulus of elasticity (E) was determined at 40% of ultimate load; the resulting averages and their coefficients of variation (COV) are also given.
The average f’c and E values for CIP specimens were 22.8 MPa and 5.31 GPa, respectively, with COV of 6.1% and 28.4%, respectively. It is worth noting that f’c of CIP specimens determined following EN 196-1 standard using 40×40×160 mm prisms was considerably higher; it was equal to 42.5 MPa (Table 1). This can be directly attributed to the size of tested specimens, whereby larger ones contain higher amounts of flaws in their matrices that could induce failure at lower stress [35,36]. Perrie [37] explained that the flaws rapidly propagate within the matrix at increased stresses to increase the number and size of micro-cracks that could reduce the resistance against compressive loading. The bigger the specimen, the higher probability of such flaws, causing reduced compressive strengths. On the other hand, it should be mentioned that the relatively low E value of 5.31 GPa resulted from the absence of coarse aggregates in tested mortars, when compared to concrete mixtures possessing equivalent compressive strengths [36,38].
As shown in Figure 7, the CIP specimens failed in a triangular-like manner, creating failure surfaces at approximately 20 to 30 degrees from the load direction. Such failure patterns are common in moderate-strength concrete and mortar specimens with cubic geometry [35,39]. During loading, Ince and Arici [39] reported that the frictional effects between the machine platens and specimen ends produce lateral stresses with subsequent plastic deformations that place the material under multi-axial states of stress. This causes the material to deform outwards, and the compressive stresses created at the edge of the flaws induce tensile stresses, which initiate fracture.
The average f’c considerably increased from 22.8 MPa for CIP specimens to 30.8 MPa for 3D(H) ones; the corresponding E values were fairly close to each other (i.e., 5.31 vs. 5.76 GPa). Similar results were obtained by Panda et al. [40] when testing 3D printed specimens loaded perpendicularly to the deposited filaments, which was attributed to the pressure extrusion that helped reduce the voids and weak interfaces in the system. The increase in f’c recorded in this study can concurrently be related to the high-strength grout that was injected in the holes across the four edges of the module cross-section, parallel to the loading direction. Such highly flowable grouts could infiltrate inside the voids to create a denser, well compacted structure that is capable of resisting a higher multi-axial state of stress and retarding the spalling phenomenon at the edges of the specimen [41]. Just like the CIP samples, the 3D(H) specimens failed in triangular-like manner (Figure 7).
The 3D(V) specimens loaded in the direction of the deposited filaments exhibited lower f’c than the 3D(H) ones (i.e., 26.9 vs. 30.8 MPa, respectively), albeit remained higher than the CIP samples (i.e., 22.8 MPa). This practically reflects that the 3D(V) modules tend to act like vertically-layered materials with vertical planes of weakness created along the interfacial filaments during printing. During loading of such modules, it is accepted that the stress and crack patterns would follow the path of least resistance, causing the formation of fracture planes and debonding between adjacent layers [37,39,42]. This can be clearly noticed in the fracture patterns (Figure 7), where the outer layers were detached from the inner core. The resulting E value dropped significantly to 2.29 GPa, reflecting higher ductility of 3D(V) specimens (Figure 6).

3.2. Flexural Strength of Plain (i.e., Unreinforced) Specimens

The load vs. displacement curves determined by third-point loading for the CIP and 3D printed modules are plotted in Figure 8. The fr measurements determined on CIP specimens were very close to each other (Table 4), having an average of 1.1 MPa and COV of 0.78%. Such values are, however, about five times lower than the flexural strength determined following the EN 196-1 standard using 40×40×160 mm prisms (Table 1). Just like the compressive strength results, this can be directly related to the size of specimens, whereby larger ones contain higher amounts of fissures and flaws in their matrices that could induce failure at lower stresses [35,37]. On the other hand, the fr measurements were about 2.5 times lower than those resulting from ACI 318-19 Equations (9)–(10) given as f r = 0.62   f c , which can be attributed to the absence of coarse aggregates that favor micro-crack development under tensile loading, leading to reduced strength [23,34,35].
As summarized in Table 4, the 3D printed specimens exhibited about 30% higher resistance to tensile loads; the average fr reached 1.62 MPa with COV of 6.6%. During flexural testing of plain concrete, it is well established that when the tensile stresses are still low (i.e., less than fr), the entire cross-section resists bending, with compression on one side and tension on the other [10,43]. As the load is increased, cracks begin to develop at the bottom and quickly spread up to the vicinity of the neutral axis, causing the beam to rupture [44]. In this mechanism, it is believed that the initiated cracks in the tension zone are arrested by the high-strength grout that is injected in the direction of bending throughout the complete length of the 3D modular beam. This would hinder the ease of crack propagation and prevent them from growing further, causing increased fr measurements. Additionally, it should be noted that the curing of CIP specimens (especially given their relatively large size) may have detrimentally altered strength development, causing the formation of shrinkage micro-cracks that weaken the matrix in compression as well as in tension. In contrast, the inner core of the 3D modules received better curing, owing to the four holes created during printing, which resulted in higher f’c and fr measurements.
As shown in Figure 9, failure of CIP and 3D specimens occurred within a 50 mm band from the center—i.e., within the middle third of the beam. The cracks in 3D samples initiated at the interfacial region of the second filament, with respect to the epoxy bonded region. The failure caused separation between the two overlaying mortar filaments, and propagated randomly throughout the adjacent planes. The epoxy resins remained intact, reflecting adequate bonding strength between the two 3D printed modules.

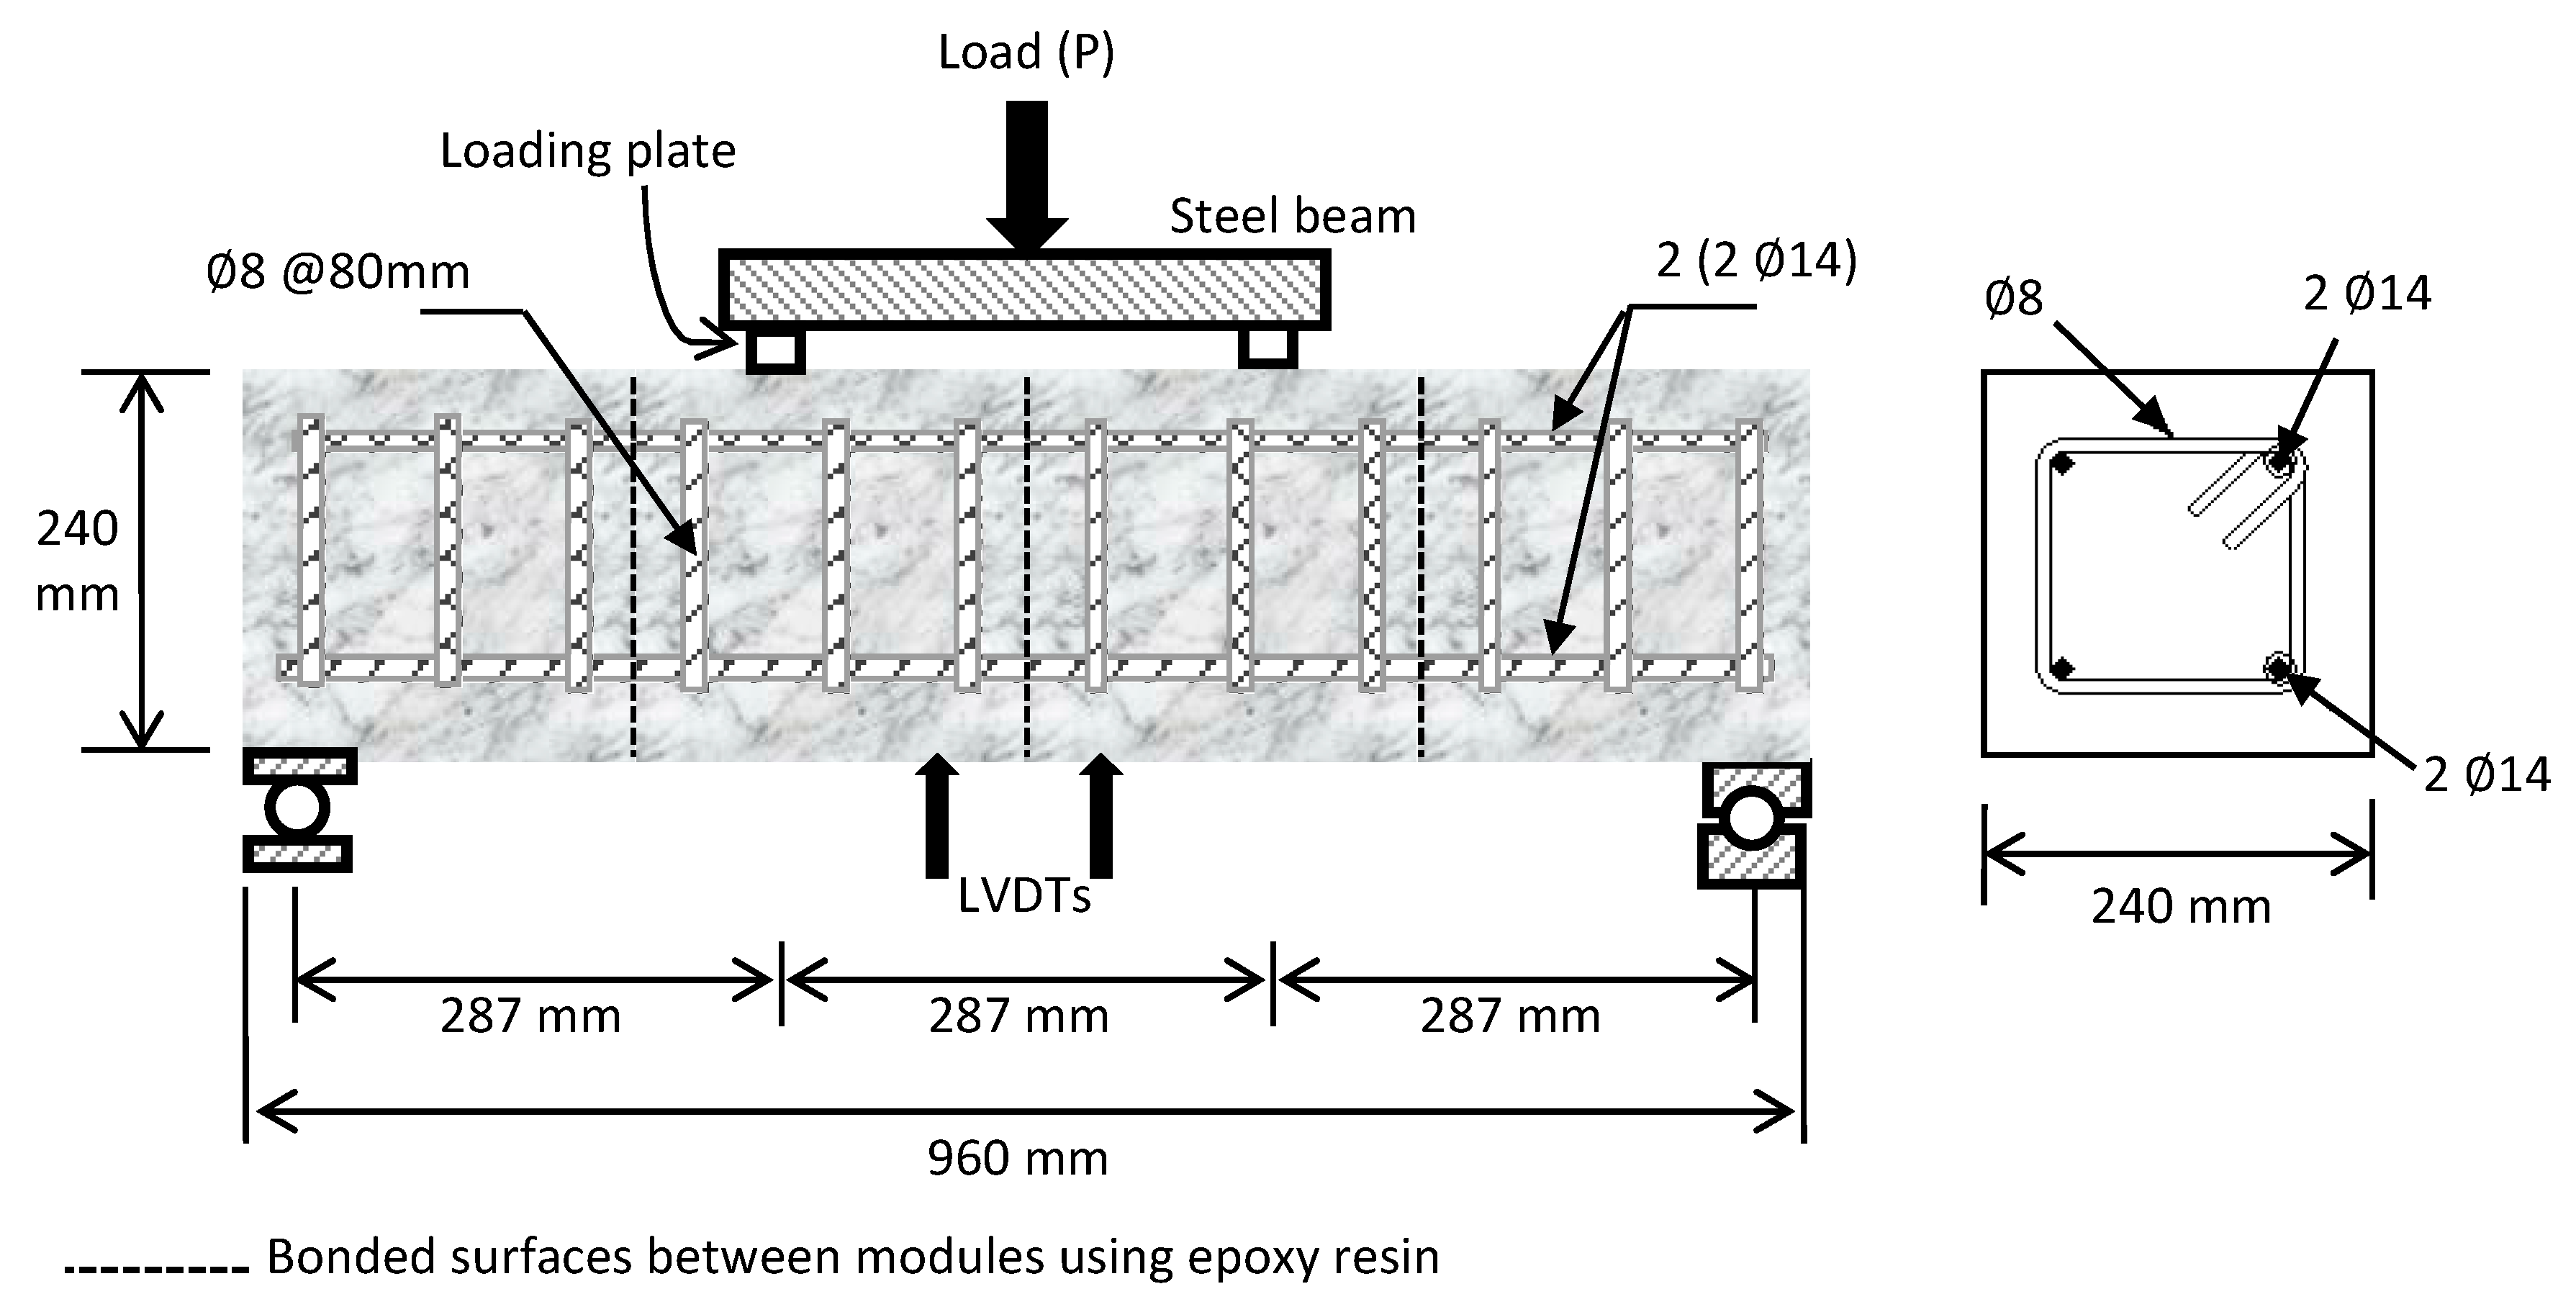
3.3. Flexural Strength of Reinforced 3D Specimens

3.3.1. Theoretical Moment and Shear Strength According to ACI 318-19 Code Provisions

The cracking moment (Mcr) denotes the tensile bending stress at which concrete starts to crack. It can be obtained based on the beam’s gross section properties (i.e., neglecting reinforcement), as follows:
M cr = f r   I g y t
where fr, Ig, and yt refer to the modulus of rupture (or flexural strength determined from Section 2), moment of inertia about the centroidal axis (276.48×106 mm4), and distance from the centroidal axis to the tension face (240/2 = 120 mm), respectively. When the tensile bending stress exceeds fr, the inclusion of steel reinforcement becomes necessary to prevent potential failure due to shear and flexural mechanisms. According to ACI 318-19 [23], the member’s theoretical shear strength (Vn) and flexural moment (Mn) can be expressed as:
V n = V c + V s = 1 6   f c   b   d + A v   f y   d s
M n = A s   f y   ( d a 2 )
In diagonal shear, the Vc and Vs refer to the shear provided by concrete and shear provided by vertical reinforcement (i.e., stirrups), respectively. The Av (2 × 50.24 = 100.48 mm2) and s (80 mm) refer to the cross-sectional area for stirrup crossing the crack and average center-to-center spacing, respectively. The b (240 mm), d (180 mm), a, and As (2 × 153.86 = 307.7 mm2) refer to the width of the beam, effective depth, depth of the equivalent rectangular stress block found by the quadratic equation, and cross-sectional area of flexural (i.e., longitudinal) steel reinforcement, respectively. The tensile steel percent ratio was moderate ( ρ = A s / b   d = 0.71 % ), as compared to ACI 318-19 minimum and maximum permissible rates of 0.33% and 1.58%, respectively.

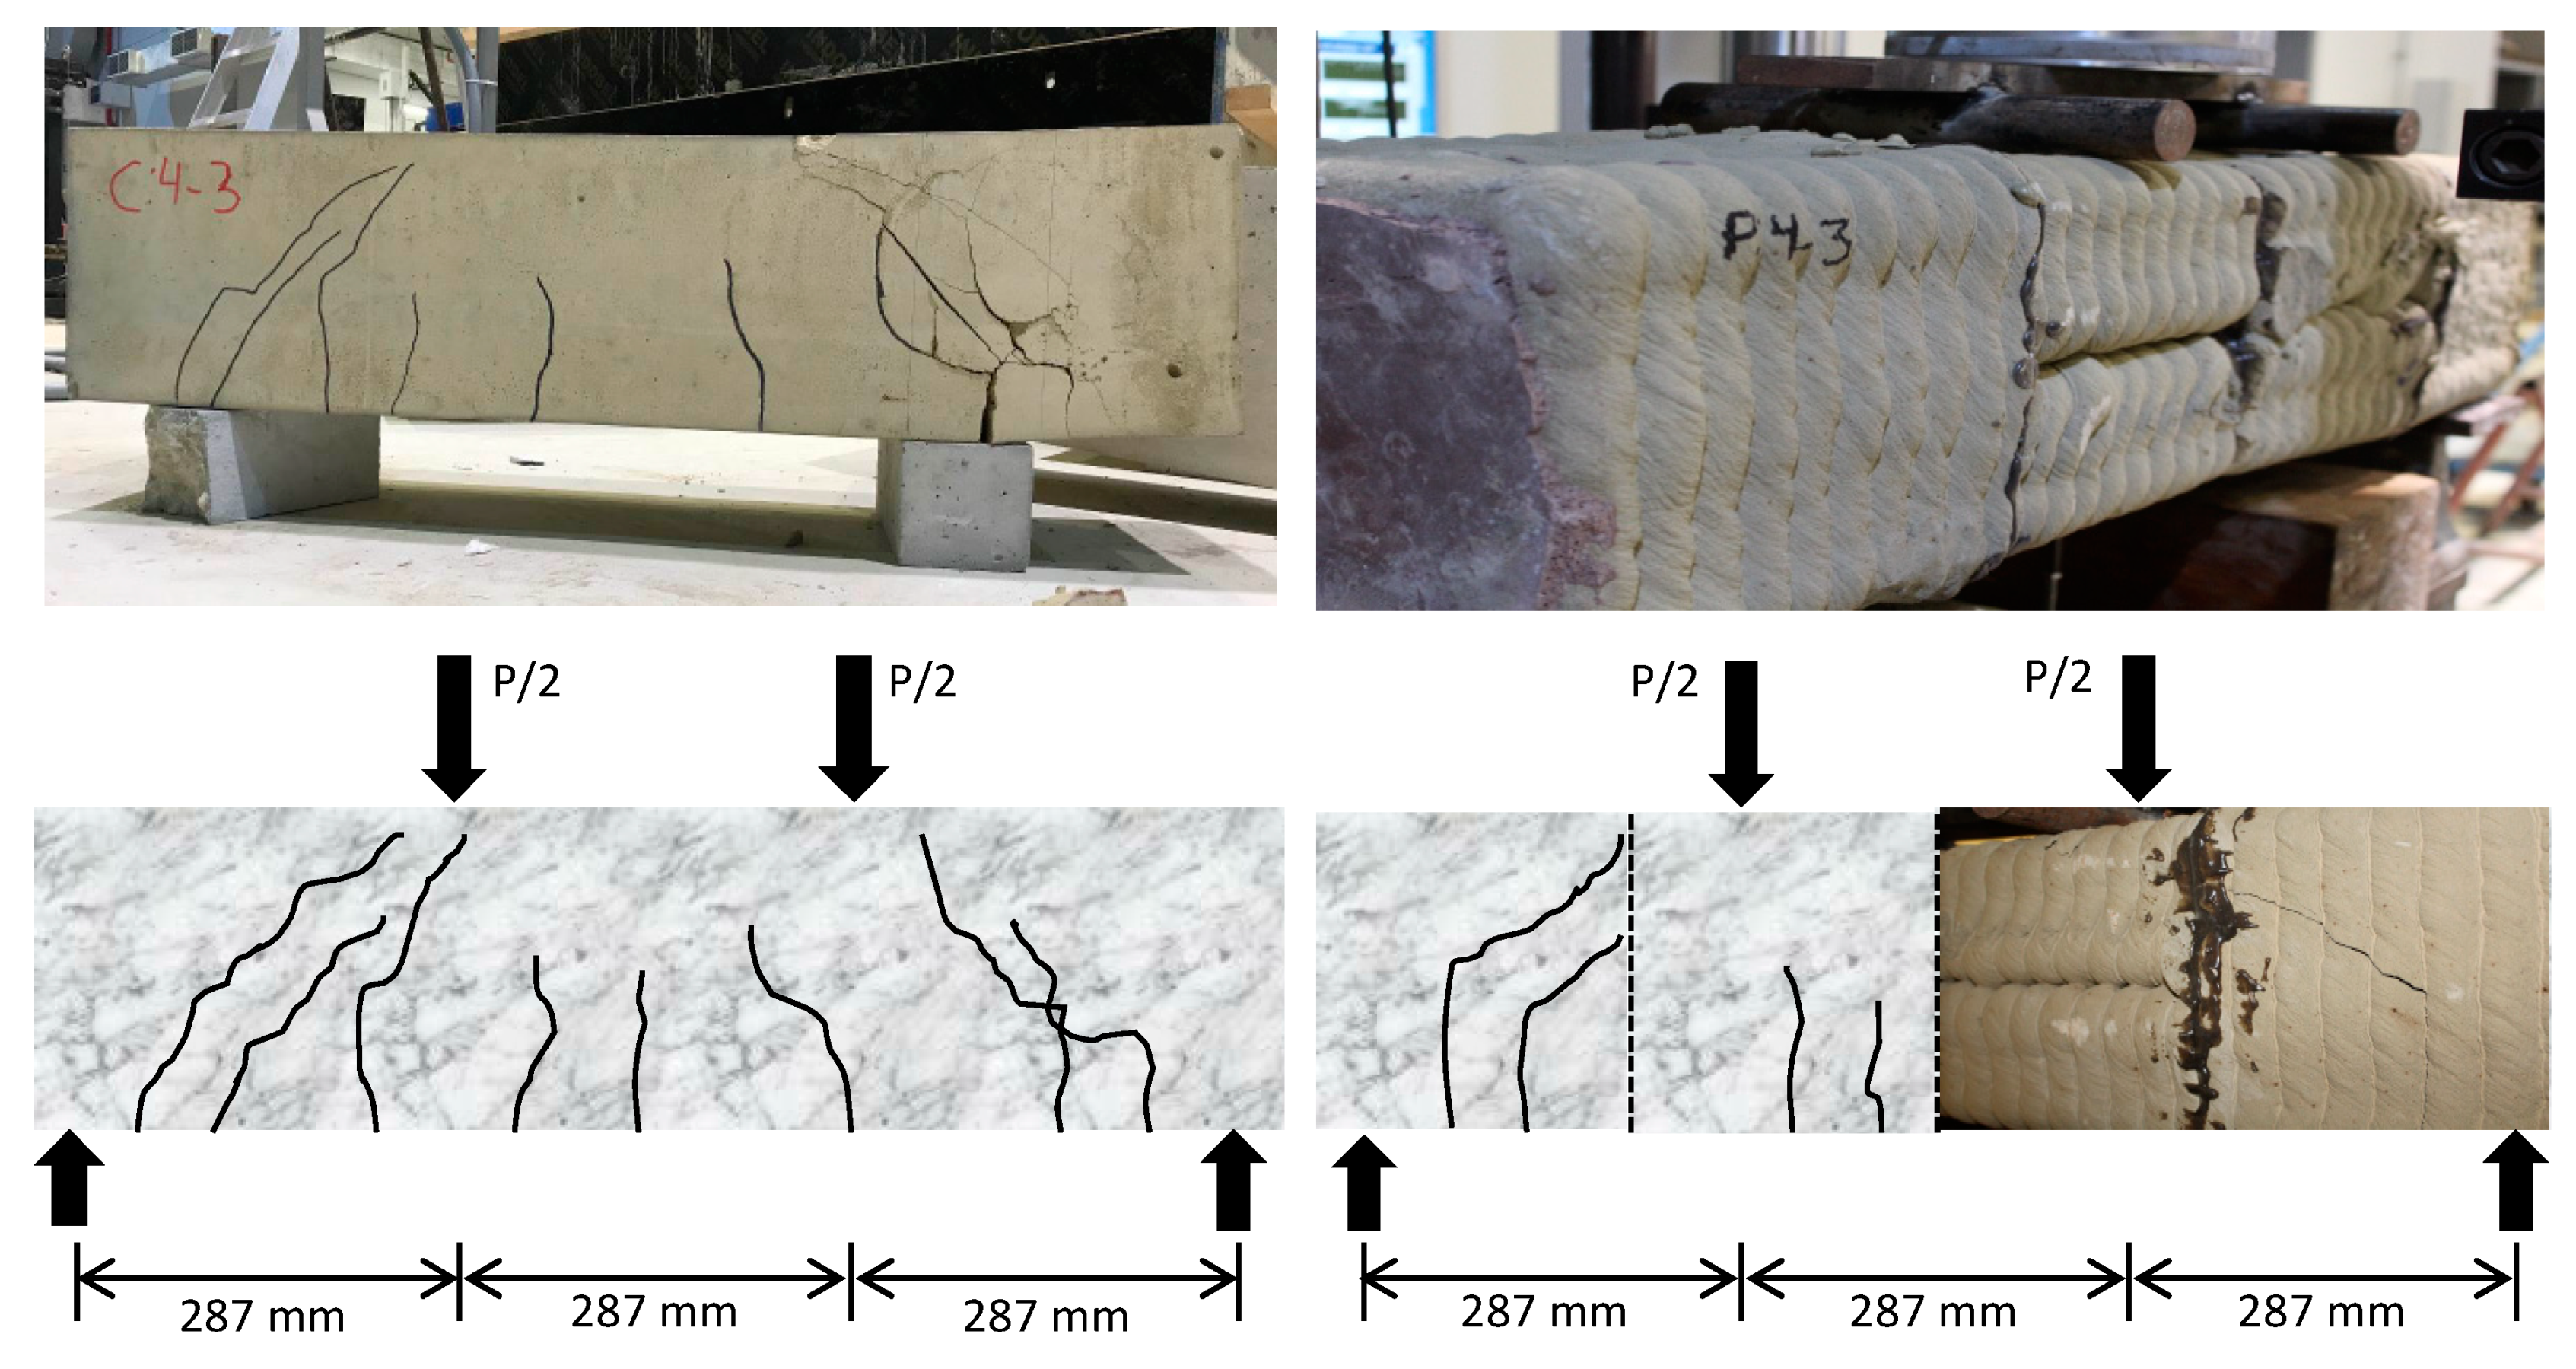
3.3.2. Failure Patterns

Flexural cracks were initially formed within the constant-moment region (i.e., near midspan) in both CIP and 3D specimens. As shown in Figure 10, three to four flexural cracks were observed, while their size did not exceed 0.2 mm at failure. The diagonal shear cracks were developed within the constant-shear regions, almost symmetrically at opposite support zones. In the case of CIP specimens, the diagonal cracks appeared when the load reached approximately 24%–31% of the maximum load registered at failure. Such cracks propagated from the support towards the compression face near the applied load, and their width widened considerably up to 4.6 mm at failure.
The diagonal cracks in 3D specimens appeared at a slightly higher load corresponding to about 34% of the maximum one, suggesting that the consecutive filaments and injected grouts were efficient to delay the formation of cracks, or at least, arrest their growth. Initially, as shown in Figure 10, the formed cracks moved vertically along the interfacial filament region, which then changed orientation to become inclined crossing several consecutive filaments. The change in crack path is due to the horizontal component of the flowing shear force (i.e., the component perpendicular to the principle axis) that becomes higher than the interfacial shear capacity between the adjacent filaments. The so-formed inclined cracks stopped propagation after intercepting the epoxy resins that bonded the 3D modules together. Knowing that the fabricated beams are under-reinforced, yielding of tensile steel reinforcement was initiated before crushing of the concrete compression zone. Failure, however, occurred due to disintegration of the confined mortar near the supports.

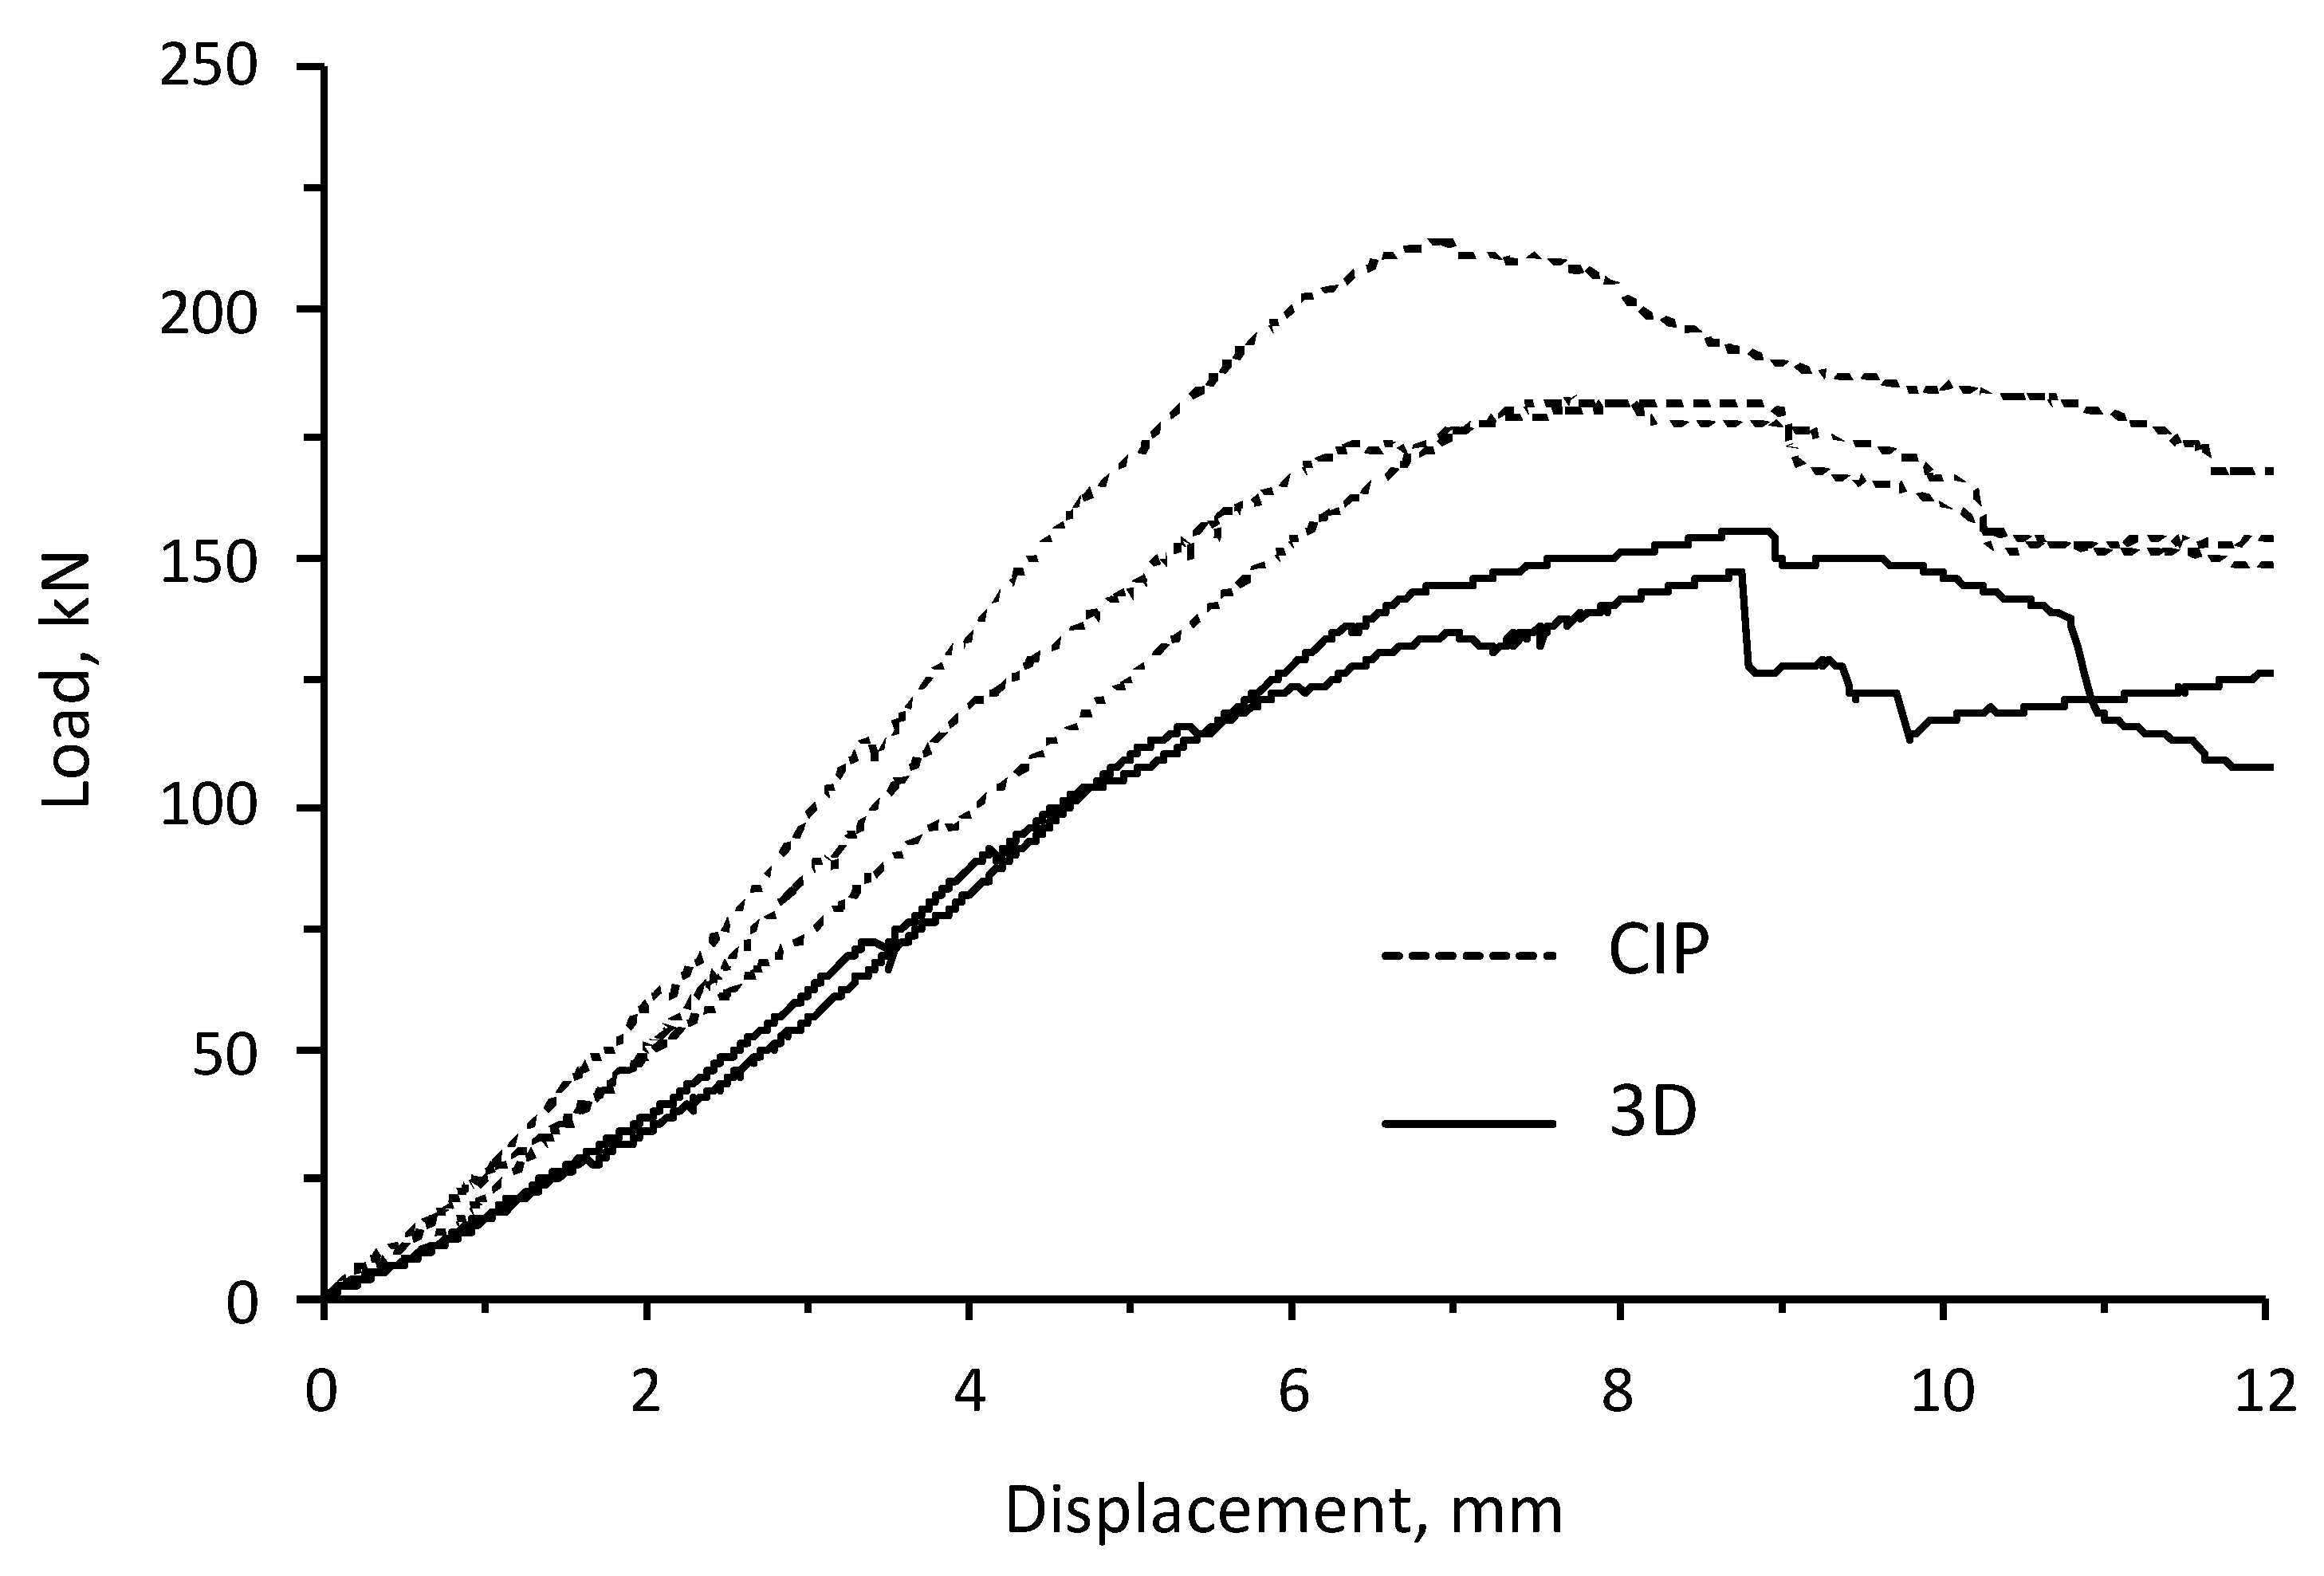
3.3.3. Experimental Testing and Comparison with ACI 318-19 Code

Generally speaking, the load vs. displacement curves of various CIP and 3D specimens exhibited an initial linear elastic portion, followed by an almost stabilizing branch at maximum load, and then, a descending part after the peak load (Figure 11). Table 5 summarizes the loads recorded when the first flexural and then, first diagonal cracks were observed during loading as well as the maximum load registered at failure. This table also presents the theoretical Mcr, Vn, and Mn determined using ACI 318-19 code provisions; the f’c values that resulted from 3D(V) specimens were used for calculations, given that the applied load is parallel to the deposited filaments of the 3D printed modules. The resulting experimental-to-theoretical moments and shear strength ratios are computed, along with their COV values, and plotted in Figure 12.
Analysis based on Mcr—The average MExp/Mcr ratio that resulted from CIP specimens was 1.26, with 6.1% COV. The increase in MExp (compared to Mcr) can be attributed to the presence of reinforcing bars placed in the compression zone together with the transverse steel that confine the material and enhance its strain capacity before the initiation of flexural cracks [45,46]. As summarized in Table 5, the load that initiated the first flexural crack in 3D specimens was about twice higher than the one resulting from CIP, which remarkably increased the MExp/Mcr ratio to 1.75. Such result is in line with the fr measurements conducted on plain specimens in Section 2. In addition to the presence of steel reinforcement [25,45], as earlier explained, this phenomenon can be related to the injected high-strength grout that strengthened the tension zone of the 3D printed members. Such grout is expected to encapsulate the narrow openings and crevices created between the successive filaments during printing, which would retard the formation of flexural cracks during loading. It should be noted that the flexural cracks in 3D members might have occurred at lower loads, owing to the circular nature of the nozzle used; however, these cracks were not visible during experimentation.
Shear strength analysis—Irrespective of specimen type, the loads that initiated the development of diagonal cracks varied from 50 to 56 kN. This led to fairly close average VExp/Vn ratios corresponding to 0.76 and 0.71 for CIP and 3D specimens, respectively, with COV values of 3.8% and 4.5%, respectively. This physically implies that the theoretical shear strengths computed using ACI 318-19 code provisions overestimate the loads determined experimentally. Generally, the shear transfer in moderately reinforced concrete beams is partly ascribed to the coarse aggregate interlock mechanism [43,47]; i.e., the friction developed due to interlocking of aggregate particles located on the concrete surfaces on opposing sides towards the mid-height of the beam. Hence, given that the tested mortar mixtures were free from coarse aggregates, this can reduce the aggregate interlock mechanism with increased vulnerability to the formation of diagonal cracks, leading to reduced VExp/Vn ratios. It is worth noting that the shear reinforcement does not affect the development of diagonal cracks, as these generally occur at almost the same loads for which they appear in beams of the same size without stirrups; the presence of shear reinforcing becomes relevant only after the cracks begin to form [23,25,47].
Flexural moment analysis—After the initiation of diagonal cracks, the load continued increasing with displacement until reaching the peak values, causing the members to fail in shear. Such shear failure is most likely to occur in short, deep members subjected to high shear levels and relatively small bending moments [10]. The experimental loads that caused failure in CIP specimens varied from 181.3 to 214.3 kN (i.e., MExp from 26 to 30.7 kN.m), which led to MExp/Mn ratios varying from 1.14 to 1.35, respectively. This reflects that ACI 318-19 provides conservative estimate for the flexure capacity at failure. In addition to the size of members, many researchers attributed such conservatism to the presence of steel bars placed in the compression zone together with the lateral ties that help enhancing the ductility of the beam and boosting its capacity to sustain higher loads [45,46]. As shown in Figure 11, the load vs. displacement curves exhibited relatively flattened regions after the peak load value, reflecting the yielding of tensile steel [47].
The 3D printed members exhibited almost similar behavior as those experienced with CIP, albeit the peak loads were relatively lower. Hence, the experimental loads that caused failure were about 150 kN (i.e., MExp = 22.8 kN.m), which is about 22% lower than CIP specimens. The reduced capacity of 3D specimens could reasonably be attributed to the modular approach used to construct the members including the exact positioning of longitudinal/transverse steel that affect beam properties and their effect on the concepts of reinforced concrete design (such as computation of b, d, s, Av, a, etc.). On the other hand, the assumptions of perfect bonding between the successive filament layers and/or adjacent modules connected by epoxy resins are not assured in 3D specimens, which could alter the linearity of the strain diagram and transfer of stresses between the tensile steel and surrounding region filled by grouting [10,45,48]. Additionally, when the compressive stresses exceed about ½ f’c, it is not guaranteed whether the tensile cracks would be affected by the deposited 3D filaments and how this could alter their upward propagation towards the neutral axis. The average MExp/Mn ratio of 3D printed members was equal to 0.95 (Figure 12), reflecting limited decrease in flexural moment capacity (i.e., by 5%) compared to ACI 318-19 code provisions.

4. Conclusions

This paper presents the preliminary findings of a versatile 3D printing approach that involves joining cubic-shaped printed modules using high-strength epoxy resins to form reinforced beams intended for structural applications. The printed modules had 240 mm side, along with four holes on the corners for subsequent insertion of flexural steel and grouting operations. The transverse steel was manually incorporated during the printing process. Future studies aim at altering the module cross-sections to simplify the 3D built members as well as their testing in compression to simulate column and wall elements. From the foregoing, the following conclusions can be warranted:
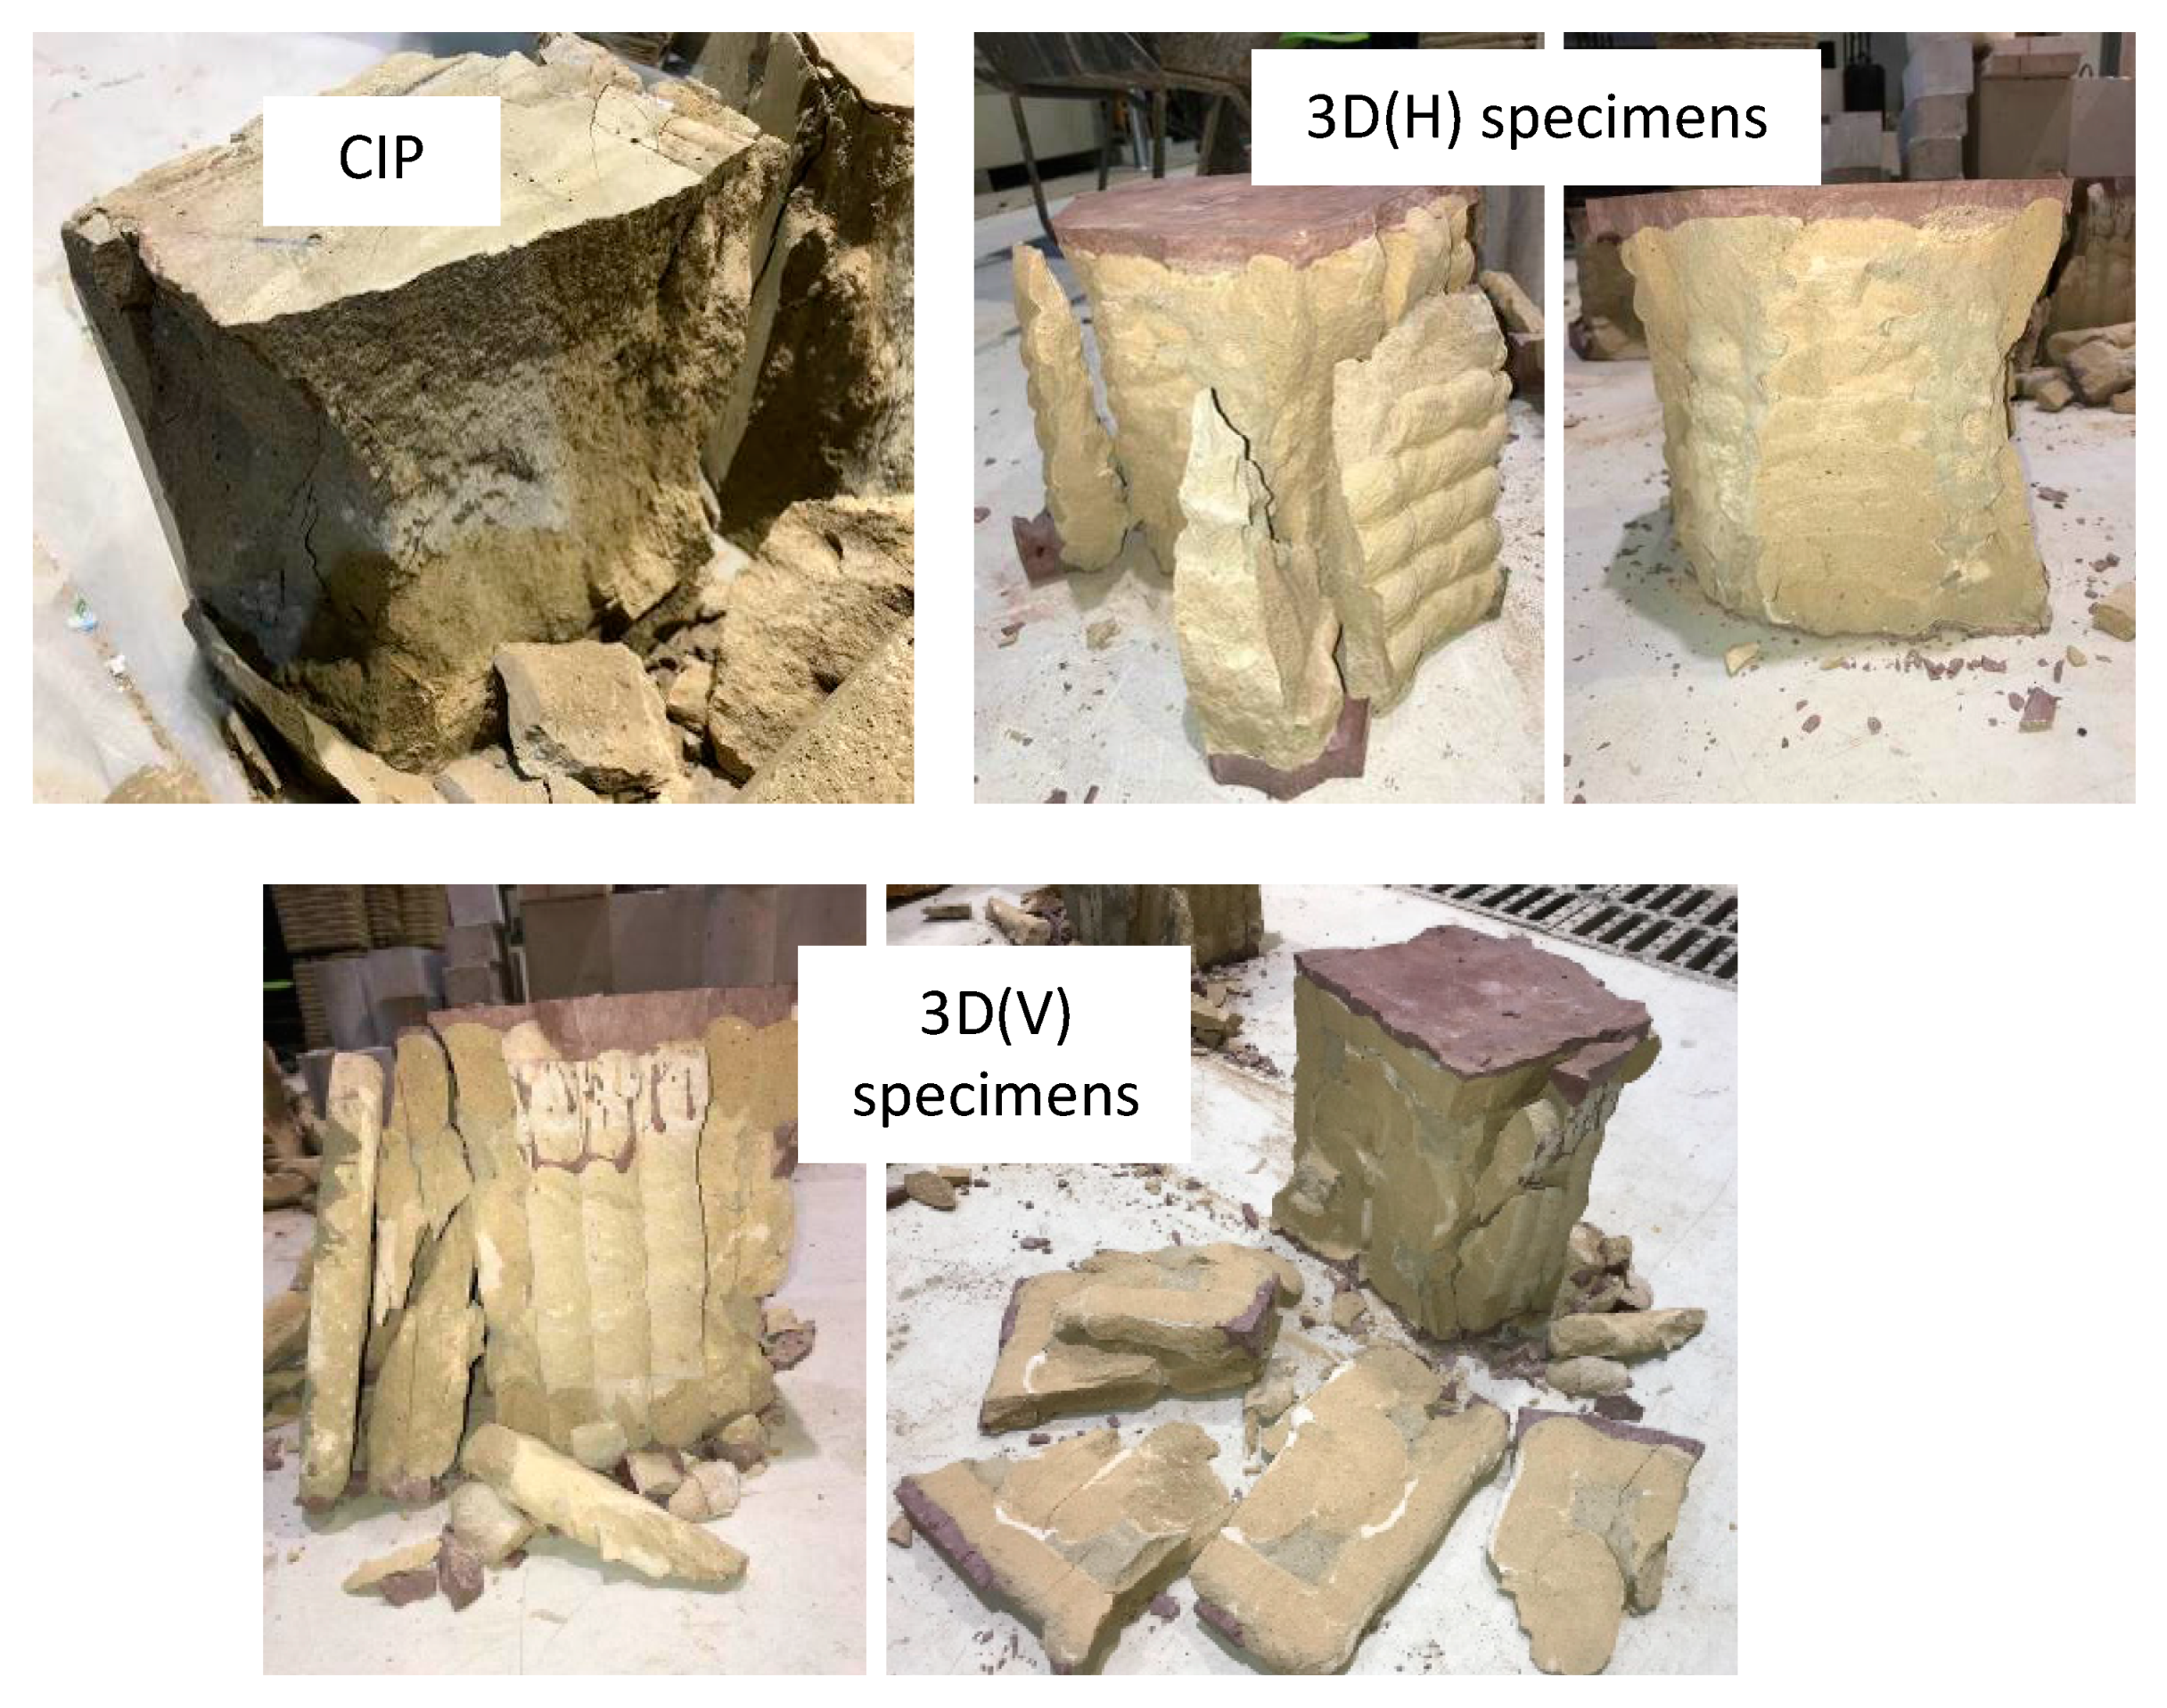
  • The average f’c considerably increased from 22.8 MPa for CIP specimens to 30.8 MPa for 3D(H) ones with the deposited layers parallel to the loading platens. Similar results were obtained by Panda et al. [40] when testing specimens loaded perpendicularly to the deposited filaments. This was attributed to the injected high-strength grouts in the holes and crevices across the module cross-section, thus ensuring a stronger matrix capable of resisting higher multi-axial stresses that retard the spalling phenomenon. Just like the CIP samples, the 3D(H) specimens failed in a triangular-like manner.
  • The 3D(V) specimens loaded perpendicularly to the loading platens exhibited lower f’c than the 3D(H) ones (i.e., 26.9 vs. 30.8 MPa, respectively), albeit remained higher than the CIP samples (i.e., 22.8 MPa). During compressive strength loading, the 3D(V) modules acted like vertically-layered materials with vertical planes of weakness created along the interfacial filaments during printing. This caused the debonding between adjacent printed filaments, which detached the outer ones from the inner core.
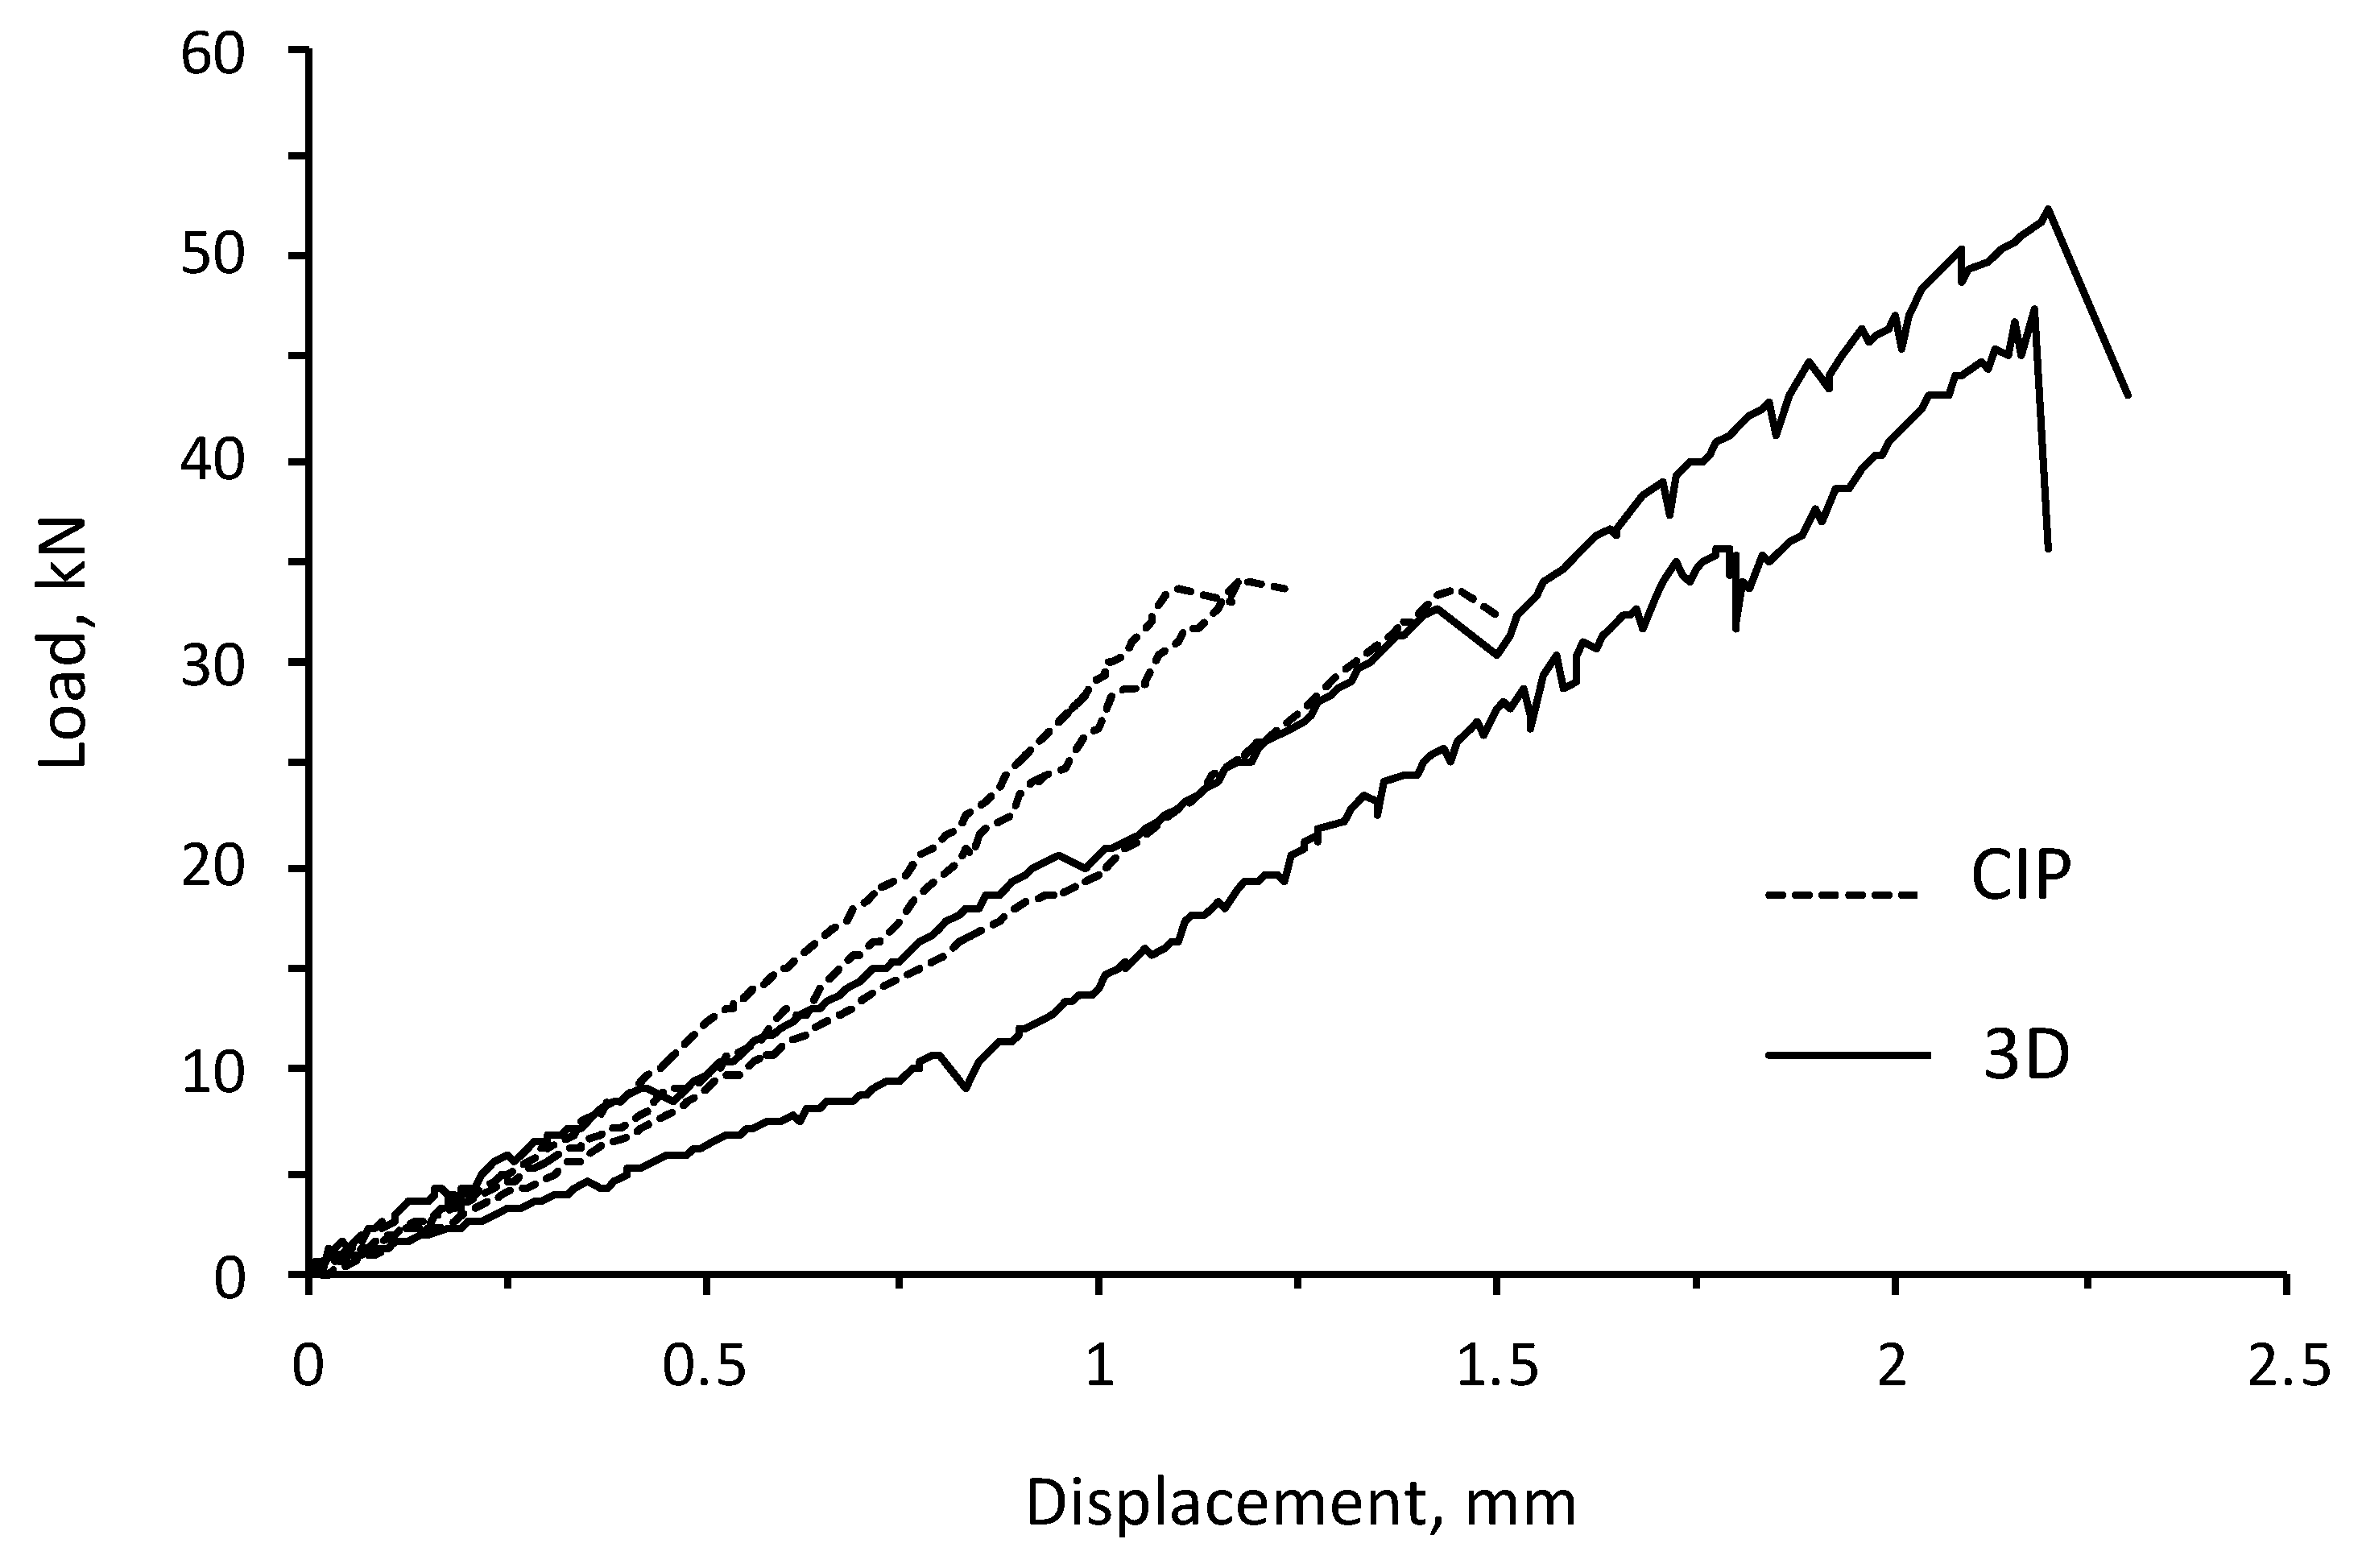
  • Compared to CIP samples, the 3D printed plain specimens exhibited about 30% higher fr responses. This was related to two phenomena, including the presence of high-strength grouts that hinder the ease of tensile crack propagation during loading as well as efficient curing of 3D printed modules that minimize the formation of shrinkage micro-cracks. Failure cracks of 3D bonded modules occurred along the adjacent planes within a 50 mm band from the center, and propagated randomly throughout the complete specimen height.
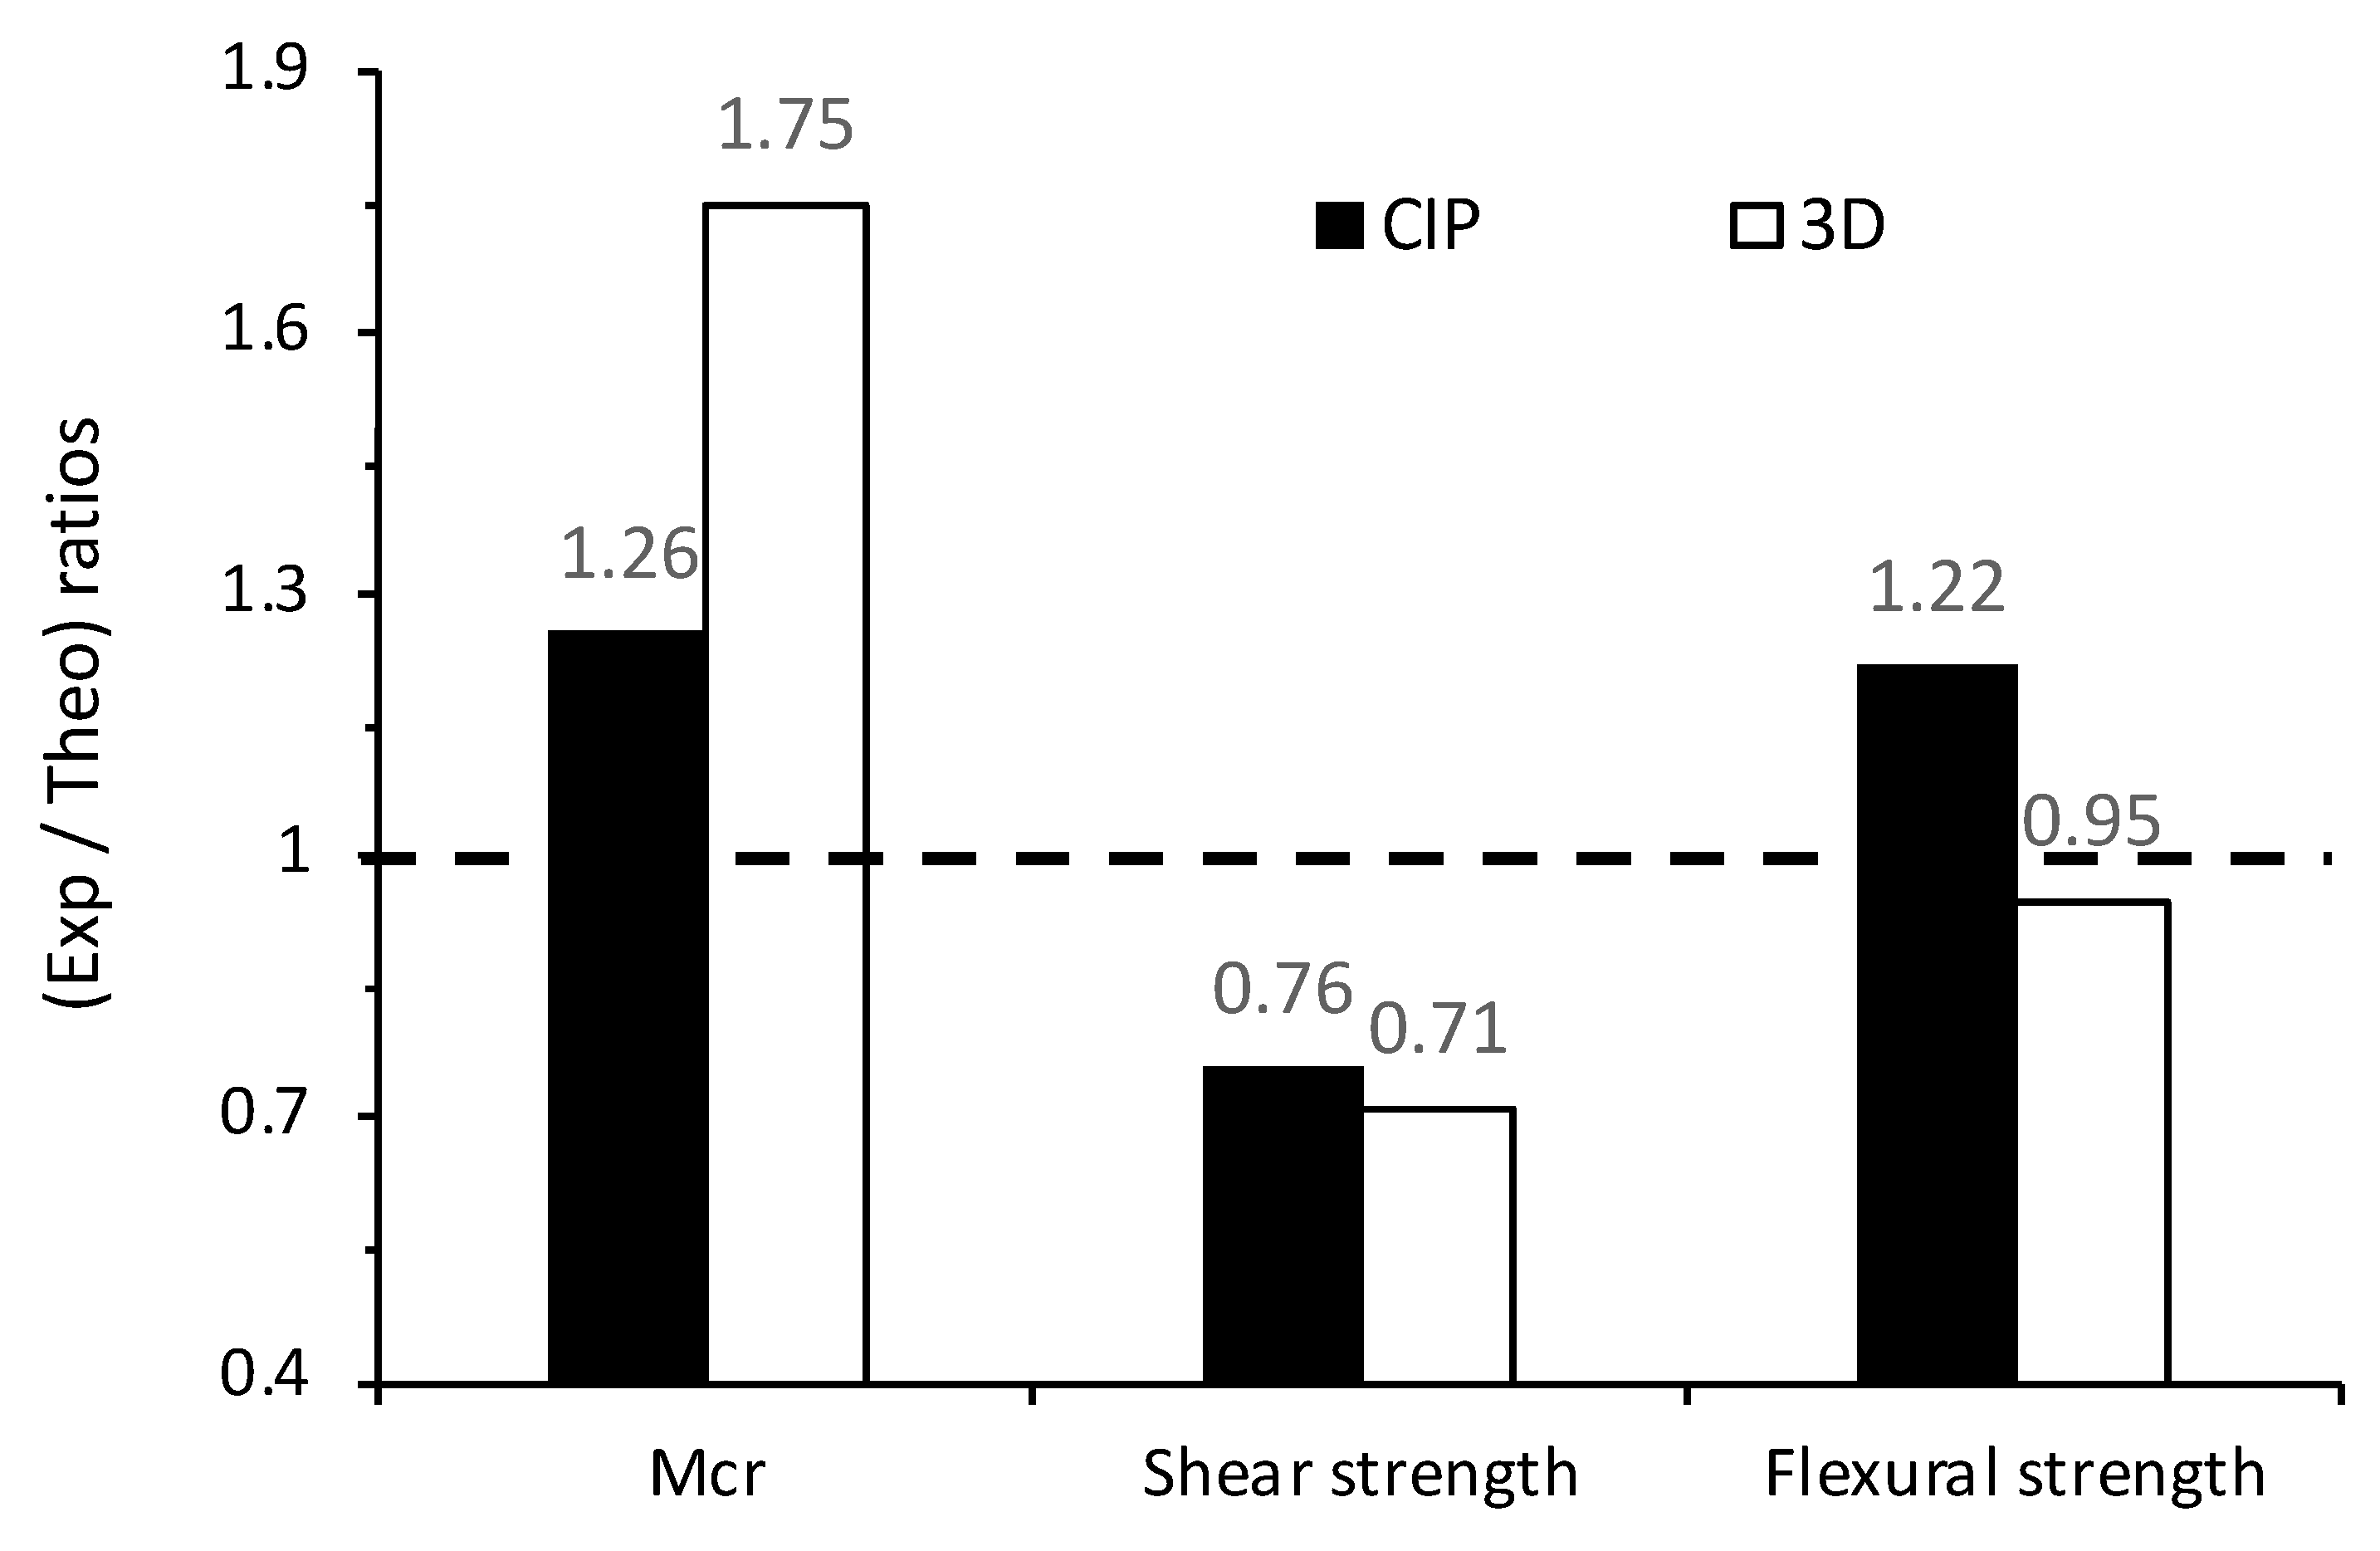
  • The cracking moment determined when the applied load initiated the first flexural crack in the reinforced 3D printed beams was about two times higher than the one resulting from CIP samples. This result is in agreement with the fr measurements (i.e., conclusion no. 3), which was attributed to the injected high-strength grout that encapsulates the narrow openings and crevices created between the successive filaments during printing, thus strengthening the tension zone of the 3D printed members.
  • The loads that initiated the development of diagonal cracks in CIP and 3D printed members are fairly close to each other, which was attributed to the aggregate-free mortar mixtures that reduce the aggregate interlock mechanism, causing increased vulnerability to the formation of diagonal cracks. The average VExp/Vn ratios varied from 0.71 to 0.76, reflecting that the ACI 318-19 code provisions overestimate the loads determined experimentally.
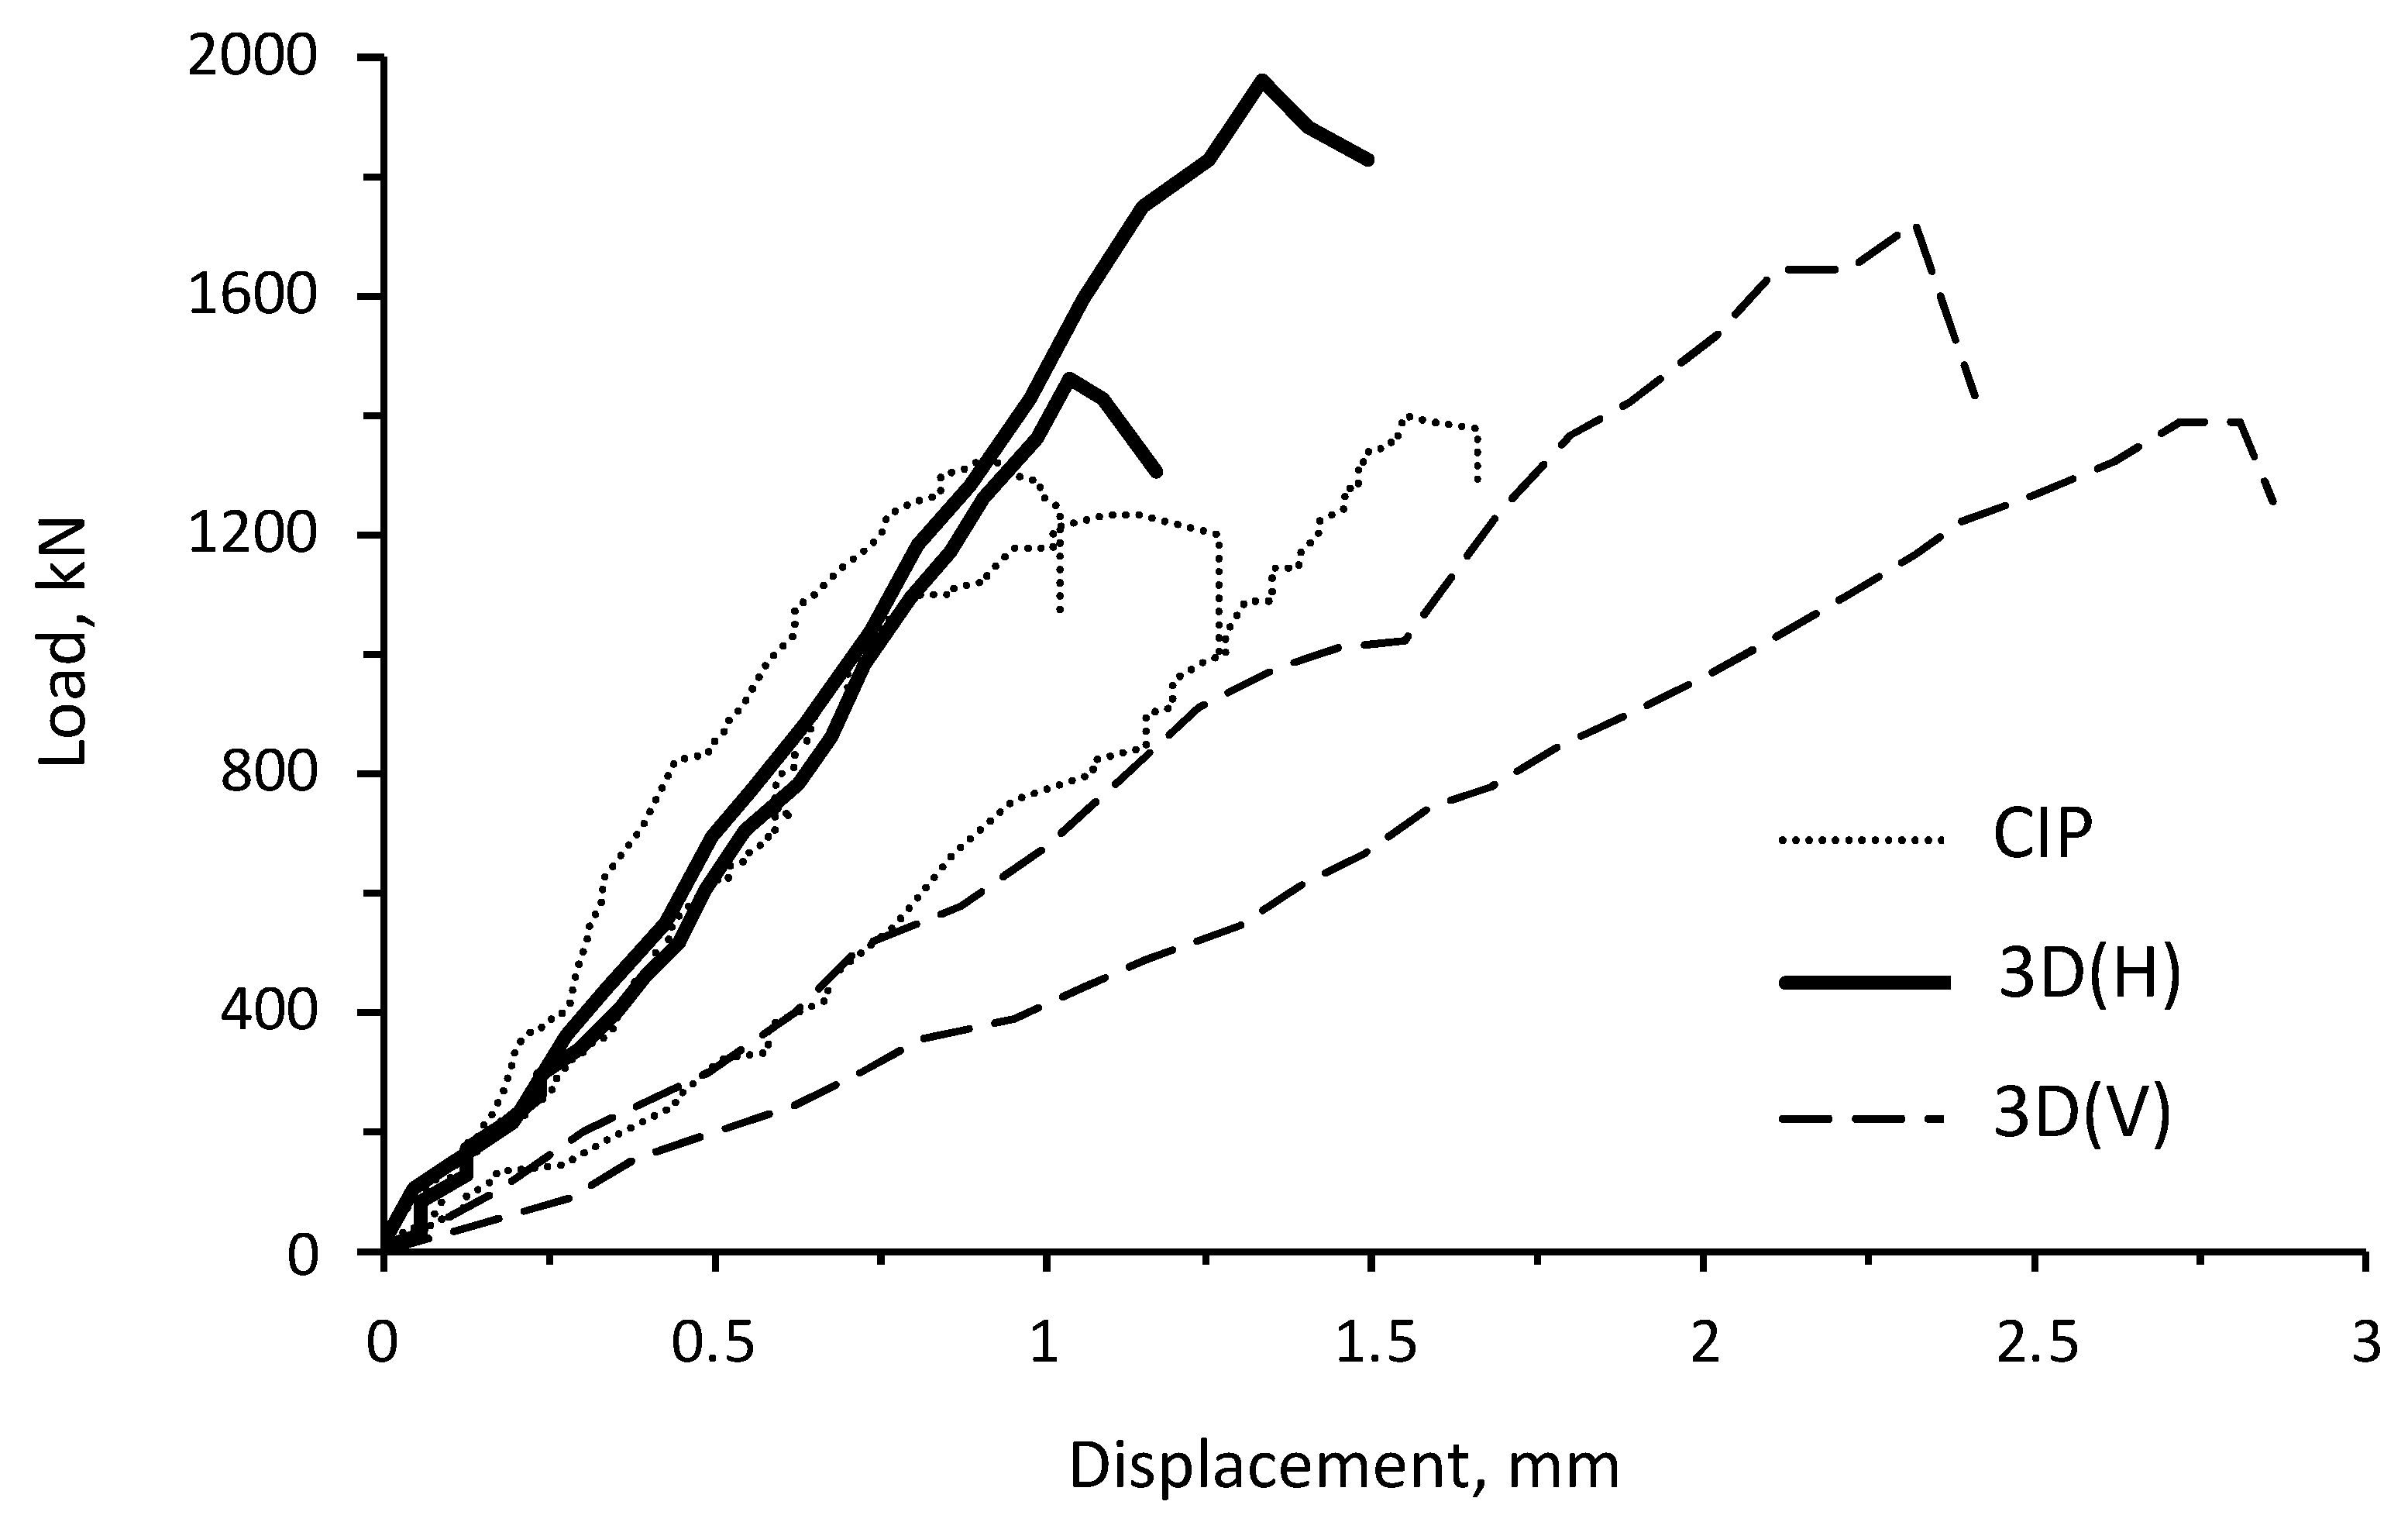
  • The ACI 318-19 provisions for flexural strength were conservative for CIP members, leading to an average MExp/Mn ratio of 1.22. The 3D printed members exhibited almost similar load vs. displacement curves as those experienced with CIP; however, with reduced peak loads that resulted in an MExp/Mn ratio of 0.95. This was most likely attributed to the modular approach used to construct the 3D member, including the printing of modules, bonding with epoxy resins, insertion of steel reinforcement (horizontal and transverse), and injection of grouts. This would alter the fundamentals of reinforced concrete design, requiring careful analysis of the transfer and redistribution of stresses at service and ultimate load conditions.

Author Contributions

Conceptualization, J.J.A. and F.H.; methodology, J.J.A., A.A.Y., and F.A.; software, A.A.Y. and F.A.; validation, A.A.Y. and F.A.; formal analysis, J.J.A. and F.H.; investigation, F.H. and A.A.Y.; resources, F.H.; data curation, A.A.Y. and F.A.; writing—original draft preparation, J.J.A., A.A.Y., F.A., and F.H.; writing—review and editing, J.J.A.; visualization, F.H.; supervision, J.J.A. and F.H.; project administration, J.J.A. and F.H.; funding acquisition, F.H. All authors have read and agreed to the published version of the manuscript.

Funding

This research received no external funding.

Conflicts of Interest

The authors declare no conflict of interest.

References

  1. Buswell, R.A.; Leal de Silva, W.R.; Jones, S.Z.; Dirrenberger, J. 3D printing using concrete extrusion: A roadmap for research. Cem. Concr. Res. 2018, 112, 37–49. [Google Scholar] [CrossRef]
  2. Panda, B.; Ruan, S.; Unluer, C.; Tan, M.J. Investigation of the properties of alkali-activated slag mixes involving the use of nanoclays and nucleation seeds for 3D printing. Compos. Part B Eng. 2020, 186, 107826. [Google Scholar] [CrossRef]
  3. Yasin, A.A.A.; Hamzeh, F.; Al Sakka, F. Agent based modeling to optimize workflow of robotic steel and concrete 3D printers. Autom. Constr. 2020, 110, 103040. [Google Scholar] [CrossRef]
  4. Khayat, K.H.; Assaad, J. Measurement systems for determining formwork pressure of highly flowable concrete. Mater. Struct. 2008, 41, 37–46. [Google Scholar] [CrossRef]
  5. Xia, M.; Sanjayan, J. Method of formulating geopolymer for 3D printing for construction applications. Mater. Design 2016, 110, 382–390. [Google Scholar] [CrossRef]
  6. Paul, S.C.; Tay, Y.W.D.; Panda, B.; Tan, M.J. Fresh and hardened properties of 3D printable cementitious materials for building and construction. Arch. Civ. Mech. Eng. 2018, 18, 311–319. [Google Scholar] [CrossRef]
  7. Khayat, K.H.; Assaad, J. Use of thixotropy-enhancing agent to reduce formwork pressure exerted by self-consolidating concrete. ACI Mater. J. 2008, 105, 88–96. [Google Scholar] [CrossRef]
  8. El Sakka, F.; Assaad, J.J.; Hamzeh, F.; Nakhoul, C. Thixotropy and interfacial bond strengths of polymer-modified printed mortars. Mater. Struct. 2019, 52. [Google Scholar] [CrossRef]
  9. Assaad, J.J.; Matar, P. Regression models to predict SCC pressure exerted on formworks containing vertical and transverse reinforcing bars. Mater. Struct. 2018, 51. [Google Scholar] [CrossRef]
  10. McCormac, J.C.; Brown, R.H. Design of Reinforced Concrete, 9th ed.; John Wiley & Sons: Hoboken, NJ, USA, 2014; 742p. [Google Scholar]
  11. Słowik, M. The analysis of failure in concrete and reinforced concrete beams with different reinforcement ratio. Arch. Appl. Mech. 2019, 89, 885–895. [Google Scholar] [CrossRef] [Green Version]
  12. Wu, P.; Wang, J.; Wang, X. A critical review of the use of 3-D printing in the construction industry. Autom. Constr. 2016, 68, 21–31. [Google Scholar] [CrossRef] [Green Version]
  13. Khoshnevis, B.; Hwang, D.; Yao, K.-T.; Yeh, Z. Mega-scale fabrication by contour crafting. International J. Ind. Syst. Eng. 2006, 1, 301–320. [Google Scholar] [CrossRef] [Green Version]
  14. Khoshnevis, B. Automated construction by contour crafting—Related robotics and information technologies. Autom. Constr. 2004, 13, 5–19. [Google Scholar] [CrossRef]
  15. Scott, C. Chinese Construction Company 3D Prints an Entire Two-Story House On-Site in 45 days. 2016. Available online: https://3dprint.com/138664/huashang-tengda-3d-print-house/ (accessed on 20 March 2017).
  16. Marchment, T.; Sanjayan, J. Mesh reinforcing method for 3D concrete printing. Autom. Constr. 2020, 109, 102992. [Google Scholar] [CrossRef]
  17. Salet, T.A.; Ahmed, Z.Y.; Bos, F.P.; Laagland, H.L. Design of a 3D printed concrete bridge by testing. Virtual Phys. Prototyp. 2018, 13, 222–236. [Google Scholar] [CrossRef] [Green Version]
  18. Asprone, D.; Auricchio, F.; Menna, C.; Mercuri, V. 3D printing of reinforced concrete elements: Technology and design approach. Constr. Build. Mater. 2018, 165, 218–231. [Google Scholar] [CrossRef]
  19. Algassem, O.O.; Li, Y.; Aoude, H. Ability of steel fibers to enhance the shear and flexural behavior of high-strength concrete beams subjected to blast loads. Eng. Struct. 2019, 199, 109611. [Google Scholar] [CrossRef]
  20. Głodkowska, W.; Ziarkiewicz, M. Cracking behavior of steel fiber reinforced waste sand concrete beams in flexure—Experimental investigation and theoretical analysis. Eng. Struct. 2018, 176, 1–10. [Google Scholar] [CrossRef]
  21. Hambach, M.; Volkmer, D. Properties of 3D-printed fiber-reinforced Portland cement paste. Cem. Concr. Compos. 2017, 79, 62–70. [Google Scholar] [CrossRef]
  22. Nematollahi, B.; Vijay, P.; Sanjayan, J.; Nazari, A.; Xia, M.; Naidu Nerella, V.; Mechtcherine, V. Effect of polypropylene fibre addition on properties of geopolymers made by 3D printing for digital construction. Materials 2018, 11, 2352. [Google Scholar] [CrossRef] [Green Version]
  23. Assaad, J.; Issa, C. Preliminary study on interfacial bond strength due to successive casting lifts of self-consolidating concrete—Effect of thixotropy. Constr. Build. Mater. 2016, 126, 351–360. [Google Scholar] [CrossRef]
  24. Bos, F.P.; Ahmed, Z.Y.; Jutinov, E.R.; Salet, T.A. Experimental exploration of metal cable as reinforcement in 3D printed concrete. Materials 2017, 10, 1314. [Google Scholar] [CrossRef] [Green Version]
  25. ACI 318-19. Building Code Requirements for Structural Concrete and Commentary; American Concrete Institute: Indianapolis, IN, USA, 2019. [Google Scholar]
  26. Assaad, J.; Issa, C. Effect of recycled acrylic-based polymers on bond stress-slip behavior in reinforced concrete structures. J. Mater. Civ. Eng. 2017, 29. [Google Scholar] [CrossRef]
  27. Rashid, M.A.; Mansur, M.A. Reinforced high-strength concrete beams in flexure. ACI Struct. J. 2005, 102, 462–471. [Google Scholar]
  28. Asprone, D.; Menna, C.; Bos, F.P.; Salet, T.A.M.; Mata-Falcón, J.; Kaufmann, W. Rethinking reinforcement for digital fabrication with concrete. Cem. Concr. Res. 2018, 112, 111–121. [Google Scholar] [CrossRef]
  29. ASTM C642-13. Standard Test Method for Density, Absorption, and Voids in Hardened Concrete; American Society for Testing and Materials: West Conshohocken, PA, USA, 2013. [Google Scholar]
  30. EN 196-1. Methods of Testing Cement. Determination of Strength; Comite Europeen de Normalisation: Brussels, Belgium, 2016. [Google Scholar]
  31. ASTM C928/C928M-20. Standard Specification for Packaged, Dry, Rapid-Hardening Cementitious Materials for Concrete Repairs; American Society for Testing and Materials: West Conshohocken, PA, USA, 2020. [Google Scholar]
  32. ASTM C78/C78M-18. Standard Test Method for Flexural Strength of Concrete (Using Simple Beam with Third-Point Loading); American Society for Testing and Materials: West Conshohocken, PA, USA, 2018. [Google Scholar]
  33. Assaad, J.; Chakar, E.; Zéhil, G.P. Testing and modeling the behavior of sandwich lightweight panels against wind and seismic loads. Eng. Struct. 2018, 175, 457–466. [Google Scholar] [CrossRef]
  34. ASTM C881/C881M-15. Standard Specification for Epoxy-Resin-Based Bonding Systems for Concrete; American Society for Testing and Materials: West Conshohocken, PA, USA, 2015. [Google Scholar]
  35. Smith, W.P.Y. Relating Concrete Cube, Core and Cylinder Compressive Strengths that are Cast, Cured, Prepared and Tested in Laboratory Conditions. Master Thesis, University of Cape Town, Cape Town, South Africa, 2016; 147p. [Google Scholar]
  36. Mehta, K.; Monteiro, P. Concrete, Microstructure, Properties, and Materials, 3rd ed.; McGraw-Hill: New York, NY, USA, 2006. [Google Scholar] [CrossRef]
  37. Perrie, B. Strength of hardened concrete. In Fulton’s Concrete Technology, 9th ed.; Owens, G., Ed.; Cement and Concrete Institute: Midrand, South Africa, 2009; pp. 97–110. [Google Scholar]
  38. Beushausen, H.; Dittmer, T. The influence of aggregate type on the strength and elastic modulus of high strength concrete. Constr. Build. Mater. 2015, 74, 132–139. [Google Scholar] [CrossRef]
  39. Ince, R.; Arici, E. Size effect in bearing strength of concrete cubes. Constr. Build. Mater. 2004, 18, 603–609. [Google Scholar] [CrossRef]
  40. Panda, B.; Chandra Paul, S.; Jen Tan, M. Anisotropic mechanical performance of 3D printed fiber reinforced sustainable construction material. Mater. Lett. 2017, 209, 146–149. [Google Scholar] [CrossRef]
  41. Assaad, J.; Daou, Y. Cementitious grouts with adapted rheological properties for injection by vacuum techniques. Cem. Concr. Res. 2014, 59, 43–54. [Google Scholar] [CrossRef]
  42. Assaad, J.J.; Hamzeh, F.; Hamad, B. Qualitative assessment of interfacial bonding in 3D printing concrete exposed to frost attack. Case Stud. Constr. Mater. 2020, e00357. [Google Scholar] [CrossRef]
  43. Abdelkarim, O.I.; Ahmed, E.A.; Mohamed, H.M.; Benmokrane, B. Flexural strength and serviceability evaluation of concrete beams reinforced with deformed GFRP bars. Eng. Struct. 2019, 186, 282–296. [Google Scholar] [CrossRef]
  44. Yi, S.-T.; Yang, E.-I.; Choi, J.-C. Effect of specimen sizes, specimen shapes, and placement directions on compressive strength of concrete. Nucl. Eng. Design 2016, 236, 115–127. [Google Scholar] [CrossRef]
  45. Kwak, Y.K.; Eberhard, M.O.; Kim, W.S.; Kim, J. Shear strength of steel fiber-reinforced concrete beams without stirrups. ACI Struct. J. 2002, 99, 530–538. [Google Scholar]
  46. Yacob, N.S.; ElGawady, M.A.; Sneed, L.H.; Said, A. Shear strength of fly ash-based geopolymer reinforced concrete beams. Eng. Struct. 2019, 196, 109298. [Google Scholar] [CrossRef]
  47. Fathifazl, G.; Razaqpury, A.G.; Burkan Isgor, O.; Abbas, A.; Fournier, B.; Foo, S. Shear strength of reinforced recycled concrete beams without stirrups. Mag. Concr. Res. 2009, 61, 477–490. [Google Scholar] [CrossRef]
  48. Assaad, J.J.; Daou, Y. Behavior of structural polymer-modified concrete containing recycled aggregates. J. Adhes. Sci. Technol. 2017, 31, 874–896. [Google Scholar] [CrossRef]
Figure 1. Printing path, dimensions, and configuration of 3D printed modules.
Sustainability 12 04062 g001
Figure 2. Preparation of 3D printed modules for f’c and fr testing.
Sustainability 12 04062 g002
Figure 3. Photo and configuration of bonded modules for fr testing.
Sustainability 12 04062 g003
Figure 4. Construction process of steel reinforced 3D printed module members.
Sustainability 12 04062 g004
Figure 5. Configuration of steel reinforcement and testing of 3D printed members.
Sustainability 12 04062 g005
Figure 6. Load vs. displacement curves for CIP and 3D plain specimens tested in compression.
Sustainability 12 04062 g006
Figure 7. Failure patterns for CIP and 3D plain specimens tested in compression.
Sustainability 12 04062 g007
Figure 8. Load vs. displacement curves for CIP and 3D plain specimens tested in flexure.
Sustainability 12 04062 g008
Figure 9. Failure patterns for CIP and 3D plain specimens tested in flexure.
Sustainability 12 04062 g009
Figure 10. Failure patterns for CIP and 3D steel reinforced members.
Sustainability 12 04062 g010
Figure 11. Load vs. displacement curves for CIP and 3D steel reinforced members.
Sustainability 12 04062 g011
Figure 12. Experimental-to-theoretical ratios for CIP and 3D steel reinforced members.
Sustainability 12 04062 g012
Table 1. Proportions and relevant mortar properties.
Test Method
Mortar proportionsCement = 615 kg/m3n/a
w/c = 0.43
Natural sand = 1340 kg/m3
HRWR = 1.05% of cement
Fresh propertiesFlow = 150 mmASTM C230
Air content = 4.5%ASTM C231
AThix = 0.55 Pa/secSakka et al. [8]
Hardened propertiesDensity = 2090 kg/m3ASTM C642
Compressive strength = 42.5 MPaBS EN 196-1
Flexural strength = 5.7 MPaBS EN 196-1
Pull-off bond strength = 4.1 MPaSakka et al. [8]
Table 2. Dimensions of plain specimens used for f’c and fr testing.
Type of TestNumber of Tested SpecimensCasting MethodSpecimen CodeCross-Section, mm2Length of Specimen, mm
f’c3Cast-in-placeCIP240 240
23D printed3D(H)240 240
23D printed3D(V)240 240
fr 3Cast-in-placeCIP2402 × 240 = 480
23D printed3D2402 × 240 = 480
3D(H) and 3D(V) refer to the direction of module layers in the loading frame of the compression machine; the H and V letters refer to horizontal or vertical direction, respectively.
Table 3. Failure loads of CIP and 3D plain specimens tested in compression.
Specimen No. Failure Load, kN f’c, MPa E,
GPa
Average f’c, MPa (COV)Average E, GPa (COV)
CIP 11228.321.36.9322.8
(6.1%)
5.31
(28.4%)
21324.7235.04
3138824.13.96
3D(H)11594.127.75.7530.8
(14.3%)
5.76
(0.33%)
21953.633.95.77
3D(V)11389.124.11.7526.9
(14.8%)
2.29
(33.1%)
21714.529.82.82
Table 4. Failure loads of CIP and 3D plain specimens tested in flexure.
Specimen No.Failure Load, kNfr,
MPa
Average fr, MPa (COV)
CIP134.051.111.1 (0.78%)
233.671.1
333.541.09
3D152.11.71.62
(6.6%)
247.451.55
Table 5. Analysis of loads for CIP and 3D steel reinforced members.
CIP3D
Specimen No.12312
f’c, MPa21.32324.124.129.8
fr, MPa1.111.11.091.71.55
Analysis based on cracking momentLoad at first flexural crack, kN20.822.922.846.444.2
MExp, kN.m2.983.283.276.656.34
Mcr, kN.m 2.552.532.523.563.91
MExp / Mcr ratio1.171.31.31.871.62
Average ratio and COV1.26 (6.1%)1.75 (10%)
Shear strength VExp at first diagonal crack, kN56.152.554.652.250.3
Vn, kN70.671.371.771.773.6
VExp / Vn ratio0.790.740.760.730.68
Average ratio and COV 0.76 (3.8%)0.71 (4.5%)
Flexural strengthMaximum load at failure, kN182.1214.3181.3155.7146.9
MExp, kN.m26.130.72622.321.1
Mn, kN.m 22.622.722.822.823.2
MExp / Mn ratio1.161.351.140.980.91
Average ratio and COV1.22 (9.7%)0.95 (5.3%)
Exp = Experimental.

