Assessment of the Development of Time-Sharing Electric Vehicles in Shanghai and Subsidy Implications: A System Dynamics Approach

Abstract
1. Introduction
2. Related Work
2.1. Research on Time-Sharing Electric Vehicles
2.2. System Dynamics Modeling
3. System Dynamics Model of TSEV Adoption
3.1. Basic Assumptions
- We divided the whole crowd into three categories from a macroscopic perspective: public transportation users, potential private vehicle buyers (who are using public transportation right now and plan to purchase private vehicles in the short-term), and private car users (including ICVs and PEVs);
- The influencing factors of users’ choice were simplified to be convenience (indicating availability of the mobility) and cost, since convenience and affordability are core features of car-sharing, and of particular interest to consumers [34];
- TSEV could attract people from three groups, which Huang and Yang summarized as the possible target markets of the new public transport pattern of vehicle sharing, that is, people who have no private cars or have a high cost of ownership [35]: (1) potential private vehicle buyers; (2) private ICV users who are paying high amounts for the operations; (3) public transportation users with a pursuit of travel comforts. Here, it should be mentioned that the people owning or planning to buy a plug-in electric vehicle (PEV, including plug-in hybrid electric vehicle, battery electric vehicle, and fuel cell electric vehicle) were not considered because of the definite advantages of PEVs over TSEVs in their low operation cost brought by the electricity, and their convenience as private cars;
- These three potential user groups naturally have different tolerances for the convenience and cost of time-sharing electric vehicles;
- The government subsidizes the users directly or indirectly (through the operation subsidy to the operators, and then from the operators to the users by discounts) to some degree. The degree of the subsidy would impact the cost of use, thus influencing the decision of users from each group to choose time-sharing electric vehicles or not;
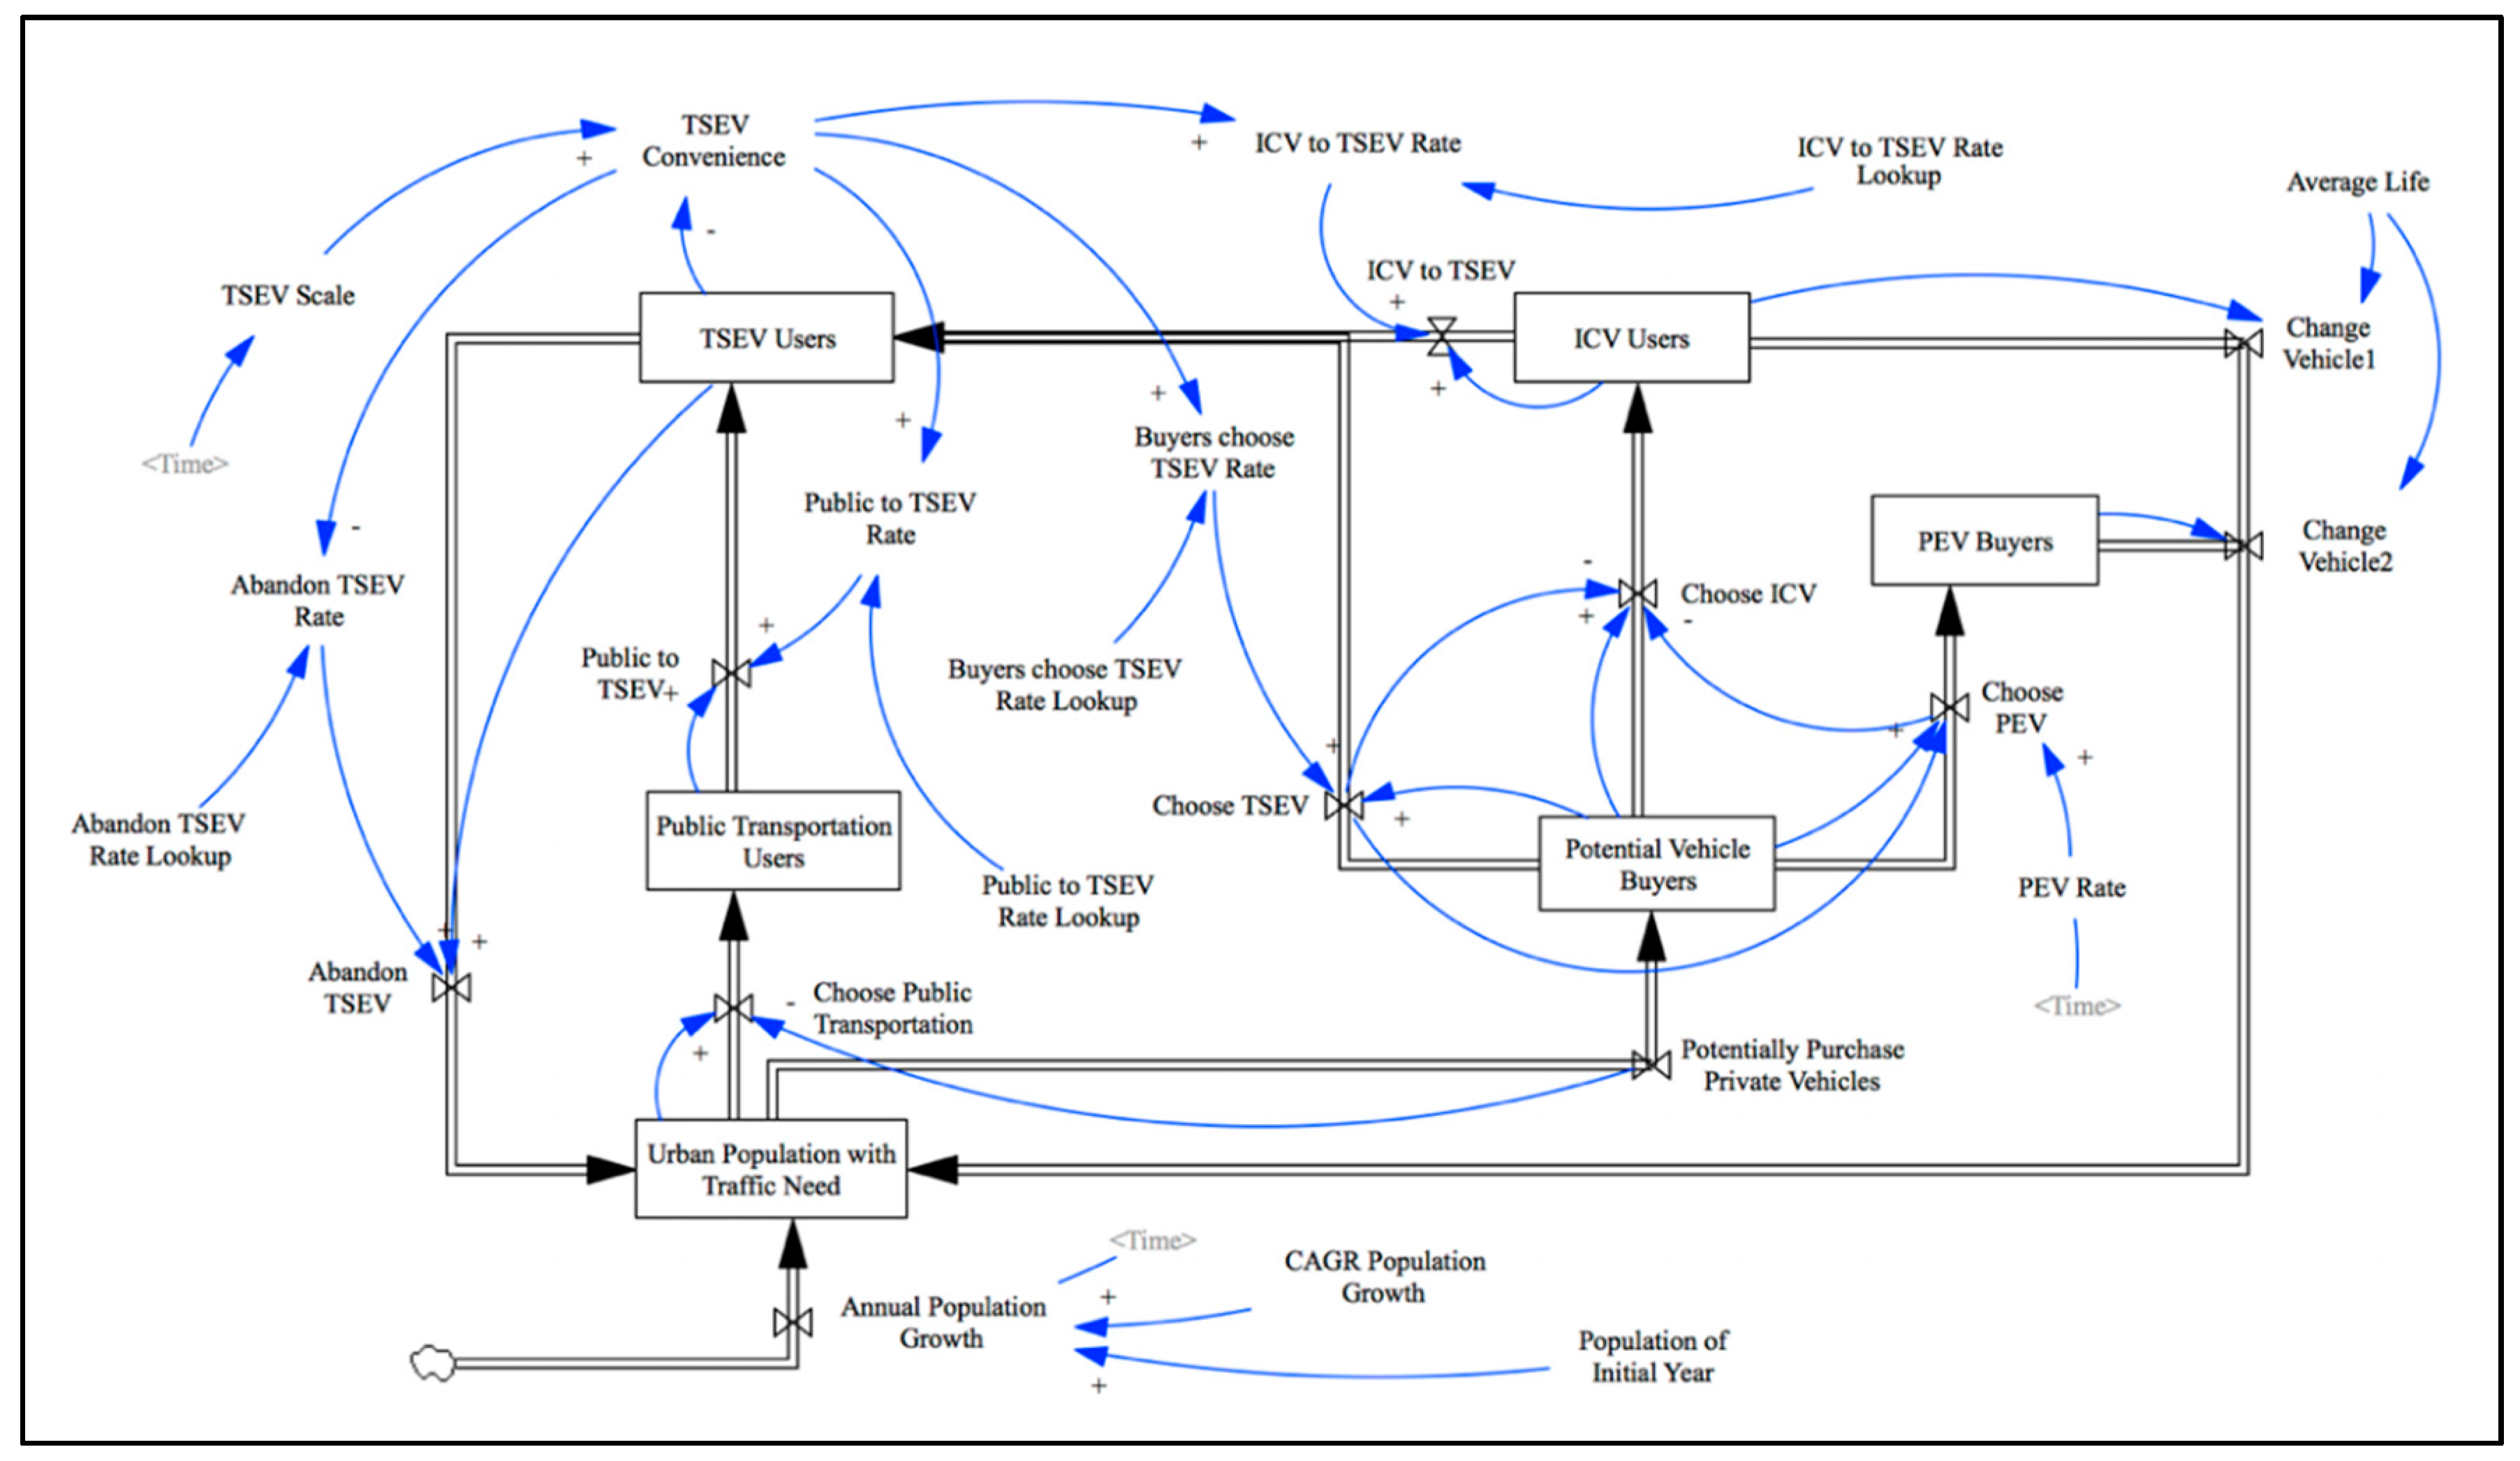
- Changes in the number of users can affect the real-time availability of the vehicles, namely convenience, which in turn will also affect the user choice according to the acceptance of convenience of each group.
3.2. System Dynamics Modeling
4. Simulation and Results
4.1. Hypothesis on Parameter Settings
4.1.1. Cost
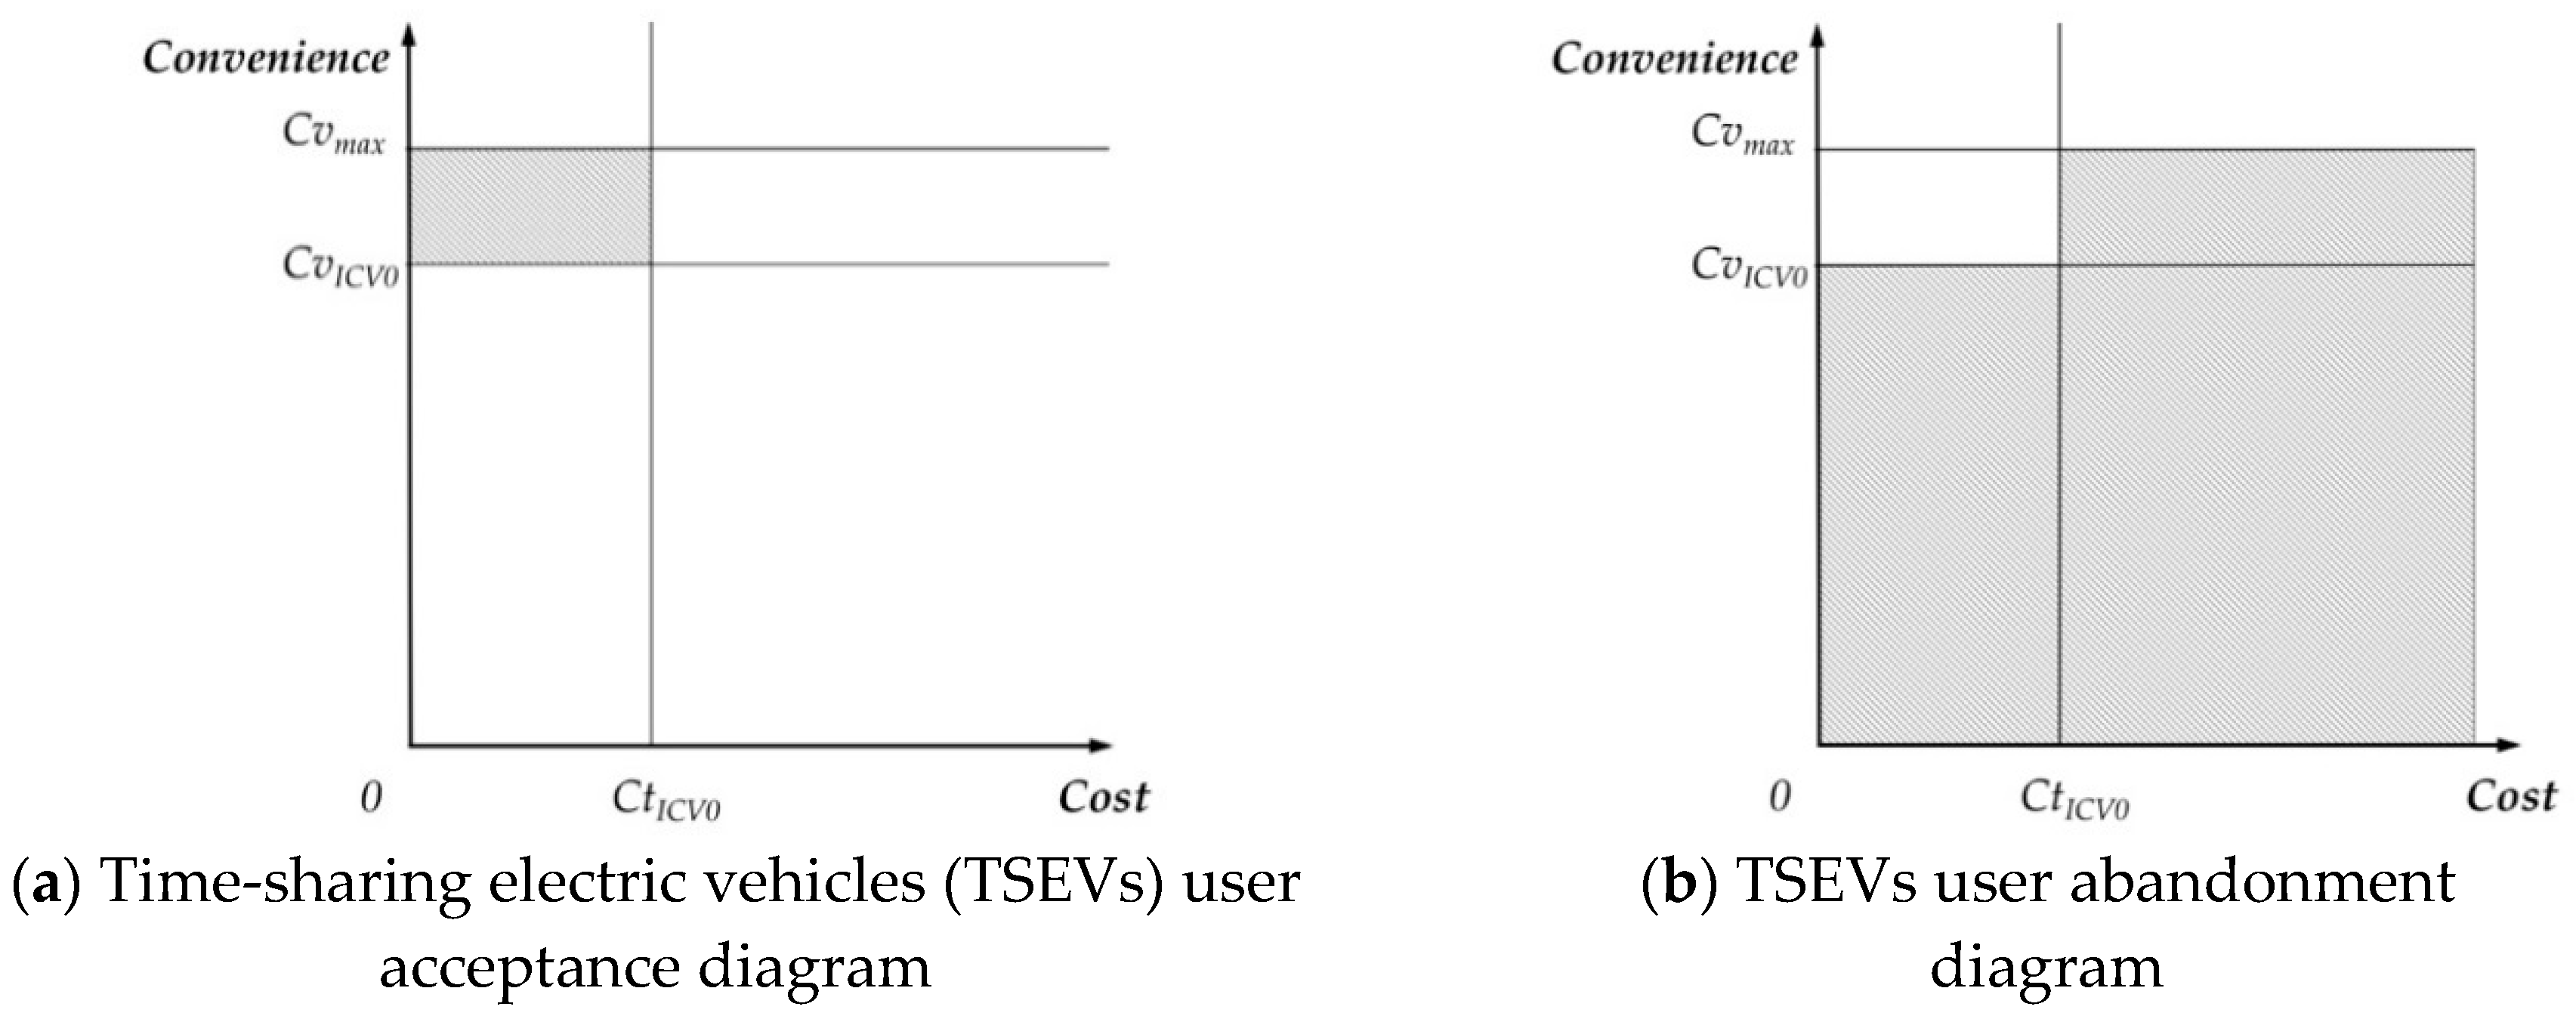
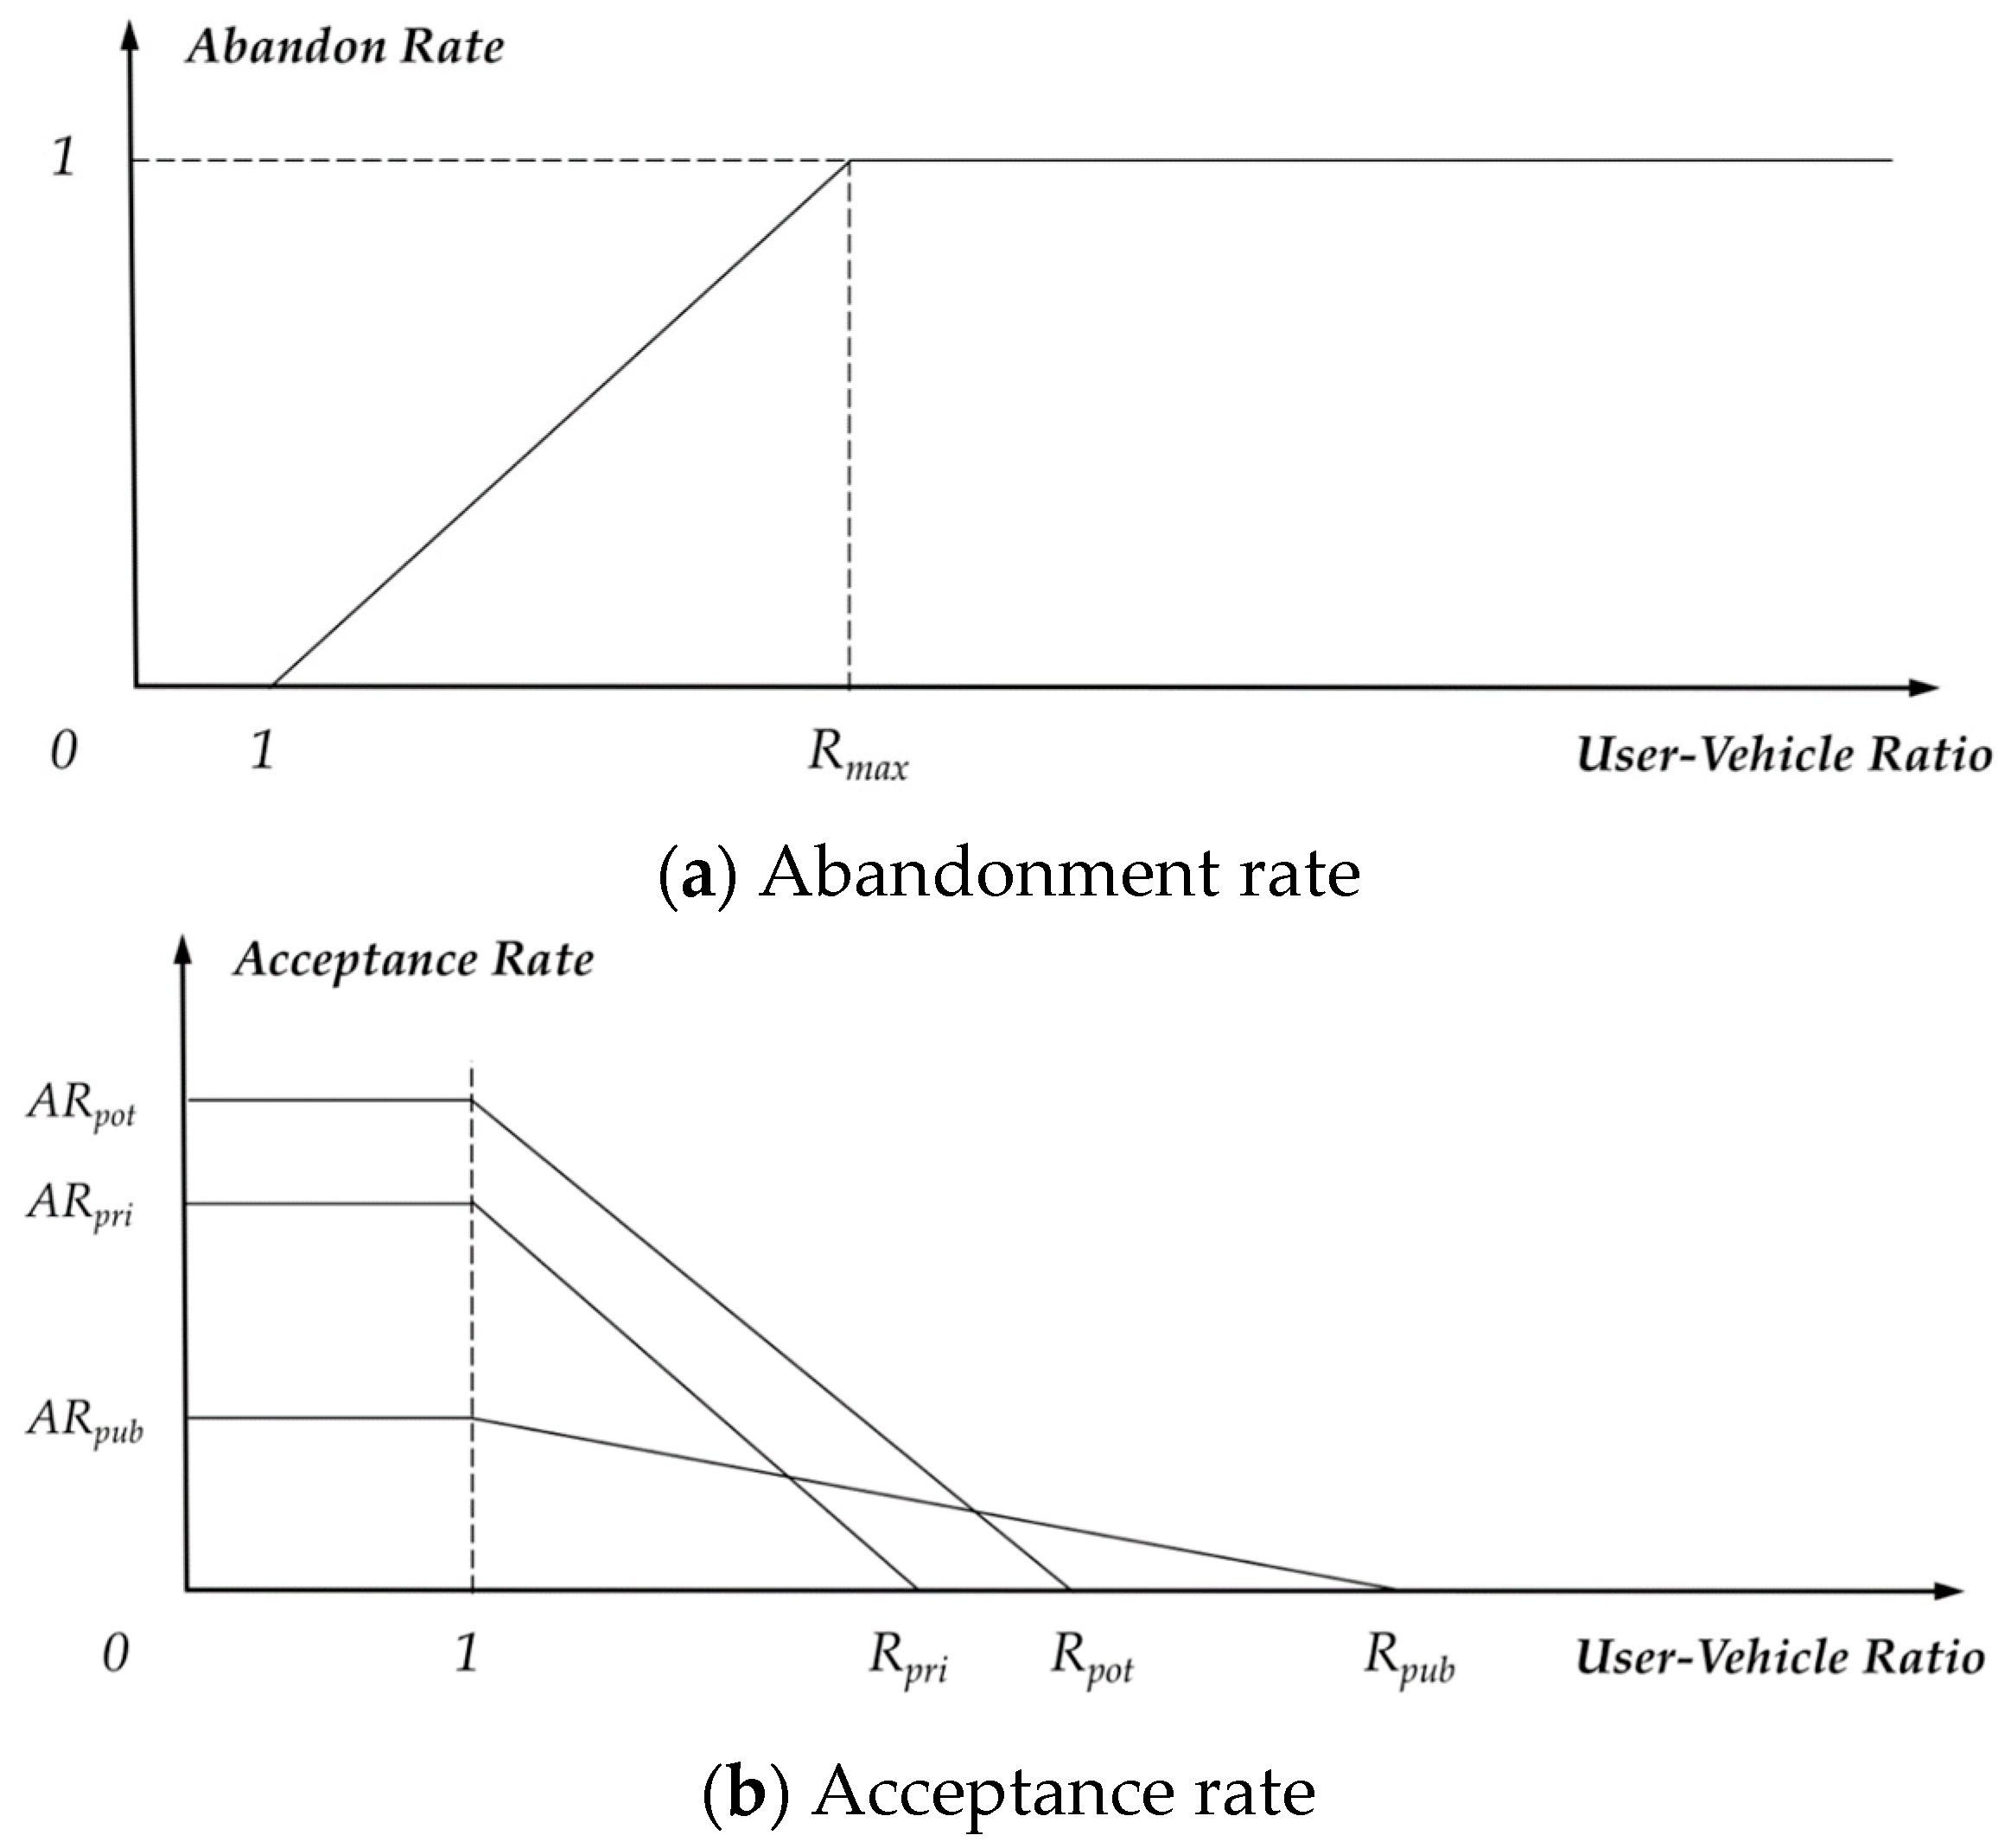
4.1.2. Convenience
4.2. Model Validation
4.2.1. Direct Structure Tests
4.2.2. Behavior Pattern Test
4.3. Simulation Results
5. Conclusions
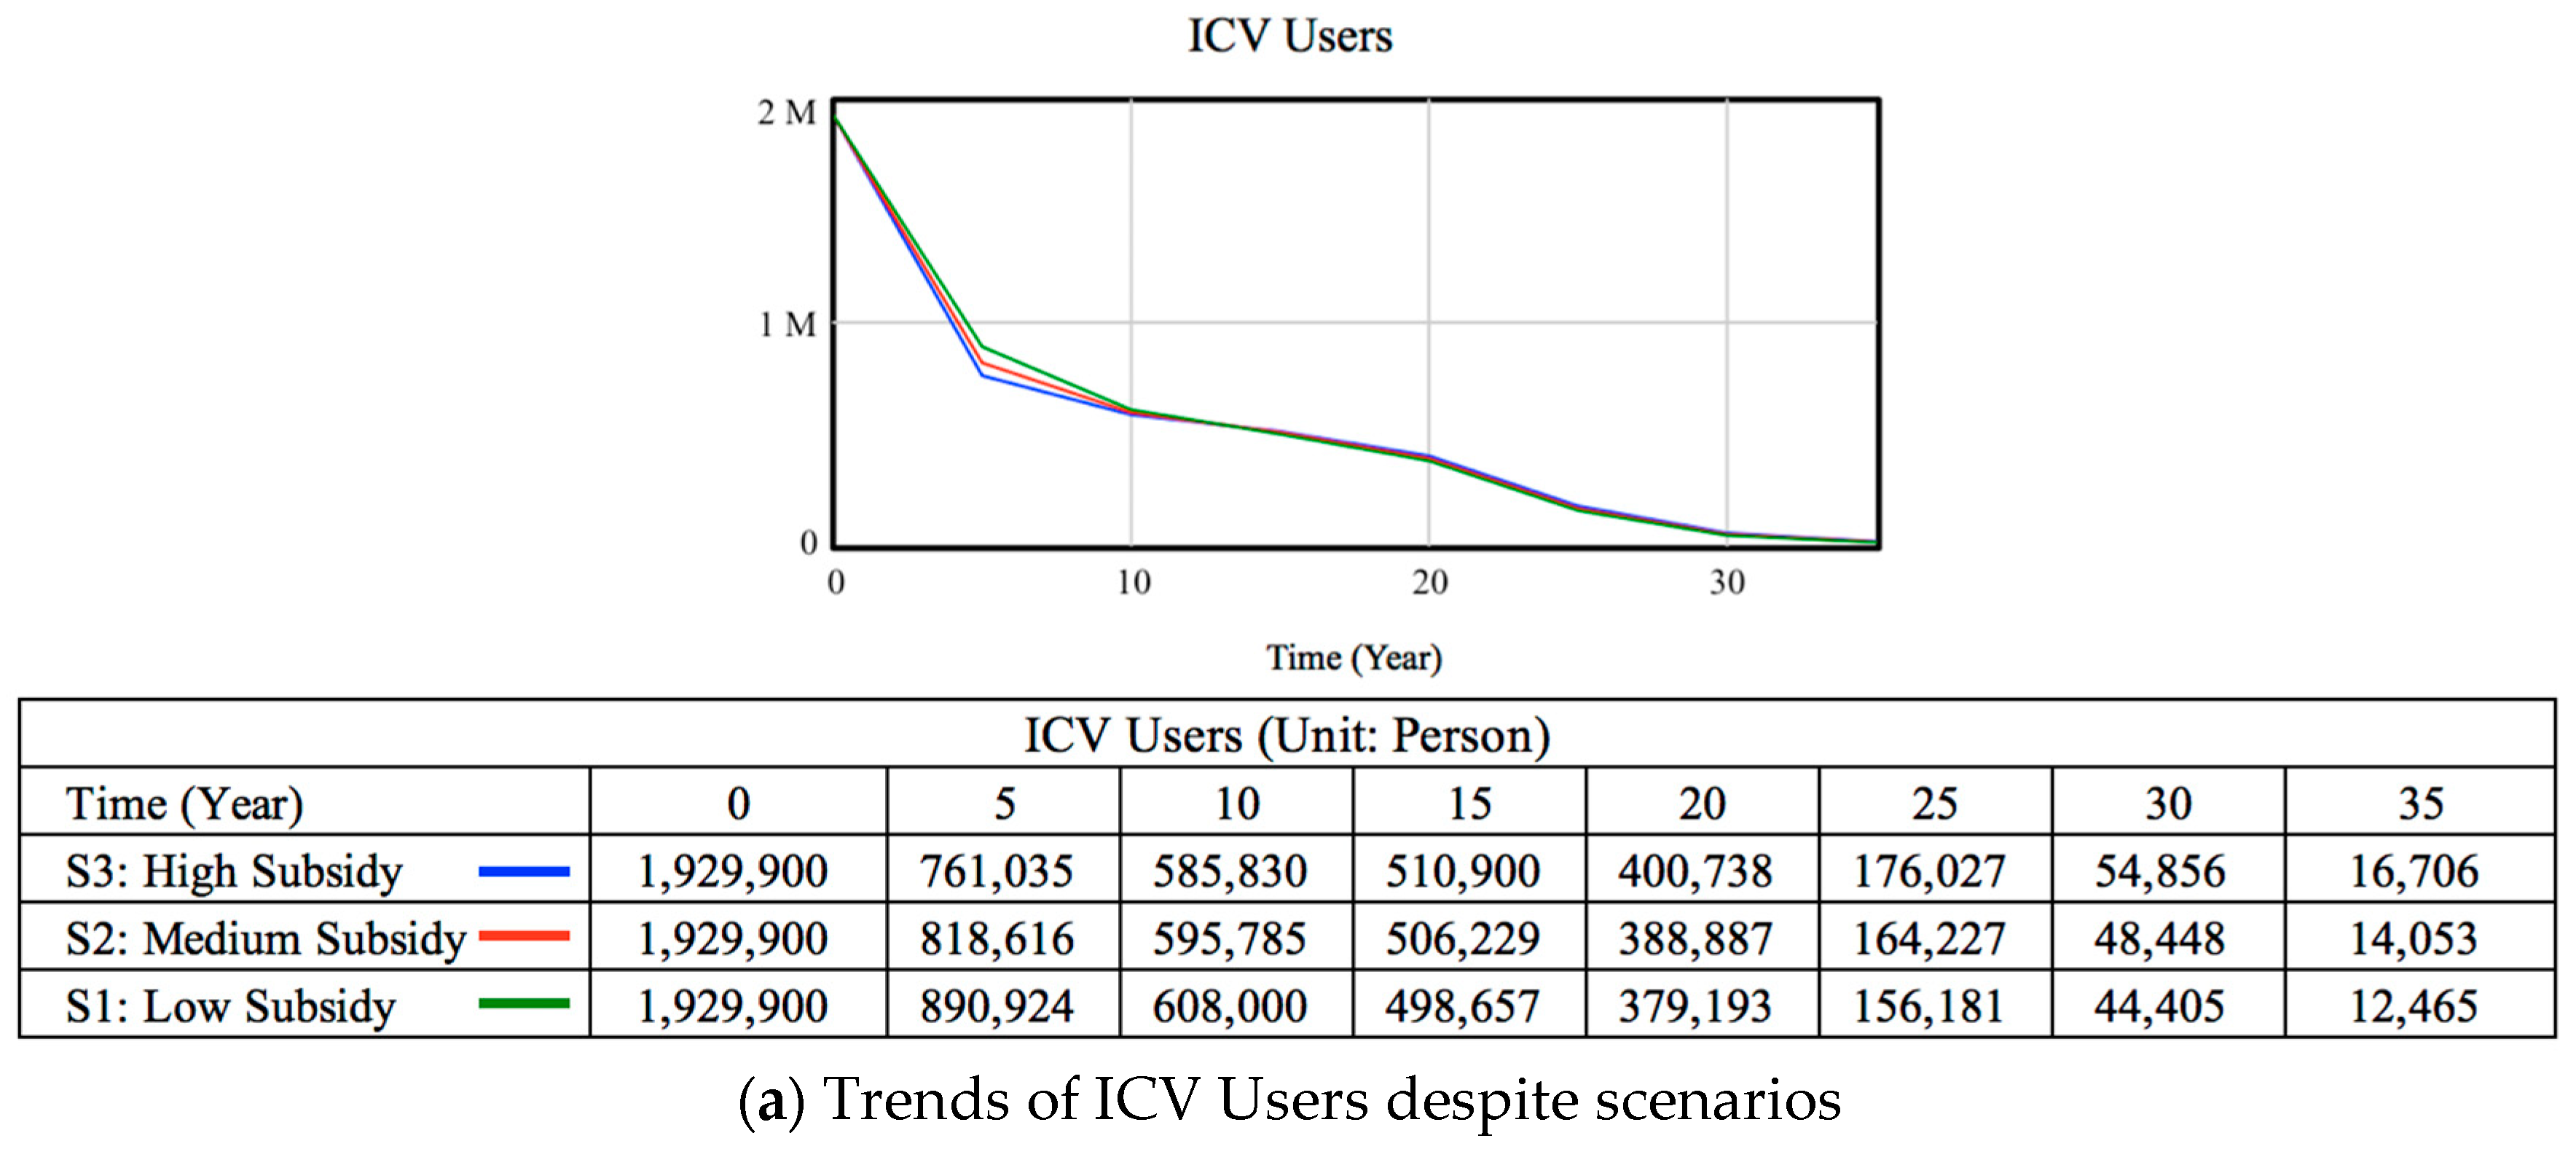
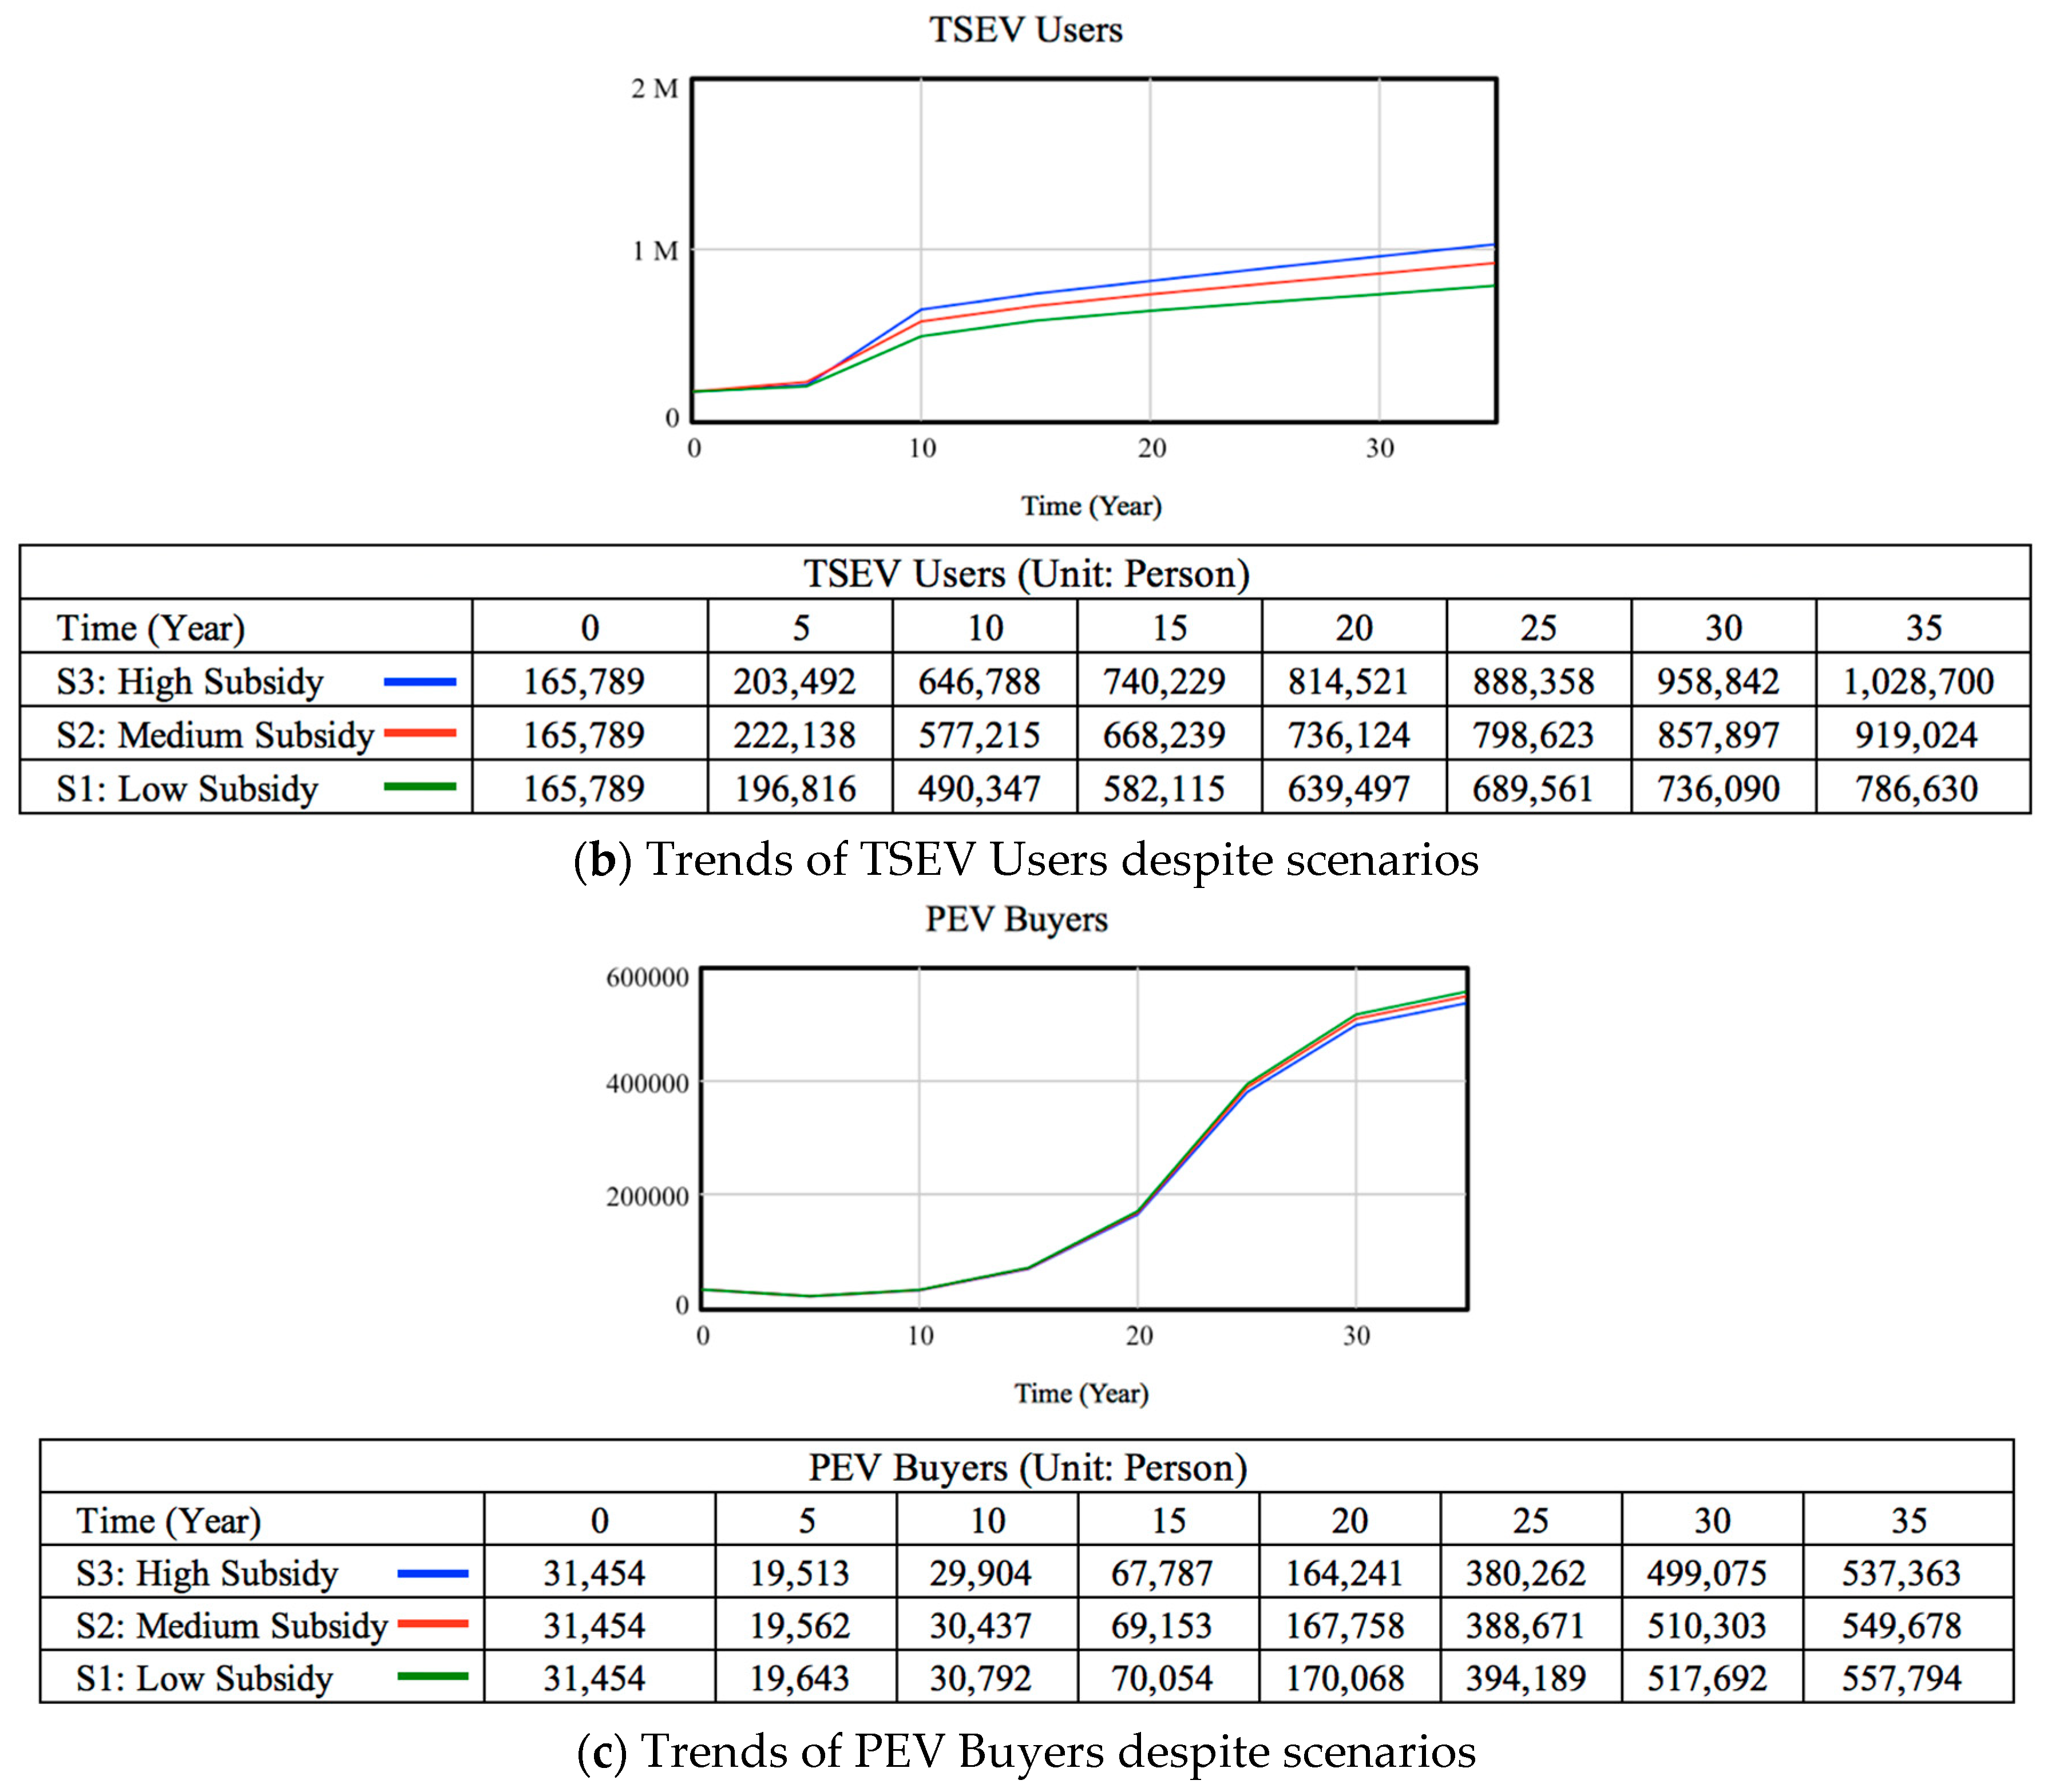
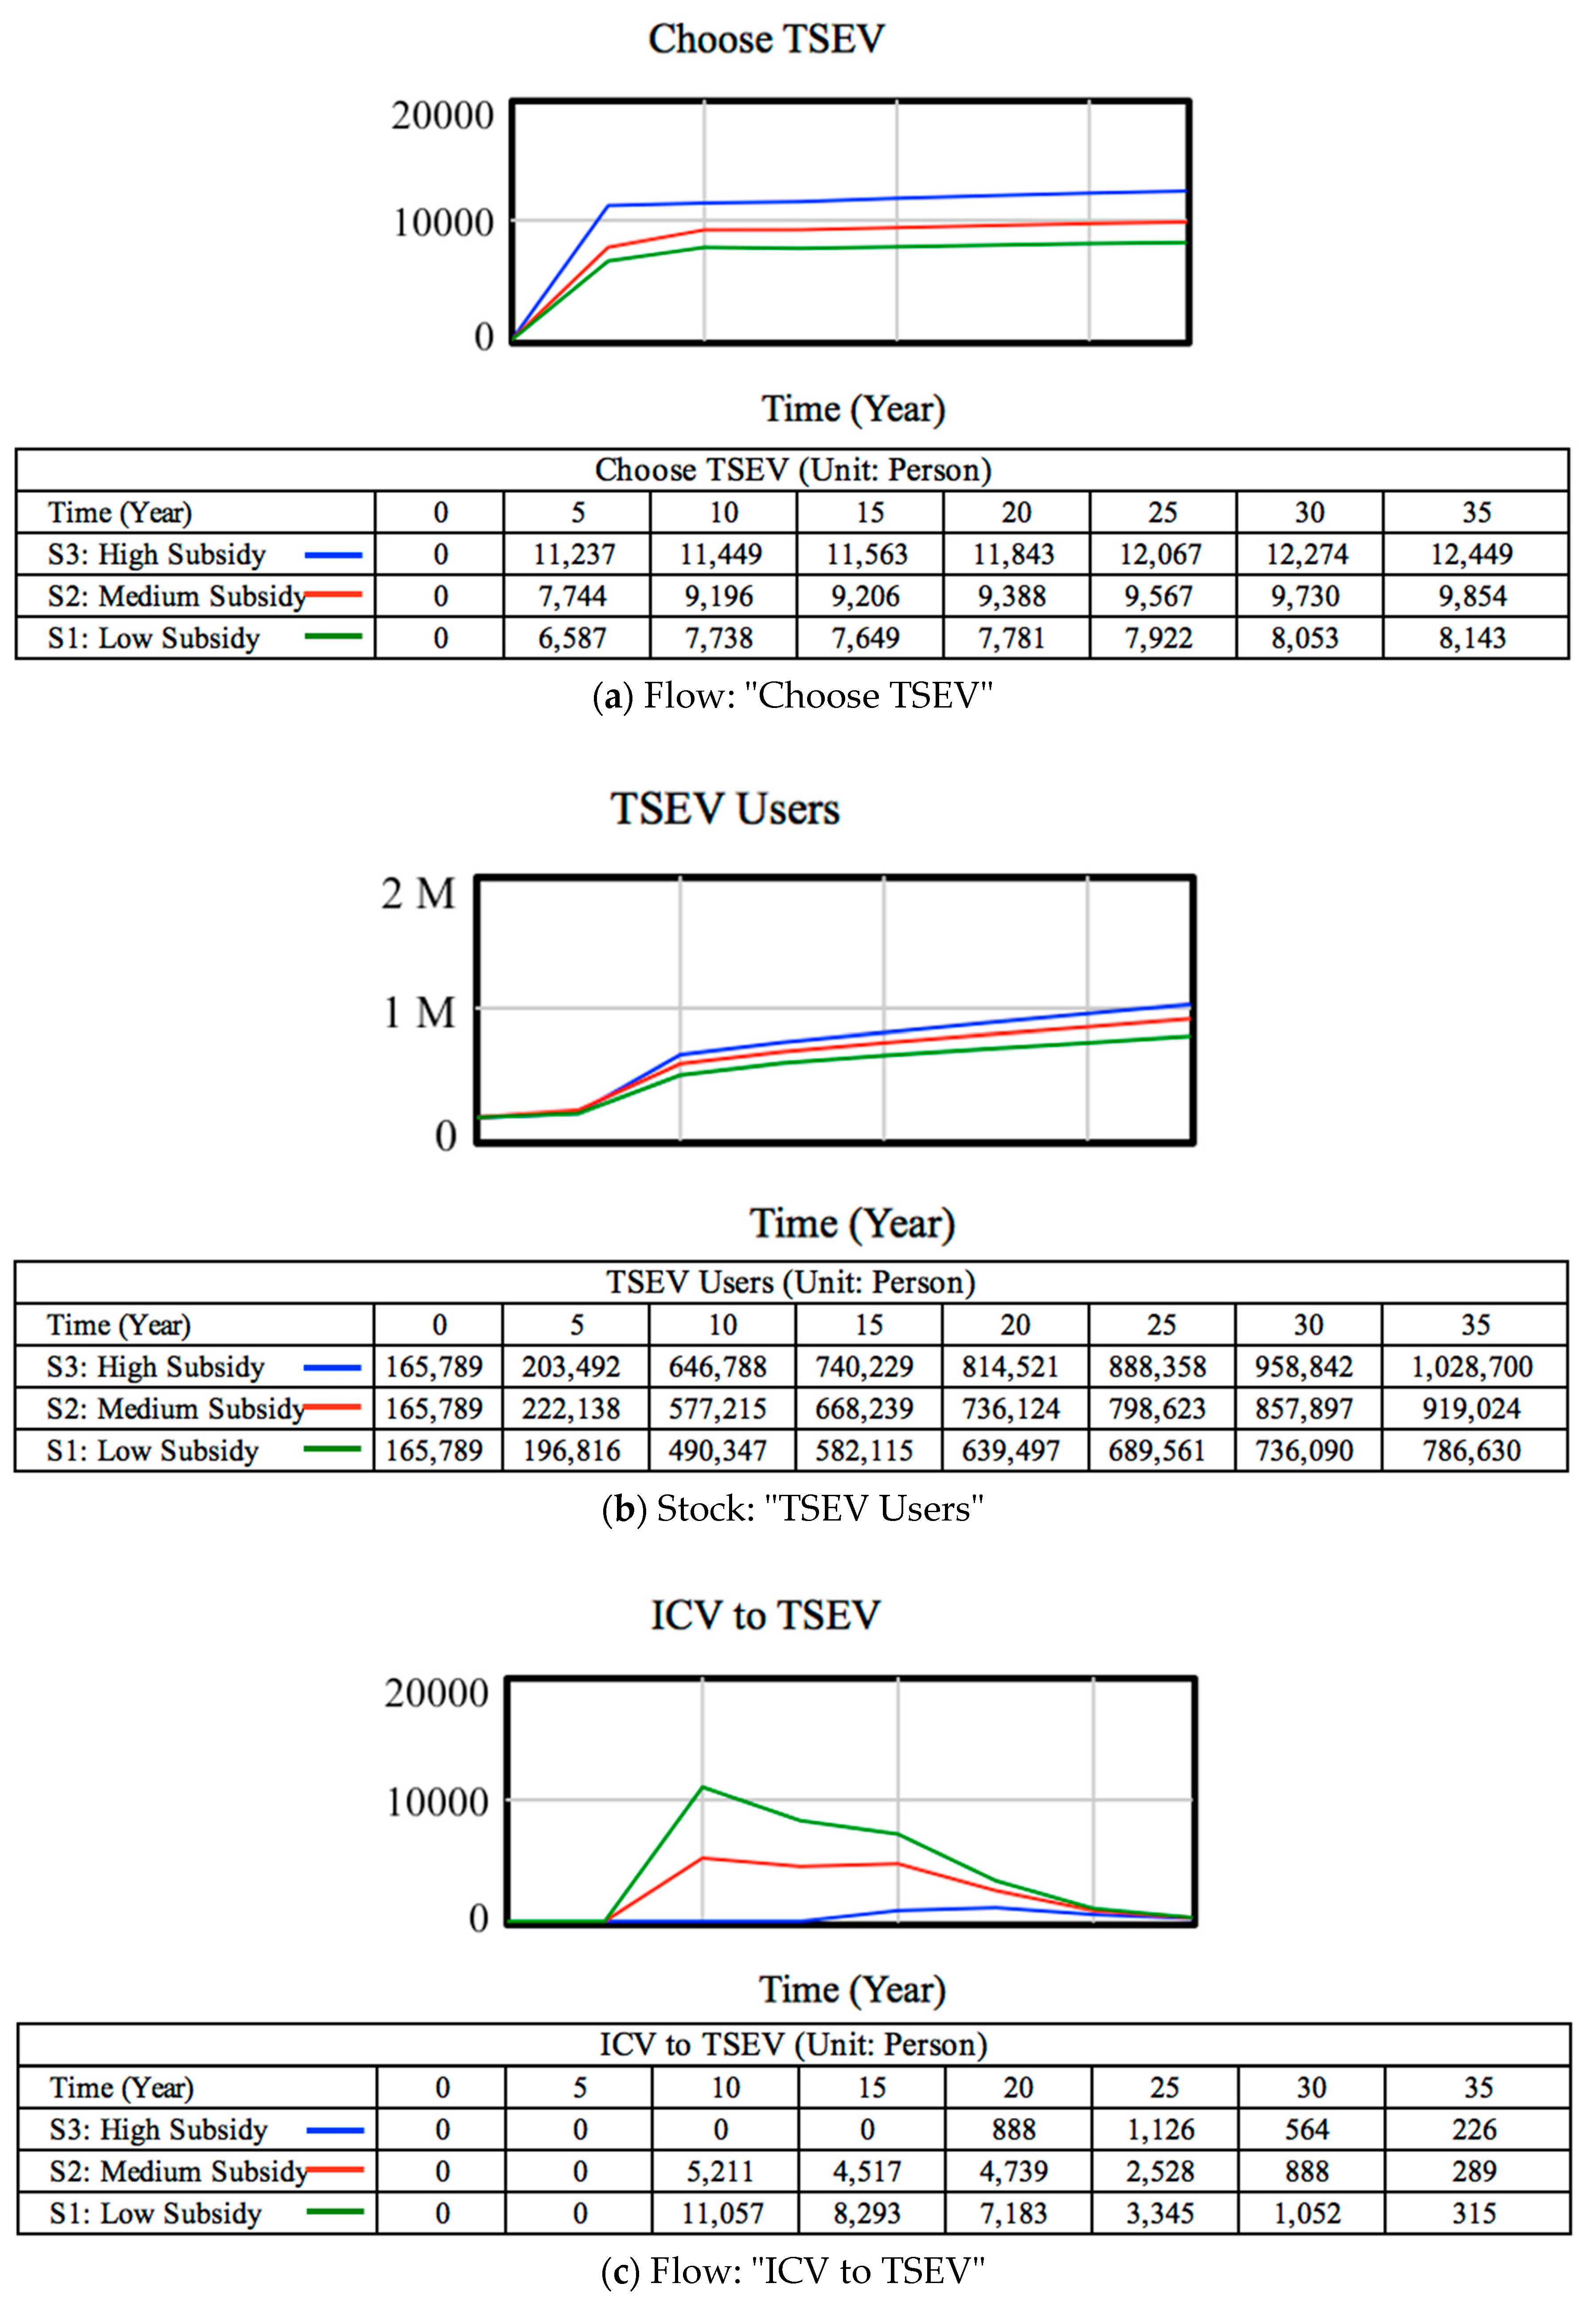
- Despite the subsidy scenarios, the number of ICV users will drop obviously in the short-term of about five years, and go steadily down to zero in the long-term because of the traffic problem, license plate restriction policy, increasingly mature public transportation system, the high subsidy for EVs right now, and the trend of electric vehicles. Conversely, the PEV users will increase slowly in the first five years because of the immature battery technology and the supporting facilities, and the number of PEV users will begin to explode after 10 years;
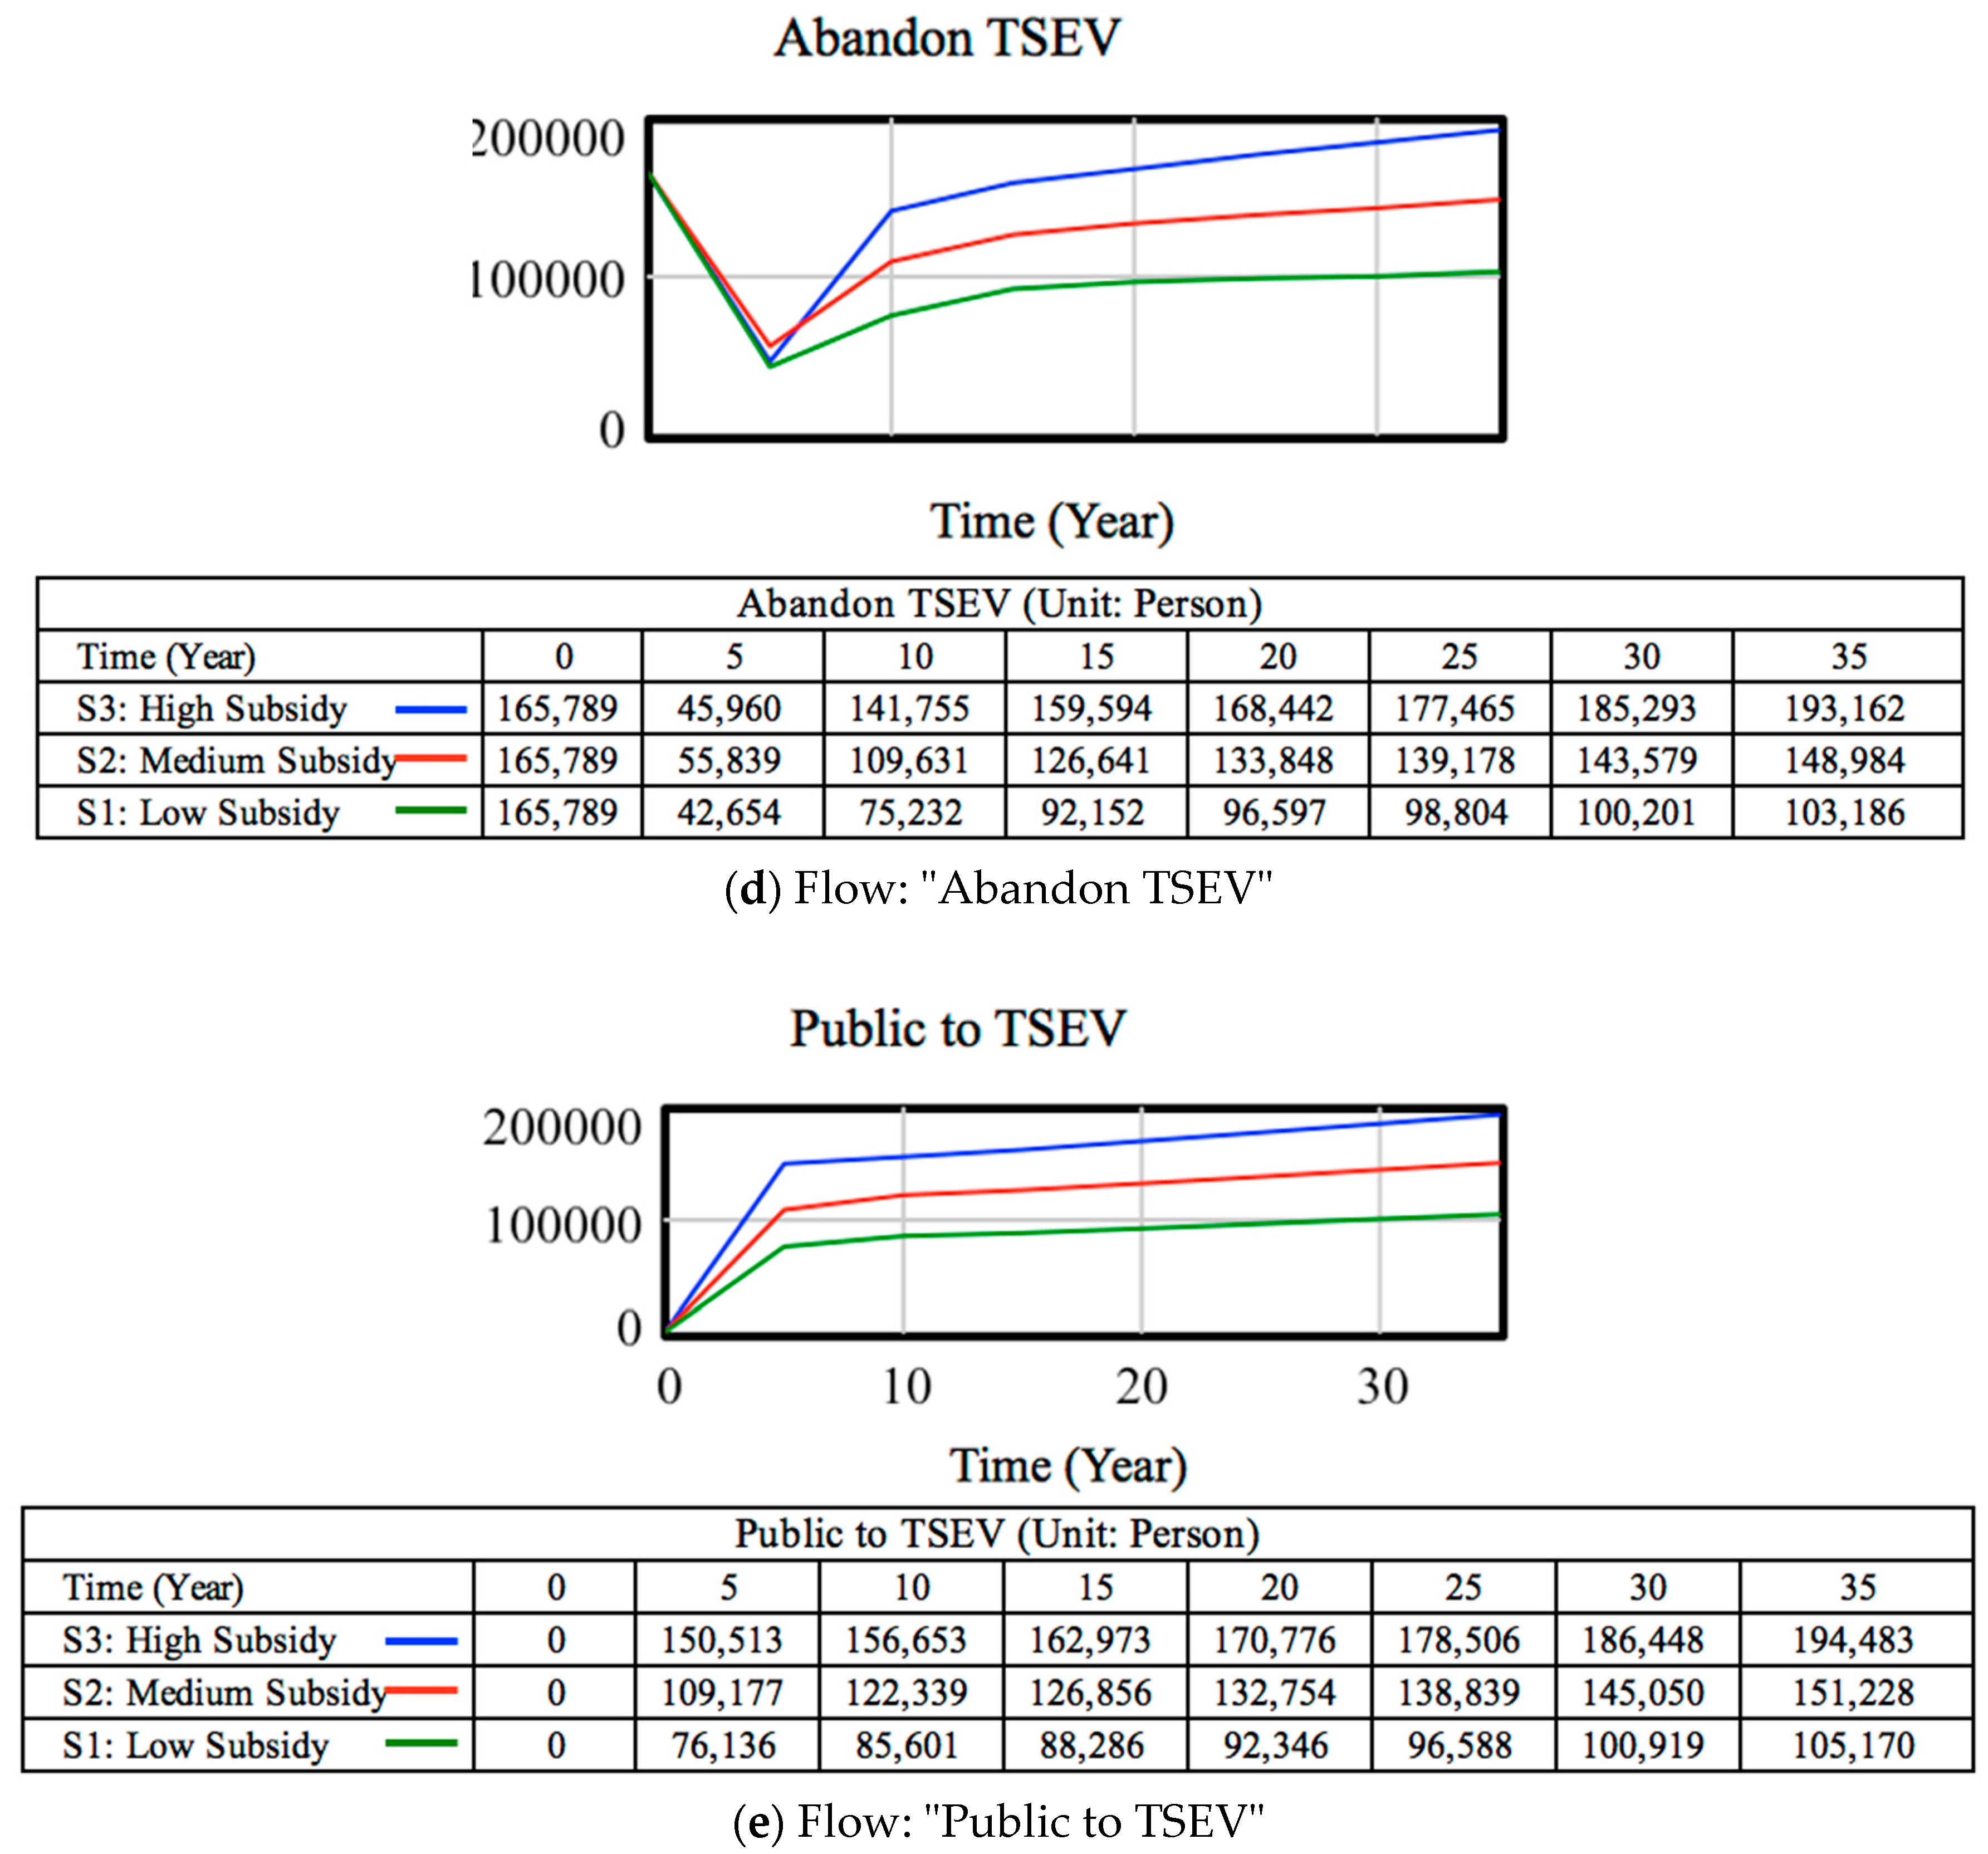
- The TSEV users will definitely increase under government subsidies, but the scope of the subsidy will influence the percentage of the target group attracted to the TSEV sector. The results suggest that it is under a low subsidy that private internal combustion engine vehicle (ICV) users are attracted to TSEVs the most.
Author Contributions
Funding
Acknowledgments
Conflicts of Interest
Nomenclature
| TSEV | Time-sharing electric vehicle: vehicle |
| ICV | Internal combustion engine vehicle, vehicle |
| PEV | Plug-in electric vehicle, including plug-in hybrid electric vehicle, battery electric vehicle and fuel cell electric vehicle, vehicle |
References
- United Nations Environment Programme. Available online: http://wedocs.unep.org/bitstream/handle/20.500.11822/26895/EGR2018_FullReport_EN.pdf?sequence=1&isAllowed=y (accessed on 13 December 2019).
- International Energy Agency. Available online: https://www.iea.org/topics/climate-change (accessed on 13 December 2019).
- Xu, B.; Lin, B. Factors affecting carbon dioxide (CO2) emissions in China’s transport sector: a dynamic nonparametric additive regression model. J. Clean. Prod. 2015, 101, 311–322. [Google Scholar] [CrossRef]
- National Bureau of Statistics. Available online: http://www.stats.gov.cn/tjsj/ndsj/ (accessed on 13 December 2019).
- The Hill. Available online: https://thehill.com/opinion/energy-environment/418369-congress-should-end-electric-car-subsidies-not-expand-them (accessed on 13 July 2019).
- Hong Kong Free Press. Available online: https://www.hongkongfp.com/2018/02/24/hong-kongs-electric-vehicle-subsidy-much-large-right-scrap/ (accessed on 17 April 2019).
- Xue, Y.; Tongyu, Y.; Sunbin, W. An analysis of the development model and social economic characteristics of vehicles sharing consumption. Tech. Econ. Manag. Res. 2008, 156, 54–58. [Google Scholar]
- Times of India. Available online: https://timesofindia.indiatimes.com/business/govt-to-scrap-subsidy-for-private-electric-cars/articleshow/64689285.cms (accessed on 17 April 2019).
- Official website of Central People’s Government of the people’s Republic of China. Available online: http://www.gov.cn/xinwen/2017-08/08/content_5216567.htm (accessed on 18 April 2019).
- Shanghai Municipality. Available online: http://www.shanghai.gov.cn/nw2/nw2314/nw2319/nw12344/u26aw47395.html (accessed on 18 April 2019).
- Strategy&. Available online: https://www.strategyand.pwc.com/cn/zh/reports-and-studies/trends-car-sharing-china.html (accessed on 3 May 2019).
- Feng, B.; Ye, Q.; Collins, B.J. A dynamic model of electric vehicle adoption: The role of social commerce in new transportation. Inf. Manag. 2018, 56, 196–212. [Google Scholar] [CrossRef]
- Ye, L.; Yang, D.Y. The development and applied research on car sharing and mobile management in China. Proc. China’s Sustain. Dev. Forum 2010. Available online: https://kns.cnki.net/KCMS/detail/detail.aspx?dbcode=CPFD&dbname=CPFD0914&filename=ZKZC201010001051&uid=WEEvREcwSlJHSldRa1FhcEFLUmVhZDN5c0doME9KbzJXZURPcUNDTlA4dz0=$9A4hF_YAuvQ5obgVAqNKPCYcEjKensW4IQMovwHtwkF4VYPoHbKxJw!!&v=MjE2MzZiYkc0SDlITnI0OUZaZXNLRFJOS3VoZGhuajk4VG5qcXF4ZEVlTU9VS3JpZlplWnZGeW5uVTdiS0lsNFFQeWJS (accessed on 30 April 2019).
- Ke, H.; Chai, S.; Cheng, R. Does car sharing help reduce the total number of vehicles? Soft Comput. 2019, 23, 12461–12474. [Google Scholar] [CrossRef]
- Bruglieri, M.; Colorni, A.; Luè, A. The relocation problem for the one-way electric vehicle sharing. Networks 2014, 64, 292–305. [Google Scholar] [CrossRef]
- Baptista, P.; Melo, S.; Rolim, C. Energy, Environmental and Mobility Impacts of Car-sharing Systems. Empirical Results from Lisbon, Portugal. Procedia Soc. Behav. Sci. 2014, 111, 28–37. [Google Scholar] [CrossRef]
- Sandy Thomas, C.E. “How green are electric vehicles?”. Int. J. Hydrog. Energy 2012, 37, 6053–6062. [Google Scholar] [CrossRef]
- Yao, X.Y. Study on Electric Vehicles’ Time—Sharing Leasing in Beijing. In Proceedings of the 3rd Annual 2017 International Conference on Management Science and Engineering (Mse 2017), Guilin, China, 18–20 August 2017; Volume 50, pp. 130–133. [Google Scholar]
- Wang, N.; Yan, R. Research on Consumers’ Use Willingness and Opinions of Electric Vehicle Sharing: An Empirical Study in Shanghai. Sustainability 2016, 8, 7. [Google Scholar] [CrossRef]
- Shaheen, S.; Cano, L.; Camel, M. Exploring electric vehicle carsharing as a mobility option for older adults: A case study of a senior adult community in the San Francisco Bay Area. Int. J. Sustain. Transp. 2015, 10, 406–417. [Google Scholar] [CrossRef]
- Burghard, U.; Dütschke, E. Who wants shared mobility? Lessons from early adopters and mainstream drivers on electric carsharing in Germany. Transp. Res. Part D Transp. Environ. 2019, 71, 96–109. [Google Scholar] [CrossRef]
- Zoepf, S.M.; Keith, D.R. User decision-making and technology choices in the U.S. carsharing market. Transp. Policy 2016, 51, 150–157. [Google Scholar] [CrossRef]
- Ullah, I.; Liu, K.; Vanduy, T. Examining Travelers’ Acceptance towards Car Sharing Systems—Peshawar City, Pakistan. Sustainability 2019, 11, 808. [Google Scholar] [CrossRef]
- Luè, A.; Colorni, A.; Nocerino, R.; Paruscio, V. Green Move: An Innovative Electric Vehicle-Sharing System. Procedia Soc. Behav. Sci. 2012, 48, 2978–2987. [Google Scholar] [CrossRef]
- Nakayama, S.; Yamamoto, T.; Kitamura, R. Simulation analysis for the management of an electric vehicle-sharing system - Case of the Kyoto public-car system. Transp. Res. Rec. 2002, 99–104. [Google Scholar] [CrossRef]
- George, D.K.; Xia, C.H. Fleet-sizing and service availability for a vehicle rental system via closed queueing networks. Eur. J. Oper. Res. 2011, 211, 198–207. [Google Scholar] [CrossRef]
- Zhou, F.; Zheng, Z.; Whitehead, J.; Perrons, R.; Page, L.; Washington, S. Projected prevalence of car-sharing in four Asian-Pacific countries in 2030: What the experts think. Transp. Res. Part C: Emerg. Technol. 2017, 84, 158–177. [Google Scholar] [CrossRef]
- Brownstone, D.; Bunch, D.S.; Train, K. Joint mixed logit models of stated and revealed preferences for alternative-fuel vehicles. Transp. Res. Part B Methodol. 2000, 34, 315–338. [Google Scholar] [CrossRef]
- Potoglou, D.; Kanaroglou, P.S. Household demand and willingness to pay for clean vehicles. Transp. Res. Part D Transp. Environ. 2007, 12, 264–274. [Google Scholar] [CrossRef]
- Caulfield, B.; Farrell, S.; McMahon, B. Examining individuals preferences for hybrid electric and alternatively fuelled vehicles. Transp. Policy 2010, 17, 381–387. [Google Scholar] [CrossRef]
- Zhang, T.; Gensler, S.; Garcia, R. A Study of the Diffusion of Alternative Fuel Vehicles: An Agent-Based Modeling Approach. J. Prod. Innov. Manag. 2011, 28, 152–168. [Google Scholar] [CrossRef]
- Caroleo, B.; Pautasso, E.; Osella, M.; Palumbo, E.; Ferro, E. Assessing the Impacts of Electric Vehicles Uptake: A System Dynamics Approach. In Proceedings of the 2017 IEEE 41st Annual Computer Software and Applications Conference (COMPSAC), Turin, Italy, 4–8 July 2017; pp. 790–795. [Google Scholar]
- Muravev, D.; Rakhmangulov, A.; Hu, H.; Zhou, H. The Introduction to System Dynamics Approach to Operational Efficiency and Sustainability of Dry Port’s Main Parameters. Sustainability 2019, 11, 2413. [Google Scholar] [CrossRef]
- Litman, T. Evaluating Carsharing Benefits. Transp. Res. Rec. J. Transp. Res. Board 2000, 1702, 31–35. [Google Scholar] [CrossRef]
- Huang, Z.Y.; Yang, D.Y. The development of car sharing abroad. Urban Plan 2000, 6, 50–55. [Google Scholar]
- Sina News. Available online: https://news.sina.cn/2018-02-07/detail-ifyrkzqq9074364.d.html?oid=133&vt=4&pos=3 (accessed on 22 January 2019).
- Tencent City. Available online: https://city.qq.com/a/20170827/076643.htm (accessed on 21 January 2019).
- China Electric Vehicle Website. Available online: http://news.ddc.net.cn/newsview_70892.html (accessed on 12 February 2019).
- Shanghai Bureau of Statistics. Available online: http://tjj.sh.gov.cn/html/sjfb/tjnj/ (accessed on 21 July 2019).
- Shaheen, S.A.; Cohen, A.P.; Chung, M.S. North American Carsharing 10-Year Retrospective. Transp. Res. Rec. 2009, 2110, 35–44. [Google Scholar] [CrossRef]
- Tuan Seik, F. Vehicle ownership restraints and car sharing in Singapore. Habitat Int. 2000, 24, 75–90. [Google Scholar] [CrossRef]


| Theme | Summary |
|---|---|
| Case Study and Opinions | Beijing: The government should provide policy support to encourage the development of the industry and the guidance should be strengthened from the level of urban planning [18]. |
| Shanghai: The population characteristics of people choosing to use sharing EVS are male, aged between 18 and 30, and usually taking the subway and bus as the daily transportation modes [19]. | |
| San Francisco Bay Area: An EV carsharing program could potentially complement travel patterns and price sensitivity [20]. | |
| Germany: Carsharing with EVs is particularly attractive for younger people who (i) live as a couple but without cars or (ii) are starting a family and use carsharing as a supplement to their own cars [21]. | |
| Preference of Consumers | Rental price, vehicle availability, type of vehicle are the main attributes of choice. All else being equal, users most prefer Hybrid vehicles [22]. |
| Users pay more attention to convenience and the economy of sharing EVS [19]. | |
| Service attributes, including travel time, travel cost, registration fees, and capital cost, were significant in acceptance of car sharing systems [23]. | |
| System Design or Optimization | Green Move: an electric vehicle sharing system with the characteristics of multi-ownership [24]. |
| Optimal management of the EV sharing system is configured using genetic algorithms, indicating that the optimal number of EVs is about half the total number of parking stalls [25]. | |
| A closed queueing network model of the EV sharing system was formulated to derive the asymptotic behavior of vehicle availability at an arbitrary rental station with respect to fleet size, and meanwhile a profit-maximizing optimization problem was also determined for optimal fleet size [26]. |
| Flow | Equation | Unit 1 | Explanation |
|---|---|---|---|
| Annual Population Growth | =Population of Initial Year × ((1 + CAGR 1 Population Growth)^(Time + 1) − (1 + CAGR Population Growth)^Time) | Per/Year | The number of permanent residents increase of the city annually. |
| Potentially Purchase Private Vehicles | =123,567 | Per/Year | The number of potential private vehicle buyers every year in Shanghai. For the figures involved, we adopted the average growth from 2010 to 2017 as the number of new private vehicle increase of the city annually [39]. * Data type: Integer |
| Choose Public Transportation | =Urban Population with Traffic Need − Potentially Purchase Private Vehicles | Per/Year | The annual increase in public transport section. |
| Choose PEV 1 | =(Potential Vehicle Buyers − Choose TSEV) × PEV Rate | Per/Year | The annual increase in PEV users. |
| Choose TSEV 2 | =(Potential Vehicle Buyers − Choose PEV) × Buyer to TSEV Rate | Per/Year | The number of people who initially chose TSEV rather than general public section or a private vehicle. |
| Choose ICV 1 | =Potential Vehicle Buyers − Choose TSEV − Choose PEV | Per/Year | The annual increase in small private ICVs. |
| ICV to TSEV | =ICV Users × ICV to TSEV Rate | Per/Year | The number of people changing from ICVs to TSEVs. |
| Public to TSEV | =Public Transportation Users × Public to TSEV Rate | Per/Year | The number of people changing from general public transport section to TSEVs. |
| Abandon TSEV | =TSEV Users × Abandon TSEV Rate | Per/Year | The number of TSEV users who abandon TSEV and to choose again the transport tool. |
| Change Vehicle1 | =ICV Users/Average Life | Per/Year | The number of people who change their ICVs per year. |
| Change Vehicle2 | =PEV Users/Average Life | Per/Year | The number of people who change their PEVs per year. |
| Auxiliary | Equation | Unit 2 | Explanation |
|---|---|---|---|
| TSEV Scale | =IF THEN ELSE (Time ≤ 8, 6000 × 1.45 ^ Time, 117,245 + 4000 × (Time − 8)) | Veh/Year | TSEV Scale is the number of TSEVs, and it changes every year because of the increase. For the figures involved:
|
| TSEV Convenience | =TSEV Users/TSEV Scale | Per/Veh | The convenience of TSEV, measured by the ratio of TSEV users and TSEV scale. |
| PEV Rate | IF THEN ELSE (Time ≤ 23, 0.016 × 1.1968 ^ Time, 1) | Dmnl | The rate of potential vehicle buyers who will choose PEVs. For the figures involved:
|
| ICV to TSEV Rate | ICV to TSEV Rate Lookup (TSEV Convenience) | Dmnl | Here, we give a simulation example of the user choice by piecewise distribution. The equation column represents that there is a function here for each auxiliary, in which the rates will change according to the TSEV convenience. The detailed setting will be explained in Section 4. |
| Public to TSEV Rate | Public to TSEV Rate Lookup (TSEV Convenience) | Dmnl | |
| Buyer to TSEV Rate | Buyers choose TSEV Rate Lookup (TSEV Convenience) | Dmnl | |
| Abandon TSEV Rate | Abandon TSEV Rate Lookup (TSEV Convenience) | Dmnl |
| Constant | Description | Unit 3 | Explanation |
|---|---|---|---|
| Population of Initial Year | 2.41833 × 10⁷ | Per | The number of permanent residents by the end of 2017 in Shanghai was 2.41833 × 10⁷ according to the 2018 Shanghai Statistical Yearbook. <http://www.stats-sh.gov.cn/tjnj/nj18.htm?d1=2018tjnj/C0201.htm> |
| CAGR Population Growth | 0.007026 | Dmnl | We acquired the compound annual growth rate with the historical records of permanent residents from 2010 to 2017. |
| Average Life | 10 | Year | The average life of a vehicle was consulted with the marketing panel [12]. |
| Scenario | Public Transportation Users | Private ICV Owners | Potential Private Vehicle Buyers |
|---|---|---|---|
| S1 (ref): Low | 1% | 15% | 20% |
| S2: Medium | 1.5% | 20% | 26% |
| S3: High | 2% | 28% | 35% |
| ICV to TSEV Rate Lookup | Equation |
| S1: Low | [(0, 0) − (+∞, 1)], (0, 0.06705), (1, 0.06705), (5, 0), (1000, 0) |
| S2: Medium | [(0, 0) − (+∞, 1)], (0, 0.0894), (1, 0.0894), (5, 0), (1000, 0) |
| S3: High | [(0, 0) − (+∞, 1)], (0, 0.12516), (1, 0.12516), (5, 0), (1000, 0) |
| Public to TSEV Rate Lookup | Equation |
| S1: Low | [(0, 0) − (+∞, 0.1)], (0, 0.00426), (1, 0.00426), (20, 0), (1000, 0) |
| S2: Medium | [(0, 0) − (+∞, 0.1)], (0, 0.00639), (1, 0.00639), (20, 0), (1000, 0) |
| S3: High | [(0, 0) − (+∞, 0.1)], (0, 0.00852), (1, 0.00852), (20, 0), (1000, 0) |
| Buyer to TSEV Rate Lookup | Equation |
| S1: Low | [(0, 0) − (+∞, 1)], (0, 0.0852), (1, 0.0852), (12, 0), (1000, 0) |
| S2: Medium | [(0, 0) − (+∞, 1)], (0, 0.11076), (1, 0.11076), (12, 0), (1000, 0) |
| S3: High | [(0, 0) − (+∞, 1)], (0, 0.1491), (1, 0.1491), (12, 0), (1000, 0) |
| Abandon TSEV Rate Lookup | Equation |
| S1: Low | [(0, 0) − (+∞, 10)], (0, 0), (1, 0), (20, 1), (1000, 1) |
| S2: Medium | [(0, 0) − (+∞, 10)], (0, 0), (1, 0), (20, 1), (1000, 1) |
| S3: High | [(0, 0) − (+∞, 10)], (0, 0), (1, 0), (20, 1), (1000, 1) |
© 2020 by the authors. Licensee MDPI, Basel, Switzerland. This article is an open access article distributed under the terms and conditions of the Creative Commons Attribution (CC BY) license (http://creativecommons.org/licenses/by/4.0/).
Share and Cite
Zhou, B.; Hu, H.; Dai, L. Assessment of the Development of Time-Sharing Electric Vehicles in Shanghai and Subsidy Implications: A System Dynamics Approach. Sustainability 2020, 12, 345. https://doi.org/10.3390/su12010345
Zhou B, Hu H, Dai L. Assessment of the Development of Time-Sharing Electric Vehicles in Shanghai and Subsidy Implications: A System Dynamics Approach. Sustainability. 2020; 12(1):345. https://doi.org/10.3390/su12010345
Chicago/Turabian StyleZhou, Biyi, Hao Hu, and Lei Dai. 2020. "Assessment of the Development of Time-Sharing Electric Vehicles in Shanghai and Subsidy Implications: A System Dynamics Approach" Sustainability 12, no. 1: 345. https://doi.org/10.3390/su12010345
APA StyleZhou, B., Hu, H., & Dai, L. (2020). Assessment of the Development of Time-Sharing Electric Vehicles in Shanghai and Subsidy Implications: A System Dynamics Approach. Sustainability, 12(1), 345. https://doi.org/10.3390/su12010345