Assessing the Resilience and Sustainability of a Hazelnut Farming System in Central Italy with a Participatory Approach

 , , and
Abstract
1. Introduction
2. Materials and Methods
2.1. Case Study Description
2.2. Theoretical Background
2.3. Methodology for the Participatory Assessment of Resilience and Sustainability
- 1.
- Resilience of what: farming system
- 2.
- Resilience for what purpose: system functions
- 3.
- Resilience to what: challenges
- 4.
- What resilience capacities
- 5.
- What enhances resilience
3. Results
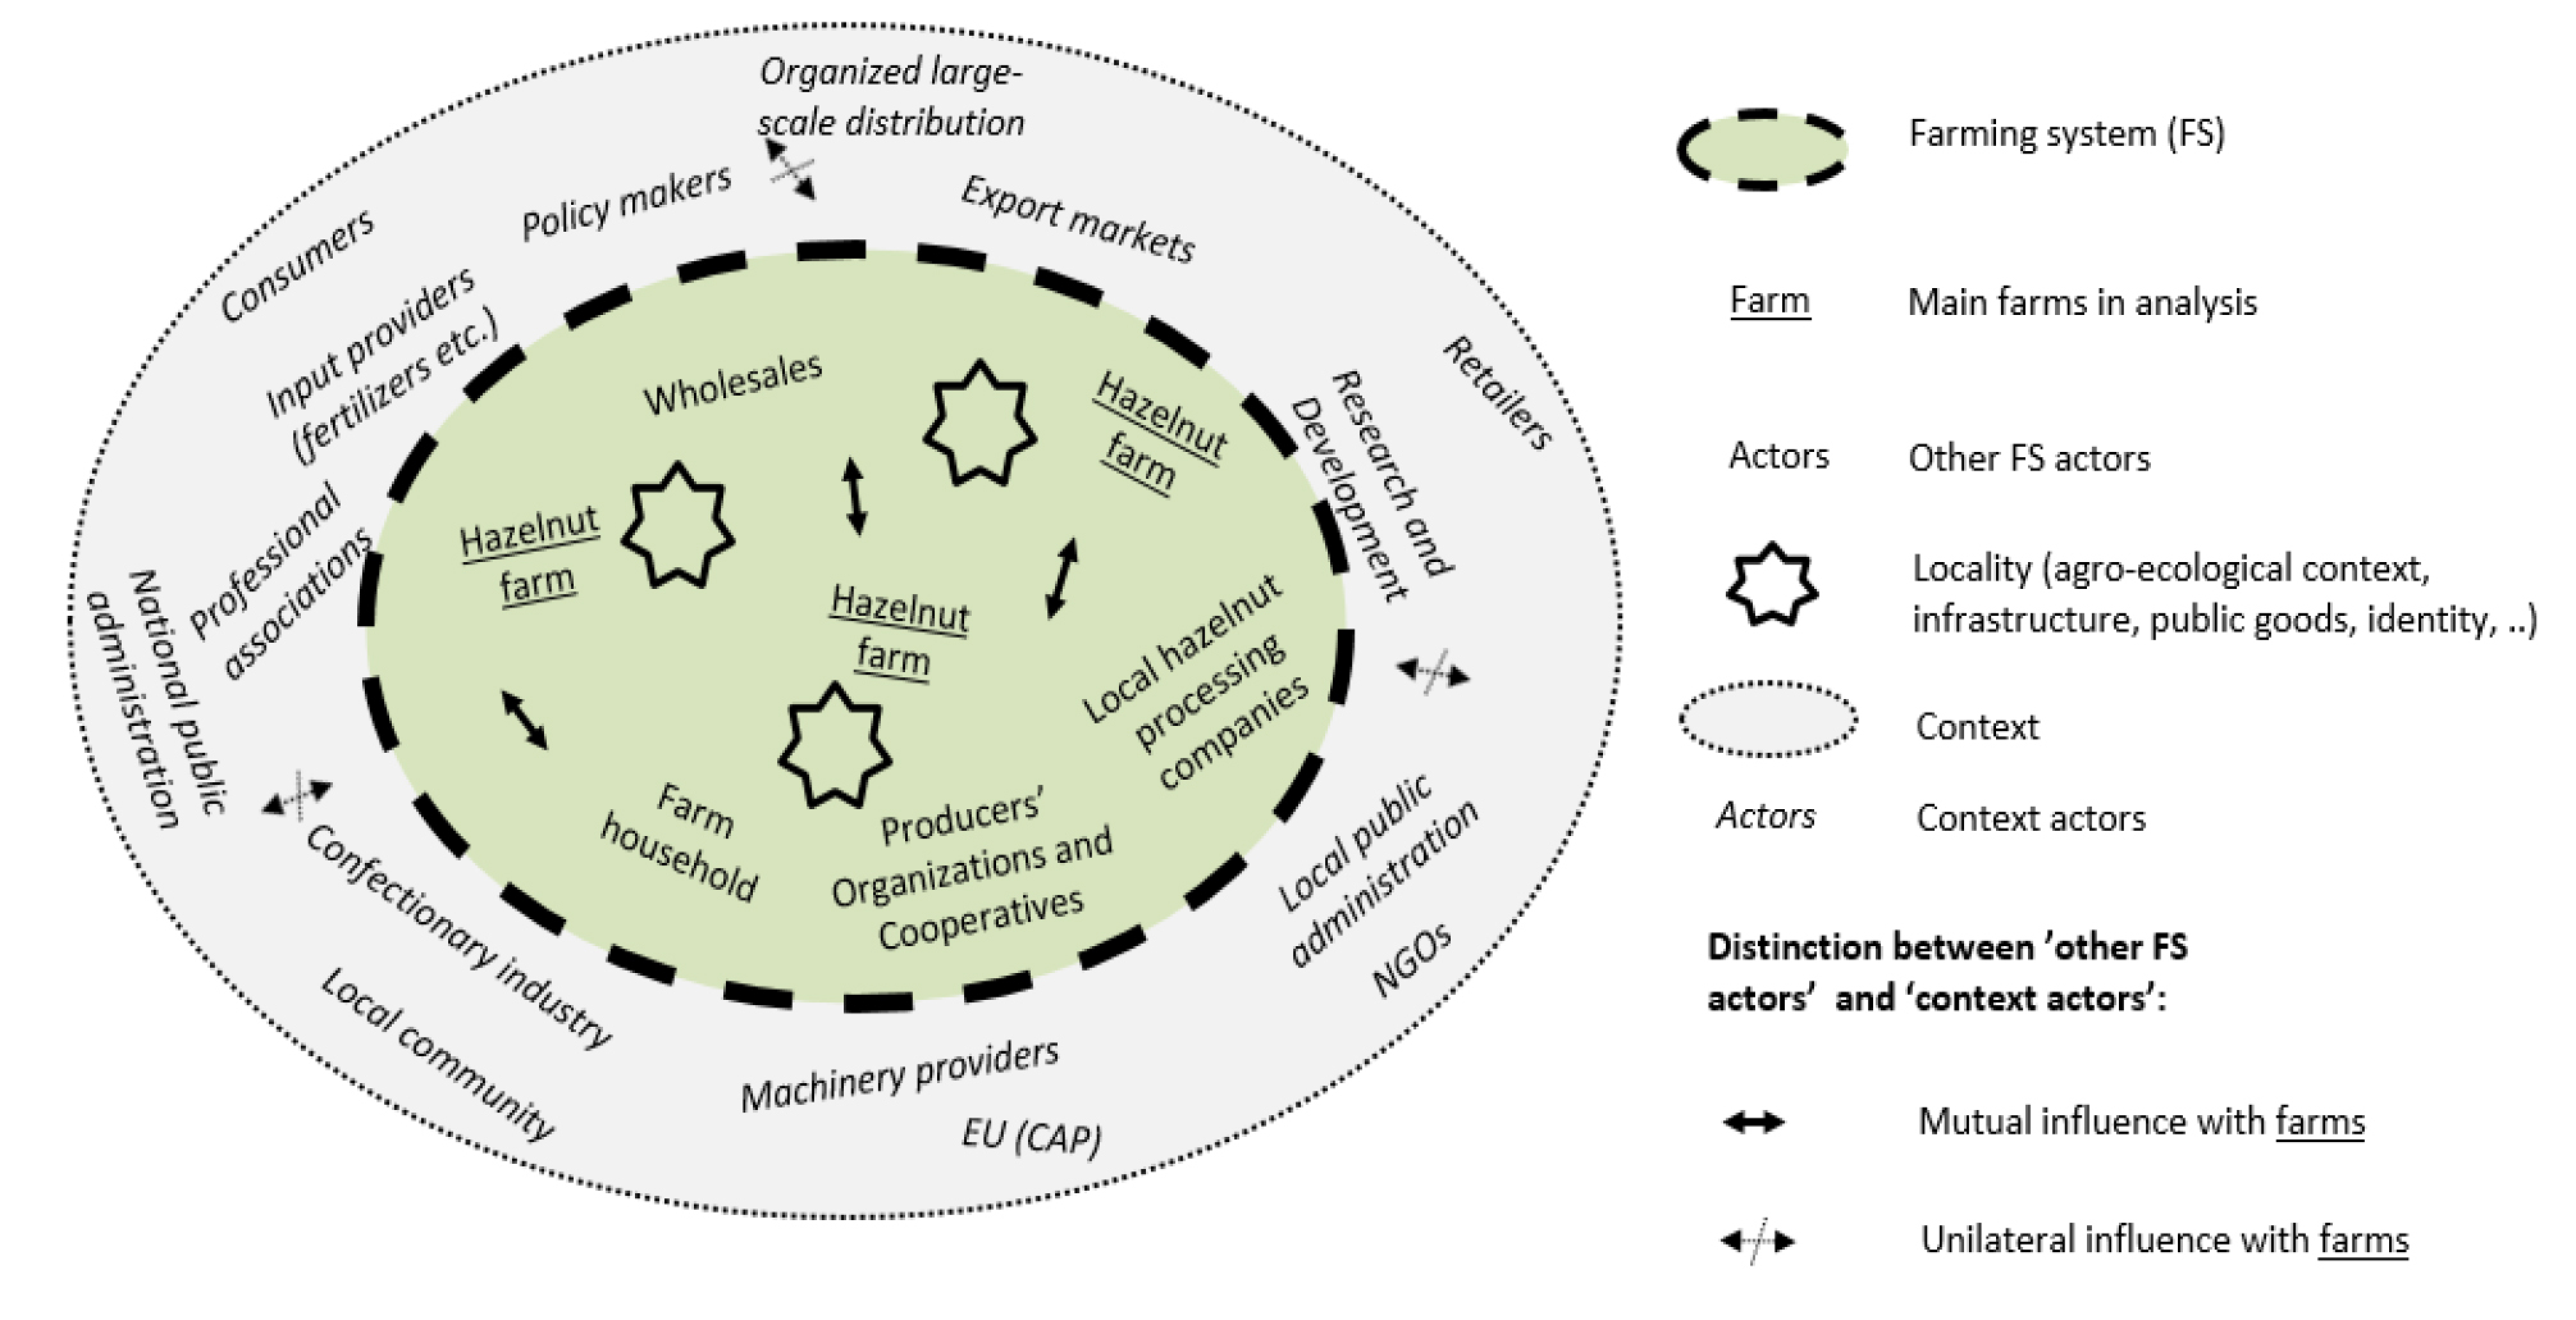
3.1. Farming System
3.2. Functions
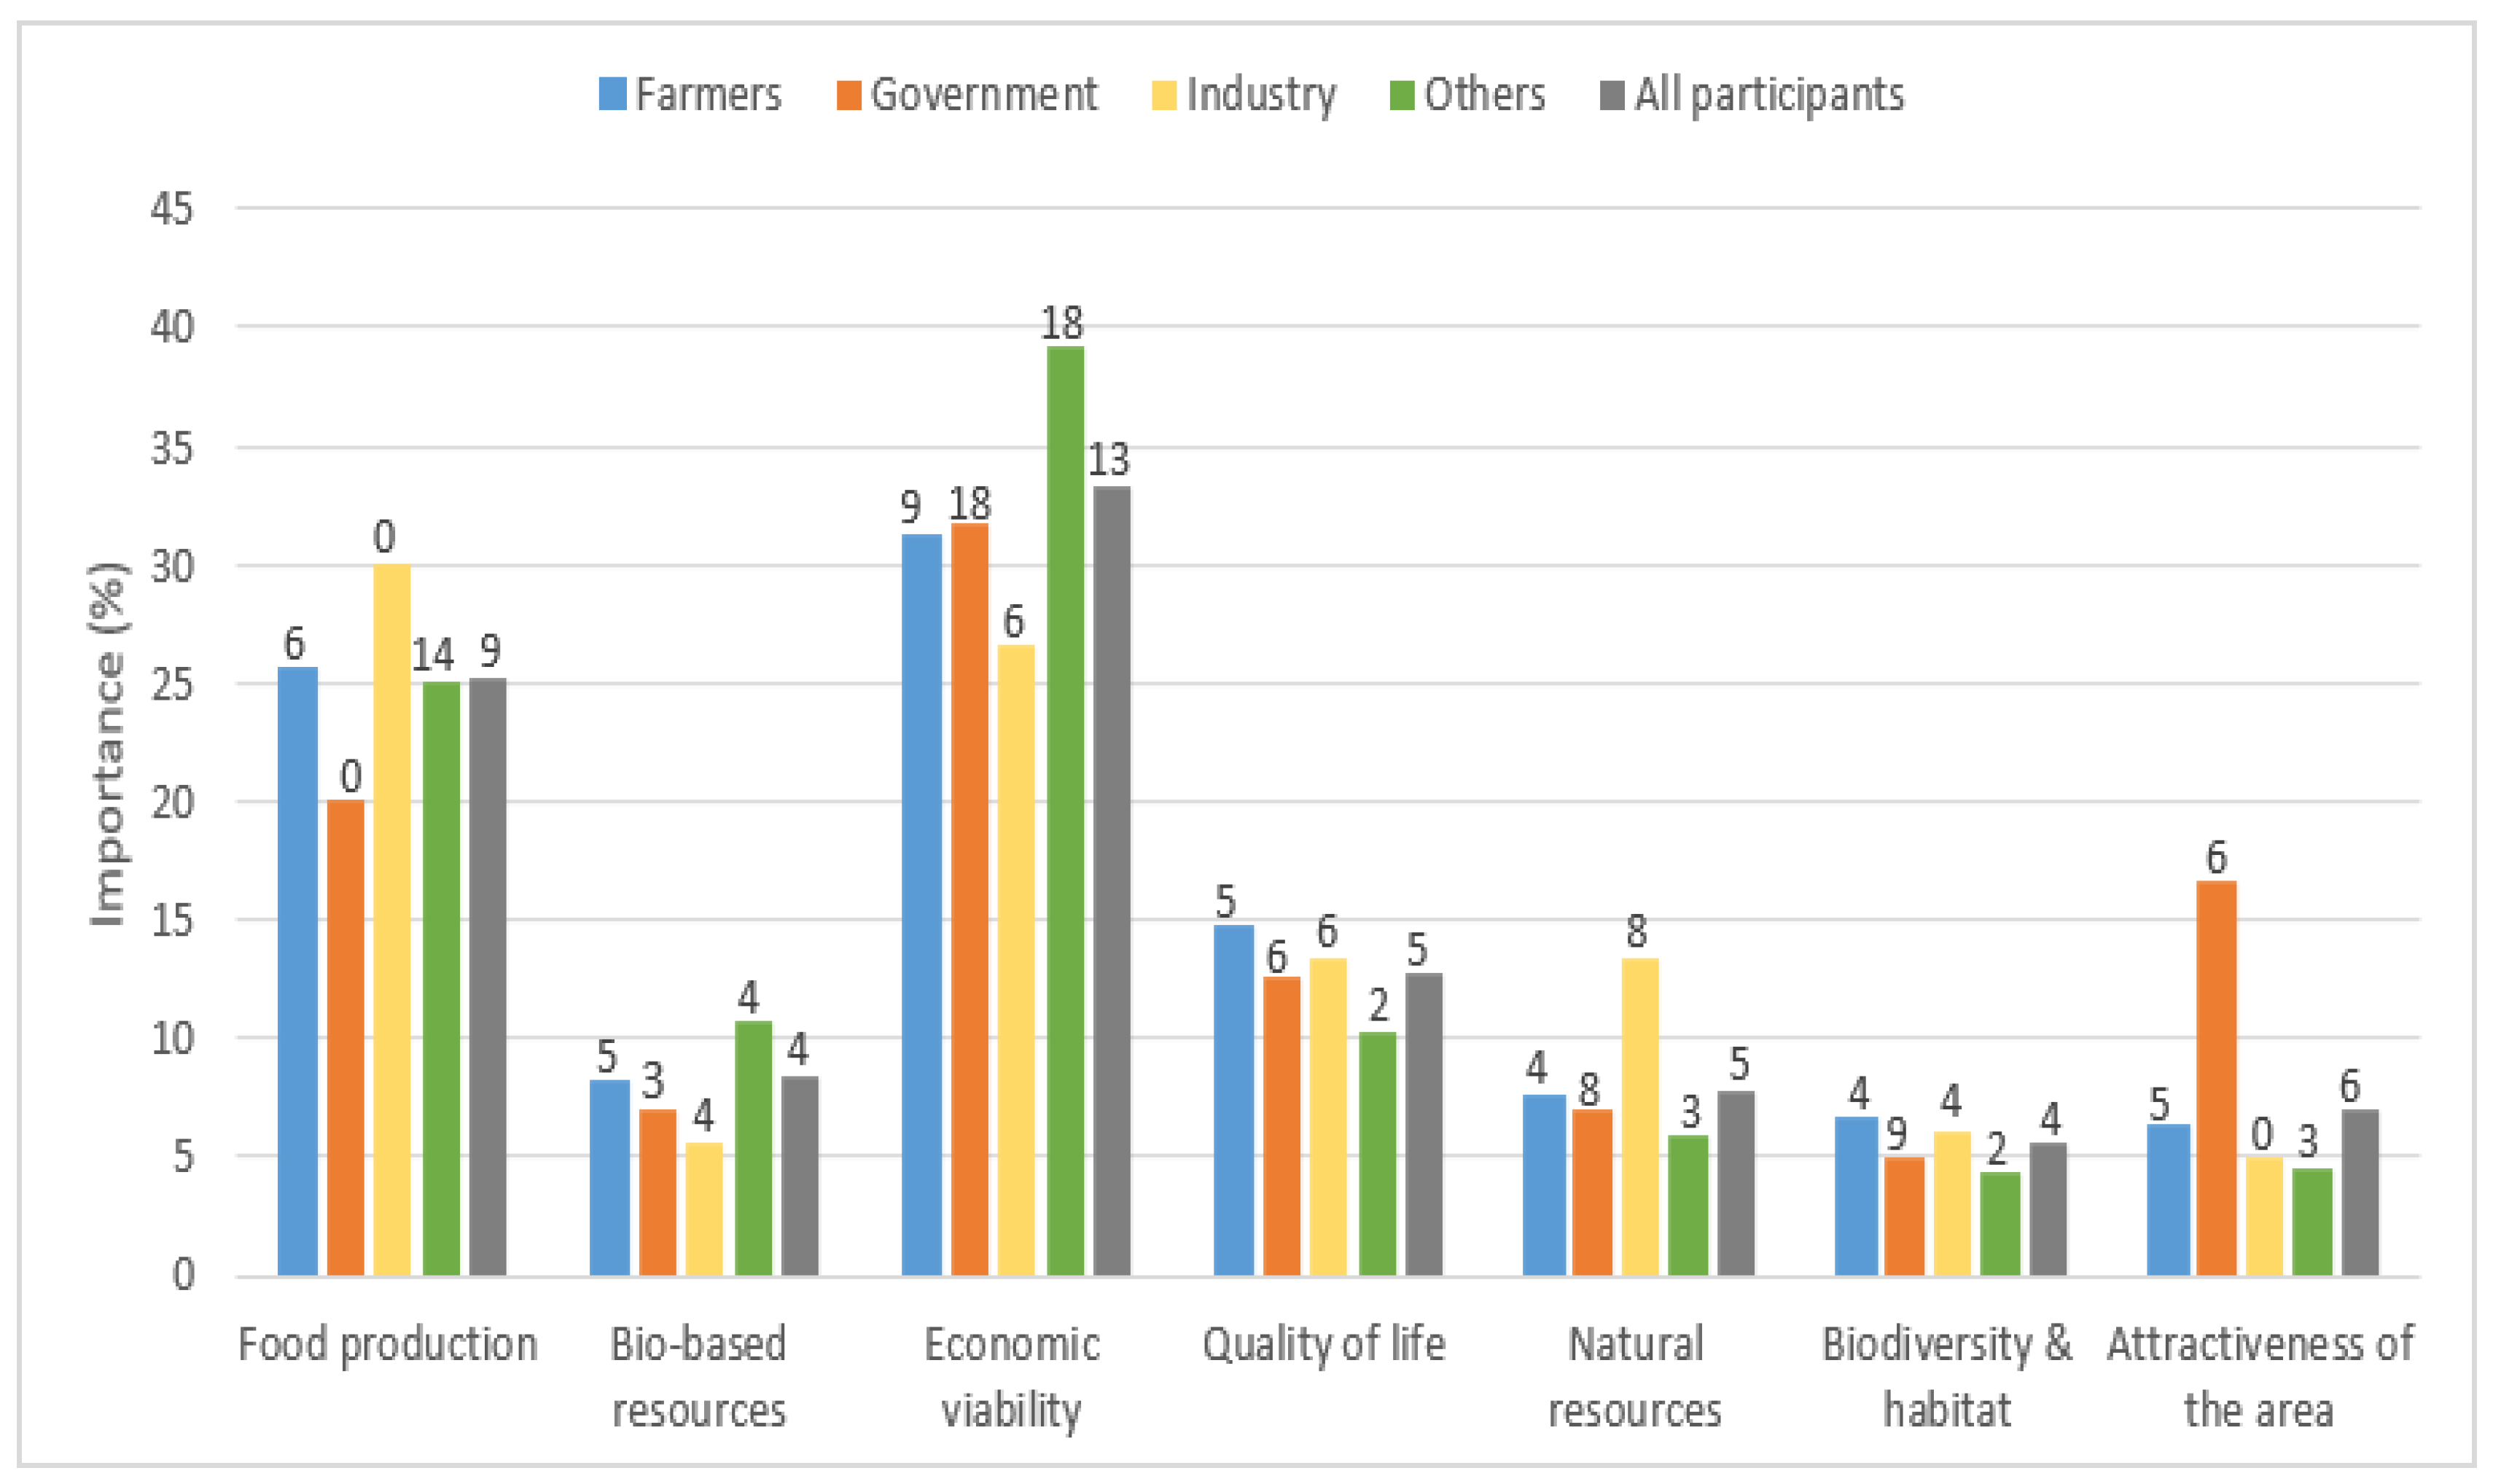
3.2.1. Function Performance
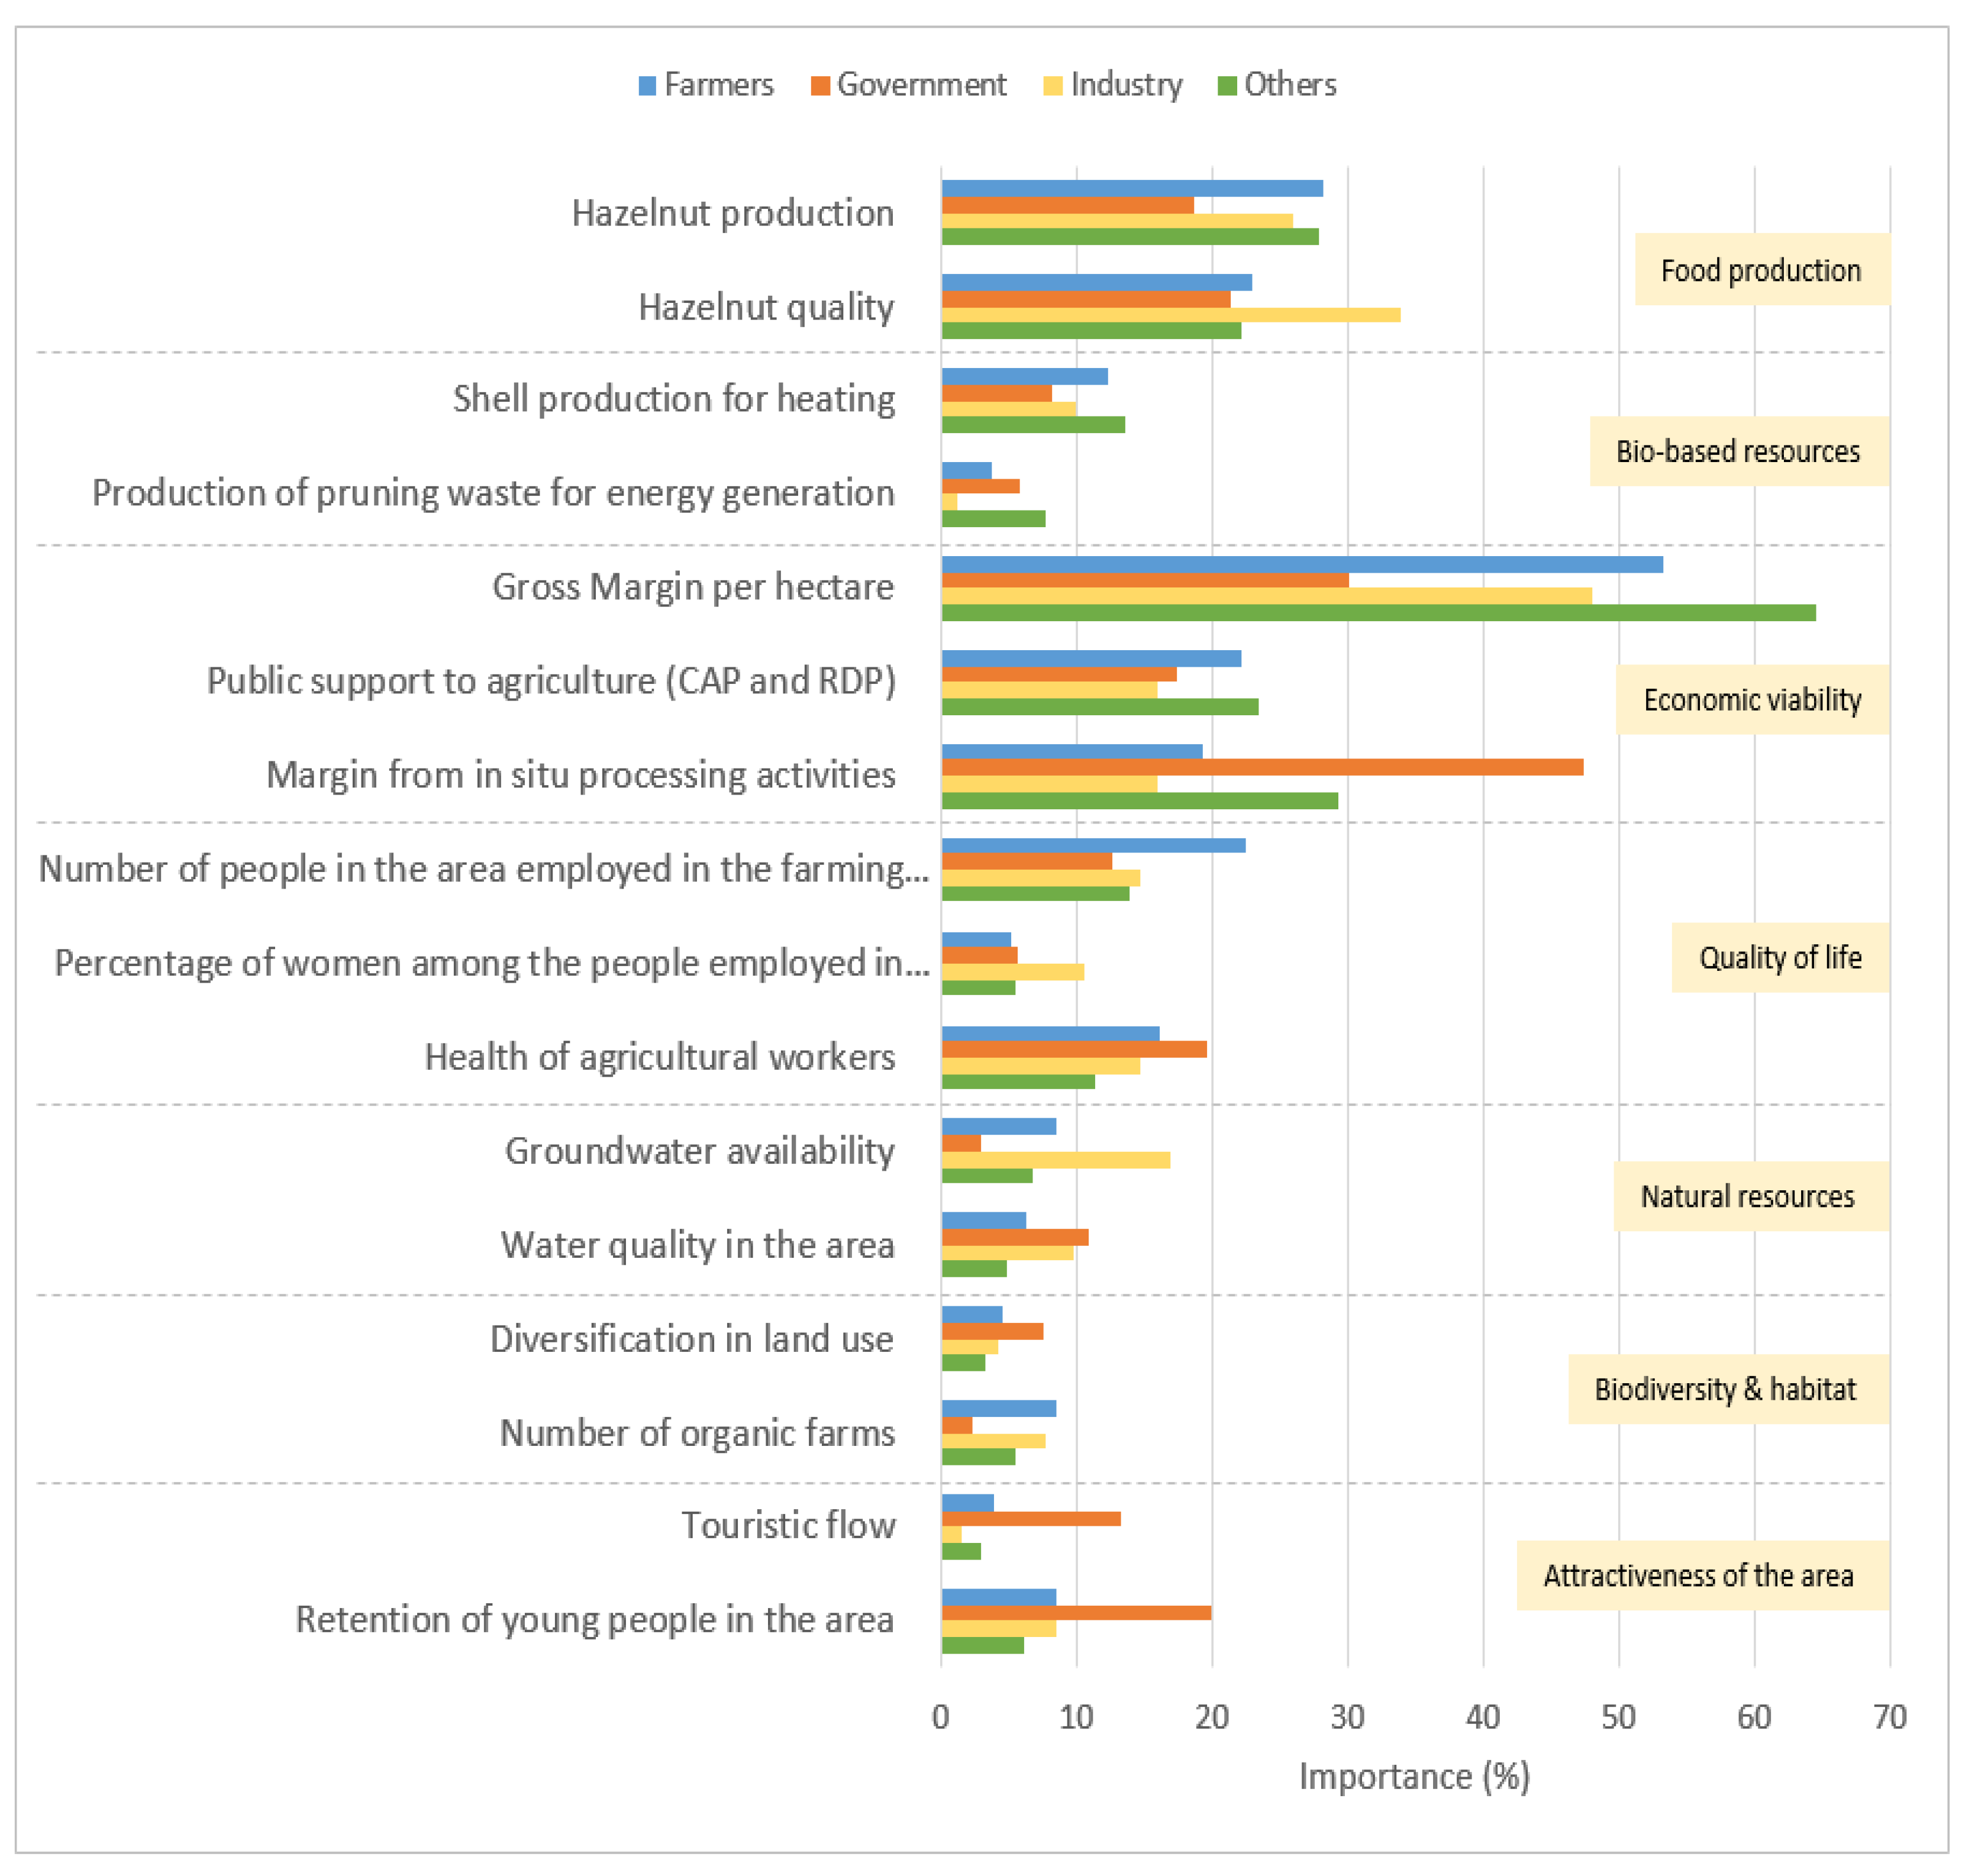
3.2.2. Indicator Importance
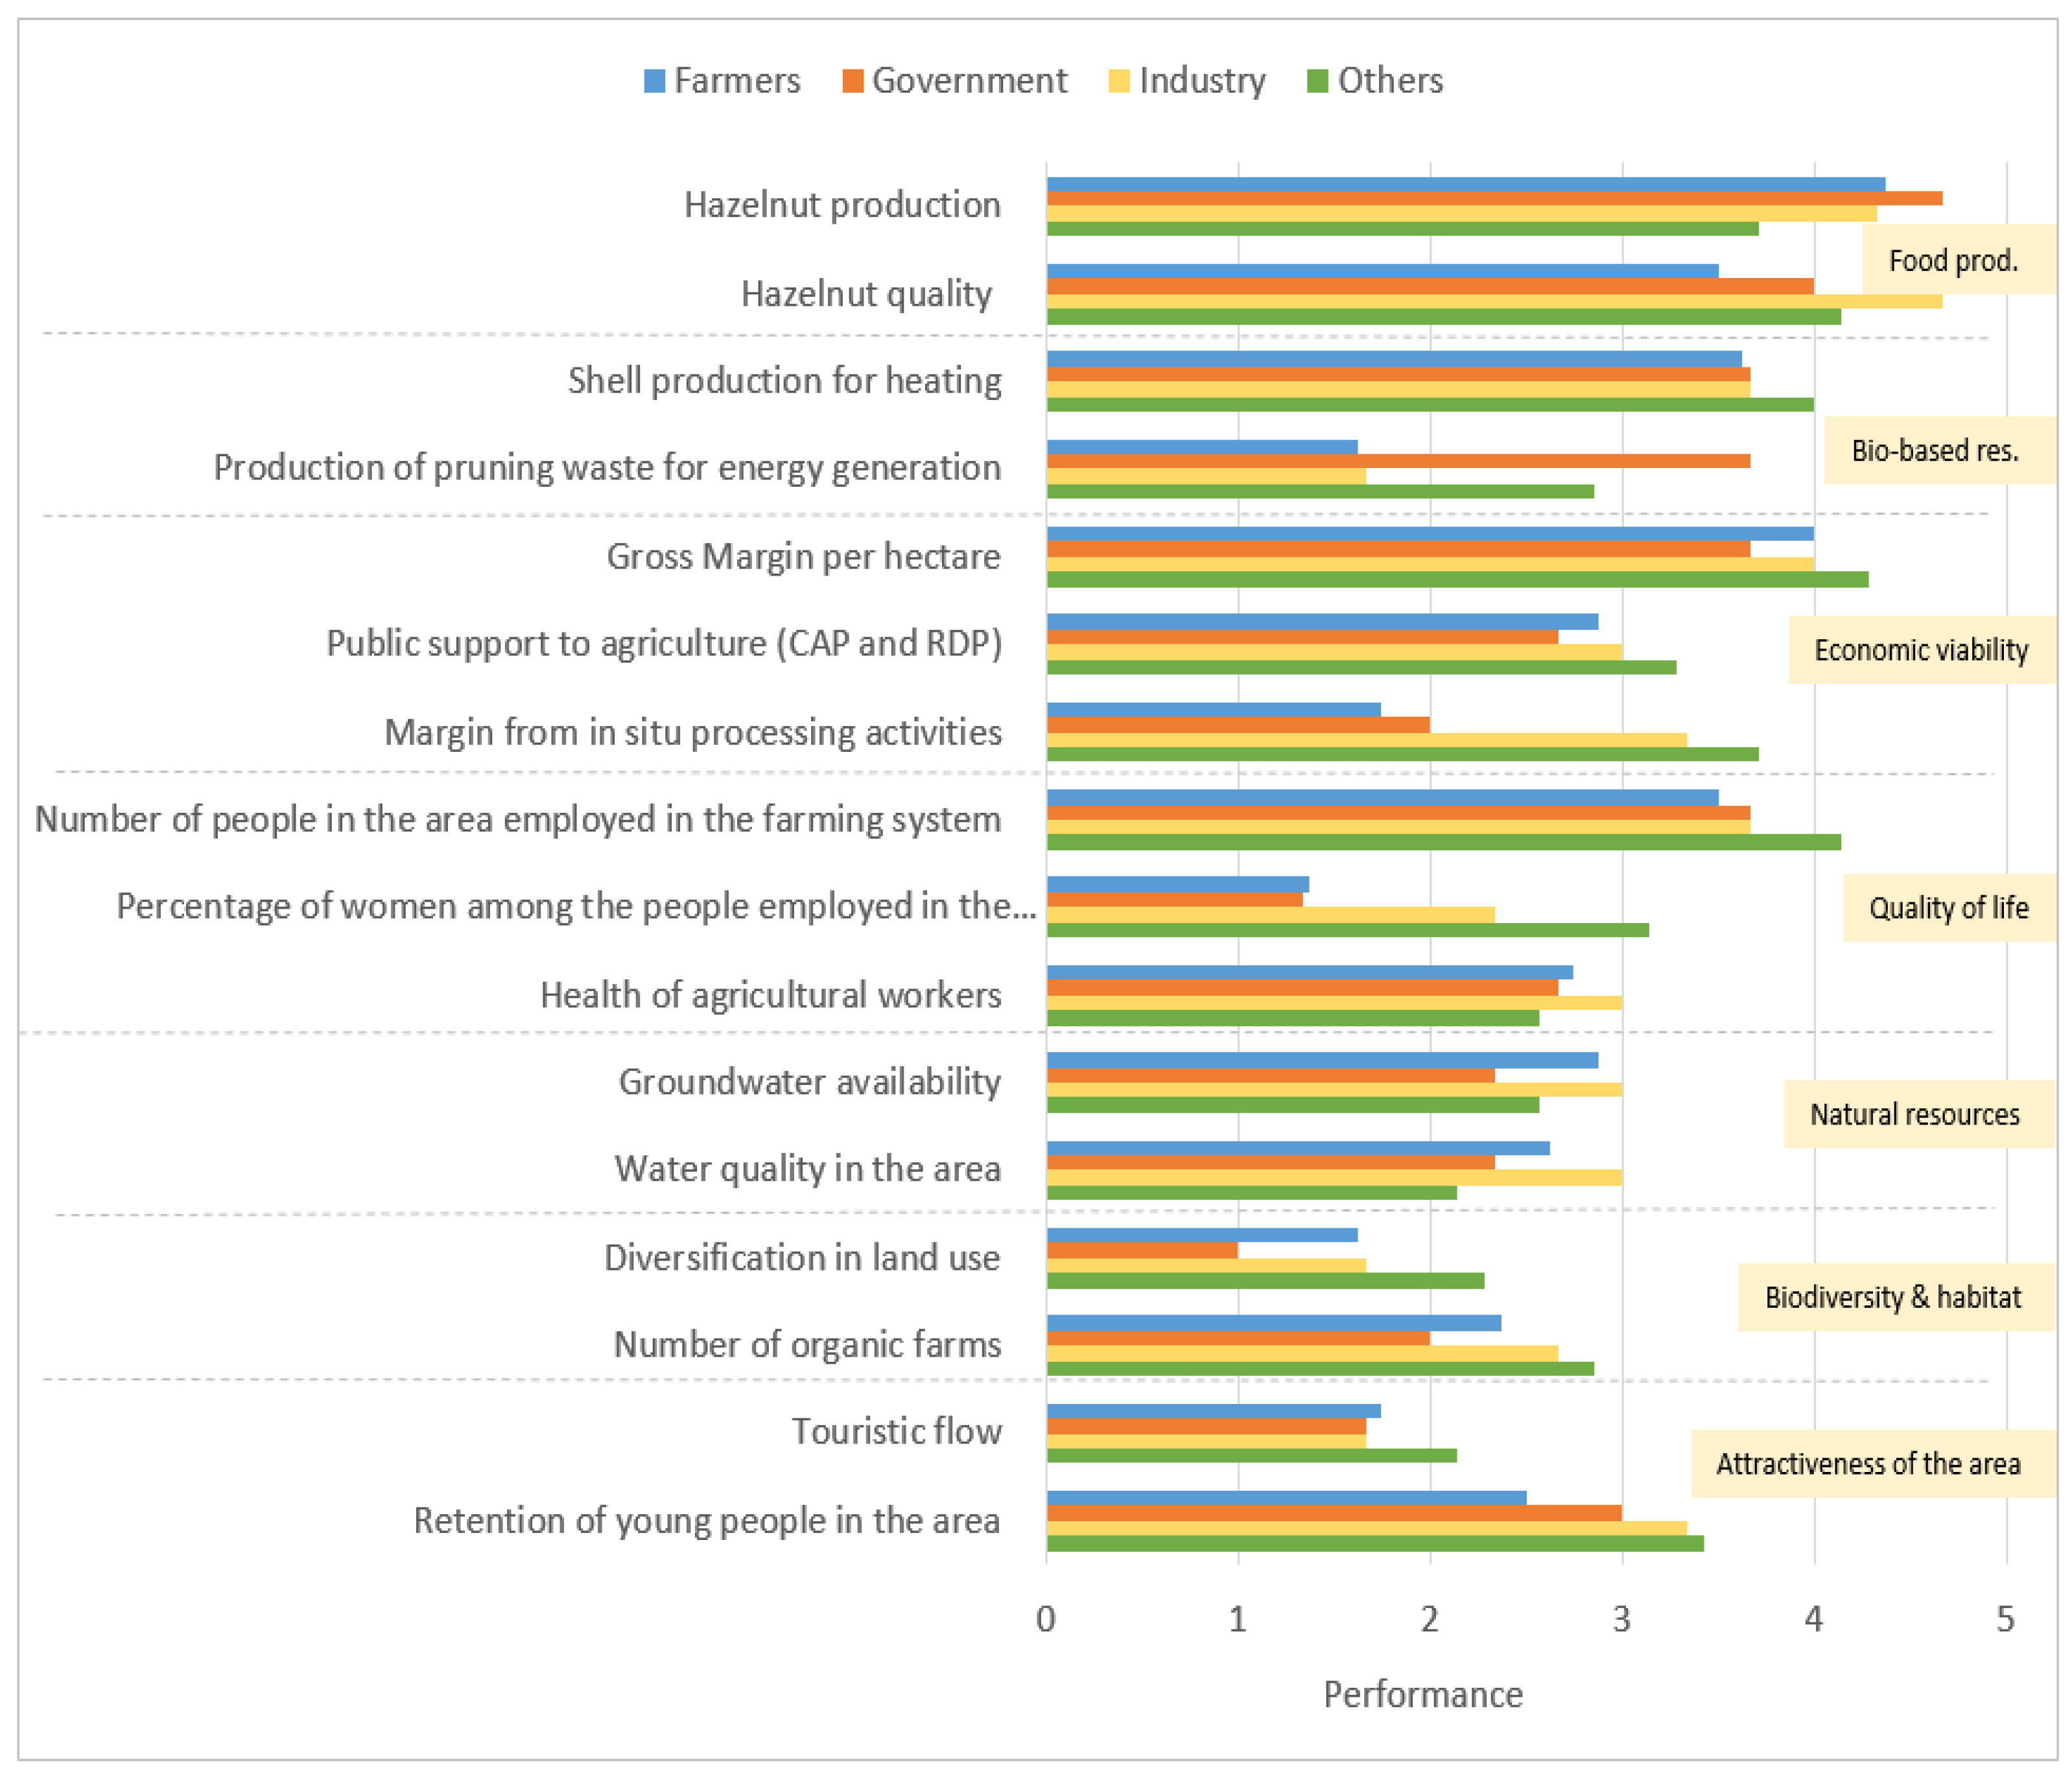
3.2.3. Indicator Performance
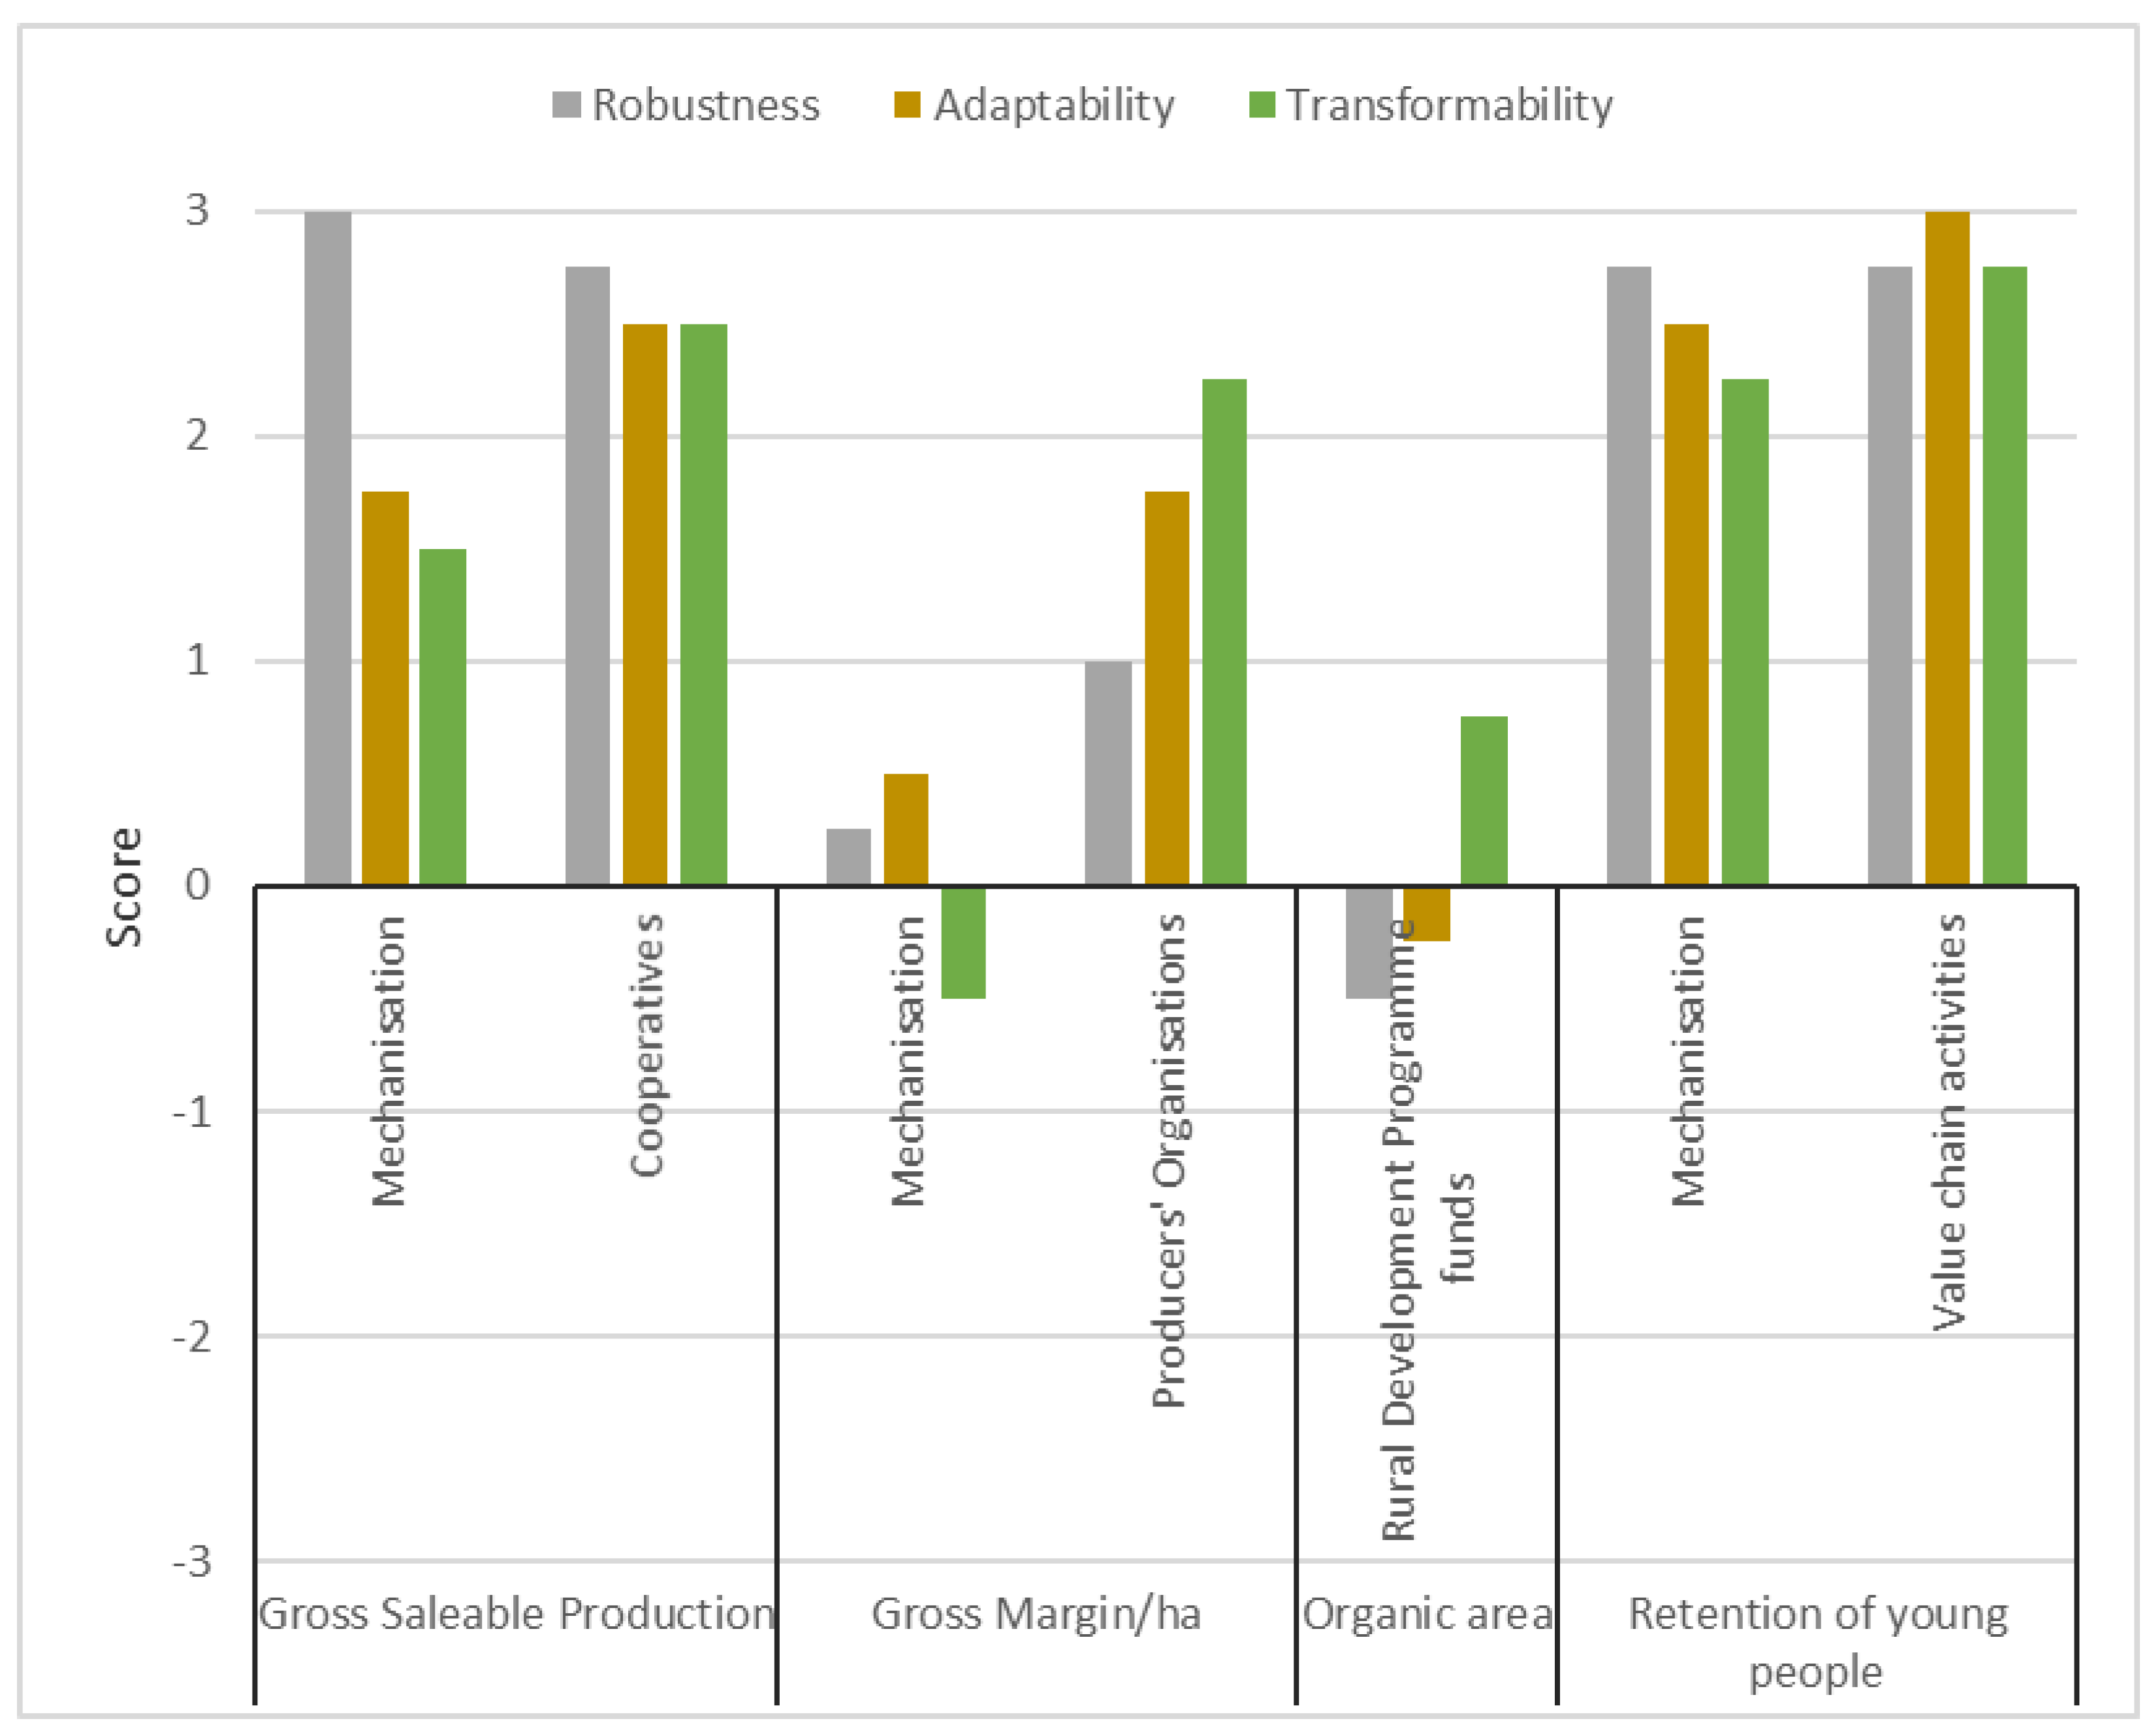
3.3. From Indicators to Challenges, Strategies and Resilience Capacities
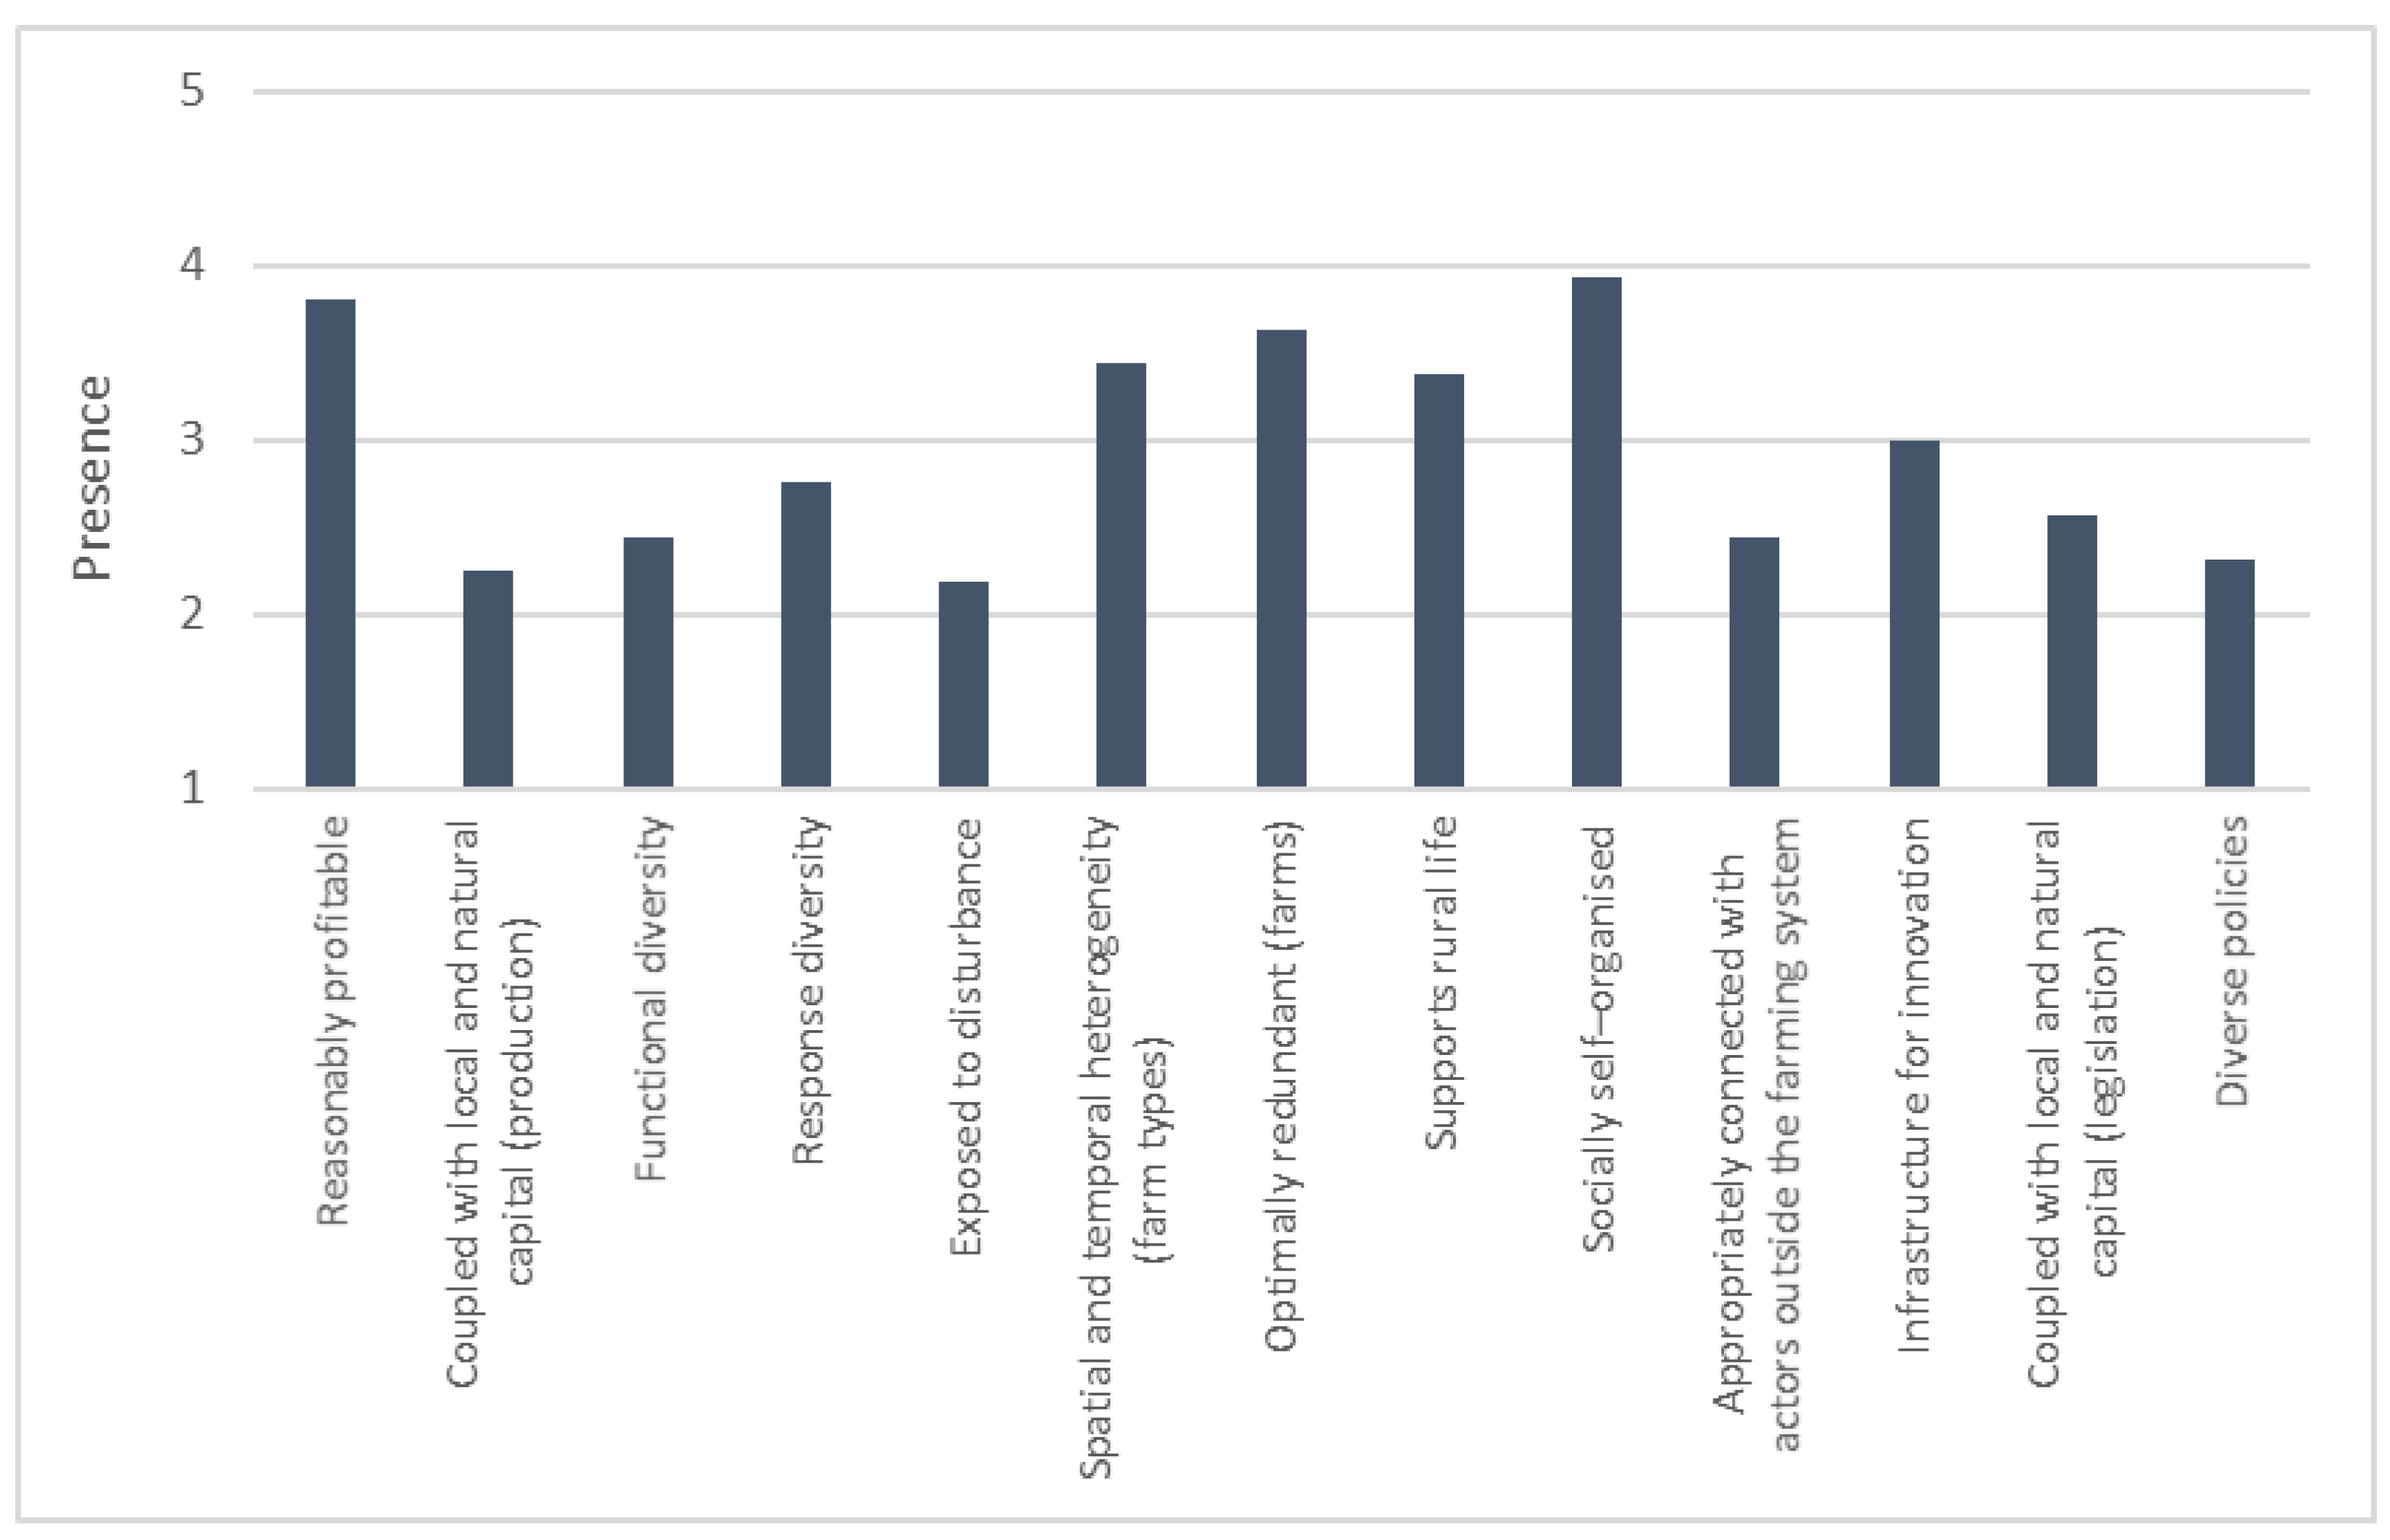
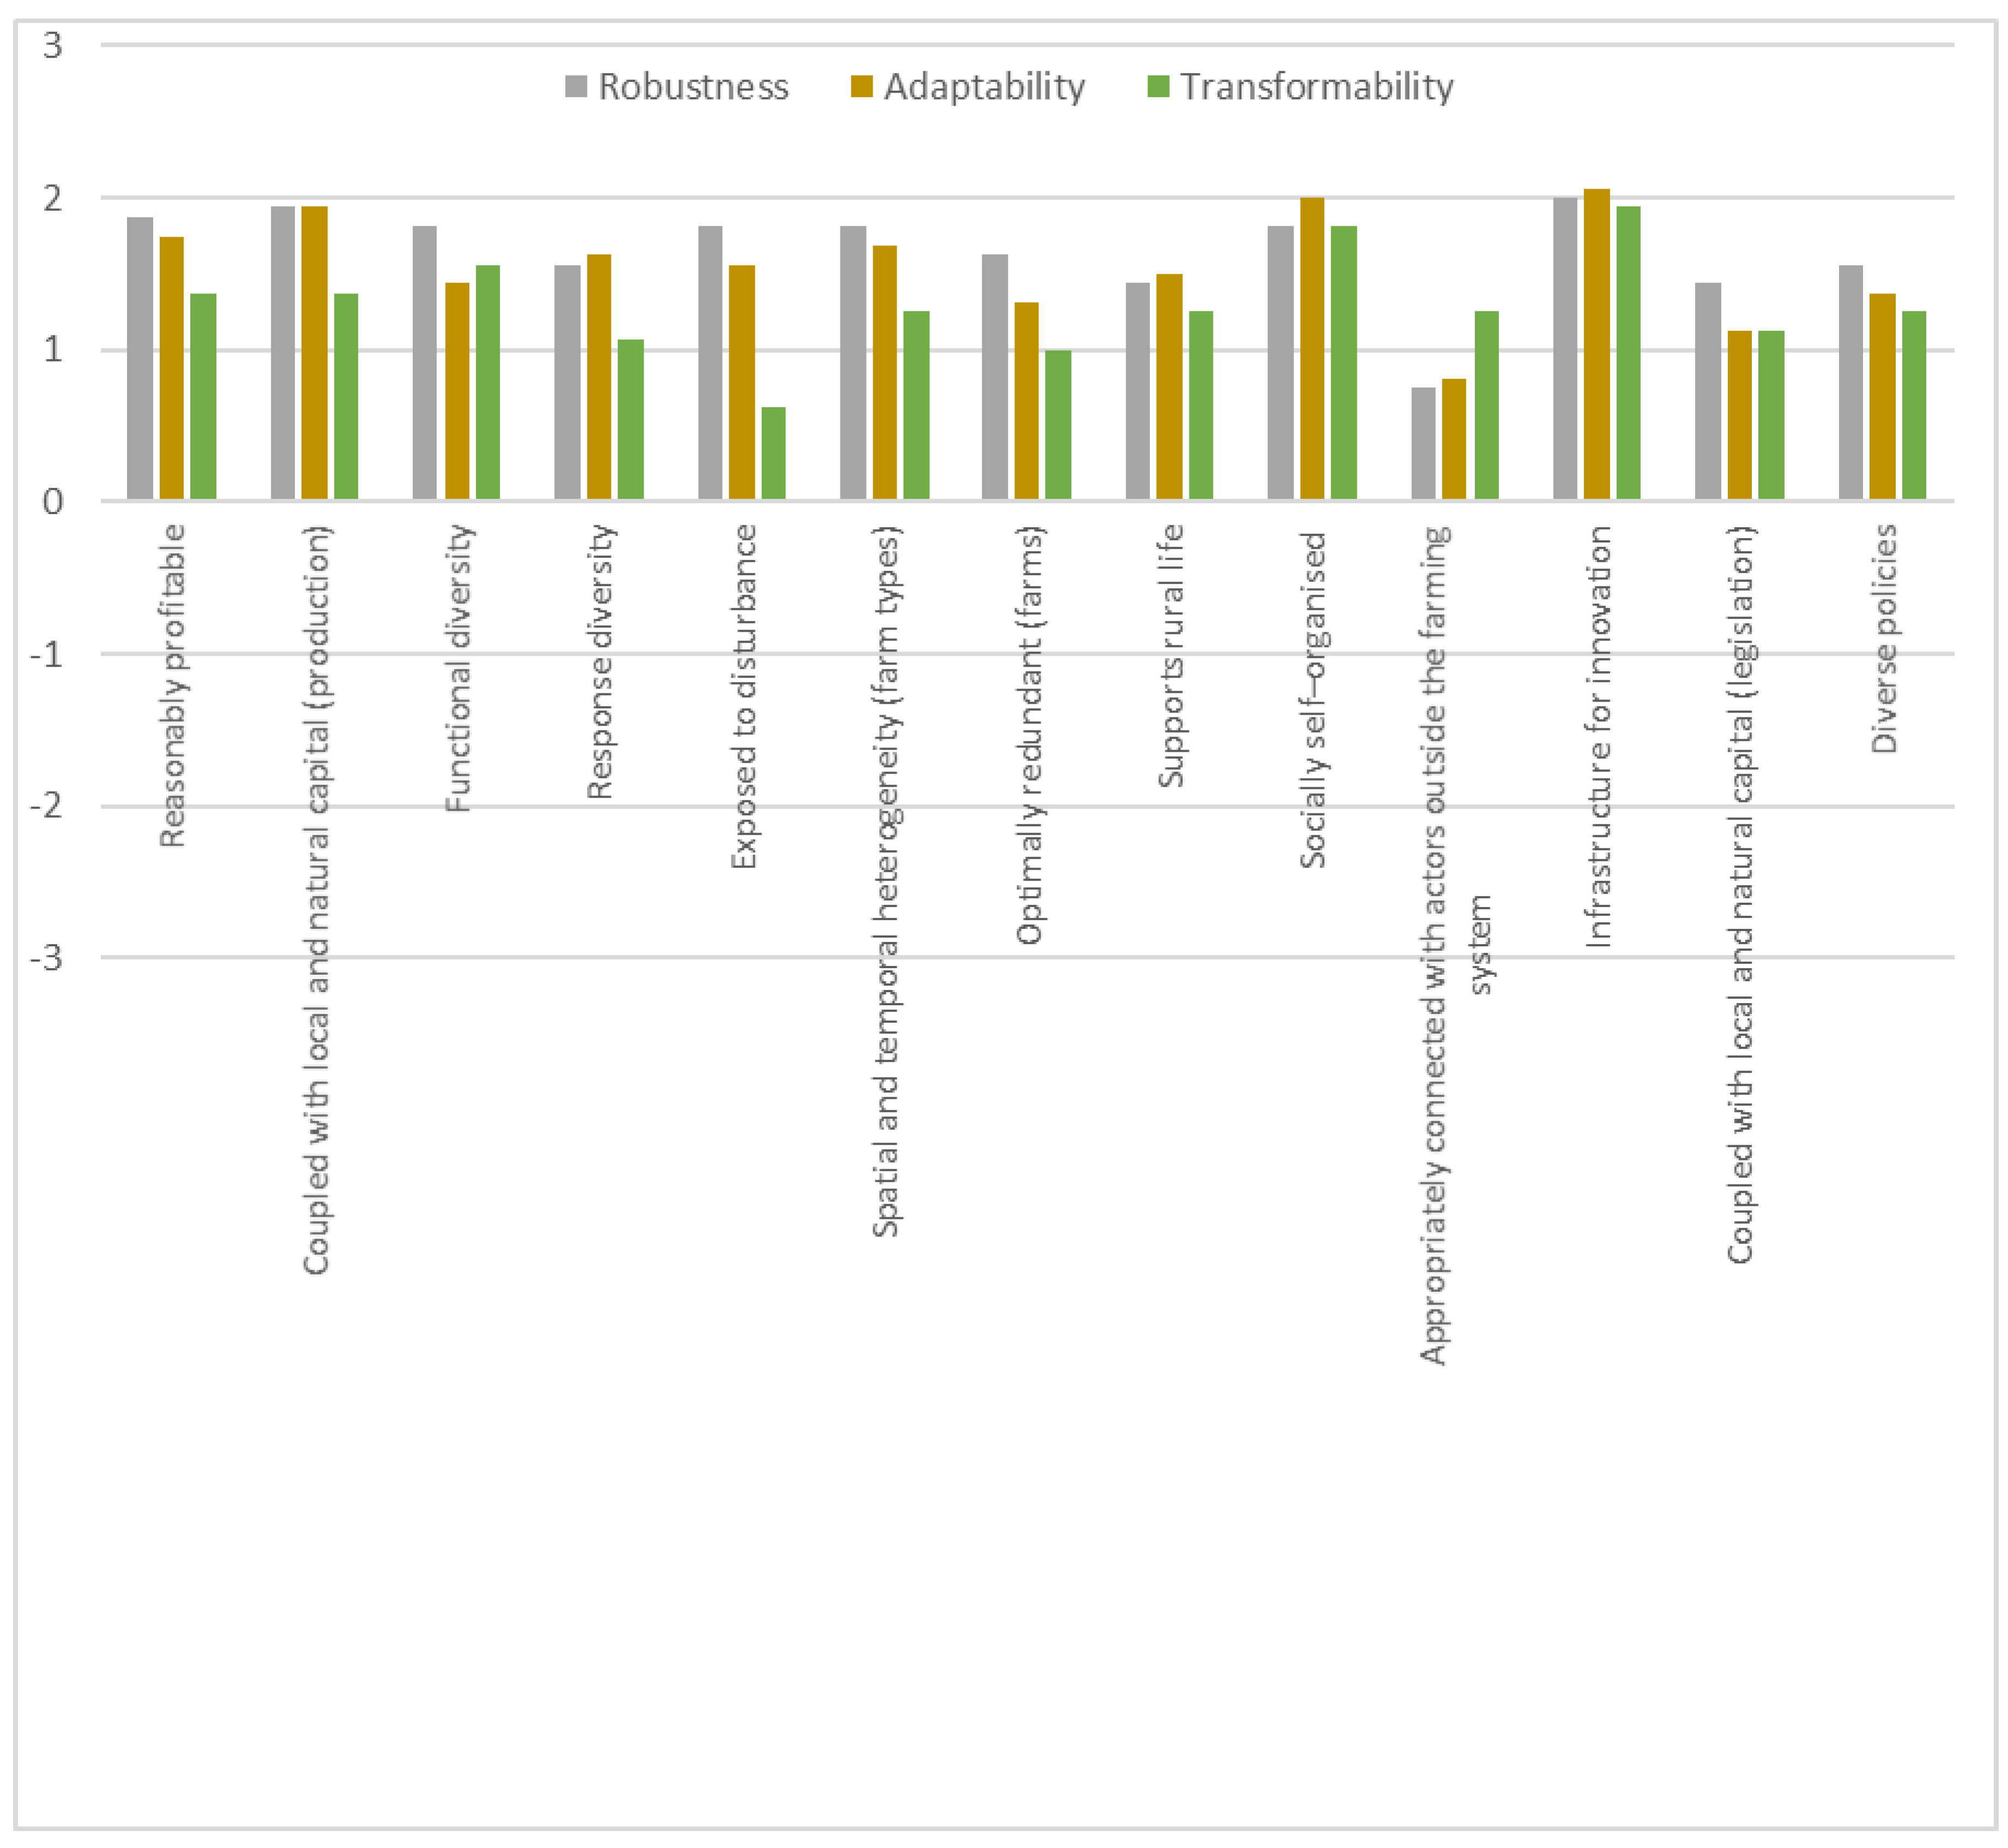
3.4. Resilience Attributes
4. Discussion
4.1. Methodological Challenges
4.2. System Functions
4.3. Robustness, Adaptability, and Transformability of the Farming System
4.4. Resilience and Sustainability of the Farming System
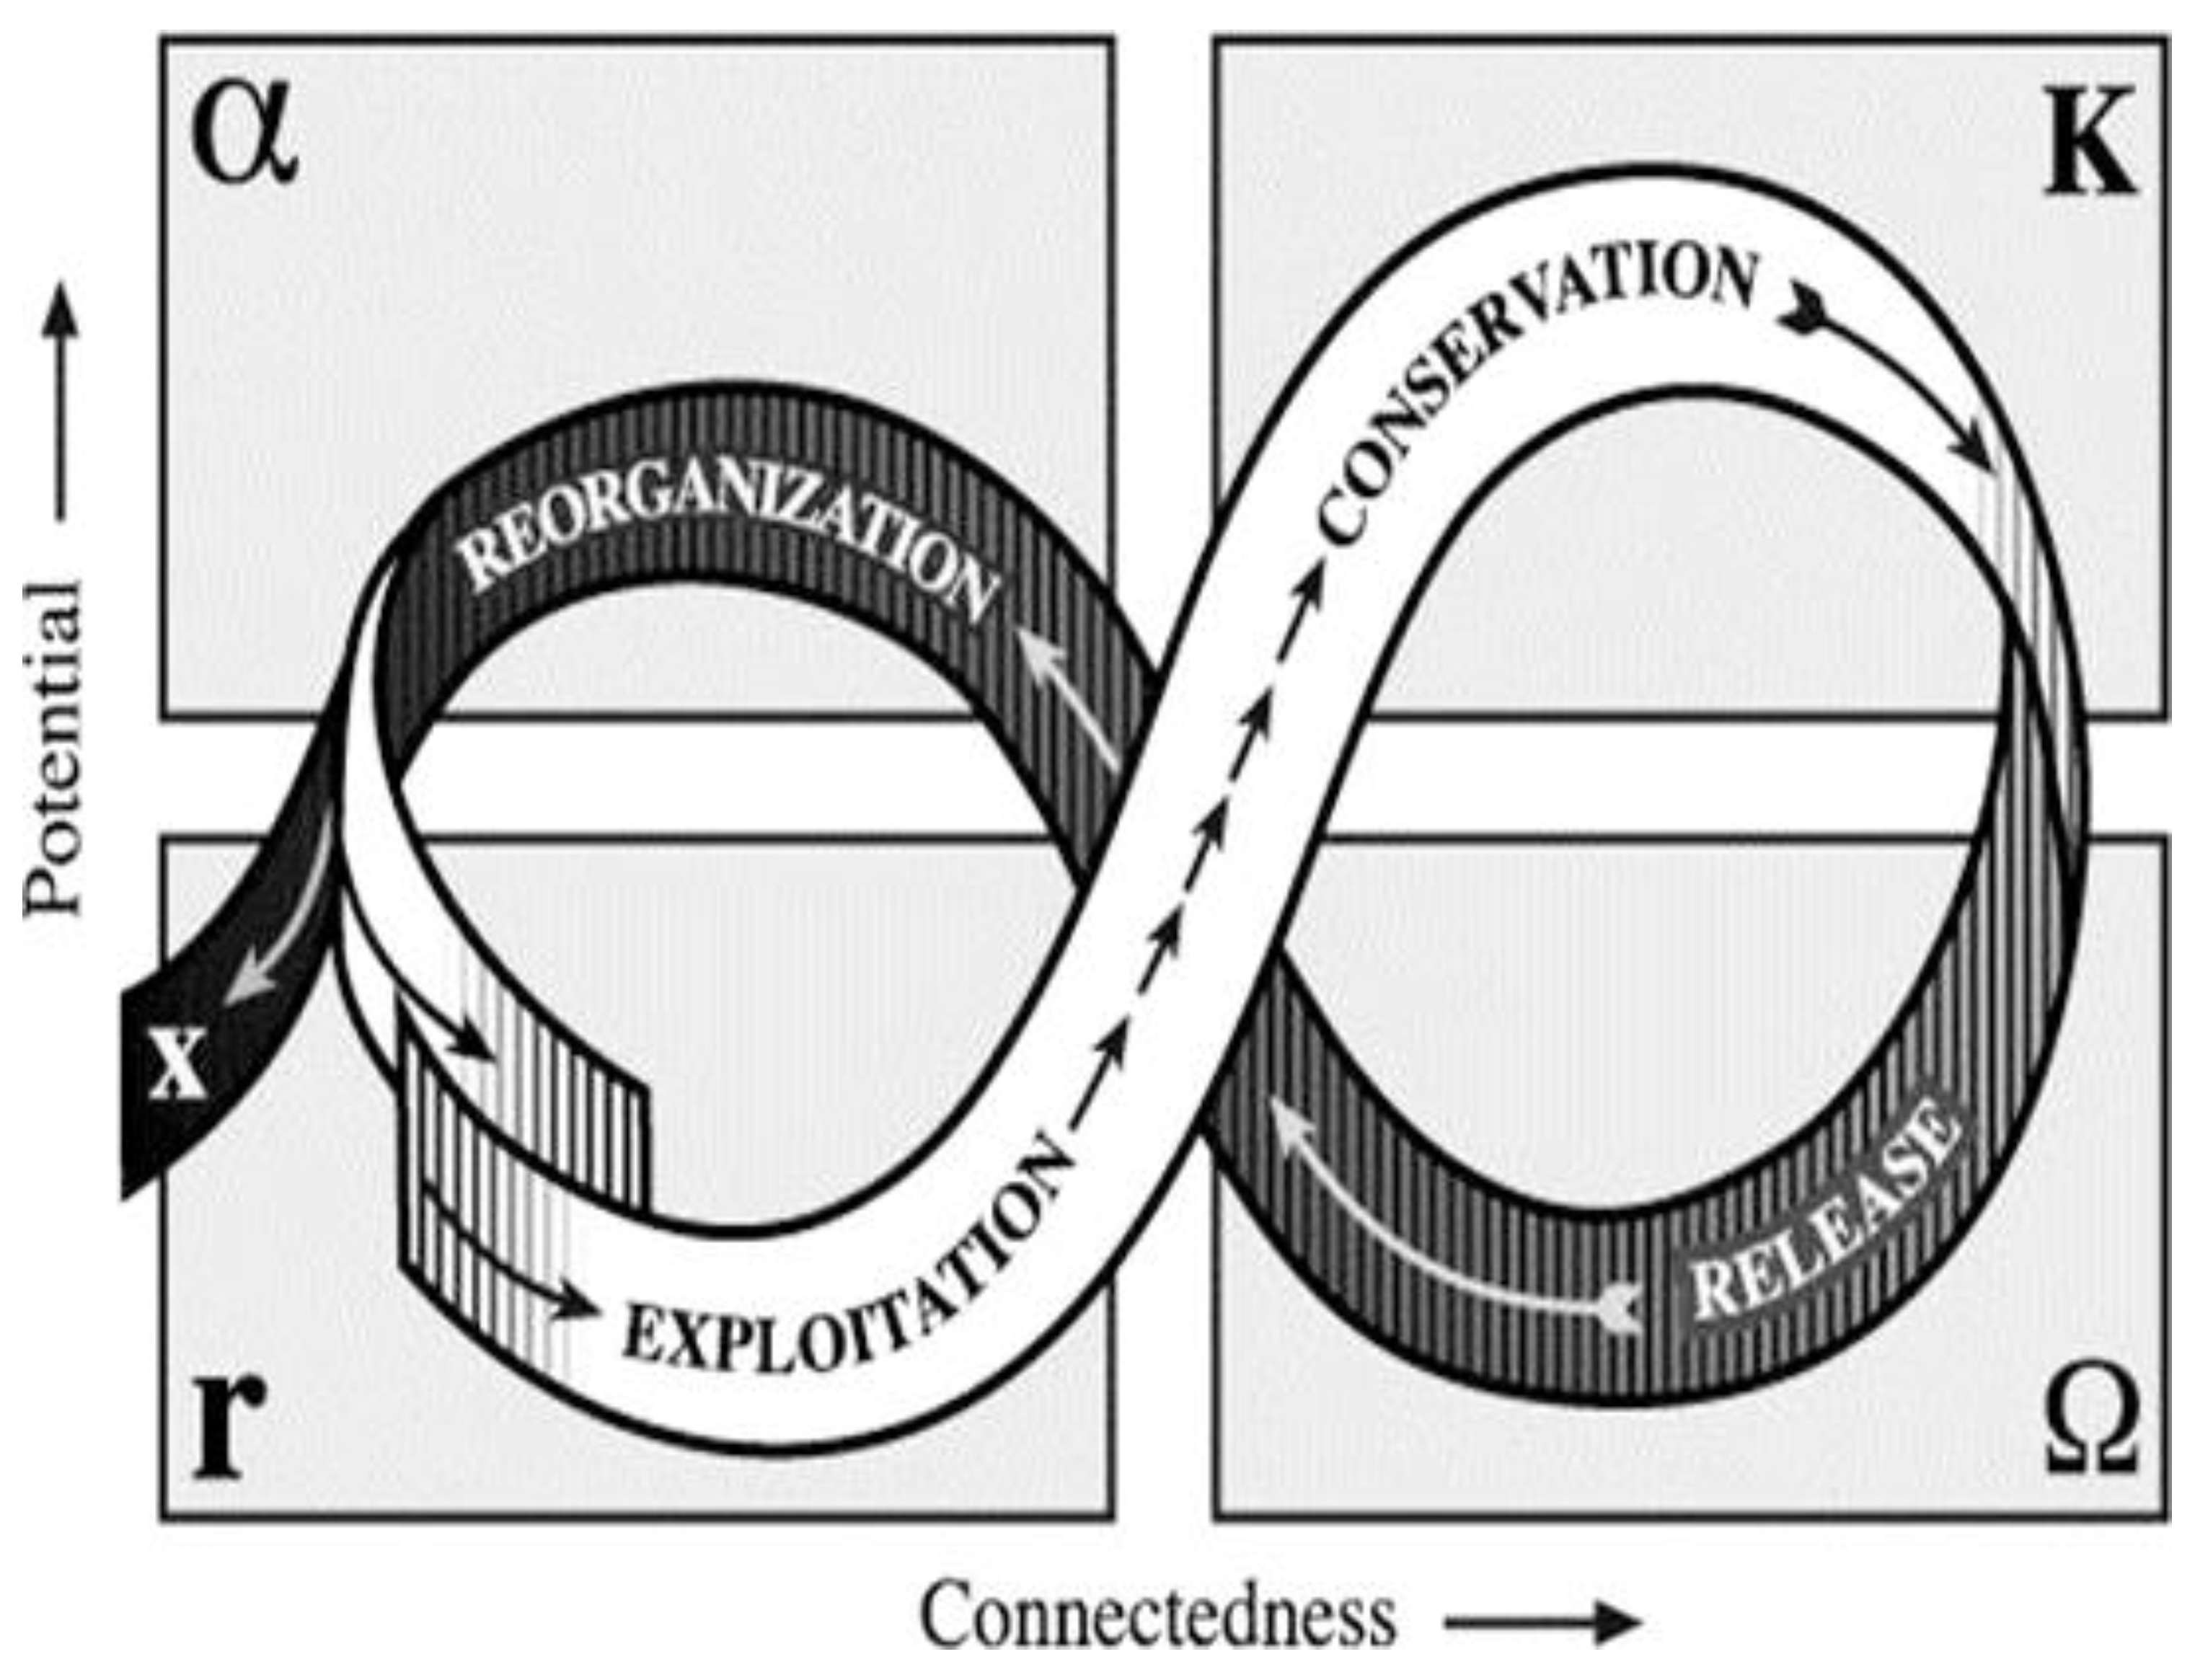
4.5. Position of the Farming System in the Adaptive Cycle
4.6. Improving the Resilience of the Farming System
5. Conclusions
Author Contributions
Funding
Acknowledgments
Conflicts of Interest
Appendix A

| Challenges | Economic | Environmental | Institutional | Social |
|---|---|---|---|---|
| Shocks (permanent and non-permanent) | Hazelnut price volatility | Spring frost | Payment delays from RDPs (Rural Development Programmes) | |
| Volume of Turkish production | Drought | Processors’ strategic decisions (for vertical integration) | ||
| Turkish economic conditions (e.g., policies, exchange rate) | Hail | Binding local environmental regulations | ||
| Pests and diseases | ||||
| Heat-related issues (e.g., sterility, fruit development) | ||||
| Long-term pressures | Expansion of hazelnut cultivated area, in Italy and worldwide | Climate change | Increasing societal awareness on environmental issues (e.g., pollution from agrochemicals) | |
| Market power of the confectionary industry | Depletion of groundwater resources |
| Attribute | Explanation | Process | Principle |
|---|---|---|---|
| Reasonably profitable | Farmers and farm workers earn a viable wage while not depending heavily on subsidies. | Agricultural production | System reserves |
| Coupled with local and natural capital (production) | Soil fertility, water resources and existing nature are maintained well. | Agricultural production | System reserves |
| Functional diversity | There is a high variety of inputs, outputs, income sources and markets. | Risk management | Diversity |
| Response diversity | There is a high diversity of risk management strategies, e.g., different pest controls, weather insurance, flexible payment arrangements. | Risk management | Diversity |
| Exposed to disturbance | The amount of year to year economic, environmental, social or institutional disturbance is small (well dosed) in order to timely adapt to a changing environment. | Risk management | Openness |
| Spatial and temporal heterogeneity (farm types) | There is a high diversity of farm types with regard to economic size, intensity, orientation and degree of specialisation. | Farm demographics, Risk management | Modularity, Diversity |
| Optimally redundant (farms) | Farmers can stop without endangering continuation of the farming system and new farmers can enter the farming system easily. | Farm demographics, Risk management | Modularity |
| Supports rural life | Rural life is supported by the presence of people from all generations, and also supported by enough facilities in the nearby area (e.g., supermarkets, hospital, shops). | Farm demographics | System reserves |
| Socially self-organised | Farmers are able to organize themselves into networks and institutions such as co-ops, community associations, advisory networks and clusters with the processing industry. | Governance | Tightness of feedbacks |
| Appropriately connected with actors outside the farming system | Farmers and other actors in the farming system are able to reach out to policy makers, suppliers and markets that operate at the national and EU level. | Governance | Tightness of feedbacks |
| Infrastructure for innovation | Existing infrastructure facilitates knowledge and adoption of cutting-edge technologies (e.g., digital). | Governance, Agricultural production | Openness, System reserves |
| Coupled with local and natural capital (legislation) | Norms, legislation and regulatory frameworks are well adapted to the local conditions. | Governance, Agricultural production | System reserves |
| Diverse policies | Policies stimulate all three capacities of resilience, i.e., robustness, adaptability, transformability. | Governance | Diversity |
Appendix B
Appendix B.1. Gross Saleable Production

Appendix B.2. Gross Margin per Hectare

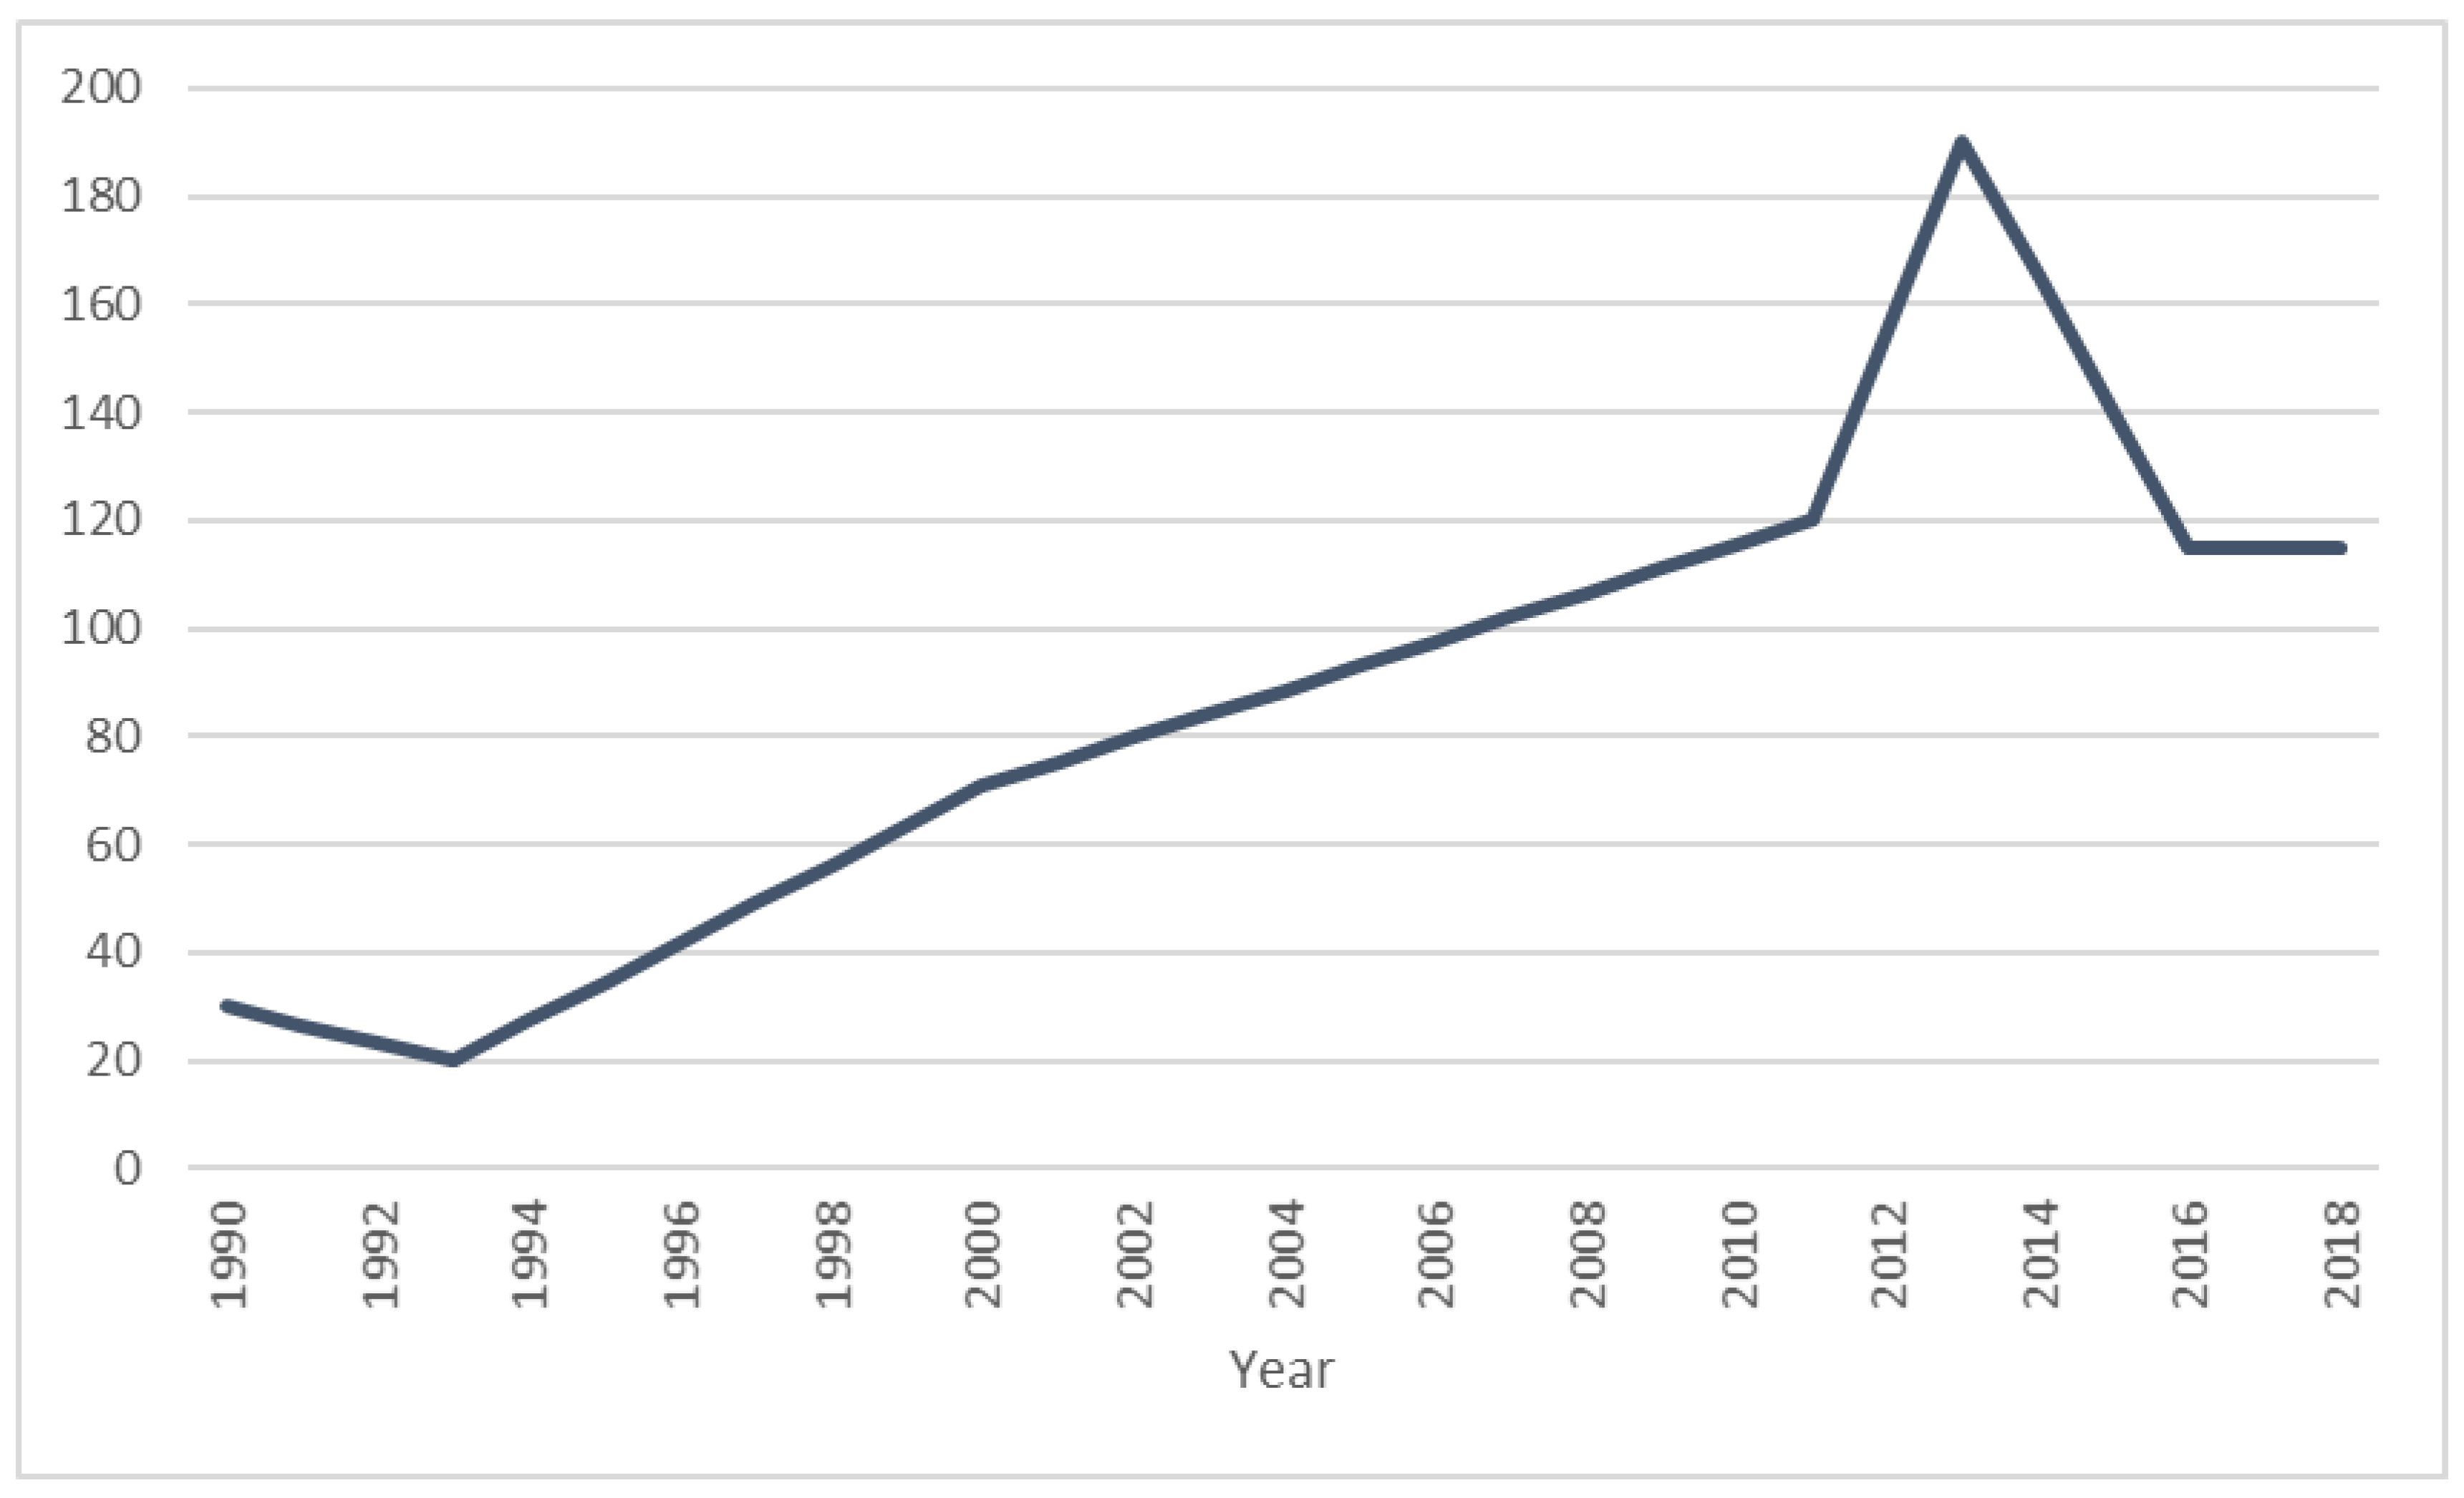
Appendix B.3. Number of Organic Farms

Appendix B.4. Retention of Young People in the Area

References
- Meuwissen, M.; Feindt, P.H.; Spiegel, A.; Termeer, C.J.A.M.; Mathijs, E.; de Mey, Y.; Finger, R.; Balmann, A.; Wauters, E.; Urquhart, J.; et al. A framework to assess the resilience of farming systems. Agric. Syst. 2019, 176, 102656. [Google Scholar] [CrossRef]
- Enjolras, G.; Capitanio, F.; Aubert, M.; Adinolfi, F. Direct payments, crop insurance and the volatility of farm income. Some evidence in France and in Italy. New Medit 2014, 13, 31–40. [Google Scholar]
- Darnhofer, I.; Lamine, C.; Strauss, A.; Navarrete, M. The resilience of family farms: Towards a relational approach. J. Rural Stud. 2016, 44, 111–122. [Google Scholar] [CrossRef]
- Trnka, M.; Olesen, J.E.; Kersebaum, K.C.; Skjelvåg, A.O.; Eitzinger, J.; Seguin, B.; Peltonen-Sainio, P.; Rötter, R.; Iglesias, A.; Orlandini, S.; et al. Agroclimatic conditions in Europe under climate change. Glob. Chang. Biol. 2011, 17, 2298–2318. [Google Scholar] [CrossRef]
- Bijttebier, J.; Coopmans, I.; Appel, F.; Gailhard, I.U. D3.1 Report on Current Farm Demographics and Trends. 2018. Available online: https://surefarmproject.eu/wordpress/wp-content/uploads/2019/05/D3.1-Report-on-current-farm-demographics-and-trends-RP1.pdf (accessed on 4 October 2019).
- Burton, R.J.F.; Fischer, H. The succession crisis in European agriculture. Sociol. Ruralis 2015, 55, 155–166. [Google Scholar] [CrossRef]
- Tendall, D.M.; Joerin, J.; Kopainsky, B.; Edwards, P.; Shreck, A.; Le, Q.B.; Kruetli, P.; Grant, M.; Six, J. Food system resilience: Defining the concept. Glob. Food Sec. 2015, 6, 17–23. [Google Scholar] [CrossRef]
- SURE-Farm Consortium SURE Farm. Available online: https://surefarmproject.eu/about/at-a-glance/ (accessed on 10 October 2018).
- Holling, C.S. Resilience and stability of ecological systems. Annu. Rev. Ecol. Syst. 1973, 4, 1–23. [Google Scholar] [CrossRef]
- Urruty, N.; Tailliez-Lefebvre, D.; Huyghe, C. Stability, robustness, vulnerability and resilience of agricultural systems. A review. Agron. Sustain. Dev. 2016, 36, 1–15. [Google Scholar] [CrossRef]
- Walker, B.; Holling, C.S.; Carpenter, S.R.; Kinzig, A. Resilience, Adaptability and Transformability in Social-ecological Systems. Ecol. Soc. 2004, 9, 5. [Google Scholar] [CrossRef]
- Marchese, D.; Reynolds, E.; Bates, M.E.; Morgan, H.; Clark, S.S.; Linkov, I. Resilience and sustainability: Similarities and differences in environmental management applications. Sci. Total Environ. 2018, 613–614, 1275–1283. [Google Scholar] [CrossRef] [PubMed]
- Folke, C.; Carpenter, S.R.; Walker, B.; Scheffer, M.; Chapin, T.; Rockström, J. Resilience thinking: Integrating resilience, adapatability, and transformability. Ecol. Soc. 2010, 15, 20. [Google Scholar] [CrossRef]
- Ashkenazy, A.; Calvao Chebach, T.; Knickel, K.; Peter, S.; Horowitz, B.; Offenbach, R. Operationalising resilience in farms and rural regions—Findings from fourteen case studies. J. Rural. Stud. 2018, 59, 211–221. [Google Scholar] [CrossRef]
- Kinzig, A.P.; Ryan, P.; Etienne, M.; Allison, H.; Elmqvist, T.; Walker, B.H. Resilience and Regime Shifts: Assessing Cascading Effects. 2006. Available online: http://www.ecologyandsociety.org/vol11/iss1/art20/ (accessed on 1 December 2019).
- Herrera, H. Resilience for whom? The problem structuring process of the resilience analysis. Sustainability 2017, 9, 1196. [Google Scholar] [CrossRef]
- O’Connell, D.; Walker, B.; Abel, N.; Grigg, N. The Resilience, Adaptation and Transformation Assessment Framework: From theory to Application; CSIRO: Canberra, Australia, 2015. [Google Scholar]
- Resilience Alliance. Assessing Resilience in Social-Ecological Systems: Workbook for Practitioners, Version 2.0. 2010. Available online: https://www.reefresilience.org/pdf/ResilienceAssessment2.pdf (accessed on 20 February 2019).
- ISTAT. Available online: http://agri.istat.it/jsp/dawinci.jsp?q=plC190000010000011000&an=2017&ig=1&ct=270&id=15A%7C21A%7C30A (accessed on 15 October 2018).
- Piacentini, L.; Colantoni, A.; Delfanti, L.M.P.; Monarca, D. The hazelnut sector of the Monti Cimini agro-industrial district: Economic analysis and development perspectives. Reports Econ. Financ. 2015, 1, 1–10. [Google Scholar] [CrossRef]
- FAO FAOSTAT. Available online: http://www.fao.org/faostat/en/#data (accessed on 4 March 2019).
- Briamonte, L.; Castellotti, T.; De Cicco, A.; Torighelli, B.; Velazquez, B.; Moretti, M.; Pasiani, C. Il Comparto Della Frutta in Guscio in Italia; INEA: Roma, Italy, 2001.
- Franco, S.; Pancino, B.; Cristofori, V. Hazelnut production and local development in Italy. Acta Hortic. 2014, 347–352. [Google Scholar] [CrossRef]
- Pancino, B.; Franco, S. Policy impact on the diffusion of organic hazelnut cultivation in the Monti Cimini area. Acta Hortic. 2009, 751–756. [Google Scholar] [CrossRef]
- Franco, S.; Marongiu, S. A district for hazelnut sector: Rural or agro-food system? Analysis of national and regional laws for the governance of Monti Cimini (Italy). Acta Hortic. 2009, 845, 775–782. [Google Scholar] [CrossRef]
- Rugini, E.; Cristofori, V. Hazelnut cultivation in Viterbo province: Technological and agronomic innovations preserving products’ typicality. Corylus e Co. 2010, 1.2011, 9–20. [Google Scholar]
- Cristofori, V.; Ferramondo, S.; Bertazza, G.; Bignami, C. Nut and kernel traits and chemical composition of hazelnut (Corylus avellana L.) cultivars. J. Sci. Food Agric. 2008, 88, 1091–1098. [Google Scholar] [CrossRef]
- Liso, G.; Palmieri, A.; Pirazzoli, C.; Schiano lo Moriello, M. Terra e Vita—Speciale Nocciolo; Edagricole: Milan, Italy, 2017; pp. 6–15. [Google Scholar]
- Liberti, S. Internazionale, n.1312. 2019. Available online: https://www.internazionale.it/reportage/stefano-liberti/2019/06/21/nutella-gusto-amaro-nocciole-ferrero (accessed on 15 September 2019).
- Comune di Montefiascone (VT). Ordinanza del Sindaco n. 13 del 22 Maggio 2019. 2019. Available online: http://www.istruzioneverona.it/?p=38317 (accessed on 1 January 2019).
- Biasi, R.; Botti, F. Hazelnut landscape transformation in the northern Latium: The study case of the Monti Cimini. Corylus e Co. 2010, 1.2011, 39–48. Available online: http://www.comune.montefiascone.vt.it/zf/index.php/atti-amministrativi/ordinanze/dettaglio/atto/GTkRjN1EqST0-F (accessed on 15 September 2019).
- ISTAT Agricultural Census Data Warehouse. Available online: http://dati-censimentoagricoltura.istat.it/Index.aspx (accessed on 1 December 2019).
- Bignami, C. Present situtation and problems of hazelnut growing in Lazio region. In Proceedings of the 2nd Convegno Nazionale sul Nocciolo, Giffoni VP, Italy, 5 October 2002; pp. 122–132. [Google Scholar]
- Regione Lazio. Disciplinare di Produzione Integrata—Norme Tecniche di Coltura. 2019. Available online: http://www.regione.lazio.it/binary/rl_main/tbl_documenti/AGC_DD_G00970_04_02_2019_Allegato2.pdf (accessed on 15 September 2019).
- FADN. Available online: http://ec.europa.eu/agriculture/rica/database/database_en.cfm?dwh=SGM (accessed on 5 March 2019).
- Garnier, M.; Recanatesi, F.; Ripa, M.N.; Leone, A. Agricultural nitrate monitoring in a lake basin in Central Italy: A further step ahead towards an integrated nutrient management aimed at controlling water pollution. Environ. Monit. Assess. 2010, 170, 273–286. [Google Scholar] [CrossRef] [PubMed]
- Holling, C.S.; Gunderson, L.H. Resilience and adaptive cycles. In Panarchy: Understanding Transformations in Human and Natural Systems; Island Press: Washington, DC, USA, 2002; pp. 25–62. [Google Scholar]
- Fath, B.D.; Dean, C.A.; Katzmair, H. Navigating the adaptive cycle: An approach to managing the resilience of social systems. Ecol. Soc. 2015, 20, art24. [Google Scholar] [CrossRef]
- Reidsma, P.; Paas, W.; Spiegel, A.; Meuwissen, M. D5.2.1 Guidelines for the Framework of Participatory Impact Assessment of SUstainable and REsilient EU FARMing Systems (FOPIA-SureFarm). Sustainable and Resilient EU farming Systems (SureFarm) Project Report. Horizon 2020 Grant Agreement No. 727520. 2019. Available online: https://surefarmproject.eu/wordpress/wp-content/uploads/2019/06/D5.2-FoPIA-SURE-Farm-Guidelines.pdf (accessed on 15 September 2019).
- Resilience Alliance. Resilience Alliance—Adaptive Cycle. Available online: https://www.resalliance.org/adaptive-cycle (accessed on 29 March 2019).
- Paas, W.; Accatino, F.; Antonioli, F.; Appel, F.; Bardaji, I.; Coopmans, I.; Courtney, P.; Gavrilescu, C.; Heinrich, F.; Krupin, V.; et al. D5.2 Participatory Impact Assessment of Sustainability and Resilience of EU Farming Systems. Sustainable and Resilient EU Farming Systems (SURE-Farm) Project Report. Horizon 2020 Grant Agreement No. 727520. 2019. Available online: https://surefarmproject.eu/wordpress/wp-content/uploads/2019/06/D5.2-FoPIA-SURE-Farm-Cross-country-report.pdf (accessed on 15 September 2019).
- Severini, S.; Paolini, G.; Nera, E.; Antonioli, F.; Senni, S. FoPIA-Surefarm Case study Report Italy. Sustainable and Resilient EU Farming Systems (SURE-Farm) Project Report. Horizon 2020 Grant Agreement No. 727520. 2019. Available online: https://surefarmproject.eu/wordpress/wp-content/uploads/2019/06/D5.2-FoPIA-SURE-Farm-Case-study-Report-Italy.pdf (accessed on 15 September 2019).
- FAO. SAFA Indicators, Sustainability Assessment of Food and Agriculture Systems, Version 3.0; FAO: Rome, Italy, 2013. [Google Scholar]
- De Olde, E.M.; Moller, H.; Marchand, F.; McDowell, R.M.; MacLeod, C.J.; Sautier, M.; Halloy, S.; Barber, A.; Benge, J.; Bockstaller, C.; et al. When experts disagree: The need to rethink indicator selection for assessing sustainability of agriculture. Environ. Dev. Sustain. 2017, 19, 1327–1342. [Google Scholar] [CrossRef]
- Cabell, J.F.; Oelofse, M. An indicator framework for assessing agroecosystem resilience. Ecol. Soc. 2012, 17. [Google Scholar] [CrossRef]
- EU Regulation No 1305 REGULATION (EU) No 1305/2013 OF THE EUROPEAN PARLIAMENT AND OF THE COUNCIL of 17 december 2013 on support for rural development by the European Agricultural Fund for Rural Development (EAFRD) and repealing Council Regulation (EC) No 1698/2005. 2013. Available online: https://eur-lex.europa.eu/LexUriServ/LexUriServ.do?uri=OJ:L:2013:347:0487:0548:en:PDF (accessed on 10 May 2019).
- Walker, B.; Carpenter, S.; Anderies, J.; Abel, N.; Cumming, G.S.; Janssen, M.; Lebel, L.; Norberg, J.; Peterson, G.D.; Pritchard, R. Resilience management in social-ecological systems: A working hypothesis for a participatory approach. Conserv. Ecol. 2002, 6, 14. [Google Scholar] [CrossRef]
- CCIAA Viterbo 17° Rapporto sull’economia della Tuscia Viterbese. In Proceedings of the 16a Giornata dell’economia; Camera di commercio: Viterbo, Italy, 2017; Available online: http://www.vt.camcom.it/files/rapporto-economia-tuscia-sintesipdf-_3245.pdf/ (accessed on 3 March 2019).
- Recanatesi, F.; Ripa, M.N.; Leone, A.; Luigi, P.; Salvati, L. Land use, climate and transport of nutrients: Evidence emerging from the lake vico case study. Environ. Manag. 2013, 52, 503–513. [Google Scholar] [CrossRef] [PubMed]
- Zhang, Y.; Li, Y.; Jiang, L.; Tian, C.; Li, J.; Xiao, Z. Potential of perennial crop on environmental sustainability of agriculture. Procedia Environ. Sci. 2011, 10, 1141–1147. [Google Scholar] [CrossRef]
- Anderies, J.M.; Folke, C.; Walker, B.; Ostrom, E. Aligning key concepts for global change policy: Robustness, resilience, and sustainability. Ecol. Soc. 2013, 18. [Google Scholar] [CrossRef]
- Darnhofer, I.; Fairweather, J.; Moller, H. Assessing a farm’s sustainability: Insights from resilience thinking. Int. J. Agric. Sustain. 2010, 8, 186–198. [Google Scholar] [CrossRef]
- Di Falco, S.; Chavas, J.P. Rainfall Shocks, Resilience, and the Effects of Crop Biodiversity on Agroecosystem Productivity. Land Econ. 2015, 84, 83–96. [Google Scholar] [CrossRef]
- Hoekstra, A.Y.; Bredenhoff-Bijlsma, R.; Krol, M.S. The control versus resilience rationale for managing systems under uncertainty. Environ. Res. Lett. 2018, 13. [Google Scholar] [CrossRef]
- Walker, B.; Salt, D. Assessing resilience. In Resilience Practice: Building Capacity to Absorb Disturbance and Maintain Function; Island Press: Washington, DC, USA, 2012; pp. 67–100. ISBN 978-1-59-726800-4. [Google Scholar]
- Franco, S.; Pancino, B.; Ferrucci, D. Production and marketing of organic hazelnuts: The case of “Tonda Gentile Romana”. Acta Hortic. 2005, 686, 565–572. [Google Scholar] [CrossRef]
- Dono, G.; Franco, S. Agricultural policies and economic results of hazelnut growing farms of Monti Cimini. In Proceedings of the 2° Convegno Nazionale sul Nocciolo, Giffoni VP, Italy, 5 October 2002; pp. 75–89. [Google Scholar]
- Sundkvist, Å.; Milestad, R.; Jansson, A.M. On the importance of tightening feedback loops for sustainable development of food systems. Food Policy 2005, 30, 224–239. [Google Scholar] [CrossRef]
- Hoerling, M.; Eischeid, J.; Perlwitz, J.; Quan, X.; Zhang, T.; Pegion, P. On the increased frequency of mediterranean drought. J. Clim. 2012, 25, 2146–2161. [Google Scholar] [CrossRef]
- Avanzato, D.; Raparelli, E. Agronomical observations on hazelnut orchard growth with leguminous cover crops. In Proceedings of the 2° Convegno Naz. sul Nocciolo, Giffoni VP, Italy, 5 October 2002; pp. 186–192. [Google Scholar]
- Varvaro, L.; Fabi, A. Integrated pest management of hazelnut diseases in Vico Lake district. Corylus e Co. 2013, 1.2013, 11–17. [Google Scholar]
- Adua, M. Statistical report of the Italian hazelnut cultivation. In Proceedings of the 2° Convegno Nazionale sul Nocciolo, Giffoni VP, Italy, 5 October 2002; pp. 93–103. [Google Scholar]
- Spiegel, A.; Slijper, T.; De Mey, Y.; Poortvliet, M.; Rommel, J.; Hansson, H.; Vigani, M.; Soriano, B.; Wauters, E.; Appel, F.; et al. D2.1. Report on Farmers’ Perceptions of Risk and Resilience Capacities—A Comparison across EU Farmers. Sustainable and Resilient EU Farming Systems (SureFarm) Project Report. Horizon 2020 Grant Agreement No. 727520. 2019. Available online: https://surefarmproject.eu/wordpress/wp-content/uploads/2019/04/SURE-Farm-D.2.1-Report-on-farmers-perception-of-risk-and-resilience-capacities.pdf (accessed on 15 September 2019).


| Functions | Indicators | Stakeholder |
|---|---|---|
| Private Goods | ||
| Deliver healthy and affordable food products (Food production) | Hazelnut production | All stakeholders |
| Hazelnut quality | Farmers/Industry | |
| Deliver other bio-based resources for the processing sector (Bio-based resources) | Shell production for heating | Farmers/Industry |
| Production of pruning waste for energy generation | Farmers/Industry | |
| Ensure economic viability (viable farms help to strengthen the economy and contribute to a balanced development) (Economic viability) | Gross Margin per hectare | Farmers |
| Public support to agriculture (CAP and RDP) | Farmers/Government | |
| Margin from in situ processing activities | Industry | |
| Improve quality of life in farming areas by providing employment and offering decent working conditions (Quality of life) | Number of people in the area employed in the farming system | All stakeholders |
| Percentage of women among the people employed in the system | All stakeholders | |
| Health of agricultural workers | All stakeholders | |
| Public Goods | ||
| Maintain natural resources in good condition (water, soil, air) (Natural resources) | Groundwater availability | All stakeholders |
| Water quality in the area | All stakeholders | |
| Protect biodiversity of habitats, genes, and species (Biodiversity and habitat) | Diversification in land use | Government/Others |
| Number of organic farms | Farmers/Government/Others | |
| Ensure that rural areas are attractive places for residence and tourism (countryside, social structures) (Attractiveness of the area) | Touristic flow | All stakeholders |
| Retention of young people in the area | Farmers/Government/Others | |
| Group | Indicator | Challenge | Strategy |
|---|---|---|---|
| 1 | Gross Saleable Production | Lack of labour availability and high labour costs | Mechanisation |
| Market instability | Cooperatives | ||
| 2 | Gross Margin/ha | High production costs | Mechanisation |
| Production fragmentation | Producers’ Organisations | ||
| 3 | Organic area | International competition | Rural Development Programme funds |
| 4 | Retention of young people | Abandonment of farming | Mechanisation |
| Profitability reduction | Value chain activities |
| Implementation Score | |||
|---|---|---|---|
| Selected Indicator | Strategy | Mean | SD |
| Gross Saleable Production | Mechanisation | 4.75 | 0.50 |
| Cooperatives | 3.75 | 0.71 | |
| Gross Margin/ha | Mechanisation | 4.75 | 0.50 |
| Producers’ Organisations | 4.75 | 0.71 | |
| Organic area | RDP funds | 3.38 | 0.50 |
| Retention of young people | Mechanisation | 4.75 | 0.00 |
| Value chain activities | 3.75 | 0.00 | |
© 2020 by the authors. Licensee MDPI, Basel, Switzerland. This article is an open access article distributed under the terms and conditions of the Creative Commons Attribution (CC BY) license (http://creativecommons.org/licenses/by/4.0/).
Share and Cite
Nera, E.; Paas, W.; Reidsma, P.; Paolini, G.; Antonioli, F.; Severini, S. Assessing the Resilience and Sustainability of a Hazelnut Farming System in Central Italy with a Participatory Approach. Sustainability 2020, 12, 343. https://doi.org/10.3390/su12010343
Nera E, Paas W, Reidsma P, Paolini G, Antonioli F, Severini S. Assessing the Resilience and Sustainability of a Hazelnut Farming System in Central Italy with a Participatory Approach. Sustainability. 2020; 12(1):343. https://doi.org/10.3390/su12010343
Chicago/Turabian StyleNera, Elena, Wim Paas, Pytrik Reidsma, Giulio Paolini, Federico Antonioli, and Simone Severini. 2020. "Assessing the Resilience and Sustainability of a Hazelnut Farming System in Central Italy with a Participatory Approach" Sustainability 12, no. 1: 343. https://doi.org/10.3390/su12010343
APA StyleNera, E., Paas, W., Reidsma, P., Paolini, G., Antonioli, F., & Severini, S. (2020). Assessing the Resilience and Sustainability of a Hazelnut Farming System in Central Italy with a Participatory Approach. Sustainability, 12(1), 343. https://doi.org/10.3390/su12010343