Study on Dynamic Structure-Soil-Structure Interaction of Three Adjacent Tall Buildings Subjected to Seismic Loading


Abstract
1. Introduction
2. Problem Definition
- F-F-F, the three structures are all frame structures;
- FW-FW-FW, the three structures are all frame-shear wall structures;
- F-FW-F, the middle structure B is a frame-shear wall structure, and Structures A and C are both frame structures;
- FW-F-FW, the middle structure B is a frame structure, and Structures A and C are both frame-shear wall structures.
3. Model Introduction
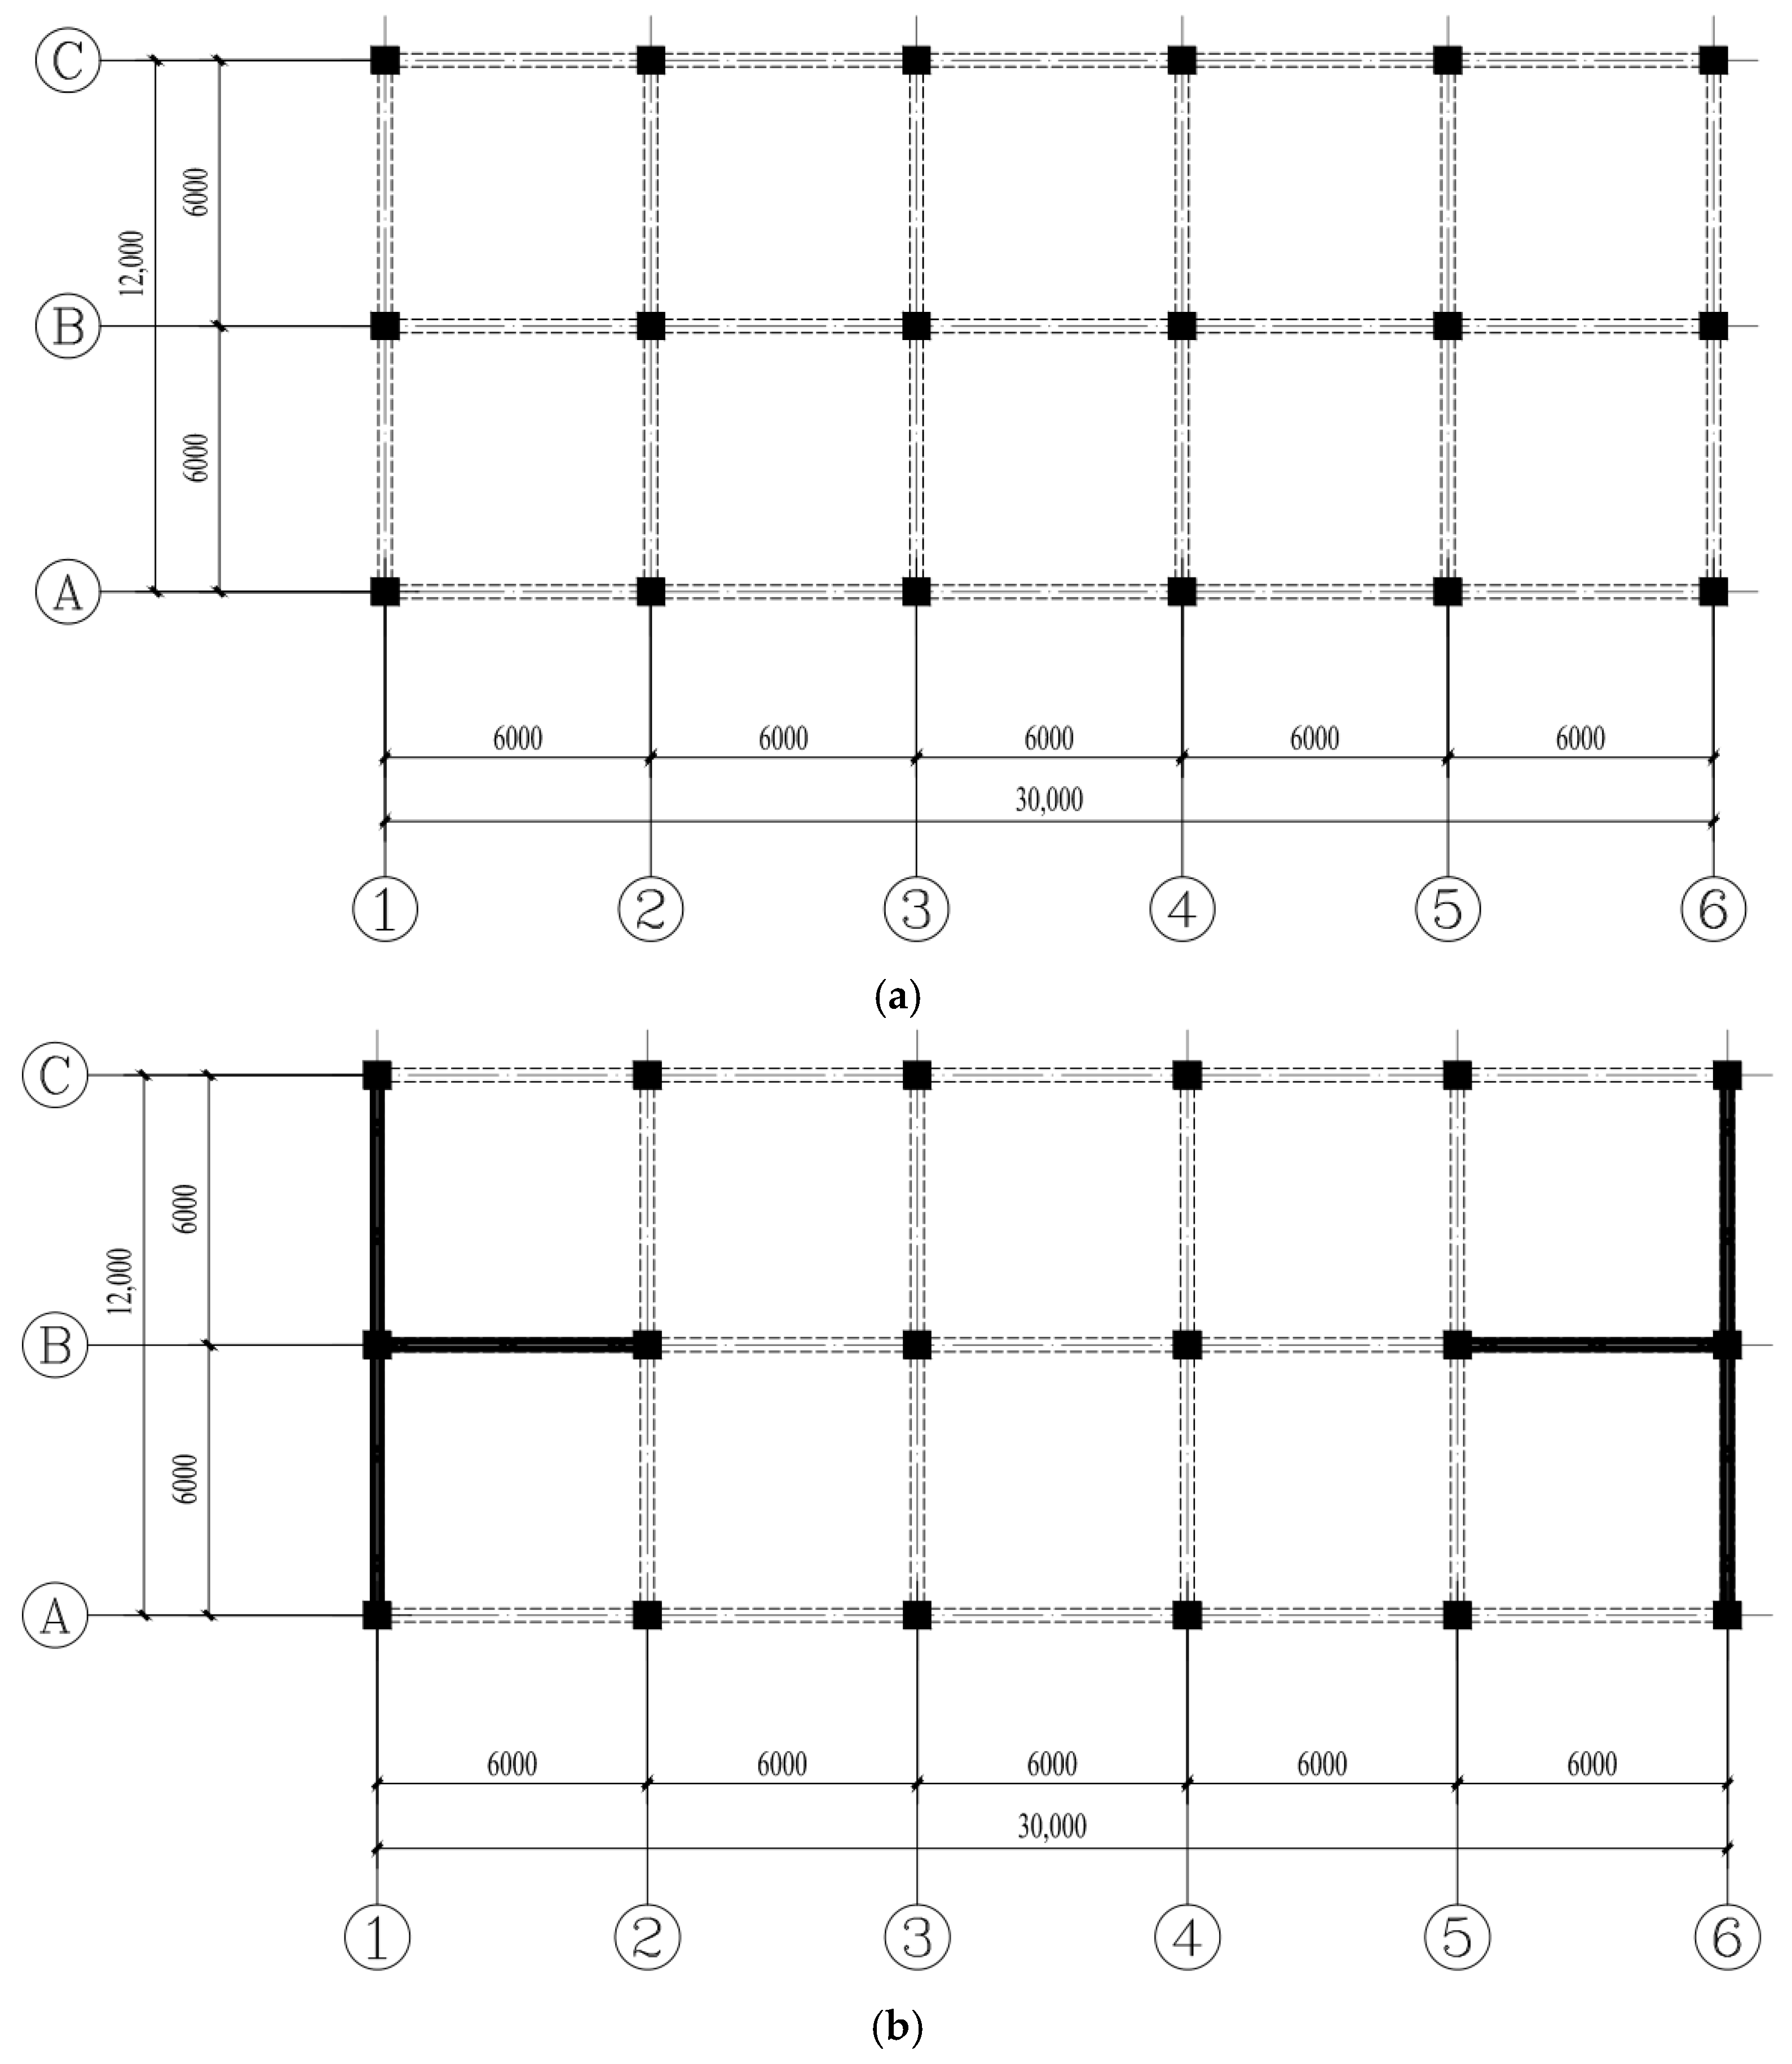
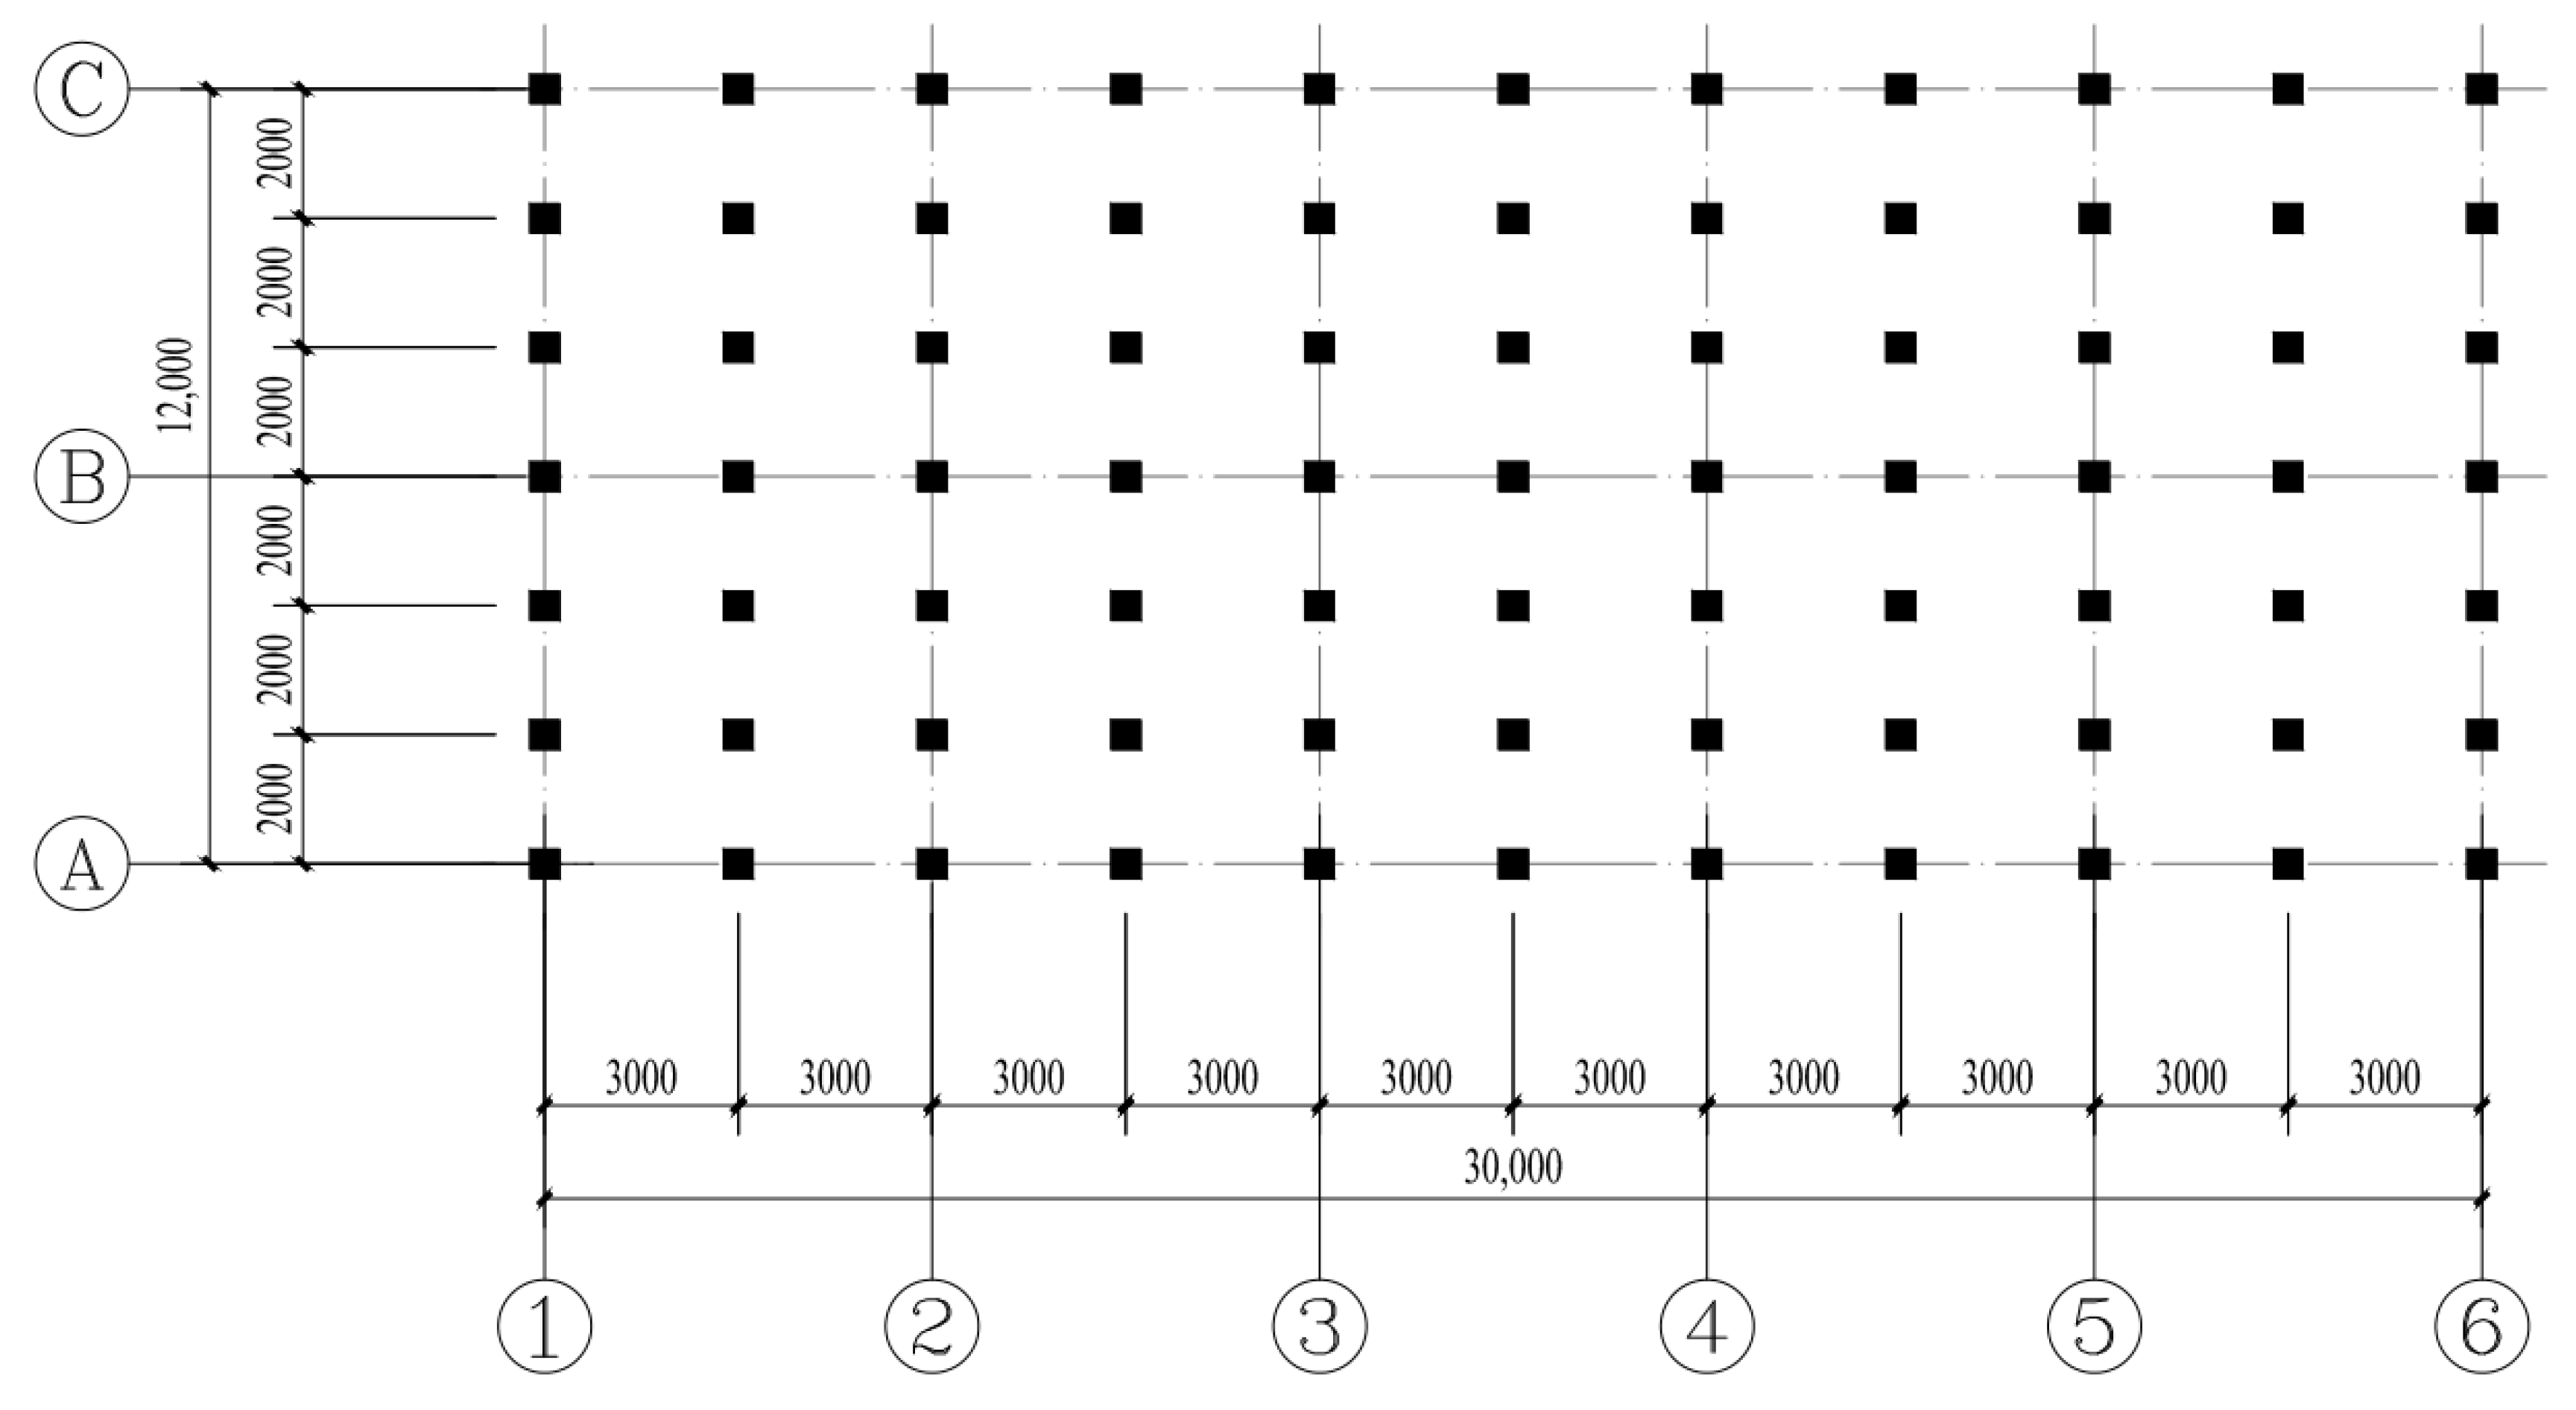
3.1. Superstructure
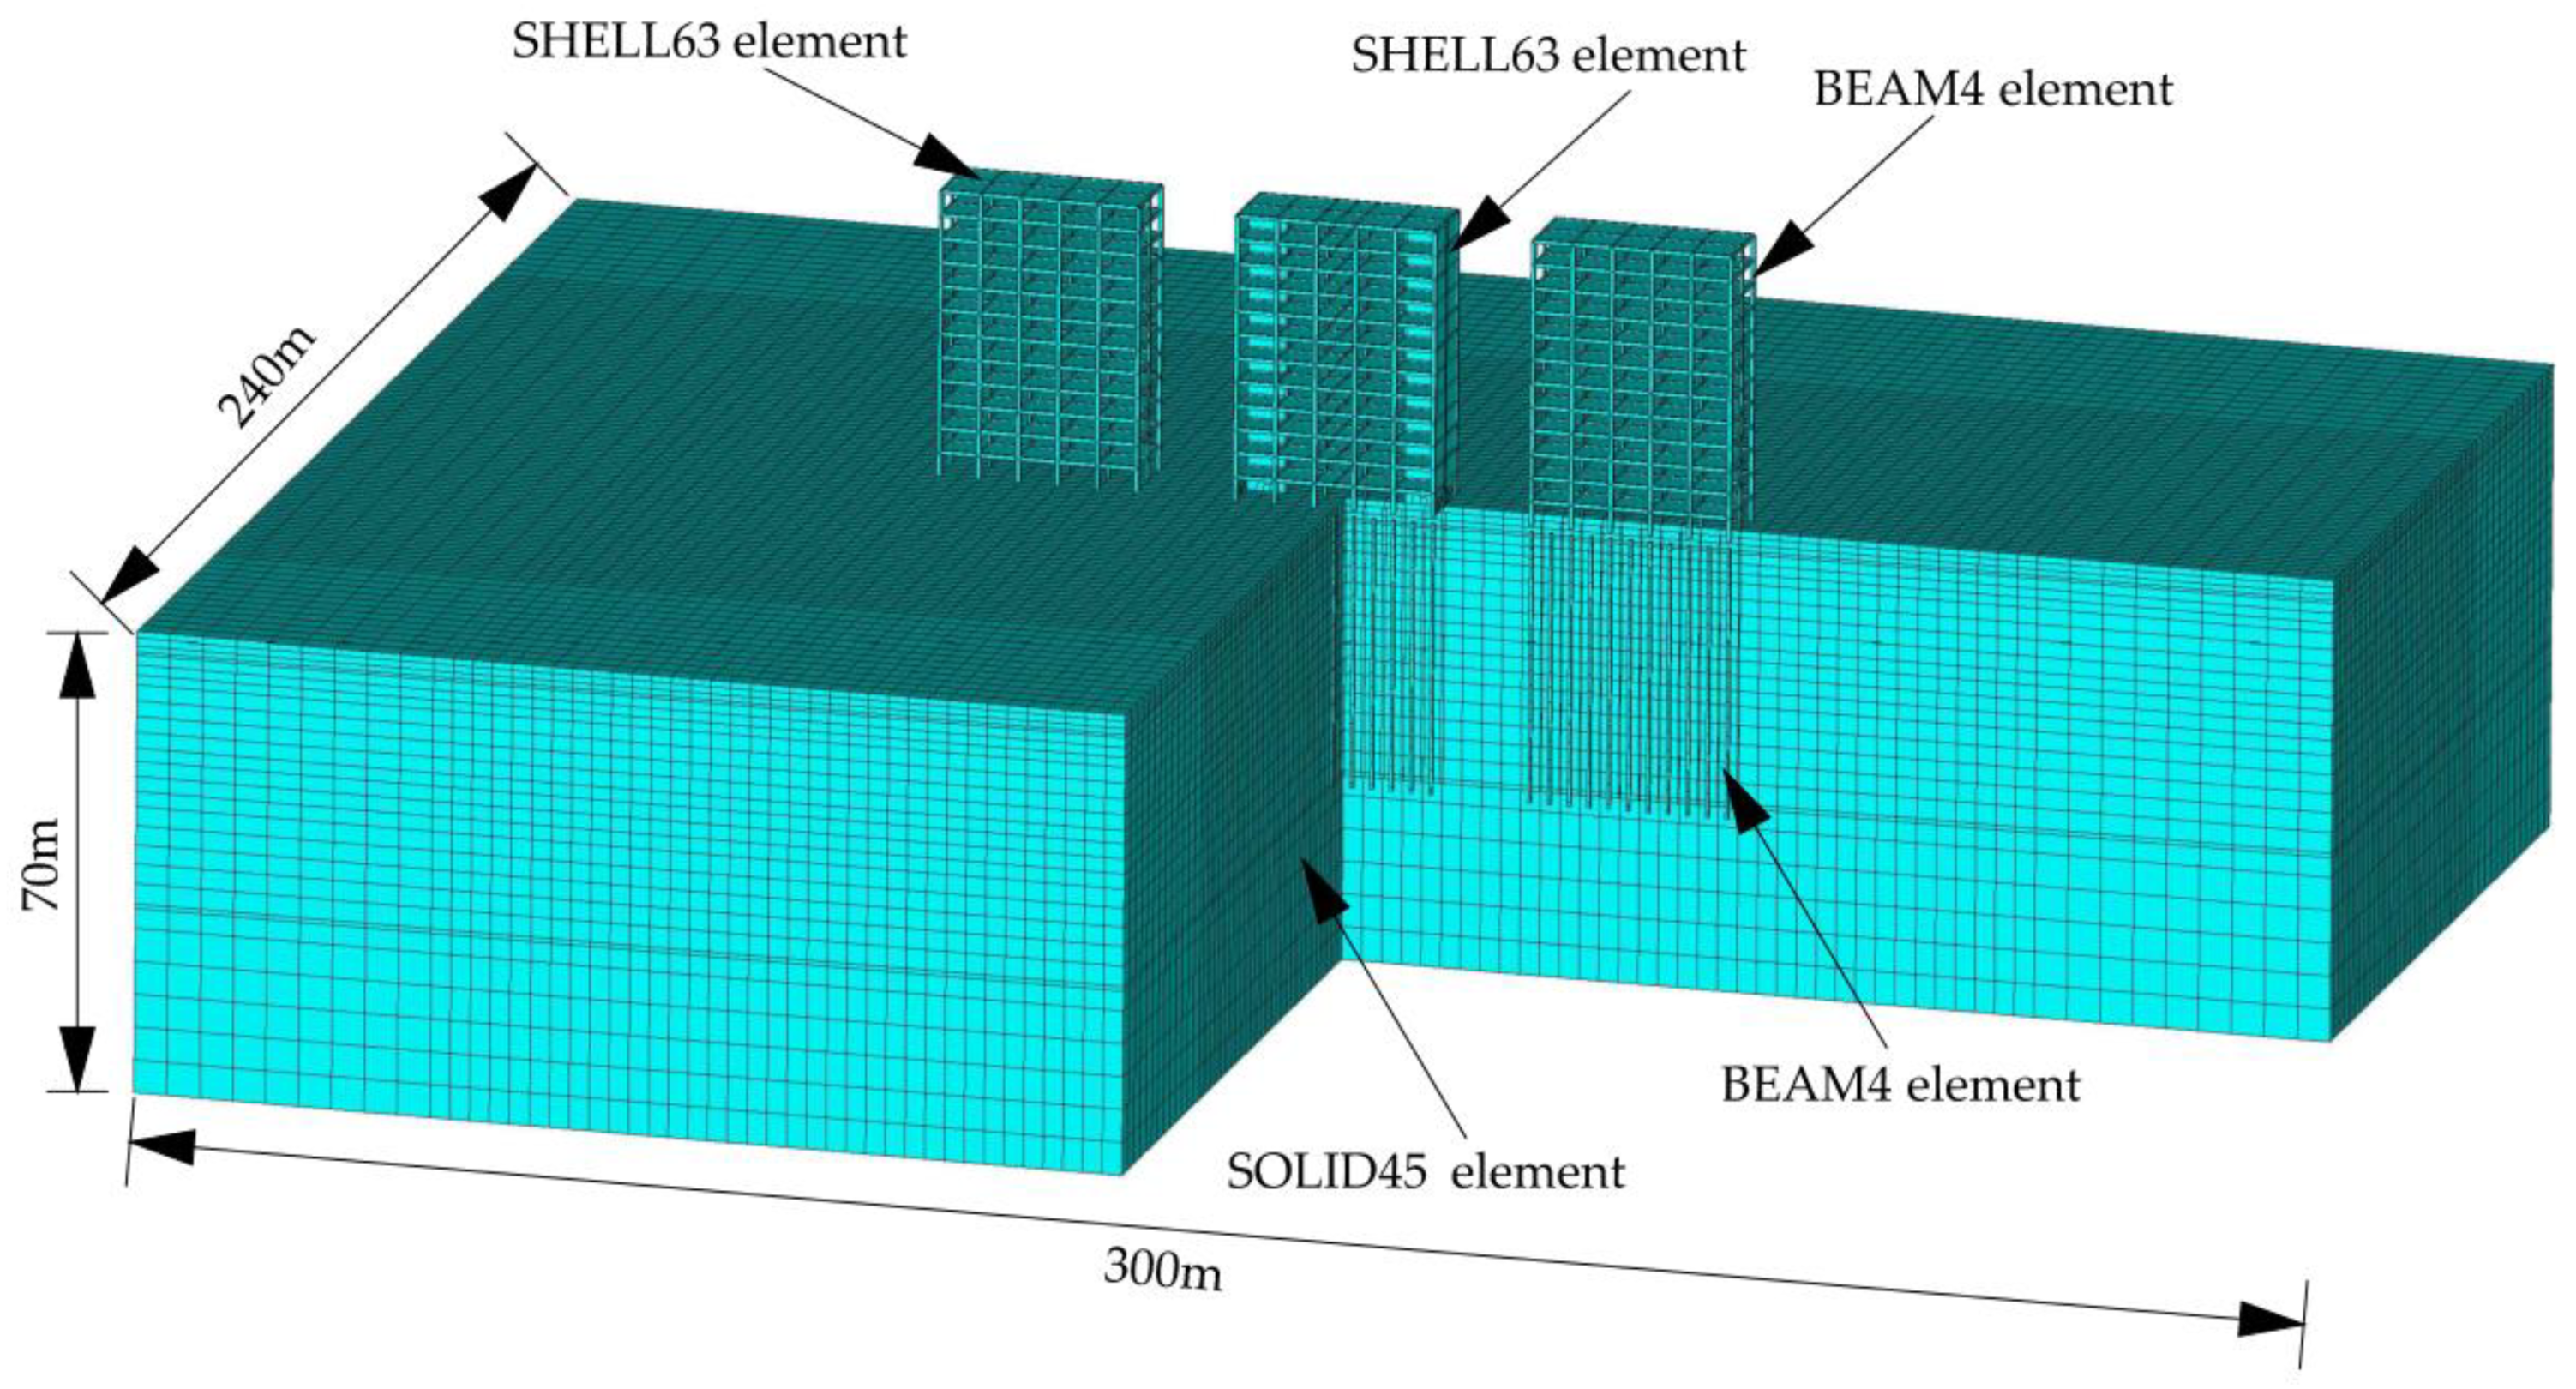
3.2. Foundation
3.3. Soil
3.4. Earthquake Excitation
4. Simulation Methods
4.1. Dynamic Constitutive Model of Soil and Damping System
4.2. Viscous-Spring Artificial Boundary
5. Simulation Results and Discussions
5.1. Influence of the Clear Distance between Adjacent Structures
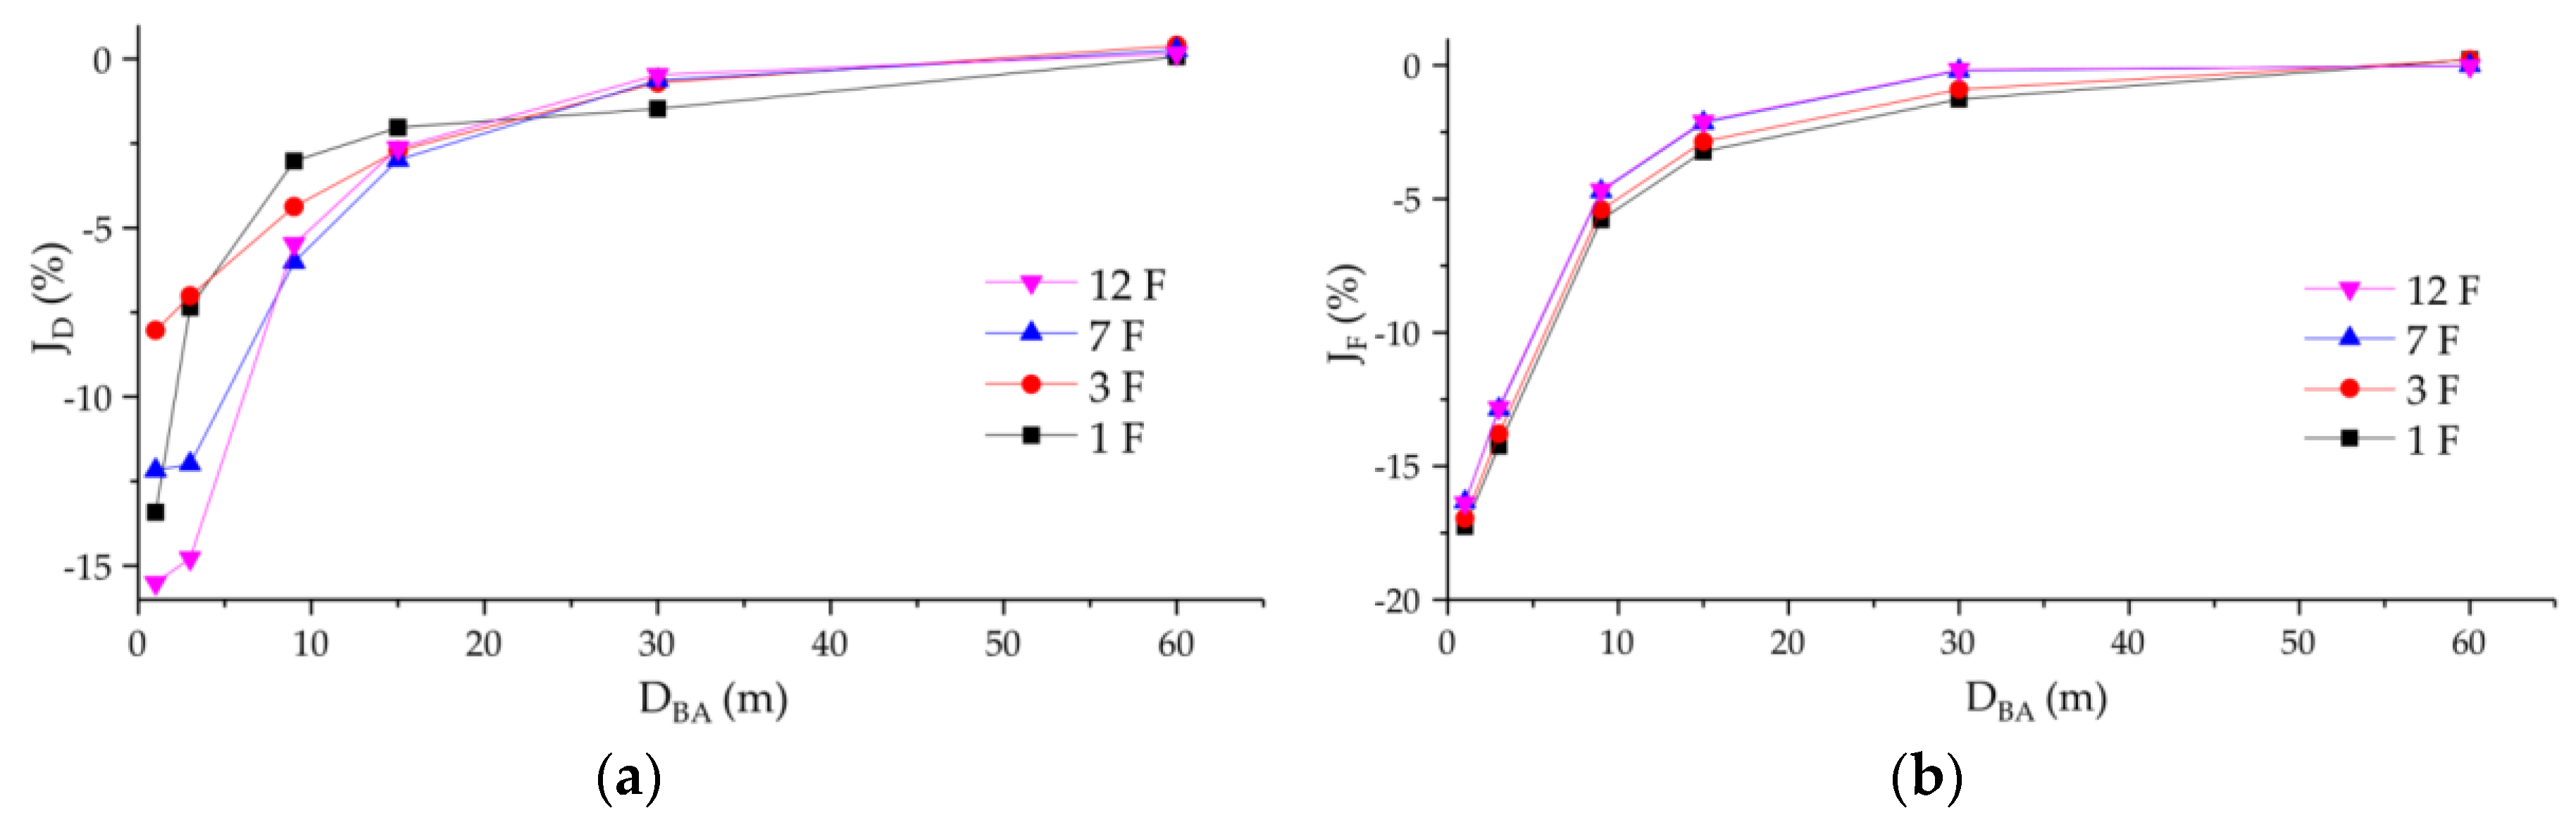
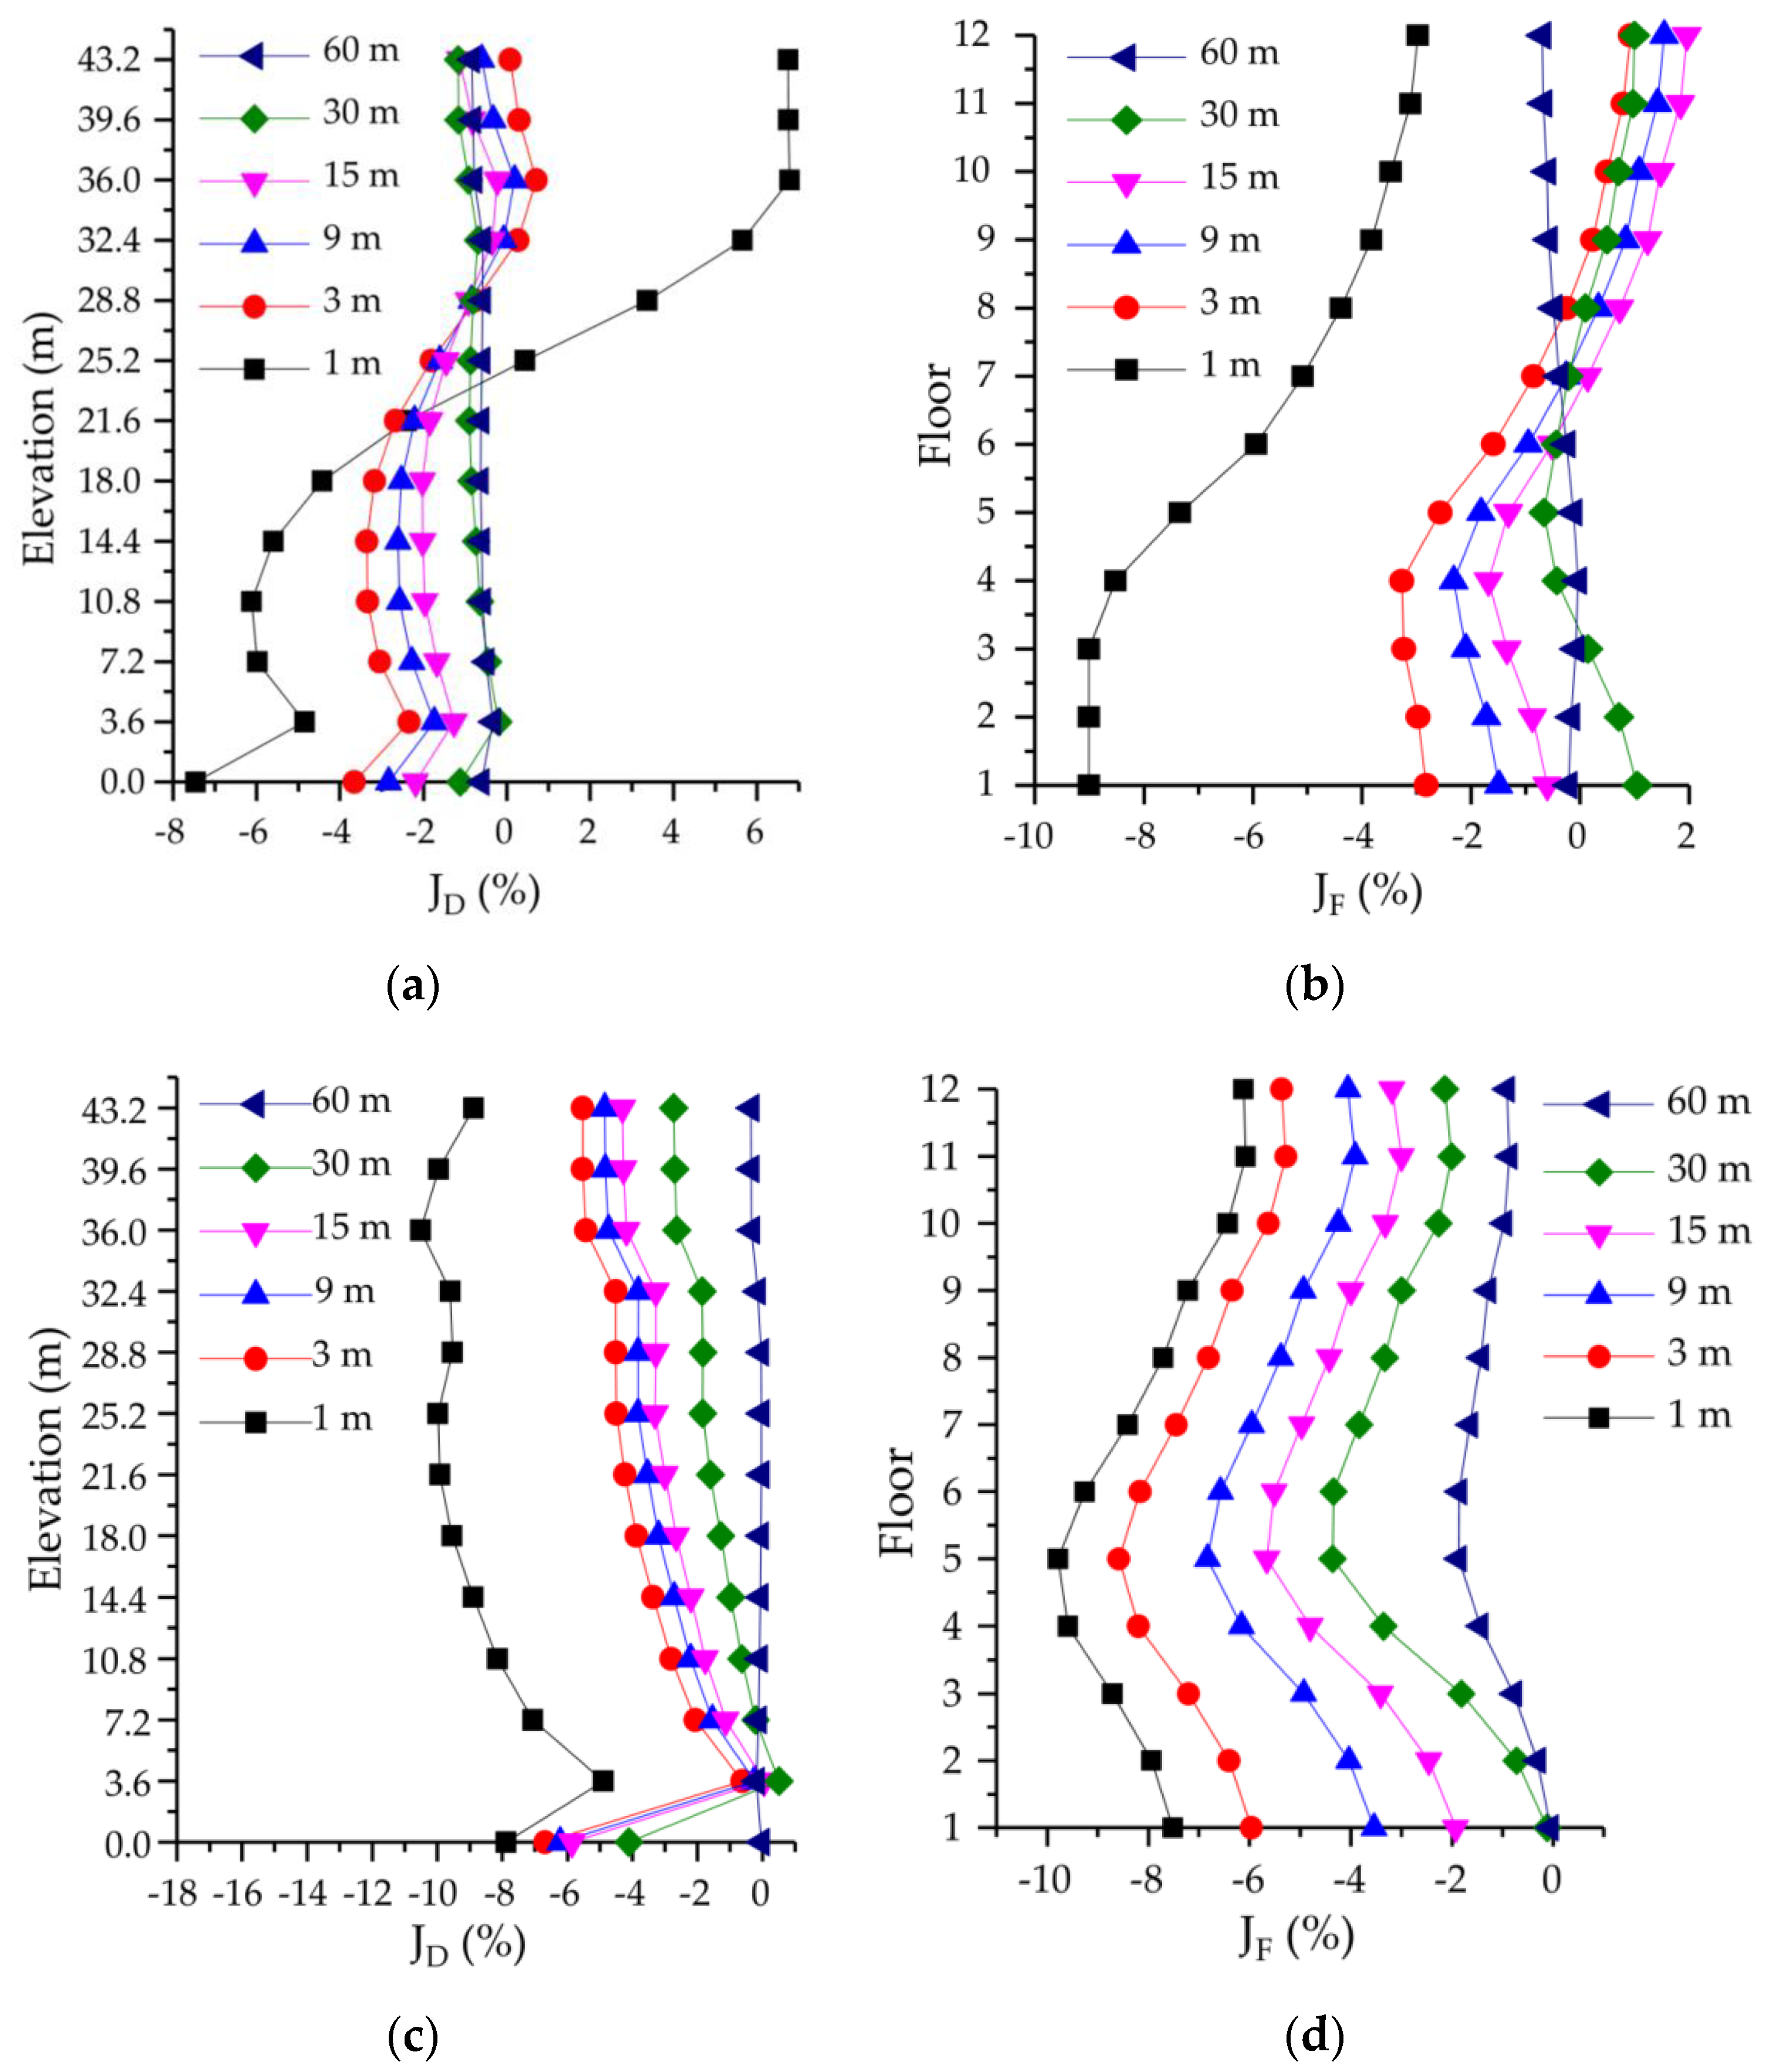
- In the four cases studied in this paper, when the clear distance between adjacent structures was small to a certain extent, the effects of SSSI were significant. However, the effects of SSSI diminished rapidly as the clear distance between adjacent structures increased. When the clear distance between adjacent structures was more than 15 m (0.5B, B refers to the width of the structure in the X-axis direction), JD and JF were both within 5%. When the clear distance between the structures was more than 30 m (1.0B), JD and JF were close to zero, and the effects of SSSI could be ignored. When the clear distance between structures was less than 9 m (0.3B), the effects of SSSI were significant.
- In the case of F-F-F, when the clear distance between structures was 1 m (B/30), the peak floor displacement of the middle frame-shear wall structure was affected by up to 7.5% compared to that of the single SSI system. The peak inter-story shear force of the middle structure was affected by up to 9.7% compared to that of the single SSI system.
- In the case of FW-FW-FW, when the clear distance between structures was 1 m (B/30), the peak floor displacement of the middle frame-shear wall structure increased by up to 15.7% compared to that of the single SSI system. The peak inter-story shear force of the middle structure increased by up to 9.8% compared to that of the single SSI system.
- In these four cases, the most significant effects of SSSI on the seismic response of the middle structure was the case of FW-F-FW. In the case of FW-F-FW, the peak floor displacement of the middle frame structure was affected by up to 25.9% compared to that of the single SSI system, and the peak inter-story shear force of the middle structure was affected by up to 19.5% compared to that of the single SSI system.
5.2. Influence of Structure Types
- In the case of F-F-F, for the middle structure, the effects of SSSI were a bit complicated. When the clear distance was not less than 3 m (B/10), the seismic responses above the seventh floor increased and the seismic responses below the seventh floor decreased basically. When the clear distance was 1 m (B/30), the effects of SSSI were more apparent. Moreover, the peak floor displacements above the seventh floor increased, while the peak floor displacements below the seventh floor decreased. However, the peak inter-story shear forces of all the floors decreased. The lower the floor, the more the reduction. The seismic responses of the structure on each side decreased due to the effects of SSSI, and the smaller the clear distance, the more the decrease.
- In the case of FW-FW-FW, the seismic responses of the middle structure increased basically due to the effects of SSSI. The smaller the clear distance, the more the increase. However, for the structure on each side, the effects of SSSI were a bit complicated. The peak floor displacements of the bottom two floors increased basically, and the peak floor displacements of other floors decreased due to SSSI. However, the peak inter-story shear force was increased above the seventh floor and reduced below the seventh floor due to the effects of SSSI.
5.3. Influence of the Structure Heights and the First Natural Periods of the Structures
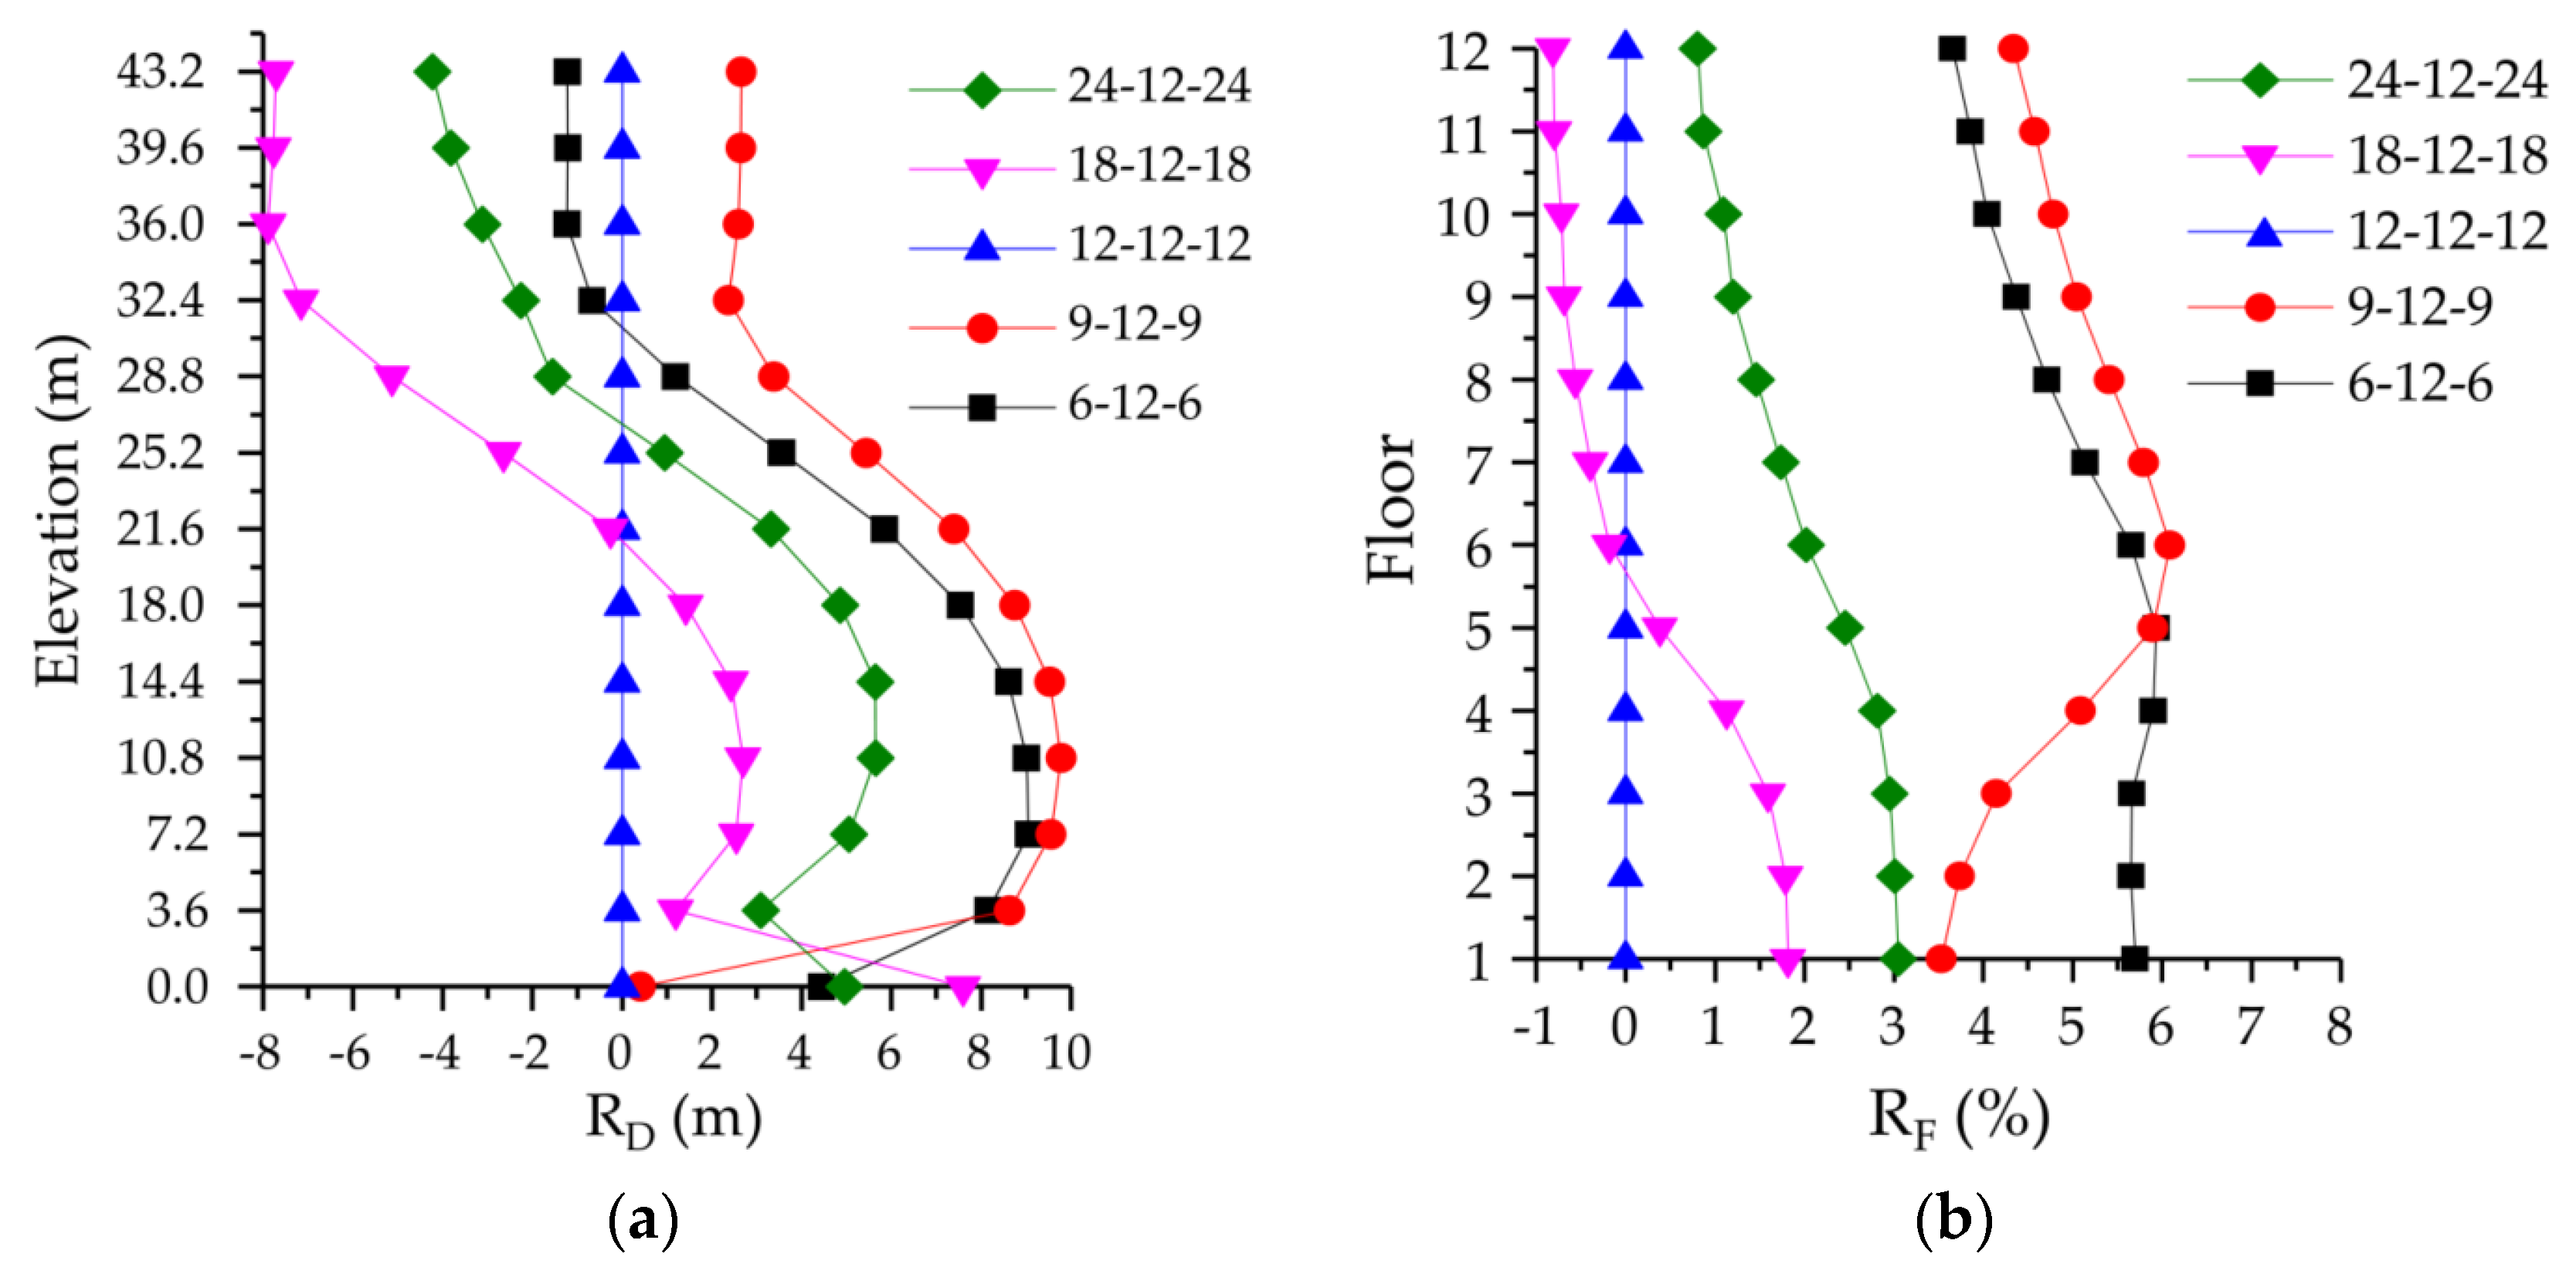
- For the middle structure, RD and RF changed significantly as the number of floors of structures on both sides changed. Except for the model 9-12-9, the peak floor displacements of the lower stories of the middle structure of the structure groups with different heights increased, compared to that of the model 12-12-12. However, the peak floor displacements of the higher stories decreased, compared to that of the model 12-12-12. The peak floor displacement of the middle structure of the higher stories was increased by up to 9.8%, while the peak floor displacement of the middle structure of the higher stories was reduced by up to 7.9%.
- Except for the model 18-12-18, the peak inter-story shear forces of the middle structure of models with different heights all increased compared to that of the model 12-12-12, and the maximum increase was 6.1%.
- The largest RD was for the model 9-12-9, and the largest RF was for the models 9-12-9 and 6-12-6. However, the RD and RF of the model 24-12-24 were relatively small. According to the numerical calculation, the predominant period of the soil was 2.05 s, and it was close to the first natural period of the 9-story frame structure, which was 2.01 s. Therefore, the seismic responses of the 9-story frame structure in the model 9-12-9 were more significant. Therefore, the dynamic through-soil interaction with the middle 12-story structure was also greater. This suggested that the first natural vibration period of the structures had a more significant impact on SSSI than the height and the mass of the structure on each side in the case of this study.
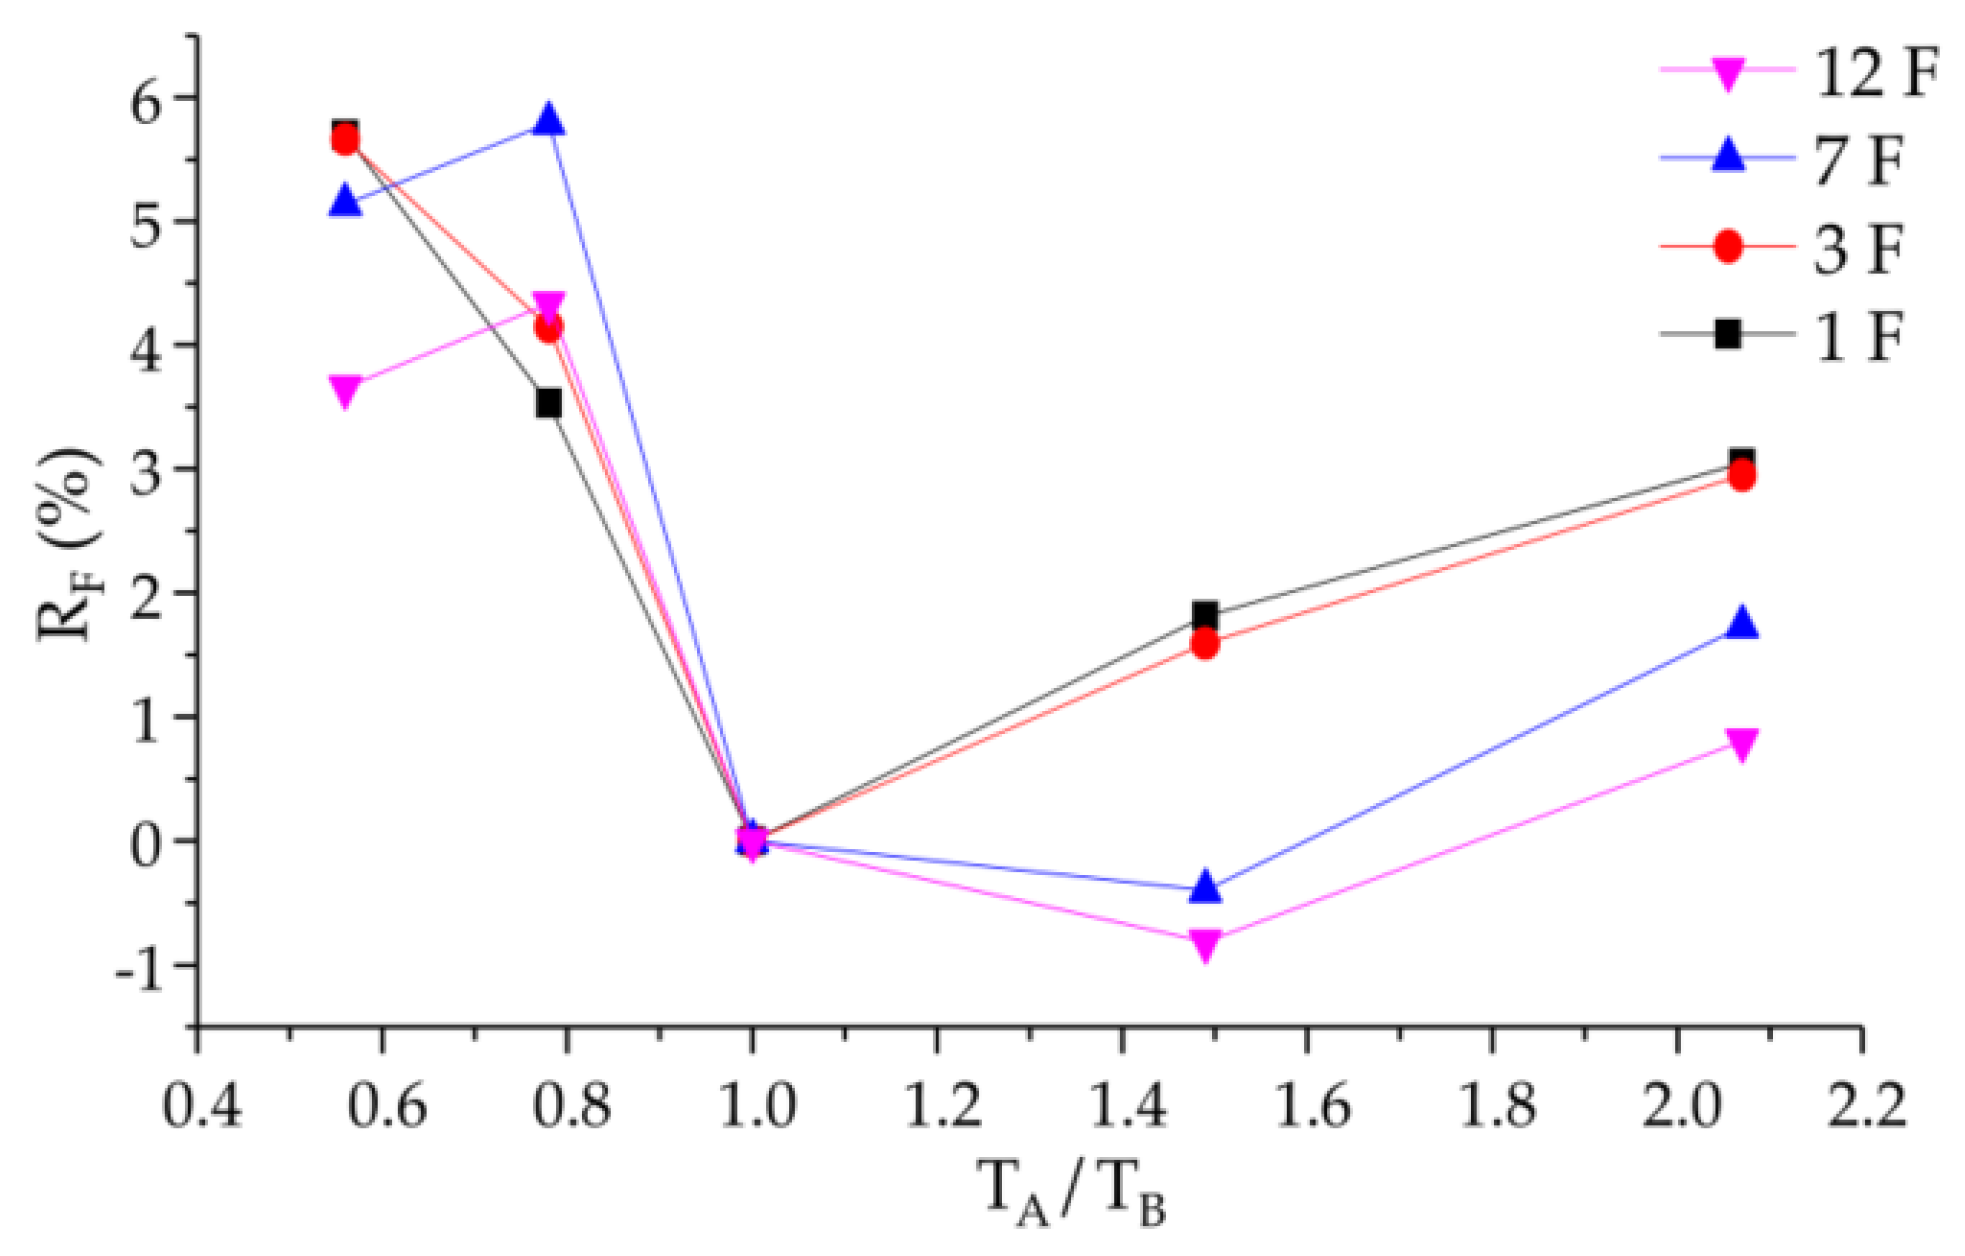
- From Figure 14b and Figure 15, a meaningful result could be found. The closer the first natural vibration periods of the three frame structures were, the less the effects of SSSI on the peak inter-story shear force of the middle structure were. It could provide a reference for the seismic conceptual design of frame structures with close spacing.
6. Conclusions
- The clear distance between structures was a prominent parameter affecting the interaction of adjacent structures. The effects of SSSI diminished rapidly as the clear distance between adjacent structures increased. When the clear distance between adjacent structures was more than 30 m (1.0B), JD and JF were close to zero, and the effects of SSSI could be ignored in practical engineering. When the clear distance between structures was less than 9 m (0.3B), the effects of SSSI were significant. When structures were relatively close, if the effects of SSSI were ignored, the seismic design may be unsafe. Based on this research, this paper suggested that when the clear distance between structures was less than 0.3B, the effects of SSSI should be paid attention to in seismic design.
- In the cases of F-FW-F and FW-F-FW, no matter whether the frame-shear wall structure was in the middle or on each side, its seismic responses decreased due to the effects of SSSI. The research findings showed that the effects of SSSI were significantly different in different kinds of structural arrangements. Furthermore, the results suggested that structural seismic response could be increased or reduced as a result of SSSI, depending mainly on the structural characteristics, rather than the location of the structures. It provided us with an idea about the seismic conceptual design in that a careful arrangement of the structure types of adjacent buildings could be used to control the effects of SSSI.
- For the middle structure, the effects of SSSI significantly changed as the number of floors of structures on both sides changed. However, it was not that the higher the structures on both sides, the more apparent the effects of SSSI were. In fact, in the cases of this study, the first natural vibration periods of the structures on both sides had a more significant impact on SSSI than the height and the mass of the structures on both sides. This suggested that avoiding the predominant period of the soil was also an effective measure to control the effects of SSSI.
Author Contributions
Funding
Conflicts of Interest
Appendix A. Dynamic Constitutive Model of Soil

| Soil Type | A | B | Dmax | (10−3) |
|---|---|---|---|---|
| cohesive soil | 1.62 | 0.42 | 0.30 | 0.6 |
| silty soil | 1.12 | 0.44 | 0.25 | 0.8 |
| sandy soil | 1.10 | 0.48 | 0.25 | 1.0 |
| medium coarse sand | 1.10 | 0.48 | 0.25 | 1.2 |
Appendix B. Damping System
References
- Li, P.Z.; Liu, S.T.; Lu, Z. Studies on Pounding Response Considering StructureSoil-Structure Interaction under Seismic Loads. Sustainability 2017, 9, 2219. [Google Scholar] [CrossRef]
- Yang, Y.Q.; Li, S. Development of a Refined Analysis Method for Earthquake-Induced Pounding between Adjacent RC Frame Structures. Sustainability 2019, 11, 4928. [Google Scholar] [CrossRef]
- Lou, M.L.; Wang, H.F.; Chen, X.; Zhai, Y.M. Structure-soil-structure interaction: Literature review. Soil Dyn. Earthq. Eng. 2011, 31, 1724–1731. [Google Scholar] [CrossRef]
- Kirkwood, P.; Dashti, S. Influence of prefabricated vertical drains on the seismic performance of similar neighbouring structures founded on liquefiable deposits. Geotechnique 2019, 69, 971–985. [Google Scholar] [CrossRef]
- Koren, D.; Rus, K. The Potential of Open Space for Enhancing Urban Seismic Resilience: A literature Review. Sustainability 2019, 11, 5942. [Google Scholar] [CrossRef]
- Warburton, G.B.; Richardson, J.D.; Webster, J.J. Forced Vibrations of Two Masses on an Elastic Half Space. J. Appl. Mech. 1971, 38, 148–156. [Google Scholar] [CrossRef]
- Lee, T.H.; Wesley, D.A. Soil-structure interaction of nuclear reactor structures considering through-soil coupling between adjacent structures. Nucl. Eng. Des. 1973, 24, 374–387. [Google Scholar] [CrossRef]
- Wong, H.L.; Trifunac, M.D. Two-dimensional, antiplane, building-soil-building interaction for two or more buildings and for incident planet SH waves. Bull. Seismol. Soc. Am. 1975, 65, 1863–1885. [Google Scholar]
- Ngo, V.L.; Kim, J.M.; Chang, S.H.; Lee, C. Effect of Height Ratio and Mass Ratio on Structure-Soil-Structure Interaction of Two Structures Using Centrifugal Experiment. Appl. Sci. Basel 2019, 9, 526. [Google Scholar] [CrossRef]
- Kirkwood, P.; Dashti, S. A Centrifuge Study of Seismic Structure-Soil-Structure Interaction on Liquefiable Ground and Implications for Design in Dense Urban Areas. Earthq. Spectra 2018, 34, 1113–1134. [Google Scholar] [CrossRef]
- Jabary, R.N.; Madabhushi, S.P.G. Structure-soil-structure interaction effects on structures retrofitted with tuned mass dampers. Soil Dyn. Earthq. Eng. 2017, 100, 301–315. [Google Scholar] [CrossRef]
- Trombetta, N.W.; Mason, H.B.; Hutchinson, T.C.; Zupan, J.D.; Bray, J.D.; Kutter, B.L. Nonlinear Soil-Foundation-Structure and Structure-Soil-Structure Interaction: Engineering Demands. J. Struct. Eng. 2015, 141, 04014177. [Google Scholar] [CrossRef]
- Trombetta, N.W.; Mason, H.B.; Hutchinson, T.C.; Zupan, J.D.; Bray, J.D.; Kutter, B.L. Nonlinear Soil-Foundation-Structure and Structure-Soil-Structure Interaction: Centrifuge Test Observations. J. Geotech. Geoenviron. Eng. 2014, 140, 04013057. [Google Scholar] [CrossRef]
- Padron, L.A.; Aznarez, J.J.; Maeso, O. Dynamic structure-soil-structure interaction between nearby piled buildings under seismic excitation by BEM-FEM model. Soil Dyn. Earthq. Eng. 2009, 29, 1084–1096. [Google Scholar] [CrossRef]
- Vicencio, F.; Alexander, N.A. Higher mode seismic structure-soil-structure interaction between adjacent building during earthquakes. Eng. Struct. 2018, 174, 322–337. [Google Scholar] [CrossRef]
- Liang, J.W.; Han, B.; Todorovska, M.I.; Trifunac, M.D. 2D dynamic structure-soil-structure interaction for twin buildings in layered half-space II: Incident SV-waves. Soil Dyn. Earthq. Eng. 2018, 113, 356–390. [Google Scholar] [CrossRef]
- Ada, M.; Ayvaz, Y. The Structure-Soil-Structure Interaction Effects on the Response of the Neighbouring Frame Structures. Lat. Am. J. Solids Struct. 2019, 16. [Google Scholar] [CrossRef]
- Vicencio, F.; Alexander, N.A. Dynamic Structure-Soil-Structure Interaction in unsymmetrical plan buildings due to seismic excitation. Soil Dyn. Earthq. Eng. 2019, 127, 105817. [Google Scholar] [CrossRef]
- Aldaikh, H.; Alexander, N.A.; Ibraim, E.; Oddbjornsson, O. Two dimensional numerical and experimental models for the study of structure-soil-structure interaction involving three buildings. Comput. Struct. 2015, 150, 79–91. [Google Scholar] [CrossRef]
- Li, P.Z.; Liu, S.T.; Lu, Z.; Yang, J.P. Numerical analysis of a shaking table test on dynamic structure-soil-structure interaction under earthquake excitations. Struct. Des. Tall Spec. Build. 2017, 26, e1382. [Google Scholar] [CrossRef]
- Ghandil, M.; Aldaikh, H. Damage-based seismic planar pounding analysis of adjacent symmetric buildings considering inelastic structure-soil-structure interaction. Earthq. Eng. Struct. Dyn. 2017, 46, 1141–1159. [Google Scholar] [CrossRef]
- Bybordiani, M.; Arici, Y. Structure-soil-structure interaction of adjacent buildings subjected to seismic loading. Earthq. Eng. Struct. Dyn. 2019, 48, 731–748. [Google Scholar] [CrossRef]
- Isbiliroglu, Y.; Taborda, R.; Bielak, J. Coupled Soil-Structure Interaction Effects of Building Clusters During Earthquakes. Earthq. Spectra 2015, 31, 463–500. [Google Scholar] [CrossRef]
- Gueguen, P.; Colombi, A. Experimental and Numerical Evidence of the Clustering Effect of Structures on Their Response during an Earthquake: A Case Study of Three Identical Towers in the City of Grenoble, France. Bull. Seismol. Soc. Am. 2016, 106, 2855–2864. [Google Scholar] [CrossRef]
- Lu, X.Z.; Tian, Y.; Wang, G.; Huang, D.R. A numerical coupling scheme for nonlinear time history analysis of buildings on a regional scale considering site-city interaction effects. Earthq. Eng. Struct. Dyn. 2018, 47, 2708–2725. [Google Scholar] [CrossRef]
- Liu, X.S. Seismic Analysis of Shield Tunnel in Viscoelastic Medium Considering Contact Problem. Ph.D. Thesis, Tongji University, Shanghai, China, 2000. (In Chinese). [Google Scholar]
- Deeks, A.J.; Randolph, M.F. Axisymmetric Time-Domain Transmitting Boundaries. J. Eng. Mech. ASCE 1994, 120, 25–42. [Google Scholar] [CrossRef]
- Memarzadeh, P.; Saadatpour, M.M.; Azhari, M. Nonlinear dynamic response and ductility requirements of a typical steel plate shear wall subjected to El Centro earthquake. Iran. J. Sci. Technol. Trans. B Eng. 2010, 34, 371–384. [Google Scholar]
- Li, P.Z. Shaking Table Test and Simulation Analysis of Structure-Foundation Dynamic Interaction System. Ph.D. Thesis, Tongji University, Shanghai, China, 2002. (In Chinese). [Google Scholar]
- Dutta, S.C.; Roy, R. A critical review on idealization and modeling for interaction among soil-foundation-structure system. Comput. Struct. 2002, 80, 1579–1594. [Google Scholar] [CrossRef]
- Kocak, S.; Mengi, Y. A simple soil-structure interaction model. Appl. Math. Model. 2000, 24, 607–635. [Google Scholar] [CrossRef]
- Spyrakos, C.C.; Maniatakis, C.A.; Koutromanos, I.A. Soil-structure interaction effects on base-isolated buildings founded on soil stratum. Eng. Struct. 2009, 31, 729–737. [Google Scholar] [CrossRef]
- Martin, P.P.; Seed, H.B. One-dimensional dynamic ground response analyses. J. Geotech. Eng. Div. ASCE 1982, 108, 935–952. [Google Scholar] [CrossRef]
- Hadjian, A.H.; Tseng, W.S.; Chang, C.Y.; Anderson, D.; Tsai, N.C.; Tang, Y.K.; Tang, H.T.; Stepp, J.C. The learning from the large scale from Lotung soil-structure interaction experiments (I). World Earthq. Eng. 1993, 3, 41–52. (In Chinese) [Google Scholar]
- Huang, Y.; Chen, Z.C.; Zhou, H.B. Dynamic calculation model of Shanghai soft soil. J. Tongji Univ. 2000, 28, 359–363. (In Chinese) [Google Scholar]
- Knappett, J.A.; Madden, P.; Caucis, K. Seismic structure-soil-structure interaction between pairs of adjacent building structures. Geotechnique 2015, 65, 429–441. [Google Scholar] [CrossRef]
- Lu, X.L.; Li, P.Z.; Chen, B.; Chen, Y.Q. Numerical analysis of dynamic soil-box foundation-structure interaction system. J. Asian Arch. Build. Eng. 2002, 1, 9–16. [Google Scholar] [CrossRef]


| Structure Type | Shear Wall Thickness (mm) | Cross-Section of Beams (mm * mm) | Slab Thickness (mm) | Dead Load (kN/m2) | Live Load (kN/m2) |
|---|---|---|---|---|---|
| Frame | - | 300 × 600 | 120 | 4.2 | 2 |
| Frame-shear wall | 240 | 300 × 600 | 120 | 4.2 | 2 |
| Order of Soil Layer | Name of Soil Layer | Bottom Depth (m) | Density ρ (t/m3) | Dynamic Elastic Modulus Ed (MPa) | Poisson Ratio γ | Shear Wave Velocity vs (m/s) |
|---|---|---|---|---|---|---|
| 1 | plain fill | 3.5 | 1.8 | 12 | 0.45 | 74 |
| 3 | mucky silty clay | 8 | 1.74 | 12 | 0.45 | 85 |
| 4 | mucky clay | 17.6 | 1.7 | 14 | 0.45 | 110 |
| 5.1 | clay | 26.5 | 1.77 | 27 | 0.45 | 200 |
| 5.2 | silty clay | 35.2 | 1.81 | 31 | 0.45 | 300 |
| 5.3 | clay | 41.3 | 1.99 | 37 | 0.45 | 310 |
| 7 | silty sand | >41.3 | 1.96 | 91 | 0.4 | 380 |
| Structure B | Structure A or Structure C | |||||
|---|---|---|---|---|---|---|
| Number of floors | 12 | 6 | 9 | 12 | 18 | 24 |
| The first natural period | 2.60 s | 1.44 s | 2.01 s | 2.60 s | 3.87 s | 5.36 s |
| Ratio of first natural periods (TA/TB or TC/TB) | - | 0.56 | 0.78 | 1.00 | 1.49 | 2.07 |
© 2019 by the authors. Licensee MDPI, Basel, Switzerland. This article is an open access article distributed under the terms and conditions of the Creative Commons Attribution (CC BY) license (http://creativecommons.org/licenses/by/4.0/).
Share and Cite
Gan, J.; Li, P.; Liu, Q. Study on Dynamic Structure-Soil-Structure Interaction of Three Adjacent Tall Buildings Subjected to Seismic Loading. Sustainability 2020, 12, 336. https://doi.org/10.3390/su12010336
Gan J, Li P, Liu Q. Study on Dynamic Structure-Soil-Structure Interaction of Three Adjacent Tall Buildings Subjected to Seismic Loading. Sustainability. 2020; 12(1):336. https://doi.org/10.3390/su12010336
Chicago/Turabian StyleGan, Jinsong, Peizhen Li, and Qiang Liu. 2020. "Study on Dynamic Structure-Soil-Structure Interaction of Three Adjacent Tall Buildings Subjected to Seismic Loading" Sustainability 12, no. 1: 336. https://doi.org/10.3390/su12010336
APA StyleGan, J., Li, P., & Liu, Q. (2020). Study on Dynamic Structure-Soil-Structure Interaction of Three Adjacent Tall Buildings Subjected to Seismic Loading. Sustainability, 12(1), 336. https://doi.org/10.3390/su12010336