Article

Decomposition Analysis of CO2 Emissions Embodied in the International Trade of Russia

1
China Center for Energy Economics Research, School of Economics, Xiamen University, Xiamen 361005, China
2
Department of Finance, School of Economics and Finance, Huaqiao University, Quanzhou 362021, China
*
Author to whom correspondence should be addressed.
Sustainability 2020, 12(1), 323; https://doi.org/10.3390/su12010323
Submission received: 15 September 2019 / Revised: 17 December 2019 / Accepted: 19 December 2019 / Published: 31 December 2019
(This article belongs to the Section Environmental Sustainability and Applications)

Abstract

:
Our study improves the decomposition method based on the input–output approach to analyze CO2 emissions embodied in the international trade of Russia over the period from 1995 to 2014. The research finds out that carbon was transferred from the upstream resource sectors to the downstream manufacturing sectors and service sectors in Russia. Moreover, Russia was a net exporter of CO2 emissions. 31.46% of Russia’s CO2 emissions were generated for other countries’ consumption in 1999 while 10.68% in 2013. Basic resource and energy sectors were the significant emitters of exporting CO2 emissions. Sectors from traditional manufacturing industries and modern technical industries played an important role in importing embodied CO2 emissions of Russia. Moreover, the effect of modern technical industries on importing embodied CO2 emissions was increasing. The period after 2003 witnessed a substantial decline in Russia’s carbon intensities, which was majorly due to the transformation of the energy structure. Decomposition analysis of CO2 emissions embodied in the international trade can show the trading effect on embodied CO2 emissions from both exporting and importing perspectives. Russia’s case is able to provide instructive implications to the global climate mitigation policy. Countries that burden CO2 emissions for other countries’ consumption are encouraged to participate in the climate negotiation effectively and internalize environmental costs by products’ and services’ pricing in the international trade.

1. Introduction

With rising global attention to the climate change, CO2 emissions responsibility of countries has been discussed hotly. Russia, as a vital energy producer in the world, ranks as the fourth greatest emitter of CO2 emissions. According to the statistics of BP (British Petroleum) [1], Russia remained the second largest gas and the third greatest oil producer of the world in 2018, accounting for 17% and 12% of the global output, respectively. Russia’s oil exporters occupied 13% of the global market, and its gas exporters occupied 26%, in 2018; this means that Russia remain the world’s largest exporter of oil and natural gas.
As one of the leading energy producers and exporters in the world, Russia faces an upward pressure on CO2 emissions. If a county is a significant exporter of many products, it might take CO2 emissions responsibility for other countries [2,3]. Hence, Russia bears the burden of CO2 emissions for other countries’ consumption through exporting substantial energy [4,5]. The energy intensity of Russia rose by 1.9%, while CO2 emissions from energy consumption grew by 4.2% in 2018 [1]. In contrast, Russia has the potential to reduce CO2 emissions by importing a large number of agriculture and light industry products [6,7]. Free trade throughout the world causes carbon to transfer among industrial sectors of different countries [8,9]. In the context of trade globalization, this paper examines whether Russia has benefited or suffered from the international trade concerning for CO2 emissions.
Our research conducts the decomposition of embodied CO2 emissions in Russia. It analyzes embodied CO2 emissions from production and consumption sides, as well as based on importing and exporting perspectives. Studying CO2 emissions from production and consumption sides is an effective way to show the carbon flow from supply to demand [10,11]. The differences in exporting CO2 emissions and importing CO2 emissions will intuitively indicate the influence of the international trade on a country’s CO2 emissions [12,13,14]. With the development of trade globalization, Russia faces a continuous growth in energy production and exports. Research on the trading effect on CO2 emissions is able to provide potential policy implications to Russia on its future energy development strategy, carbon reduction policy, and industrial upgrading planning.
Compared with the traditional approach that calculates direct CO2 emissions from the production side, the improved approach estimates complete CO2 emissions (embodied CO2 emissions) from the whole life cycle. The latter takes carbon leakage among sectors and countries into account [15,16]. The embodied CO2 emissions estimation concerns the carbon transferring in the intermediate processing. Hence, we adopt the non-competitive input–output tables of Russia from the WIOD (World Input–Output Database), which distinguish the importing intermediate inputs from the domestic intermediate inputs. Based on the accessible data in the WIOD, we use the SRIO (Single-Regional Input–Output) model to calculate embodied CO2 emissions of Russia over the period from 1995 to 2014 and conduct the decomposition analysis.
Many research studies used the MRIO (Multi-Regional Input–Output) model and the SRIO model to estimate embodied CO2 emissions in different countries [15,17,18,19,20]. The MRIO model considers various emission intensities of different countries [21]. By contrast, the SRIO model takes the EAI (Emissions Avoided by Imports) assumption [22,23]. That is, SRIO assumes that emission intensities of imported goods are in consistency with the local technology. In recent years, the MRIO model was widely used in the assessment of embodied CO2 emissions of BRICS (Brazil, Russia, India, China, and South Africa) in a scope of trade globalization. They found out that Russia was the main exporter of CO2 emissions due to massive exports of energy products [5,24]. To the best of our knowledge, the existing research studies, which studied CO2 emissions of Russia by the MRIO model, did not estimate CO2 emissions embodied in the intermediate processing [19,25].
Different from the previous studies, our research has three novelties. Firstly, we distinguish the imported intermediate inputs from the domestic intermediate inputs. Based on the non-competitive input–output tables, we divide the imported goods according into different uses. The imported goods can be used to be the final demands consumed directly, the intermediate inputs consumed to produce the domestic final demands, and the intermediate inputs consumed to produce the exports. In this way, we are able to calculate CO2 emissions embodied in the intermediate processing from the whole supply–demand chain, which can provide a more comprehensive interpretation of the trading effect on CO2 emissions.
Secondly, this paper improves the model of Lin and Sun [15] by decomposing embodied CO2 emissions into seven components. Lin and Sun’s model overestimated CO2 emissions embodied in the products that were manufactured domestically and consumed abroad because it ignored the reduced effects from the imported products that were exported after intermediate processing. The model in this paper considers the decomposition analysis of CO2 emissions embodied in the international trade more precisely, and this is introduced specifically in the methodology section.
Thirdly, the study period witnessed how Russia’s economy was shocked by the Russian financial crisis in 1998 and then was gradually improved under the government of President Putin since 2000 [26]. In addition, energy production and exports have been considerably increased since the Russian Energy Strategy was published in 2003. This research studies CO2 emissions embodied in Russia’s international trade from both production and consumption side, as well as from both exporting and importing perspectives. The analysis can provide scientific references for the carbon flow among industrial sectors in Russia. Hence, this research on CO2 emissions embodied in the international trade during such a crucial period can potentially offer Russia instructive implications on its future energy policy and industrial upgrading planning.
The remainder of this paper is organized as follows: Section 2 introduces the data and methodology, Section 3 analyzes the results, Section 4 provides the further discussion, Section 5 illustrates the research conclusion, and Section 6 offers the policy implications.

2. Data and Methodology

2.1. Data

This research conducts the decomposition analysis on CO2 emissions embodied in Russia’s international trade from 1995 to 2014. We reorganize the input–output tables from the WIOD and update the CO2 emission data according to the OECD’s (Organization for Economic Co-operation and Development) data. Firstly, we rearrange Russia’s input–output tables with 56 sectors from 2012 to 2014 into 35 sectors based on the sector structure of Russia’s input–output tables from 1995 to 2011. Secondly, we update sectors’ CO2 emission data of Russia from 2010 to 2014 according to the CO2 emission statistics from OECD and the average change rate of each sector from 1995 to 2009, as the CO2 emission data is absent beyond 2009 in WIOD. Thirty-five industrial sectors of Russia’s economy system are illustrated in the Appendix A. Table A1 C1 sector is the primary industry, C2–C18 sectors are the secondary industry, and C19–C35 sectors are the tertiary industry.

2.2. Input–Output Analysis

Assuming that an economic system has n sectors, by the input–output analysis [27,28,29,30], the relationship of the total outputs, the intermediate inputs, and the final demands is as follows:
x = A x + y
where x and y are the n × 1 column vectors. They represent the outputs and the final demands of n sectors, respectively, in an entire economy. The final demands, y , contain the household consumption, the government consumption, gross fixed capital formation, changes in inventories and valuables, and the exports. Z = A x is an n × n matrix, which is the intermediate input matrix. Z i j is the total amount of intermediate inputs from sector i to produce the final demands of sector j . A is an n × n matrix of the direct consumption coefficients. Its element, A i j = Z i j / x j , represents the quantity of the intermediate inputs from sector i that are required for per unit output of sector j .
Furthermore, the relationship between x and y can be expressed by as Equation (2):
x = I A 1 y
where L = I A 1 is the Leontief inverse matrix, and its element l i j indicates the complete intermediate inputs required from sector i for per unit final demand of sector j .

2.3. Direct CO2 Emissions and Embodied CO2 Emissions

Denote C d as a 1 × n row vector, and its elements represent the quantity of n sectors’ direct CO2 emissions. Denote c d as a 1 × n row vector of direct carbon intensities for n sectors. c j d = C j d / x j , its elements indicate the amount of direct CO2 emissions from each sector. The relationship between C d and c d can be described as follows:
C d = c d x = c d I A 1 y = E d y
where E d is a 1 × n row vector of complete carbon intensities for n sectors. Its element E j d shows the quantity of CO2 emissions embodied in per unit product of sector j . That is, c j d x j is the amount of direct CO2 emissions produced by per unit output x j while E j d y j is the quantity of CO2 emissions embodied in per unit final demand y j .

2.4. Decomposition of Embodied CO2 Emissions

We classify CO2 emissions embodied in Russia’s international trade to investigate CO2 emissions from both production and consumption sides as well as from both exporting and importing perspectives (see Table 1). Part I is the amount of CO2 emissions embodied in the products that are manufactured domestically and also consumed domestically. Part II indicates the amount of CO2 emissions embodied in the products that are manufactured domestically and consumed abroad. Part III demonstrates the volume of embodied CO2 emissions from the products that are manufactured abroad and consumed domestically. Part IV shows the volume of embodied CO2 emissions from the products that are manufactured abroad and consumed abroad. Part III and part IV can be calculated both in the input form and in the output form [15]. The total CO2 emissions in the input form and in the output form for one category are equal, but the allocations of CO2 emissions to sectors are different in two forms.
Specifically, embodied CO2 emissions from the production-based perspective are the total of part I and part II. Embodied CO2 emissions from the consumption-based perspective are the total of part I and part III in the output form. Moreover, embodied CO2 emissions of the exports are the total of part II and part IV in the output form. Embodied CO2 emissions of the imports are the total of part III and part IV that are both in the input form. The difference in embodied CO2 emissions between production and consumption sides equals to that difference between the exports and the imports.
For the purpose of evaluating CO2 emissions embodied in four categories, CO2 emissions of final demand are divided into seven components in this paper. Denote Y e as embodied CO2 emissions of the final demands, and it includes the domestic component ( D ) and the net export component ( N X ). The difference of embodied CO2 emissions between the export component ( E X ) and the import component ( I M ) is the net export component. Hence, embodied CO2 emissions of the final demands are calculated as follows:
Y e = D + N X = D + E X I M
D , E X , and I M can be further divided into seven components:
D = D 1 + D 2
where D 1 shows embodied CO2 emissions from the commodities produced and consumed domestically. D 2 demonstrates embodied CO2 emissions from the imports that are consumed domestically as final demands directly. Hence, D 1 is part I while D2 is part III in the output form.
E X = E X 1 + E X 2
where E X 1 is embodied CO2 emissions from the exports that are produced from the domestic inputs, and E X 2 is embodied CO2 emissions from the exports that are produced from the imported intermediate inputs. EX1 is the calculation for part II while EX2 is the output form of part IV.
I M = I M 1 + I M 2 + I M 3
where I M 1 stands for embodied CO2 emissions from the imports that are consumed domestically as final demand directly. I M 2 represents embodied CO2 emissions from the imports that are used as the intermediate inputs to produce the domestic final demands. I M 3 indicates embodied CO2 emissions from the imports that are used as the intermediate inputs to produce the exports.
What should be emphasized is that the amount of D 2 equals the total of I M 1 + I M 2 , taking all the sectors as a whole. D 2 is in the output form, while IM1 + IM2 is in the input form for part III. Similarly, the amount of E X 2 equals to that of I M 3 . E X 2 is in the output form while I M 3 is in the input form for part IV.
Therefore, embodied CO2 emissions of the final demands can be expressed as follows:
Y e = D 1 + D 2 + E X 1 + E X 2 I M 1 I M 2 I M 3

2.5. Seven Components of Embodied CO2 Emissions

The non-competitive input–output tables from the WIOD distinguish the imports used as the intermediate inputs from the imports used as the direct final demands. Hence, different from the approaches that estimate the imported intermediate input matrix with competitive input–output tables, we can exactly calculate the consumption coefficients of the imports for each sector directly. Denote A m as the consumption coefficient matrix of the imports. Therefore, the total import x m can be expressed as follows:
x m = A m x + y m = A m I A 1 y + y m
where A m x is the amount of the imports that are used as the intermediate inputs, while y m is the volume of the imports that are used as the direct final demands. A m I A 1 y is the output form of A m x . It can be divided into two parts, F d and F e , which are the intermediate inputs consumed domestically and the re-exported part after domestic processing.
This study assumes that the emission factor of the imports is as same as the domestic factor, E d , which is the EAI (emissions avoided by imports) assumption. Hence, embodied CO2 emissions of the imports can be calculated by using the following equation:
E d x m = E d A m x + E d y m = E d F d + E d F e + E d y m
where E d y m , E d F d and E d F e are the formulas to calculate I M 1 , I M 2 , and I M 3 , respectively.
I M 1 = E d y m
I M 2 = E d F d
I M 3 = E d F e
Embodied CO2 emissions from the domestic processing of the imported intermediate inputs can be demonstrated as follows:
E d A m x = E d A m I A 1 y = E d F d + E d F e = E m y
where E m is a row vector, and its element stands for the quantity of CO2 emissions embodied in per unit final demand that is produced domestically from the imported intermediate inputs.
The formula to calculate embodied CO2 emissions from the imports that are used to produce the exports is as follows:
E m p = E d A m I A 1 p = E d A m x p = E d F e
where p is the value of the exports, and E m p is the formula to calculate E X 2 . The corresponding input form E d F e is the formula to calculate IM3. Then, the formula of E X 1 is as follows:
E X 1 = E X e E X 2 = E d E X E m p
Meanwhile, EX2 is calculated as follows:
E X 2 = E m p
The formula of D1 is as follows:
D 1 = E d y E d p + E m p
Furthermore, the input form E d F d can be transformed to output form E m y E m p . Hence, the formula of D2 is as follows:
D 2 = E m y E m p + E d y m

2.6. Estimation of Carbon Intensity

Carbon intensity is presented as Equation (20):
C I = T h e   q u a n t i t y   o f   t h e   e m b o d i e d   C O 2   e m i s s i o n s G D P
where the GDP is calculated by the added values from the input–output tables of the WIOD.
Carbon intensity of the exports is calculated as follows:
C I _ E X = E X E x p o r t
where EX is embodied CO2 emissions of the exports, and Export is the total values of the exports.
Carbon intensity of the imports is calculated as follows:
C I _ I M = I M I m p o r t
where IM is embodied CO2 emissions of the imports, and Import is the total values of the imports.
Carbon intensity of the net exports is calculated as follows:
C I _ N E X = E E B N E X
where E E B = E X I M , and it suggests the difference of embodied CO2 emissions between the exports and the imports. N E X is the values of the net exports.
As a summary of the methodology section, we outline the variables and the equations in Table 2. The calculation for four categories of embodied CO2 emissions is illustrated in Table 3, which is the supplementary table for Table 1.

3. Results

3.1. CO2 Emissions Embodied in Russia’s International Trade

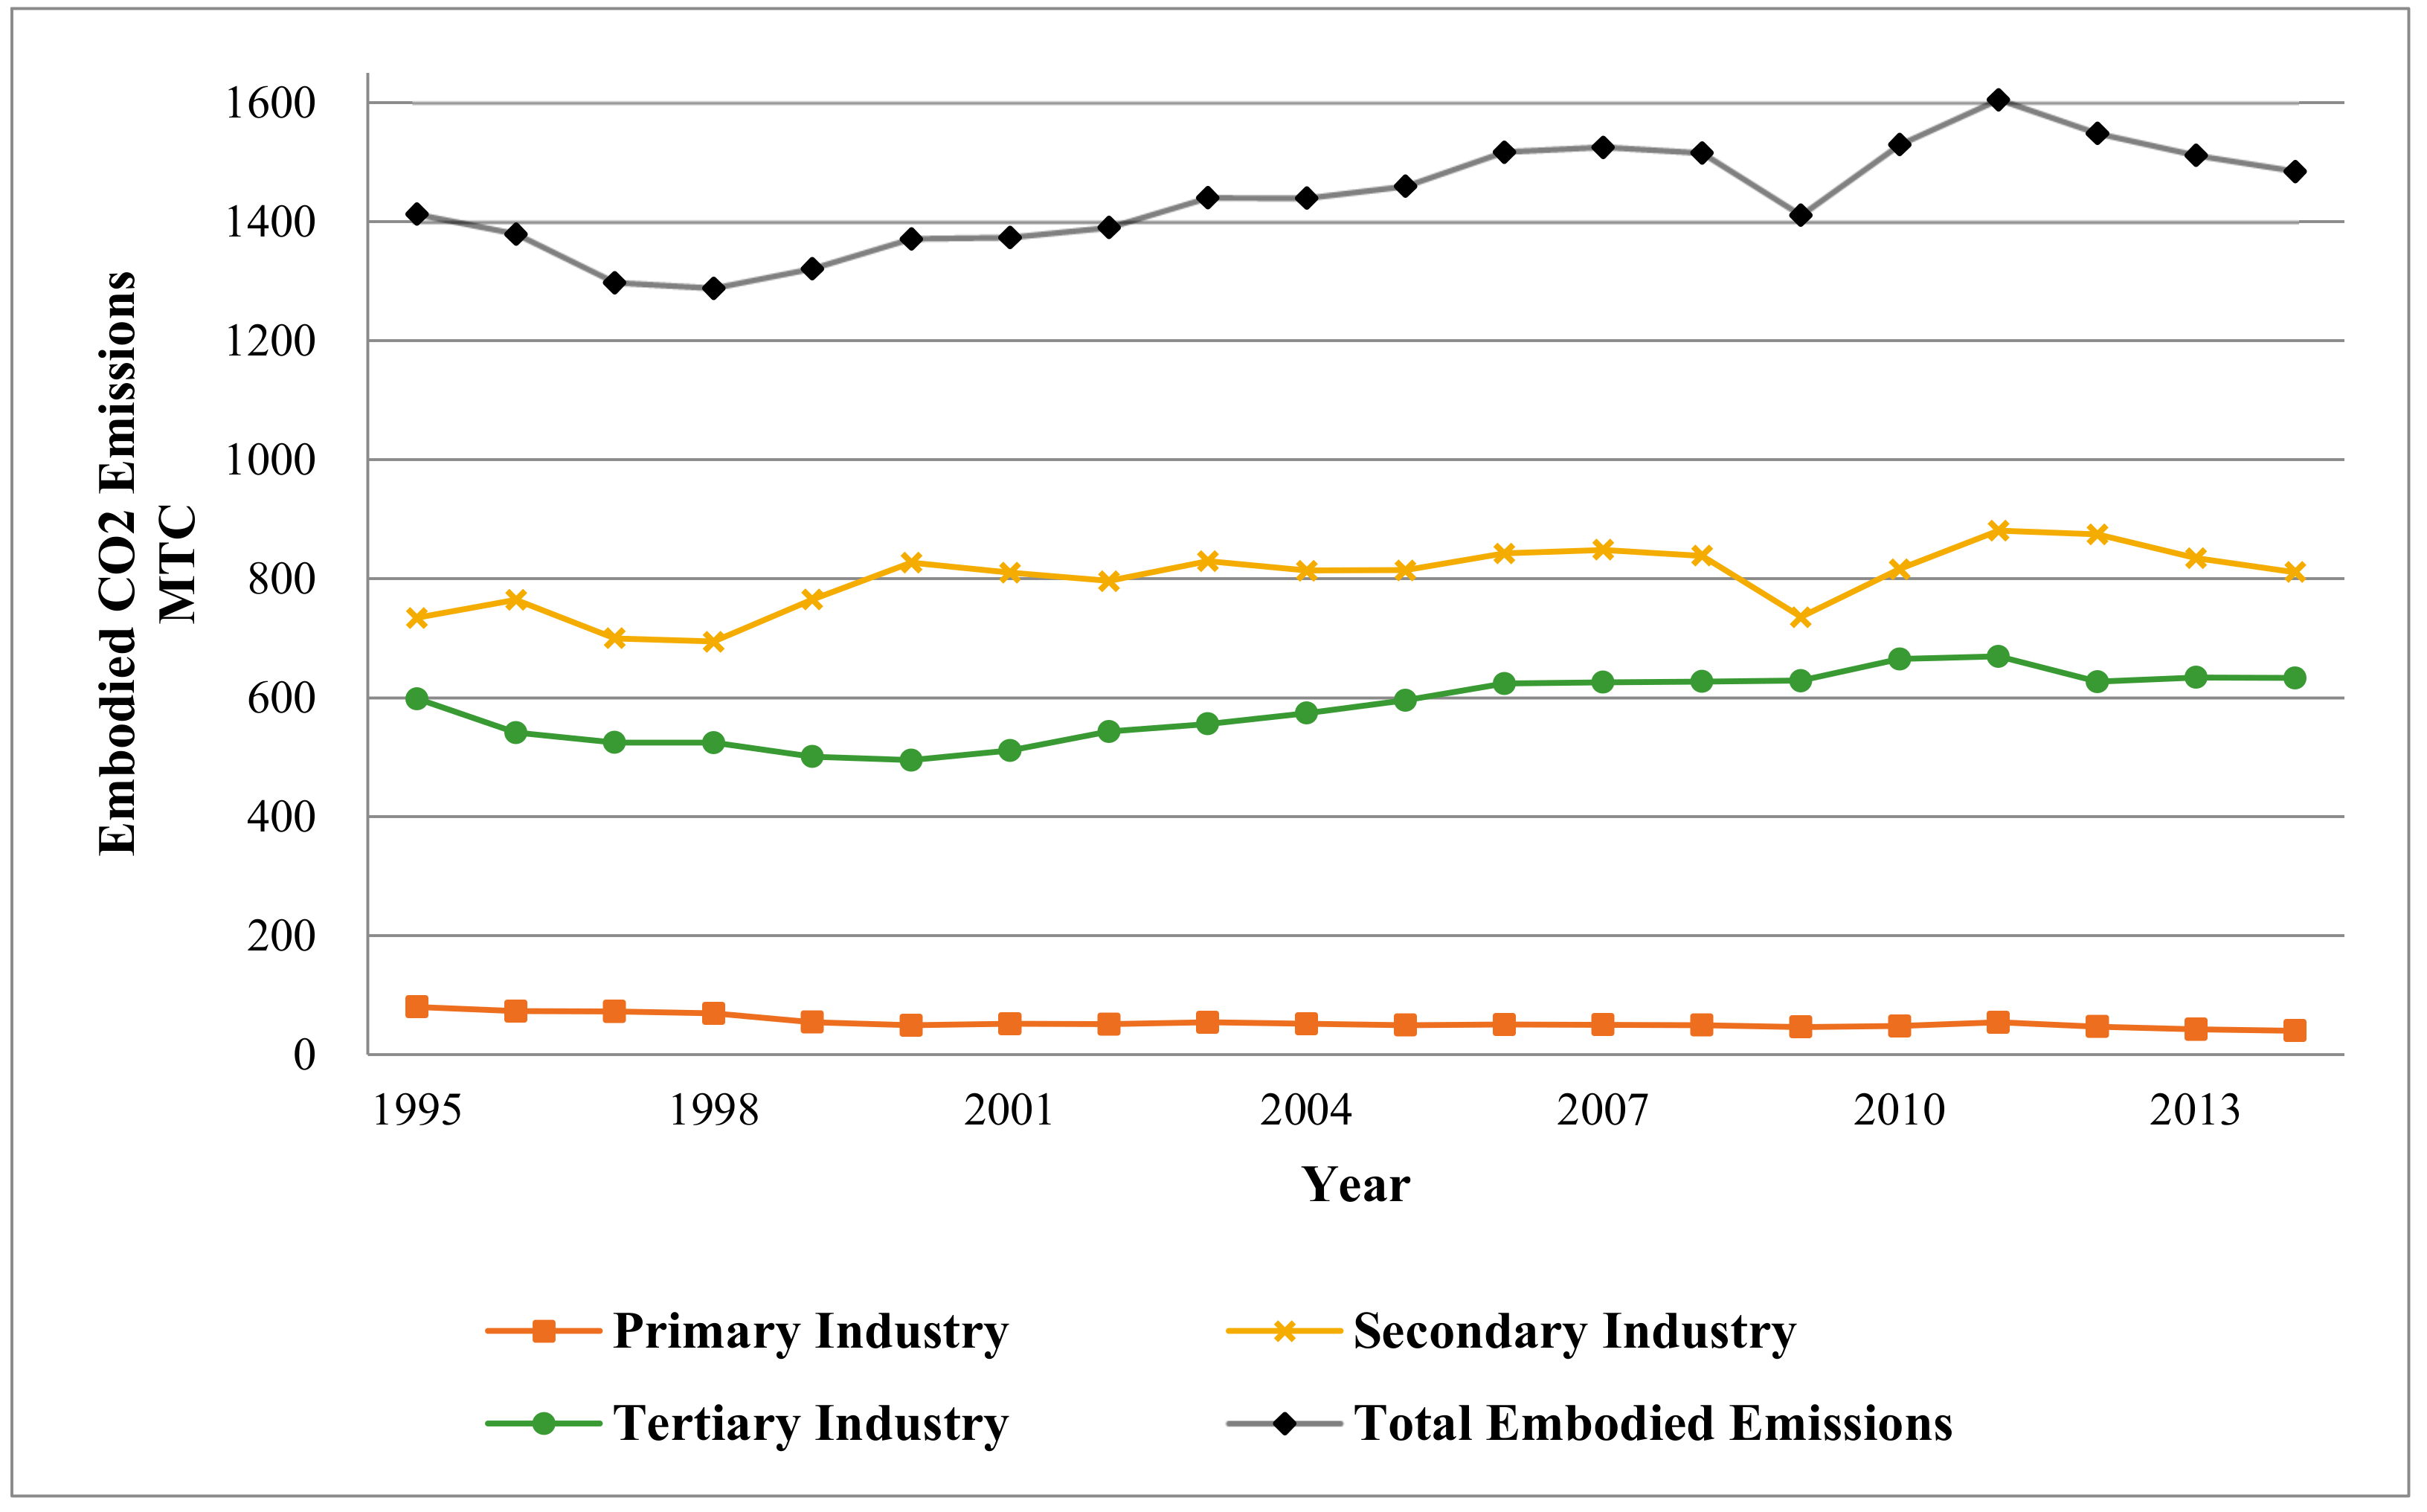
During the study period, the total CO2 emissions embodied in Russia’s international trade experienced a gentle fluctuation. From 1995 to 1999, the amount of embodied CO2 emissions slightly decreased from 1412.34 to 1320.87 MTC. It was followed by a general growth to 1524.86 MTC in 2007. After that, the volume of Russia’s embodied CO2 emissions declined to 1410.49 MTC in 2009 and increased again to 1604.72 MTC in 2011. The amount went down slightly to a similar level with 1995’s, namely 1484.25 MTC in 2014 (see Figure 1).
Comparing embodied CO2 emissions of three main industries in Russia, the primary industry accounted for an extremely small proportion of total CO2 emissions while the secondary industry occupied the largest proportion. Embodied CO2 emissions of the secondary industry accounted for over 50% of the total amount, and the variation trend was almost in consistency with total embodied CO2 emissions over the years, as shown in Figure 1. Embodied CO2 emissions of Russia’s secondary industry reduced from 734.20 MTC in 1995 to 765.02 MTC in 1999, and then it rose to 848.64 MTC in 2007 and decreased to 735.31 MTC in 2009. Subsequently, embodied CO2 emissions of the secondary industry in Russia went up to 880.45 MTC in 2011 and 811.05 MTC in 2014.
By contrast, CO2 emissions embodied in the primary industry were of a small volume in Russia. The amount of embodied CO2 emissions of the primary industry declined from 80.24 MTC in 1995 to 40.16 MTC in 2014. As for the tertiary industry, the volume of its embodied CO2 emissions increased from 597.90 MTC in 1995 to 633.04 MTC in 2014.
The sum of direct CO2 emissions of three main industries was equivalent to the total quantity of embodied CO2 emissions, as shown in Table 4. However, the allocations of direct and embodied CO2 emissions to three main industries were different. If an industry’s D C E is larger than its E C E (the result of D C E minus E C E is positive), then it indicates that the carbon is transferred from this industry to other industries. Otherwise, if an industry’s D C E is smaller than its E C E (the result of D C E minus E C E is negative), then it suggests that carbon is transferred from other industries to this industry.
The difference between D C E and E C E of the primary industry was −34.21 MTC in 1995 and −23.13 MTC in 2014. This difference of the tertiary industry was −444.41 MTC in 1995, and then its absolute value was lowest at −350.18 MTC in 1999 while followed by an increase to −454.90 MTC in 2011. By contrast, the disparity between D C E and E C E of the secondary industry was 478.62 MTC in 1995 and then decreased to 375.21 MTC in 1999. After that, it grew to 485.27 MTC in 2011. The differences between direct CO2 emissions and embodied CO2 emissions of three main industries imply that the carbon is transferred from the secondary industry to the primary industry and majorly to the tertiary industry in Russia.

3.2. Embodied CO2 Emissions from Production and Consumption Sides

The total production embodied CO2 emissions were more than consumption embodied CO2 emissions in Russia (see Table 5). It means that Russia emitted more CO2 in the production side than in the production side and burdened much CO2 emissions for other countries’ consumption. The quantity of CO2 emissions embodied in the production was 1412.34 MTC in 1995 and then went down to 1320.86 MTC in 1999. This amount was followed by a growth to 1524.86 MTC in 2007 and 1604.72 MTC in 2011. By contrast, the embodied CO2 emissions from the consumption side were 1252.92 MTC in 1995 and then reduced to 905.28 MTC in 1999. This amount went through an obvious growth to 1305.31 MTC in 2007 and 1410.78 MTC in 2011. The ratio of E E C to E E P was 88.71% in 1995. It was followed by a notable decrease to 68.54% in 1999. After that, the ratio grew to 89.32% in 2013. The variation in the ratio of E E C to E E P indicates what the extent that Russia burdens CO2 emissions for other countries’ consumption. For instance, 31.46% of Russia’s CO2 emissions were generated for other countries’ consumption in 1999, while it was 10.68% in 2013.
As for the primary industry of Russia, CO2 emissions embodied in the production were less than that in the consumption. It indicated that the primary industry of Russia was beneficial from the importing trade for CO2 emissions reduction. For the secondary industry and the tertiary industry of Russia, their production CO2 emissions were more than their corresponding consumption CO2 emissions. The results implied that the secondary industry and the tertiary industry of Russia burdened more CO2 emissions for other countries’ consumption by the exporting trade. In 1999, the difference between E E P and E E C of the secondary industry was 415.59 MTC, which was the greatest difference in the reported results of Table 5 and caused the lowest ratio of total E E C / E E P (68.54%).
From the supply side, electricity, gas and water supply sector (C17), construction sector (C18) and mining and quarrying sector (C2) from the secondary industry played the significant role in the production CO2 emissions. Those three sectors accounted for more than 30% of the production CO2 emissions in Russia. Inland transport sector (C23), public admin and defense sector (C31) and wholesale trade and commission trade (C20) from the tertiary industry also ranked as the top emitters of the supply side, occupying more than 20% of the production CO2 emissions in Russia.
From the demand side, electricity, gas and water supply sector (C17), construction sector (C18) and food, beverage and tobacco sector (C3) were the three largest generators of the consumption CO2 emissions in the secondary industry, accounting for more than 30% of total consumption CO2 emissions in Russia. Public admin and defense sector (C31) and wholesale trade and commission trade (C20) from the tertiary industry were the two greatest emitters of the consumption CO2 emissions in the tertiary industry, occupying more than 10% of the total. Agriculture, hunting, forestry, and fishing sector (C1) of the primary industry was the significant CO2 emitter from both the supply side and the demand side in Russia during the study period. The great emitters from the supply side and the demand side in Russia were overlapped to a large extent. The results implied that carbon was transferred mainly among resource-intensive sectors and significantly from upstream resource sectors to downstream service sectors.

3.3. CO2 Emissions Embodied in the Exports and in the Imports

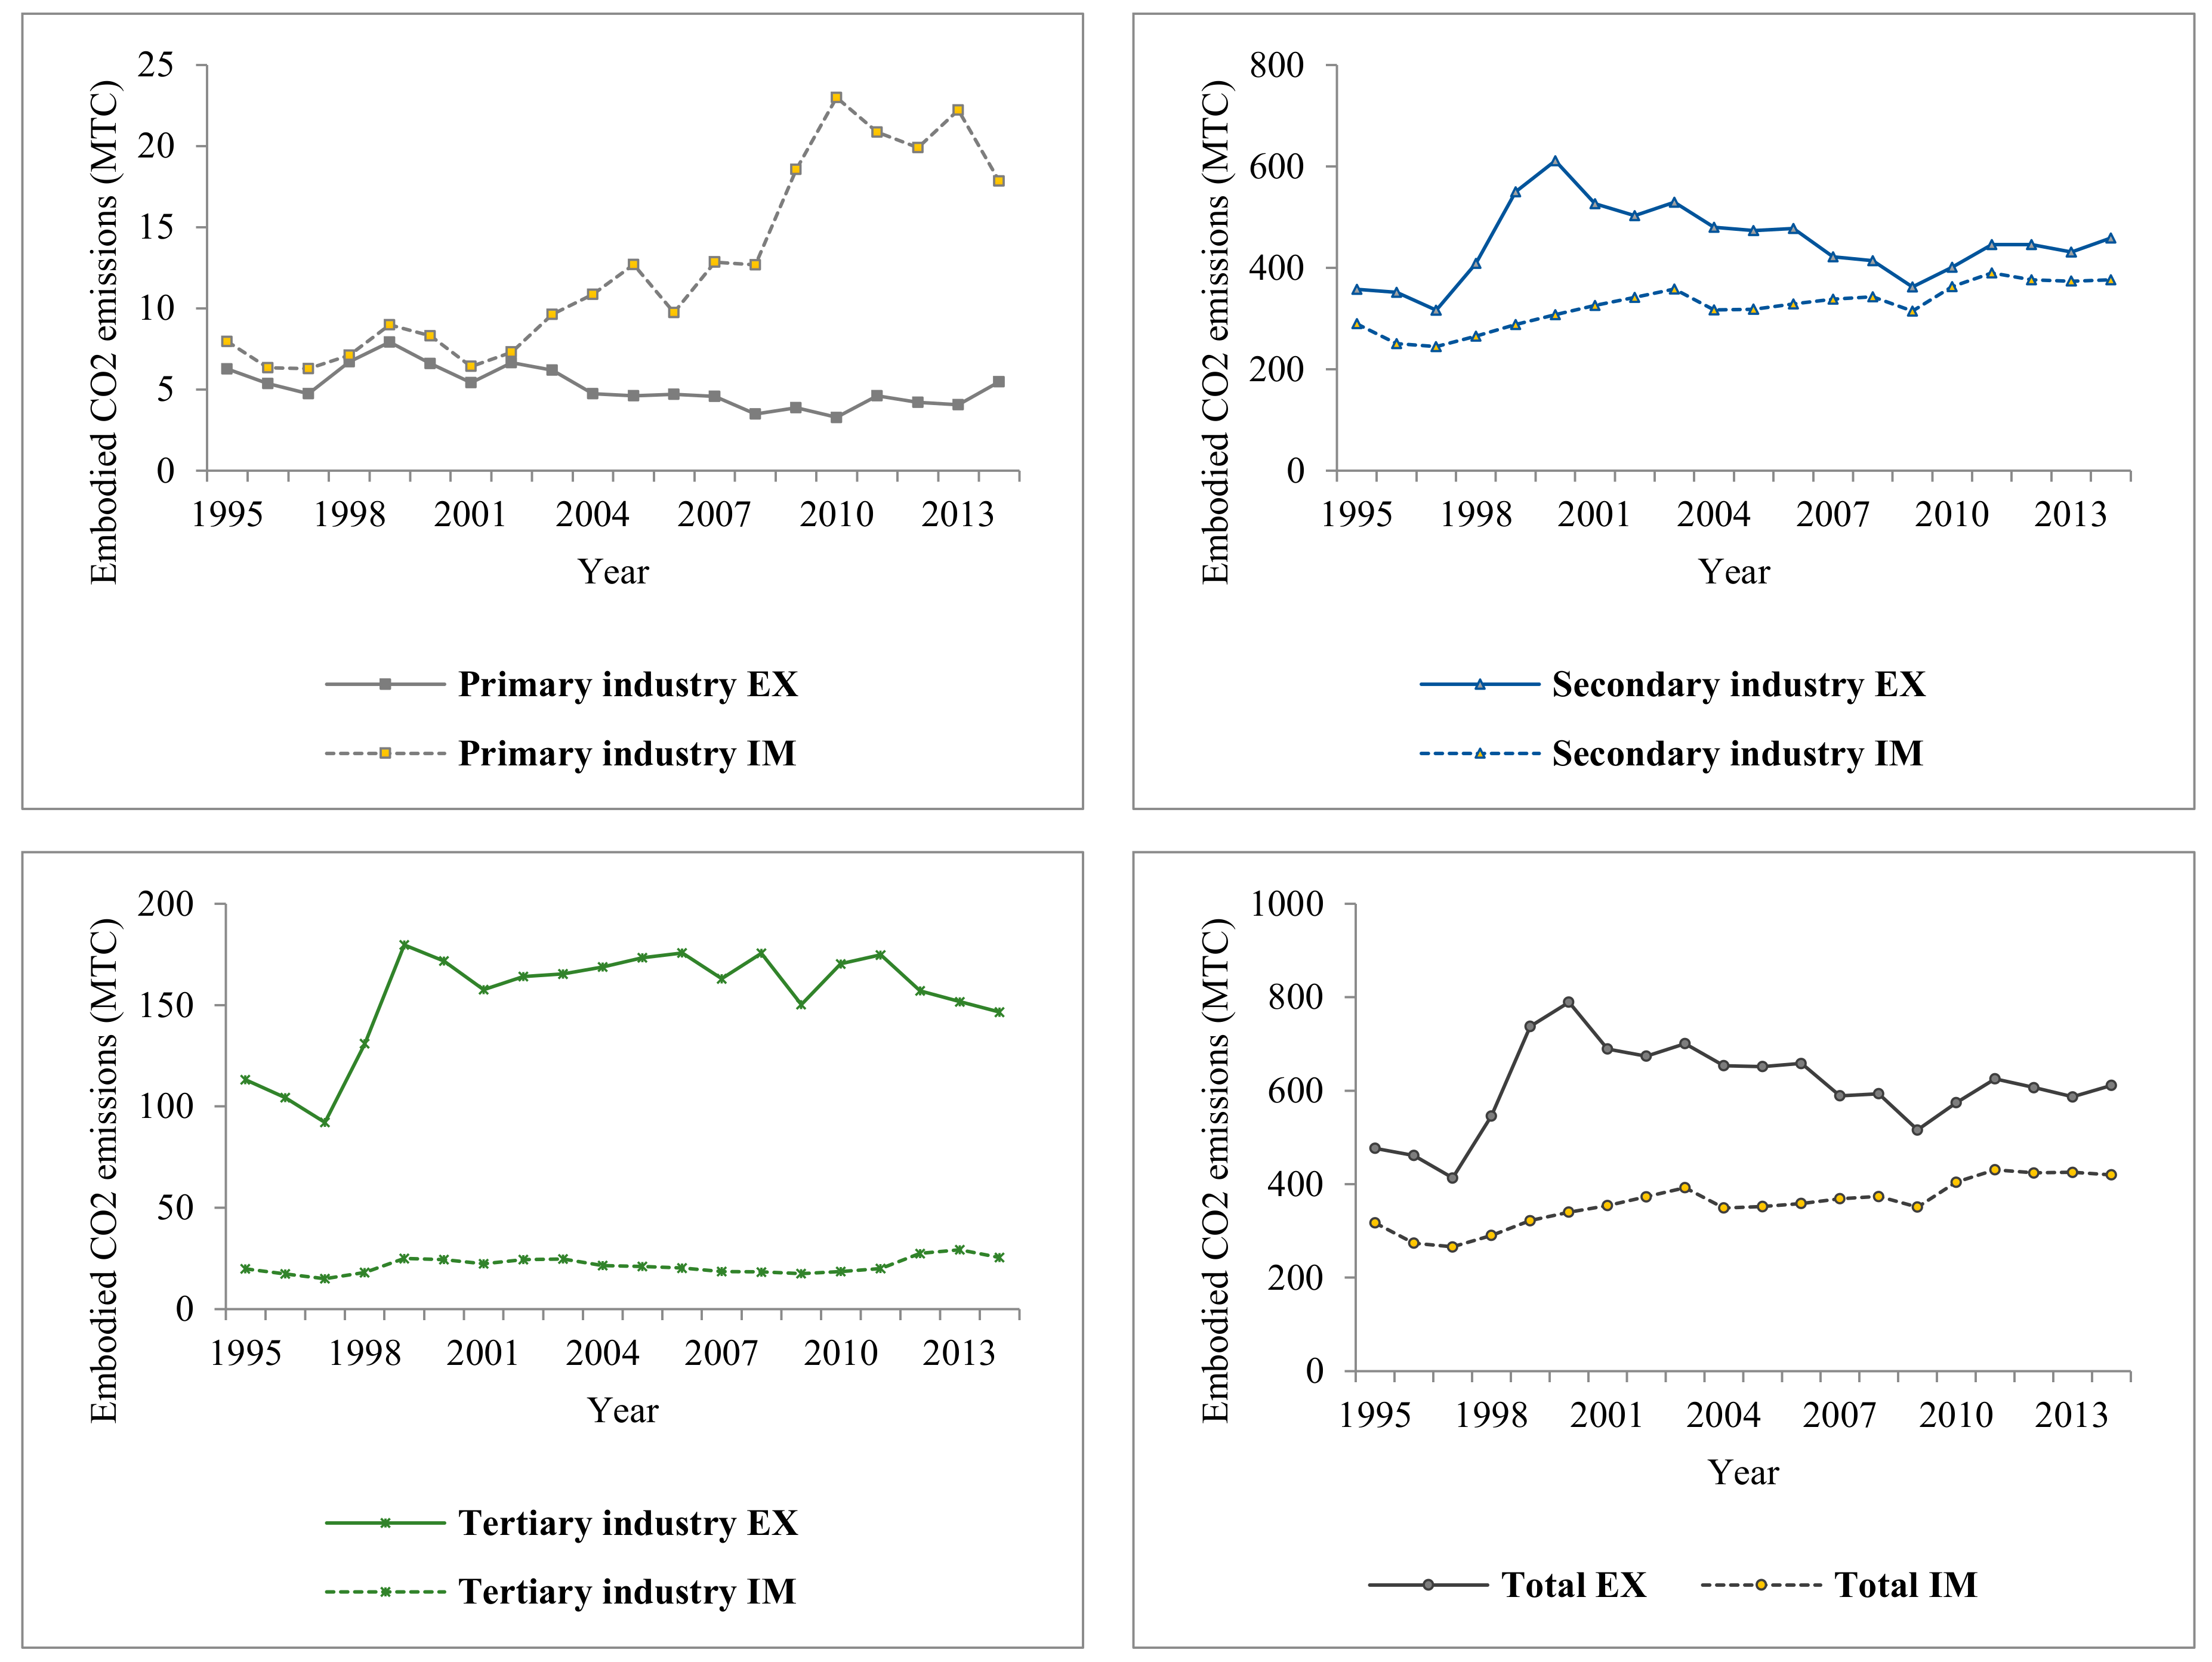
Figure 2 shows comparison between CO2 emissions embodied in the exports and in the imports of three main industries in Russia from 1995 to 2014. The primary industry was a net importer of CO2 emissions, while the secondary industry and the tertiary industry were net exporters in Russia. In general, Russia was a net exporter of CO2 emissions during the study period.
The primary industry accounted for a small proportion in embodied CO2 emissions of Russia’s international trade. The deviation of importing embodied CO2 emissions from exporting in the primary industry was enlarged since 2003. The amount of CO2 emissions embodied in the primary industry’s exports decreased from 6.20 MTC in 2003 to 4.05 MTC in 2013 while that increased from 9.62 MTC to 22.24 MTC in terms of imports.
The tertiary industry occupied the second largest proportion in embodied CO2 emissions of Russia’s international trade. Importing embodied CO2 emissions of the tertiary industry rose gently from 19.83 MTC in 1995 to 29.23 MTC in 2013. Exporting embodied CO2 emissions of the tertiary industry were 113.08 MTC in 1995. It experienced a remarkable growth from 92.16 MTC in 1997 to 174.75 MTC in 2011. Then it was followed by a slight reduction to 151.70 MTC in 2013.
The secondary industry was the greatest contributor to CO2 emissions embodied in international trade of Russia. Importing embodied CO2 emissions of the secondary industry went through a gentle growth from 289.68 MTC in 1995 to 374.07 MTC in 2013. Exporting embodied CO2 emissions of the secondary industry were 357.54 MTC in 1995. This amount rose substantially from 316.45 MTC in 1997 to 549.87 MTC in 1999. After that, it went down to 431.71 MTC in 2013.
CO2 emissions embodied in the total international trade of Russia show similar dynamic trend with that in the secondary industry. CO2 emissions embodied in the imports of Russia experienced a slight increase from 317.47 MTC in 1995 to 425.54 MTC in 2013. CO2 emissions embodied in the exports were 476.89 MTC in 1995. It increased dramatically from 413.36 MTC in 1997 to 737.46 MTC in 1999. Subsequently, this amount declined to 516.21 MTC in 2009 and 586.91 MTC in 2013. Denote E E B = E X I M , which is the difference of embodied CO2 emissions between the exports and the imports. The E E B was 159.41 MTC in 1995. It grew dramatically from 147.40 MTC in 1997 to 415.59 MTC in 1999, and then it declined to 161.38 MTC in 2013. Positive E E B intuitively indicated that Russia was a net exporter in embodied CO2 emissions during the study period. In other words, Russia was suffering much more CO2 emissions due to the free trade throughout the world.
As the methodology section mentioned, the difference of embodied CO2 emissions between production and consumption sides equaled to that between exporting and importing perspectives in a national scope (see Table 6). However, the allocation of the difference to three main industries was various. Denote E E P E E C as N P C and E X I M as E E B . It can be seen that the N P C and E E B were negative of the primary industry while positive of the secondary industry and the tertiary industry. The results confirmed that Russia was a net importer in the primary industry while a net exporter in the secondary industry and the tertiary industry. The secondary industry’s N P C was larger than its corresponding E E B . The tertiary industry’s N P C was smaller than its E E B . It indicated that carbon was mainly transferred from the secondary industry to the tertiary industry during the domestic supply–demand chain, and the secondary industry of Russia involved actively in the global value chain via the international trade.

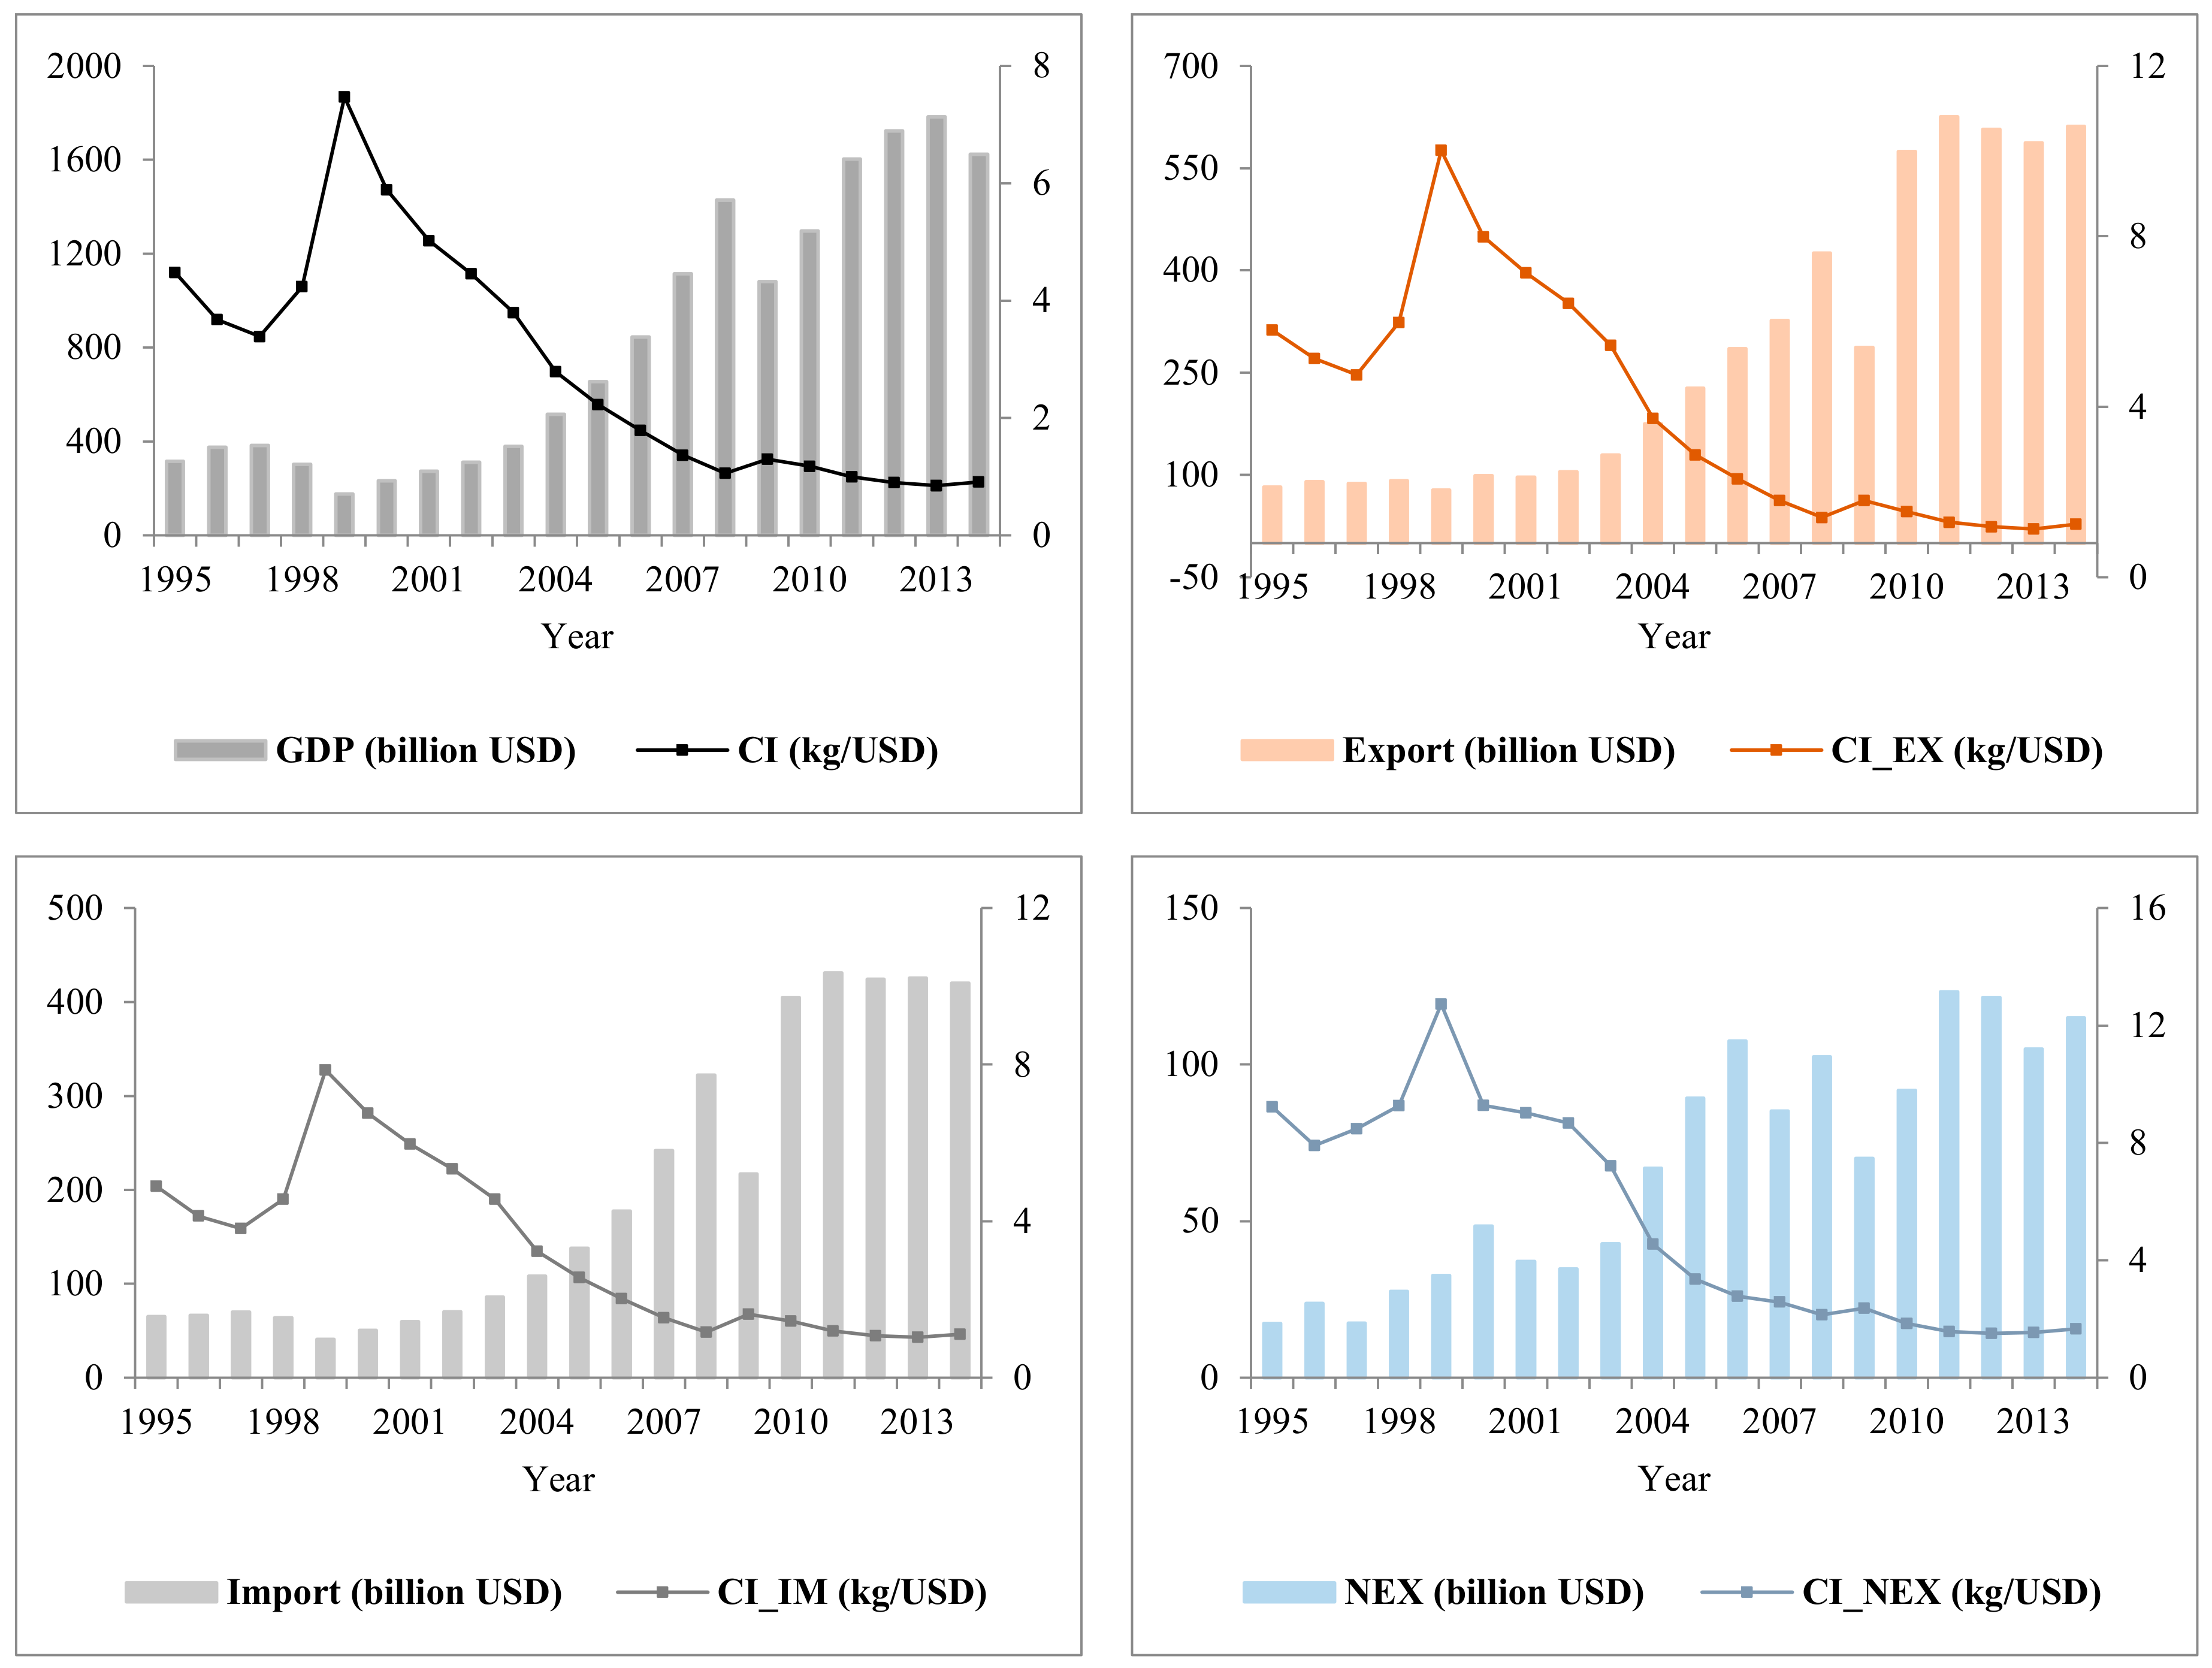
3.4. Carbon Intensity of Embodied CO2 Emissions

The GDP was calculated by the added values based on the input–output tables from the WIOD. The GDP of Russia in 1995 was 315.03 billion USD. It reduced from 382.61 billion USD in 1997 to 176.79 billion USD in 1999. However, Russia’s economy was recovered gradually since 2000 [31,32] and experienced a notable growth to 1428.38 billion USD in 2008. The global financial crisis of 2008 shocked Russia’s economy in the following year when its GDP fell to 1081.38 billion USD in 2009. Russia’s economy was continuously recovered by a growth in its GDP to 1783.96 billion USD in 2013. By contrast, the carbon intensity of GDP in Russia increased significantly from 3.39 kg/USD in 1997 to 7.47 kg/USD in 1999, and then it was followed by a substantial reduction to 0.85 kg/USD in 2013 (see Figure 3).
The dynamic trend of the exports was generally in consistency with that of the GDP during the study period. The export value of Russia was minimum at 77.61 billion USD in 1999 and then was going through an upward trend to 425.57 billion USD in 2008. After that, the export value of Russia was almost doubled from 286.69 billion USD in 2009 to 586.91 billion USD in 2013. The carbon intensity of the exports varied quite widely. The carbon intensity of the exports peaked at 10.02 kg/USD in 1999 and then decreased dramatically to 1.13 kg/USD in 2013. The import value of Russia was only 40.97 billion USD in 1999, but it grew to 425.54 billion USD in 2013. The carbon intensity of the imports was maximum at 7.86 kg/USD in 1999 and then declined to 1.03 kg/USD in 2013. In general, the significant decrease in the carbon intensity after 2003 explained why the embodied CO2 emissions of the exports did not grow that much when the GDP and the exports were improved substantially.
From 1995 to 2003, the net export value of Russia was comparably lower at the level below 50 billion USD. However, the net export value of Russia was augmented to 123.24 billion USD in 2011. The carbon intensity of the net export was at a higher level compared with that of the GDP, the exports and the imports respectively. The carbon intensity of net exports in Russia was 12.73 kg/USD in 1999 and then decreased to only 1.57 kg/USD in 2011, which experienced a great reduction.
Overall, the period after 2003 witnessed a remarkable reduction in the carbon intensities of the GDP, the exports, the imports and the net exports in Russia. It was majorly due to the transformation of the energy structure in Russia. The coal made up more than 20% of the total energy consumption in 1990, but its share reduced to below 15% in 2009. By contrast, the proportion of natural gas rose by nearly 4% from 1990 to 2009. Moreover, nuclear power accounted for 6.6% and hydropower occupied 2.3% of the energy consumption by 2009 in Russia [33], which were of great potential to improve the energy efficiency and reduce CO2 emissions.

4. Discussion

4.1. Comparison of Sectors’ CO2 Emissions Embodied in the Exports and the Imports

The top eight sectors that had the most exporting embodied CO2 emissions in each year over the study period were almost consistent in Russia (see Table 7). Among those eight sectors, wholesale trade and commission trade sector (C20) and inland transport sector (C23) were from the tertiary industry, while the other six sectors were from the secondary industry. Those secondary industry sectors were majorly basic resource suppliers, such as mining and quarrying sector (C2), basic metals and fabricated metal sector (C12), coke, refined petroleum, and nuclear fuel sector (C8), and chemicals and chemical products sector (C9). The results indicated that Russia provided substantial resources to the global market by exporting trade, which caused a large amount of CO2 emissions [17,34].
In contrast, the top eight sectors that contributed to most of importing embodied CO2 emissions slightly changed in each year during the study period in Russia (see Table 8). Those greatest generators from the import perspective were from the secondary industry (except C1) and the primary industry (C1). Sectors from the modern technical industries like machinery sector (C13), electrical and optical equipment sector (C14), and transport equipment sector (C15) played a remarkable role in importing embodied CO2 emissions. Moreover, the effect of those technical industries on importing embodied CO2 emissions was increasing. Such as the proportion of transport equipment sector (C15) was more than being tripled from 1995 to 2013, which became a more and more significant emitter of importing embodied CO2 emissions over the research years. Sectors from the traditional manufacturing industries were also notable contributors to CO2 emissions from the importing perspective, for example, the food, beverages, and tobacco sector (C3) and the textiles and textile products sector (C4).

4.2. Comparison of the E E B s between Sectors

Positive E E B indicates a net exporter of CO2 emissions, meaning that this sector was suffering more CO2 emissions from the exporting trade. The sectors that had the largest positive E E B in Russia during the study period were from the secondary industry and the tertiary industry (see Table 9). As the significant contributors to the exporting embodied CO2 emissions (see Table 7), the mining and quarrying sector (C2), basic metals and fabricated metal sector (C12), inland transport sector (C23), inland transport sector (C20), coke, refined petroleum, and nuclear fuel sector (C8), and electricity, gas, and water supply sector (C17) had the greatest positive E E B as well. However, it was not definite that notable emitters of exporting embodied CO2 emissions had positive E E B , such as chemicals and chemical products sector (C9) and machinery sector (C13). That is because both the chemicals and chemical products sector (C9) and the machinery sector (C13) were also important generators of importing CO2 emissions as well (see Table 8). Instead, retail trade sector (C21) and other supporting and auxiliary transport activities sector (C26) from the tertiary industry were two of the top positive E E B sectors. The top positive E E B sectors suggest that Russia was an essential exporter of the carbon-intensive sectors, such as the basic resource and energy supply industries.
Negative E E B suggests a net importer of CO2 emissions, which indicates that the importing trade benefited this sector to CO2 reduction. The sectors with the largest negative E E B were majorly from the secondary industry and the primary industry (C1) (see Table 10). Transport equipment sector (C15) and electrical and optical equipment sector (C14), which were modern technical industries, had obvious negative E E B in Russia. It was highly likely resulted from the increase in the foreign investments in Russia’s technical manufacturing industry as well as the growth in the imports [35,36,37]. Traditional manufacturing industries of Russia, like the textiles and textile products sector (C4), leather, leather and footwear sector (C5) and food, beverages and tobacco sector (C3), acted the key role in CO2 reduction by the importing trade. Chemicals and chemical products sector (C9) and machinery sector (C13) were important emitters from both import and export perspectives (see Table 7 and Table 8), while their E E B were turned to be negative (see Table 10). The results implied that chemicals and chemical products sector (C9) and machinery sector (C13) in Russia participated deeply in the global value chain via the international trade.

5. Conclusions

The quantity of embodied CO2 emissions in Russia could be affected by the economic context. In general, economy depression could result in relatively lower production and less CO2 emissions [38]. It could be observed from the comparably low level of CO2 emissions of Russia around 1999 due to the economy recession, which was resulted from the 1998 financial crisis. Furthermore, the transformation of the energy structure could reduce embodied CO2 emissions by lowering the carbon intensity. The carbon intensities of the GDP, the exports, the imports, and the net exports in Russia were continuously declining after 2003, when the Russia’s government published the Energy Strategy to 2020. In 2009, it republished the target: a 56% energy intensity reduction before 2030 (compared with 2005) [39,40]. This policy attempted to enhance the energy production and improve the energy efficiency by coordinating the energy structure to be cleaner. From 1995 to 2015, consumption of coal decreased by 26% in Russia, while natural gas increased by 7%. Nuclear energy was nearly doubled, and renewable energy grew almost eight times over this period [41].
The comparison between direct and embodied CO2 emissions showed that carbon was transferred massively from the secondary industry to the primary industry and the tertiary industry in Russia. Learning from CO2 emissions embodied in the production and the consumption, carbon was transferred from the upstream resource sectors to the downstream manufacturing sectors and service sectors in Russia. Moreover, CO2 emissions embodied in the production were more than that in the consumption, which indicated that Russia took the responsibility of CO2 emissions for other countries’ consumption. The ratio of consumption CO2 emissions to production CO2 emissions implied the extent that Russia was burdened by CO2 emissions for other countries’ consumption. The results showed that 31.46% of Russia’s CO2 emissions were generated for other countries’ consumption in 1999, while it was 10.68% in 2013.
Generally, exporting CO2 emissions were more than importing CO2 emissions from 1995 to 2014. That means Russia was a net exporter of CO2 emissions during the study period. The primary industry was a net importer of CO2 emissions, while the secondary industry and the tertiary industry were net exporters. Basic resource sectors, such as mining and quarrying sector (C2), basic metals and fabricated metal sector (C12), and coke, refined petroleum, and nuclear fuel sector (C8), were the significant emitters of exporting CO2 emissions in Russia. That is because Russia exported substantial resources and energy to the world.
In contrast, sectors from the traditional manufacturing industries were notable contributors to CO2 emissions from the import perspective, such as the food, beverages, and tobacco sector (C3) and the textiles and textile products sector (C4). Modern technical industries like the machinery sector (C13), electrical and optical equipment sector (C14), and transport equipment sector (C15) also played an important role in importing embodied CO2 emissions of Russia. Moreover, the trading effect of those technical industries on importing embodied CO2 emissions was increasing.
E E B is the difference between exporting CO2 emissions and importing CO2 emissions. Positive E E B indicates a net exporter of CO2 emissions, while negative E E B suggests a net importer of CO2 emissions. The top positive E E B sectors showed that Russia was an essential exporter of the carbon-intensive sectors, such as the mining and quarrying sector (C2), basic metals and fabricated metal sector (C12), coke, refined petroleum, and nuclear fuel sector (C8), and electricity, gas, and water supply sector (C17). Modern technical industries, like the transport equipment sector (C15) and electrical and optical equipment sector (C14), and traditional manufacturing industries, like textiles and textile products sector (C4), leather, leather and footwear sector (C5) and food, beverages and tobacco sector (C3), were key negative E E B sectors in Russia. The chemicals and chemical products sector (C9) and machinery sector (C13) were important emitters from both importing and exporting perspectives, while their E E B s were turned to be negative. It implied that the chemicals and chemical products sector (C9) and machinery sector (C13) in Russia participated deeply in the global value chain via the international trade.
The research reveals that Russia’s CO2 emissions largely depend on its energy structure and industrial structure. How the industrial linkages of Russia involved in the global value chain affect CO2 emissions will be worth studying, especially since Russia remains one of the world’s greatest energy producers and exporters in the future.

6. Policy Implications

Based on the decomposition analysis of CO2 emissions embodied in the international trade, we come up with some policy implications.
Firstly, countries that are net exporters of CO2 emissions are encouraged to participate effectively in the global climate negotiation. Allocation of the CO2 emission responsibility to different countries is argued heatedly for the global climate mitigation action. Setting up a CO2 emission reduction target for a country should consider its burdening CO2 emissions for other countries. Taking Russia as an example, according to the statistics from the evolving transition scenario of BP [42], Russia will remain the world’s largest primary energy exporter by 2040. Its carbon intensity continues to be reduced, but it is expected to be the most carbon-intensive economy among the researched countries in the BP program [42]. To a certain extent, countries that consume energy and products embodying massive CO2 emissions from the exports of Russia, especially the developed countries, should be responsible for CO2 emissions. With this perspective, a new framework to allocate the responsibility of CO2 emissions should be founded in the climate negotiation, and the CO2 emissions reduction target can be established in the form of the carbon intensity for CO2 emission net exporters.
Secondly, CO2 emissions embodied in exports and imports largely depend on the industrial structure in the international trade. The decomposition analysis of CO2 emissions embodied in the international trade can provide a country with an overview of the sectors’ CO2 emission structures. In Russia, exporting CO2 emissions are principally from basic resource and energy sectors, while importing CO2 emissions are majorly from traditional manufacturing sectors and technical manufacturing sectors in Russia. Moreover, the trading effect of technical manufacturing sectors on importing CO2 emission is increasing in Russia. Taking the relationship between CO2 emissions and industrial structure into consideration is potentially beneficial for Russia’s future energy policy. Advancement in the trade globalization deepens the international specialization, which leads to more multiplex carbon transfer between industrial sectors. Therefore, countries that participate actively in the international trade are supposed to coordinate environmental costs and economic benefits better for the global sustainable development, particularly for the future industrial upgrading of developing net CO2 exporters.
Thirdly, the energy structure is a key factor affecting CO2 emissions embodied in the international trade. From 1995 to 2015, consumption of coal decreased by 26% in Russia, while natural gas increased by 7%. Nuclear energy was nearly double, and renewable energy grew almost eight times over this period [41]. By contrast, the carbon intensities of the GDP and the exports of Russia decreased by almost 80% during the study period from 1995 to 2014, which indicates that the carbon intensity can be reduced by adjusting the energy structure. The development of renewable energy sources is an important target in European strategic plans [43,44]. For the long run, enhancing the development of renewable energy to make the energy structure cleaner is necessary for global-scale energy sustainability. Furthermore, improving the technical level of intermediate processing to achieve more energy efficiency is important for CO2 emission reduction.
Fourthly, the responsibility of embodied CO2 emissions can be internalized in the future international cooperation. For the significant energy and resource exporters (like Russia), the duty of embodied CO2 emissions can be internalized via energy pricing. For the notable manufacturing exporters (like China [45]), the environmental costs of CO2 emissions can be internalized via product pricing. In other words, the responsibility of embodied CO2 emissions can be transferred directly to the consumption side by internalizing carbon costs via products and services pricing in the international trade. Additionally, the cooperation can be extended to the technology exchange. Advanced technology from those consumption countries that are more developed can be imported to exchange the exports from less-developed countries.

Author Contributions

All of the authors contributed to the model construction; C.S. provided the core idea and gave some key advice for the results; L.C. wrote the whole manuscript; G.H. helped check through the whole paper and wrote the policy recommendations. All authors have read and agreed to the published version of the manuscript.

Acknowledgments

We would like to thank Mr. Zengguang Zhong of MOE Key Laboratory of Econometrics, School of Economics at Xiamen University, who kindly provided data analysis support. We would like to express our sincere gratitude to the editor and anonymous reviewers for their insightful and constructive comments. This work is supported by the Major Research Plan of National Social Science Foundation (18ZDA106). Especially, we would like to thank the experts who participated in the evaluation and improvement of this manuscript.

Conflicts of Interest

The authors declare no conflicts of interest.

Appendix A

Table A1. Thirty-five industrial sectors according to the WIOD.
No.Name
C1Agriculture, Hunting, Forestry, and Fishing
C2Mining and Quarrying
C3Food, Beverages, and Tobacco
C4Textiles and Textile Products
C5Leather, Leather and Footwear
C6Wood and Products of Wood and Cork
C7Pulp, Paper, Paper, Printing, and Publishing
C8Coke, Refined Petroleum, and Nuclear Fuel
C9Chemicals and Chemical Products
C10Rubber and Plastics
C11Other Nonmetallic Mineral
C12Basic Metals and Fabricated Metal
C13Machinery, Not Elsewhere Classified
C14Electrical and Optical Equipment
C15Transport Equipment
C16Manufacturing, Not Elsewhere Classified; Recycling
C17Electricity, Gas, and Water supply
C18Construction
C19Sale, Maintenance, and Repair of Motor Vehicles and Motorcycles; Retail Sale of Fuel
C20Wholesale Trade and Commission Trade, Except of Motor Vehicles and Motorcycles
C21Retail Trade, Except of Motor Vehicles and Motorcycles; Repair of Household Goods
C22Hotels and Restaurants
C23Inland Transport
C24Water Transport
C25Air Transport
C26Other Supporting and Auxiliary Transport Activities; Activities of Travel Agencies
C27Post and Telecommunication
C28Financial Intermediation
C29Real Estate Activities
C30Renting of Machinery and Equipment and Other Business Activities
C31Public Admin and Defense; Compulsory Social Security
C32Education
C33Health and Social Work
C34Other Community, Social, and Personal Services
C35Private Households with Employed Persons

References

  1. BP. BP Statistical Review-2019: Russia’s Energy Market in 2018. Available online: https://www.bp.com/en/global/corporate/energy-economics/statistical-review-of-world-energy/country-and-regional-insights/russia.html (accessed on 16 October 2019).
  2. Boamah, K.B.; Du, J.; Bediako, I.A.; Boamah, A.J.; Abdul-Rasheed, A.A.; Owusu, S.M. Carbon dioxide emission and economic growth of China—The role of international trade. Environ. Sci. Pollut. Res. 2017, 24, 13049–13067. [Google Scholar] [CrossRef] [PubMed] [Green Version]
  3. Jiang, X.; Chen, Q.; Guan, D.; Zhu, K.; Yang, C. Revisiting the Global Net Carbon Dioxide Emission Transfers by International Trade: The Impact of Trade Heterogeneity of China. J. Ind. Ecol. 2016, 20, 506–514. [Google Scholar] [CrossRef]
  4. Pan, A.; Wei, L. Embodied Carbon in Foreign Trade between China and Other BRICS Countries. J. Quant. Tech. Econ. 2015, 4, 54–70. [Google Scholar]
  5. Yang, L. CO2 Emissions Embodied in International Trade—A Comparison on BRIC Countries. Money, Trade, Finance, Trade and Development Working Paper. 2012. Available online: https://finance-and-trade.htw-berlin.de/fileadmin/HTW/Forschung/Money_Finance_Trade_Development/working_paper_series/wp_03_2012_Yang_CO2-Emissions-BRIC.pdf (accessed on 16 October 2019).
  6. Erokhin, V. Factors Influencing Food Markets in Developing Countries: An approach to Assess Sustainability of the Food Supply in Russia. Sustainability 2017, 9, 1313. [Google Scholar] [CrossRef] [Green Version]
  7. Wang, Y.; Huang, S.; Kang, S.; Zhang, C.; Li, X. Russian import statistics in the mirror of world exports. Bofit Online 2012, 1031, 17791–17806. [Google Scholar]
  8. Fan, J.; Zhang, X.; Wang, J.; Wang, Q. Measuring the Impacts of International Trade on Carbon Emissions Intensity: A Global Value Chain Perspective. Emerging Markets Finance and Trade. 19 September 2019. Available online: https://www.researchgate.net/publication/335929667_Measuring_the_Impacts_of_International_Trade_on_Carbon_Emissions_Intensity_A_Global_Value_Chain_Perspective (accessed on 16 October 2019).
  9. Tsagkari, M.; Gaona, A.; Gonzalez, J.F.; Järvinen, J. The evolution of carbon dioxide emissions embodied in international trade in Poland: An input-output approach. Environ. Socio-Econ. Stud. 2018, 6, 36–43. [Google Scholar] [CrossRef] [Green Version]
  10. Fernández-Amador, O.; Francois, J.F.; Tomberger, P. Carbon dioxide emissions and international trade at the turn of the millennium. Ecol. Econ. 2016, 125, 14–26. [Google Scholar] [CrossRef]
  11. Vlčková, J.; Nosek, V.; Novotný, J.; Lupíšek, A. Carbon dioxide emissions embodied in international trade in Central Europe between 1995 and 2008. Morav. Geogr. Rep. 2015, 23, 2–13. [Google Scholar] [CrossRef] [Green Version]
  12. Demiral, M. Examining Trade Mechanism of International Carbon Dioxide Emission: Evidence from Major Emitter Countries. Int. J. Energy Econ. Policy 2016, 6, 258–265. [Google Scholar]
  13. Hyun-Sik, C.; Hae-Chun, R. Carbon Dioxide Emissions of Korea and Japan and Its Transmission via International Trade. Int. Econ. J. 2001, 15, 117–136. [Google Scholar] [CrossRef]
  14. Stevens, D. The influence of the fossil fuel and emission-intensive industries on the stringency of mitigation policies: Evidence from the OECD countries and Brazil, Russia, India, Indonesia, China and South Africa. Environ. Policy Gov. 2019, 29, 279–292. [Google Scholar] [CrossRef]
  15. Lin, B.; Sun, C. Evaluating carbon dioxide emissions in international trade of China. Energy Policy 2010, 38, 613–621. [Google Scholar] [CrossRef]
  16. Sánchez-Chóliz, J.; Duarte, R. CO2 emissions embodied in international trade: Evidence for Spain. Energy Policy 2004, 32, 1999–2005. [Google Scholar] [CrossRef]
  17. Jiang, H. Implied carbon in trade between BRIC countries based on input-output modeling and structural decomposition. Resour. Sci. 2016, 38, 2326–2337. [Google Scholar]
  18. Machado, G.; Schaeffer, R.; Worrell, E. Energy and carbon embodied in the international trade of Brazil: An input–output approach. Ecol. Econ. 2001, 39, 409–424. [Google Scholar] [CrossRef]
  19. Makarov, I.A.; Sokolova, A.K. Carbon emissions embodied in Russia’s trade. FIW Working Paper. 2015. Available online: https://www.fiw.ac.at/fileadmin/Documents/Publikationen/Working_Paper/N_149_MakarovSokolova.pdf (accessed on 16 October 2019).
  20. Stefan, N.; Birgit, B.F.; Pablo, M.; Michaela, T.; Johanna, V. National Policies for Global Emission Reductions: Effectiveness of Carbon Emission Reductions in International Supply Chains. Ecol. Econ. 2019, 158, 146–157. [Google Scholar]
  21. Zhao, Z.; Yan, Y. Special issue: Climate change and global governance consumption-based carbon emissions and international carbon leakage: An analysis based on the WIOD. China Soc. Sci. (Engl.) 2014, 35, 174–186. [Google Scholar]
  22. Su, B.; Ang, B.W. Input–output analysis of CO2 emissions embodied in trade: Competitive versus non-competitive imports. Energy Policy 2013, 56, 83–87. [Google Scholar] [CrossRef]
  23. Wang, H.; Ang, B.W. Assessing the role of international trade in global CO2 emissions: An index decomposition analysis approach. Appl. Energy 2018, 218, 146–158. [Google Scholar] [CrossRef]
  24. Boitier, B. CO2 Emissions Production-Based Accounting vs. Consumption: Insights from the WIOD Databases. 2012. Available online: http://www.wiod.org/conferences/groningen/paper_Boitier.pdf (accessed on 16 October 2019).
  25. Peters, G.; Hertwich, E. CO2 embodied in international trade with implications for global climate policy. Environ. Sci. Technol. 2008, 42, 1401–1407. [Google Scholar] [CrossRef] [Green Version]
  26. Buchs, T.D. Financial crisis in the Russian Federation: Are the Russians learning to tango? Econ. Transit. 2010, 7, 687–715. [Google Scholar] [CrossRef]
  27. Du, H.; Guo, J.; Mao, G.; Smith, A.M.; Wang, X.; Wang, Y. CO2 emissions embodied in China–US trade: Input–output analysis based on the emergy/dollar ratio. Energy Policy 2011, 39, 5980–5987. [Google Scholar] [CrossRef]
  28. Lindner, S.; Guan, D. A Hybrid-Unit Energy Input-Output Model to Evaluate Embodied Energy and Life Cycle Emissions for China’s Economy. J. Ind. Ecol. 2014, 18, 201–211. [Google Scholar] [CrossRef]
  29. Ming, X.; Ran, L.; Crittenden, J.C.; Chen, Y. CO2 emissions embodied in China’s exports from 2002 to 2008: A structural decomposition analysis. Energy Policy 2011, 39, 7381–7388. [Google Scholar]
  30. Tian, J.; Liao, H.; Wang, C. Spatial–temporal variations of embodied carbon emission in global trade flows: 41 economies and 35 sectors. Nat. Hazards 2015, 78, 1–20. [Google Scholar] [CrossRef]
  31. Robinson, N. So What Changed? The 1998 Financial Crisis and Russia’s Economic and Political Development. Demokr. J. Post-Sov. Democr. 2007, 15, 245–259. [Google Scholar] [CrossRef]
  32. Yury, G. A Comparison between the Financial Crisis of 1998 and the Current Crisis in Russia; Social Science Electronic Publishing: Rochester, NY, USA, 2009. [Google Scholar]
  33. Natalya, P. Resource Efficiency Gains and Green Growth Perspectives in Russia; IEA: Paris, France, 2012. [Google Scholar]
  34. Cowan, W.N.; Chang, T.; Inglesi-Lotz, R.; Gupta, R. The nexus of electricity consumption, economic growth and CO2 emissions in the BRICS countries. Energy Policy 2014, 66, 359–368. [Google Scholar] [CrossRef] [Green Version]
  35. Anna, F.; Yuliya, A. Import and export of high-tech products in Russian manufacturing companies. Russ. J. Econ. 2019, 5, 199–210. [Google Scholar]
  36. Nekhoroshkov, V.P. Transport Supply of Trade and Economic Connections between Eastern Regions of Russia and APEC Countries. Reg. Reg. Stud. Russ. East. Eur. Cent. Asia 2013, 2, 23–51. [Google Scholar] [CrossRef]
  37. Pavlenko, V.I.; Glukhareva, E.K.; Kutsenko, S.Y. Development of Transport and Logistics Infrastructure in Russian Arctic; International Society of Offshore & Polar Engineers: Mountain View, CA, USA, 2014. [Google Scholar]
  38. Pao, H.T.; Yu, H.C.; Yang, Y.H. Modeling the CO2, emissions, energy use, and economic growth in Russia. Energy 2011, 36, 5094–5100. [Google Scholar] [CrossRef]
  39. Chen, X. Analysis of Russia’s Energy Strategy to 2030. Int. Pet. Econ. 2010, 10, 41–45, 56. [Google Scholar]
  40. IEA (International Energy Agency). Policies and Measures Databases: Energy Strategy of Russia to 2030. 2013. Available online: http://www.iea.org/policiesandmeasures/climatechange/?country=Russian%20Federation (accessed on 16 October 2019).
  41. BP. BP Energy Outlook: Country and Regional Insights-Russia. 2017. Available online: http://www.bp.com/en/global/corporate/energy-economics/energy-outlook/country-and-regional-insights/russia-insights.html (accessed on 16 October 2019).
  42. BP. Insights from the Evolving Transition Scenario-Russia. 2019. Available online: https://www.bp.com/en/global/corporate/energy-economics/energy-outlook/country-and-regional-insights/russia-insights.html (accessed on 16 October 2019).
  43. Arabatzis, G.; Kyriakopoulos, G.; Tsialis, P. Typology of regional units based on RES plants: The case of Greece. Renew. Sustain. Energy Rev. 2017, 78, 1424–1434. [Google Scholar] [CrossRef]
  44. Kyriakopoulos, G.L.; Arabatzis, G.; Tsialis, P.; Ioannou, K. Electricity consumption and RES plants in Greece: Typologies of regional units. Renew. Energy 2018, 127, 134–144. [Google Scholar] [CrossRef]
  45. Mi, Z.; Meng, J.; Green, F.; Coffman, D.M.; Guan, D. China’s “Exported Carbon” Peak: Patterns, Drivers, and Implications. Geophys. Res. Lett. 2018, 45, 4309–4318. [Google Scholar] [CrossRef] [Green Version]
Figure 1. Embodied CO2 emissions of Russia from 1995 to 2014.
Sustainability 12 00323 g001
Figure 2. Comparison between E X and I M of three main industries in Russia. Notes: The calculation is based on the Equations (10), (16), and (17). E X = E X 1 + E X 2 , and I M = I M 1 + I M 2 + I M 3 .
Sustainability 12 00323 g002
Figure 3. Carbon intensities of the GDP, the exports, the imports, and the net exports in Russia. Notes: C I represents carbon intensity with the unit of kg/USD. The calculation is based on Equations (20)–(23).
Sustainability 12 00323 g003
Table 1. The categories of embodied CO2 emissions in Russia.
Consumed DomesticallyConsumed Abroad
Produced DomesticallyPart I Part II
Produced AbroadPart IIIPart IV
Table 2. Summarization of variables and equations.
NotationDefinitionUnit
x It is a column vector of outputs. x i is the outputs of sector i .Million USD (US dollars)
y It is a column vector of final demands. y i is the final demands of sector i .Million USD
y m It is a column vector of the imports that are used as the final demands directly.Million USD
Z It is the intermediate input matrix. Z i j is the intermediate inputs that sector j required from sector i .Million USD
Z m It is the imported intermediate input matrix. Z i j m is the imported intermediate inputs that sector j required from sector i .Million USD
p It is a column vector of the exports. p i is the exports of sector i .Million USD
A = Z / x It is the consumption coefficient matrix of the intermediate inputs. A i j is the intermediate inputs that per unit final demand of sector i required from sector j .Million USD
A m = Z m / x It is the consumption coefficient matrix of the imported intermediate inputs. A i j m is the imported intermediate inputs that per unit final demand of sector i required from sector j .Million USD
C d It is a row vector of the sectors’ direct CO2 emissions sectors. C j d indicates direct CO2 emissions from sector j .MTC (million tons CO2 equivalent)
c d = C d / x It is a row vector of the sectors’ direct carbon intensity. c j d indicates direct CO2 emissions from per unit output of sector j .kg/USD
L = I A 1 It is a classical Leontief inverse matrix, and it demonstrates sectors’ complete consumption of the intermediate inputs.Million USD
E d = c d I A 1 It is a row vector of the sectors’ complete carbon intensity. E j d is complete CO2 emissions from per unit output of sector j .kg/USD
E m = E d A m I A 1 It is a row vector that shows the complete carbon intensities of using the imported intermediate inputs to produce the exports.kg/USD
F d = A m I A 1 y It is a column vector of the imported intermediate inputs that are consumed domestically to produce the final demands.Million USD
F e = A m I A 1 p It is a column vector of the imported intermediate inputs that are to produce the exports.Million USD
D 1 = E d y E d p + E m p It is the amount of CO2 emissions embodied in the products that are manufactured domestically and consumed domestically.MTC
D 2 = E m y E m p + E d y m It is the amount of CO2 emissions embodied in the products that are manufactured by the imported intermediate inputs and then are consumed domestically.MTC
I M 1 = E d y m I M 1 indicates embodied CO2 emissions from the imports that are consumed domestically as the final demands directlyMTC
I M 2 = E d F d I M 2 shows embodied CO2 emissions from the imported intermediate inputs that are to produce the domestic final demands.MTC
I M 3 = E d F e I M 3 demonstrates embodied CO2 emissions from the imports that are used as the intermediated inputs to produce the exports.MTC
E X 1 = E d p E m p It is embodied CO2 emissions from the exports that are produced from the domestic inputs.MTC
E X 2 = E m p It is embodied CO2 emissions of the exports that are produced by the imported intermediate inputs.MTC
Table 3. The calculation for four categories of embodied CO2 emissions embodied in Russia.
Consumed DomesticallyConsumed Abroad
Produced DomesticallyPart I D 1 Part II E X 1
Produced AbroadPart IIIIn the input form: I M 1 + I M 2 Part IVIn the input form: I M 3
In the output form: D 2 In the output form: E X 2
Table 4. Different between D C E and E C E of three main industries in Russia (MTC).
YearPrimary IndustrySecondary IndustryTertiary IndustryTotal
DCE-ECEDCE-ECEDCE-ECEDCE (or ECE)
1995−34.21478.62−444.411412.34
1997−38.4430.14−391.741297.33
1999−25.03375.21−350.181320.87
2001−21.83384.83−3631373.07
2003−29.16417.9−388.731439.99
2005−24.2439.9−415.71459.35
2007−23.48458.5−435.021524.86
2009−22.33466.48−444.151410.48
2011−30.38485.27−454.901604.72
2013−23.13452.47−426.421510.92
Notes: D C E is the quantity of direct CO2 emissions, and E C E is the amount of embodied CO2 emissions. The calculation is based on Equation (3). D C E is calculated by C d , and E C E is estimated by E d y . The difference between D C E and E C E is calculated by D C E minus E C E . The total of D C E (or E C E ) is the sum of CO2 emissions from three main industries in each year. The results are reported every two years during the study period from 1995 to 2014 in this table.
Table 5. Comparison between E E P and E E C three main industries in Russia (MTC).
YearPrimary IndustrySecondary IndustryTertiary IndustryTotal
EEPEECEEPEECEEPEECEEPEECEEC/EEP
199580.2489.43734.20616.19597.90547.311412.341252.9288.71%
199772.9682.17699.86579.70524.51488.051297.331149.9288.64%
199954.8063.47765.02444.44501.05397.371320.87905.2868.54%
200151.5760.48810.05541.26511.45436.441373.071038.1875.61%
200354.6967.36829.40583.44555.89481.031439.981131.8478.60%
200549.6262.16814.21596.26595.52501.841459.351160.2779.51%
200750.3462.71848.64699.87625.88542.741524.861305.3185.60%
200946.7162.40735.31638.49628.46544.071410.491244.9588.26%
201154.6074.64880.45753.97669.67582.171604.721410.7887.91%
201342.6764.01834.42700.24633.83585.291510.911349.5489.32%
Notes: E E P represents embodied CO2 emissions from the production side, and E E C indicates embodied CO2 emissions from the consumption side. E E C / E E P means the ratio of CO2 emissions embodied in the consumption to that embodied in the production. The calculation is based on the Equations (16)–(19). E E P = D 1 + E X 1 , and E E C = D 1 + D 2 . The results are reported in every two years during the study period from 1995 to 2014 in this table.
Table 6. Comparison between E E P E E C and E X I M of three main industries in Russia (MTC).
YearPrimary IndustrySecondary IndustryTertiary IndustryTotal
EEP–EECEX–IMEEP–EECEX–IMEEP–EECEX–IMEEP–EECEX–IM
1995−9.19−1.69118.0167.8650.5993.25159.41159.42
1997−9.21−1.54120.1671.8336.4677.11147.41147.4
1999−8.67−1.07320.58261.93103.68154.73415.59415.59
2001−8.91−1.02268.79200.6475.01135.27334.89334.89
2003−12.67−3.42245.96171.0174.86140.55308.15308.14
2005−12.54−8.09217.95154.8893.68152.29299.09299.08
2007−12.37−8.28148.7783.4183.14144.4219.54219.53
2009−15.69−14.6996.8247.5784.39132.66165.52165.54
2011−20.03−16.25126.4855.4987.51154.70193.94193.94
2013−21.34−18.19134.1857.1048.54122.46161.38161.38
Notes: The results are reported for every two years during the study period from 1995 to 2014 in this table. EX = export; IM = import.
Table 7. Top eight sectors of exporting embodied CO2 emissions yearly in Russia.
YearTop Eight Sectors
1995C2C12C23C9C13C20C8C17
27.24%26.50%16.62%7.75%3.55%3.49%2.97%1.93%
1997C2C12C23C9C20C13C8C17
32.64%25.30%14.86%6.89%4.34%3.50%2.25%1.60%
1999C2C12C23C9C13C20C8C17
30.16%22.39%16.21%6.63%6.01%4.82%2.49%2.33%
2001C2C12C23C9C20C13C8C17
37.05%18.10%15.35%7.36%4.59%4.37%2.95%1.98%
2003C2C12C23C9C8C20C13C17
35.62%18.56%16.02%7.21%4.54%4.45%3.57%1.87%
2005C2C12C23C9C8C20C13C17
32.79%19.15%17.97%6.56%6.10%5.50%2.57%2.01%
2007C2C12C23C8C20C9C13C17
30.83%19.92%18.08%6.75%6.25%6.19%2.40%1.96%
2009C2C23C12C9C8C20C13C17
30.37%18.64%17.73%7.23%6.94%6.53%2.57%1.82%
2011C2C23C12C8C9C20C17C13
28.76%17.03%16.60%9.71%9.39%6.41%2.26%1.61%
2013C2C23C12C8C9C20C13C17
31.89%16.85%16.45%9.17%7.55%5.79%2.21%1.72%
Notes: The proportions were sectors’ exporting embodied CO2 emissions of total exporting embodied CO2 emissions in each year. C2 is mining and quarrying sector; C8 is coke, refined petroleum, and nuclear fuel sector; C9 is chemicals and chemical products sector; C12 is basic metals and fabricated metal; C13 is machinery sector; C17 is electricity, gas, and water supply sector; C20 is wholesale trade and commission trade sector; and C23 is inland transport sector. The results are reported for every two years during the study period in this table.
Table 8. Top eight sectors of importing embodied CO2 emissions yearly in Russia.
YearTop Eight Sectors
1995C13C12C9C3C4C15C14C5
14.17%13.78%13.61%11.15%10.00%6.06%4.88%3.59%
1997C9C13C12C3C4C15C14C8
15.69%15.31%11.40%10.54%8.69%7.63%4.94%3.04%
1999C9C13C12C3C4C15C14C11
16.90%15.99%12.16%10.15%7.19%5.30%5.25%3.89%
2001C9C13C12C4C15C3C14C11
20.53%14.04%10.36%9.48%7.35%7.05%5.66%3.38%
2003C9C13C15C4C12C3C14C11
20.01%13.10%11.00%10.09%8.80%6.46%5.21%4.01%
2005C15C9C13C12C4C14C3C11
19.31%17.35%13.86%8.65%7.58%5.07%5.04%3.62%
2007C15C9C13C4C12C14C3C1
25.26%14.29%13.54%9.07%8.09%5.69%3.57%3.47%
2009C9C15C13C4C12C14C1C3
18.87%14.15%13.14%12.38%7.58%6.27%5.29%4.16%
2011C15C9C4C13C12C14C1C5
21.42%15.53%12.89%12.65%7.32%5.53%4.84%3.17%
2013C15C9C13C4C12C1C14C3
22.11%14.43%12.80%11.36%7.21%5.23%4.83%3.22%
Notes: The proportions were sectors’ importing embodied CO2 emissions of total importing embodied CO2 emissions in each year. C1 is agriculture, hunting, forestry, and fishing sector; C3 is food, beverages, and tobacco sector; C4 is textiles and textile products sector; C5 is leather, leather and footwear sector; C9 is chemicals and chemical products sector; C11 is other nonmetallic mineral sector; C12 is basic metals and fabricated metal sector; C13 is machinery sector; C14 is electrical and optical equipment sector; and C15 is transport equipment sector. The results are reported for every two years during the study period in this table.
Table 9. Top eight sectors of positive E E B yearly in Russia (MTC).
YearTop Eight Sectors
1995C2C12C23C20C8C17C26C21
121.0682.6471.5814.247.047.025.282.98
1997C2C12C23C20C17C21C26C25
127.2074.2755.3615.915.212.962.551.54
1999C2C12C23C20C17C8C21C26
211.49125.99107.7132.8114.7012.166.605.09
2001C2C23C12C20C8C17C21C26
244.1595.6388.0729.2012.5111.424.834.15
2003C2C23C12C20C8C17C26C21
240.15101.0995.4928.3825.3210.964.613.76
2005C2C23C12C8C20C17C21C26
208.58107.6594.2635.8632.8711.194.033.64
2007C2C23C12C8C20C17C21C26
178.2298.1087.4736.3434.389.904.113.48
2009C2C23C12C20C8C17C21C26
153.9788.7464.9431.2531.207.454.053.92
2011C2C23C12C8C20C17C25C26
178.7397.8772.2252.4937.2312.335.905.55
2013C2C23C12C8C20C17C25C26
184.9885.5265.8248.8728.608.633.782.94
Notes: E E B = E X I M . Positive E E B indicates that this sector is a net exporter of CO2 emissions. C2 is mining and quarrying sector; C8 is coke, refined petroleum, and nuclear fuel sector; C12 is basic metals and fabricated metal sector; C17 is electricity, gas, and water supply sector; C20 is wholesale trade and commissions trade sector; C21 is retail trade sector; C23 is inland transport sector; C26 is other supporting and auxiliary transport activities sector. The results are reported for every two years during the study period in this table.
Table 10. Top eight sectors of negative E E B yearly in Russia (MTC).
YearTop Eight Sectors
1995C3C4C13C15C14C5C9C18
−33.63−30.04−28.03−14.00−11.80−11.19−6.26−6.22
1997C3C13C4C15C9C14C11C5
−26.78−26.24−21.90−17.77−13.23−9.85−5.97−5.72
1999C3C4C15C11C14C13C18C9
−31.15−20.79−13.40−9.22−8.77−7.12−6.63−5.49
2001C4C3C9C15C13C14C11C5
−32.03−23.53−22.07−21.85−19.67−12.05−9.47−7.71
2003C4C15C9C13C3C14C11C5
−38.25−37.44−28.04−26.39−24.03−15.54−13.28−7.75
2005C15C13C4C9C3C14C11C1
−62.95−32.09−26.17−18.40−16.73−14.20−10.29−8.09
2007C15C13C4C14C9C3C5C1
−88.68−35.95−33.27−17.67−16.36−12.18−9.88−8.27
2009C15C4C13C9C14C1C3C5
−46.97−43.23−32.85−28.87−18.50−14.69−12.96−11.77
2011C15C4C13C14C1C5C3C11
−89.41−55.38−44.47−20.34−16.25−13.53−11.90−8.34
2013C15C4C13C1C9C14C3C5
−89.16−48.08−41.53−18.19−17.11−16.01−11.70−10.50
Notes: E E B = E X I M . Negative E E B indicates that this sector is a net importer of the CO2 emissions. C1 is agriculture, hunting, forestry, and fishing sector; C3 is food, beverages, and tobacco sector; C4 is textiles and textile products sector; C5 is leather, leather and footwear sector; C9 is chemicals and chemical products sector; C11 is other nonmetallic mineral sector; C13 is machinery sector; C14 is electrical and optical equipment sector; C15 is transport equipment sector; and C18 is construction sector. The results are reported every two years during the study period in this table.

