Article

Multi-Objective Evaluation of Airborne Self-Separation Procedure in Flow Corridors Based on TOPSIS and Entropy

1
College of Economics and Management, Nanjing University of Aeronautics and Astronautics, Nanjing 210016, China
2
College of Civil Aviation, Nanjing University of Aeronautics and Astronautics, Nanjing 210016, China
3
East China Air Traffic Management Bureau of Civil Aviation Administration of China, Shanghai 201702, China
*
Authors to whom correspondence should be addressed.
Sustainability 2020, 12(1), 322; https://doi.org/10.3390/su12010322
Submission received: 13 December 2019 / Revised: 22 December 2019 / Accepted: 23 December 2019 / Published: 31 December 2019
(This article belongs to the Section Sustainable Transportation)

Abstract

:
This paper proposes a simulation-based framework for assessing airborne self-separation procedures in flow corridors with consideration of different performance metrics, including air traffic operations, corridor capacity, safety, and environmental impacts. Firstly, the airborne self-separation concept in flow corridors is introduced, followed by an agent-based flow corridor simulation model. Then, data were collected to initialize a parallel-lane flow corridor model connecting A461 upper air route from Beijing to Guangzhou in China which can also simulate aircraft self-separating in the flow corridor. The total control delay, flow corridor throughput, breakout rate, and the CO2 emissions of traffic flow were considered as the impact measurements, and the TOPSIS and entropy method was used to rank the performances of different self-separation procedures. We found that combining multiple objectives into one, the optimum scheme can be obtained to guide the design of self-separation procedures for flow corridors. The research results can be used by airspace managers to dynamically develop appropriate operational procedures and rules for flow corridors given different operational conditions and constraints. Also, the framework proposed in the research may be used to evaluate the design of airspace structure with consideration of multiple objectives.

1. Introduction

Flow corridors concept is a long tube-shaped new airspace structure introduced within Next Generation Air Transportation System (NextGen). It is designed for reducing current air traffic complexity and restructuring the airspace to provide more capacity. The essence of flow corridors refers to bundles of near-parallel four-dimensional trajectory (4DT) assignments, which consequently achieve a very high traffic throughput, while allowing traffic to shift as necessary to enable more effective weather avoidance and reduce congestion [1,2]. Flow corridors integrate many similar prototype concepts such as high-volume tube-shaped sectors (HTS), highways-in-the-sky, tubes, and dynamic multi-track airways [3,4,5,6], three common and prominent characteristics of these concepts that would distinguish them from today’s airways are the multiple-parallel lanes design, self-separation operations, and dynamic activation rules [7]. With the anticipated flight demand increase in the future, flow corridors concept has become an important component of future air transportation systems.
Currently, the flow-corridors-related literature is mainly focused on the development of concept of operations, such as the geographical allocation, required equipage and capabilities, and performance and safety evaluation. Regarding the geometry and placement, several methods were proposed to design and improve the performance of flow corridors, including the jet routes-based method, weighted-proximity technique, traffic density-based method, Hough transform, etc. [8,9,10]. Aircraft flying in flow corridors should be equipped with advanced communications, navigation, and surveillance (CNS) equipment, and with the required CNS capabilities, the self-separation procedures with different maneuvers were suggested by many researchers [11,12,13,14,15,16]. For the performance and safety evaluation, studies have proved that if flow corridors can be created at appropriate times and locations, they would help accommodate higher density of traffic and provide reduced air-traffic-control workloads [17,18,19,20]. Also, with well-designed simulation and modeling methods, the system safety and the trade-off between capacity and collision risk were evaluated by some research [21,22,23].
Until now, however, a paucity of research has considered the comprehensive influences of traffic operations and environment. Moreover, no specific research studies or guidelines are available to determine which self-separation standard is more efficient than others concerning the trade-offs. As a matter of fact, the impacts of traffic operation and environment may account for a large proportion of the overall impacts of corridor usage. Besides, trade-offs may exist among different operational objectives. To achieve improvement for airborne self-separation in flow corridors, it is necessary to conduct a multi-objective assessment which combines different operational standards in multiple aspects, such as traffic operation, corridor capacity, traffic safety and the environment.
This paper aims to demonstrate how to conduct a multi-objective evaluation for airborne self-separation procedures by considering the operational, capacity, safety, and environmental impacts in flow corridors. More specifically, we conducted a simulation-based multi-objective evaluation for a flow corridor by using the TOPSIS and entropy method. The actual operational data were collected for the A461 RNAV route in China, which links Beijing nearby airports to Guangzhou nearby airports, and then a parallel-lane flow corridor for this high-altitude route was created by using the great circle trajectory.
With the simulation model, this study (a) evaluated the impacts of self-separated traffic flow on the total control delay, throughput, breakout rate, and CO2 emissions with Monte-Carlo simulation; and (b) evaluated the total performance of the traffic flow with alternative self-separating procedures, using the entropy evaluation method.
The paper is organized as follows. Section 2 explains the airborne self-separation concept in flow corridors considered and introduces an agent-based simulation model developed. Section 3 presents the data collected and the proposed methods for operational evaluation. Section 4 employs numerical test and results analysis. Section 5 summarizes conclusions and indicates next research steps.

2. Airborne Self-Separation in Flow Corridors

2.1. Description of Airborne Self-Separation in Flow Corridors

The airborne self-separation in flow corridors refers to the transfer of the responsibility of maintaining separation with other aircraft from air traffic controllers to the pilots of each aircraft in flow corridors. Different from the usual airborne self-separation concept for resolving complex encounter scenarios in crossing waypoints [24], the airborne self-separation in flow corridors mainly refers to aircrafts flying within multiple near-parallel lanes with appropriate separations and shifting over to other lanes for overtaking slower-moving aircrafts or resolving potential conflicts.
In [6], NASA proposed three airborne self-separation procedures for track configurations with spacing and passing capabilities that are aimed to enable aircrafts to fly more consistently at their optimal cruise speed. One of the promising procedures that permits aircrafts to switch and stay at the available lane is selected for multi-objective evaluation. In this procedure, aircrafts flying in flow corridors are much like the ground traffic moving in the highways. If an aircraft enters the flow corridor, it is responsible for self-separated with its leading aircraft by itself all the time. For safety and efficiency consideration, it may adjust its acceleration, velocity, and switch lane for overtaking and/or avoiding loss of the separation. Generally speaking, it is a procedure with more flexibility and efficiency, but it also comes with some potential risks if we cannot deal well with the self-separation procedures. Thus, we take this procedure as the starting point for our research.

2.2. Simulation Model of Self-Separation in Flow Corridors

To perform multi-objective evaluation for airborne self-separation procedures in flow corridors, simulation modeling is the best method which can capture various aircraft behaviors. An agent-based approach was proposed to develop a flow corridor simulation model with C++ language [16,17], in which each aircraft in the model is represented by an agent with both operational performance states and self-separation states. In this model, the flow corridor is designed with two closely parallel-lane structures located at the altitude of 35,000 ft. Aircrafts are assumed to fly in the same direction within different lanes in the flow corridor and will self-separate with others in the same lane by adjusting velocity and/or switching lanes. Some high-level description of the simulation model is illustrated as follows.
The aircraft dynamic model is adapted from Glover and Lygeros’ research [25], which includes three control variables and six key operational state variables. Aircraft thrust (T), bank angle (φ), and angle of attack (α) are set as control variables in along-track, across-track, and vertical dimensions, separately. The along-track position (x), true airspeed (v), across-track position (y), heading (ψ), altitude (z), and flight-path angle (γ) are six key state variables used to simulate aircraft flying in the flow corridor.
For capturing different self-separation behaviors, five self-separation states were also defined in the model, which are the target velocity flying state (TVF), velocity adjusting state (VA), lane-changing state (LCS), breakout state (BS), and locked state (LS). The VA and TVF state refer to states in which an aircraft is flying with varied speed or constant speed for self-separation from lead aircraft. LCS and BS refer to states that an aircraft switching lane or breakout from the flow corridor for efficient or safety consideration. The LS is an auxiliary state works with VA and TVF states to prevent simultaneous lane changes or breakouts. Some aircraft self-separation behavior examples within flow corridors are shown in Figure 1.
The key self-separation variables may influence the performance of airborne self-separation procedures include the initial traffic density, minimum separation, target velocity, target separation, lane-switch buffer, and velocity difference threshold. The initial traffic density refers to the interval arrival of aircraft in the flow corridor; the minimum separation is a distance-based interval standard between adjacent aircraft that no separation is allowed to be smaller than. Target velocity and target separation are two variables used for controlling the operational speed and density of traffic flows in the flow corridor. Lane-switch buffer and velocity difference threshold are important variables used for trigging flights to switch states. The main simulation procedures are as follows:
(1)
Build up the simulation framework and initialize parameters, including construction of the flow corridor model, aircraft model, atmosphere model, and initialization of simulation parameters. Parameters for flow corridor model include the number of lanes, corridor length, width, and altitude. Important parameters used for aircraft modeling are aircraft type, reference mass, cruising Mach number, flight envelope, engine thrust and aerodynamics coefficients, etc. Atmosphere model will provide wind speeds, the standard pressure, temperature, density, and the speed of sound on the altitude of flow corridor. Simulation parameters include the number of simulated flights, replication times, time-step, etc.
(2)
Run the simulation for one time-step, randomly generate and initialize aircraft agents and add them into flights’ queues for flow corridor. Each flight agent should include the identity flag, aircraft type, position, initial velocity, acceleration, separation, entry time, flight queue number, position in the queue, the identity flag of its front aircraft, etc.
(3)
Update self-separations states for each aircraft in flight queues in the flow corridor according to the self-separation states transition rules [16]. The main information used for determining self-separation states includes the basic operational performance states (position, velocity, acceleration, etc.), separation and velocity difference with lead flight, available space in the adjacent lane, previous self-separation states for relative flights.
(4)
Run the simulation clock for one more time-step and update flight operational performance states based on the proposed aircraft dynamic model. The key operational states updated include along-track position, across-track position, heading, velocity, acceleration, etc.
(5)
Update flight queues for flow corridor. Check the along-track and across-track positions to decide whether a flight has flown out flow corridor. If a flight has flown out the flow corridor, remove the flight from the flight queue and record. Similarly, check the flight interval arrival information to decide whether some new flights will be added into the flight queues.
(6)
Decide whether it should stop the simulation. If all flights have flown out the flow corridor, stop the simulation and perform statistical analysis, or else jump to step (3) to do iteration.
The proposed simulation model and procedures were checked and visually verified by Google Earth. However, the model does not consider the unknown failures of the equipment. For more details of the agent-based flow corridor simulation model, refer to [17].

3. Data and Methods

This section presents data and methods used for multi-objective evaluation of airborne self-separation procedures in the paper. Specifically, field data were collected first, followed by the introduction of impact measurements. Then, a multi-objective evaluation method, comprising TOPSIS and entropy, was used to compare the performances of different self-separation procedures.

3.1. Data Collection and Preprocess

To construct a practical flow corridor model for evaluation, field data were collected based on Chinese historical flight operational data in 2017. According the primary statistic results, the A461 upper route in China was selected as the basis for flow corridor modeling in this research. A461 is one of the busiest routes in China; it serves more than 200 flights per day and 486 million passengers in total.
Firstly, we created the route structure model based on the Aeronautical Information Publication (AIP) data. Currently, the A461 segment connecting Beijing to Guangzhou is about 970 nmi, including 21 important navigation/fix points, as shown in Figure 2a. We designed a parallel-lane flow corridor for this high-altitude route using the great circle trajectory between RENOB and ATAGA points, which are set as the entry and exit points separately. The configuration of the model is supposed to be using RNAV Q-routes with two closely parallel lanes at the FL350 (Flight Level 35,000 ft). The flow corridor is 940 nmi long in total with two 8 nmi width near-parallel lanes, as shown in Figure 2b.
Then, the flights flying from ZBAA (Beijing Capital International Airport), ZBNY (Beijing Nanyuan Airport), and ZBTJ (Tianjin Binhai International Airport) to ZGGG (Guangzhou Baiyun International Airport), ZGSZ (Shenzhen Bao’an International Airport), and ZGSD (Zhuhai Jinwan Airport) between 26 March and 28 October 28 2017 were selected for traffic-flow-features extraction. After preprocessing, 20,434 flights records were available for data analysis; important data fields include the departure airport, arrival airport, aircraft type, planned departure/arrival time, actual departure/arrival time, route segments, passing time, etc.
After preliminary analysis, we can see that A320, A332, A333, A388, B737, B772, B77W, and B787 are eight primary aircraft types, as shown in Table 1. The maximum amount of flights is B737, which comprises about 43% of the flights. A320 and A333 are two other aircraft types that are frequently used, and they account for 19% and 16%, separately. The mean and standard deviation of flying time for all flights in A461 were calculated and collected, and they were later used for model verified and validation. The average flying time ranges from about 122 to 131 min.
The statistics of aircraft types and their ratios are used as inputs for the proposed simulation model, the performance parameters of aircraft, including aircraft mass, Mach number, reference wing surface area, weight, thrust specific fuel flow, etc. are obtained from BADA (User Manual for the Base of Aircraft Data) database [26]. Another important input parameter is the interval arrival separation for the aircrafts in the flow corridor. We did a survey of the number of arrival flights per hour for A461 route, and the exponential distribution with mean of 81.76 nmi is fitted as the simulated function for random arrivals in our experiments. The initial values of other important parameters and variables are shown in Table 2.

3.2. Traffic Operational Metrics Used for Evaluation

The air traffic operational impact, corridor capacity, safety, and environmental impacts of different target separation standards were estimated. For a particular self-separation procedure, the total control delay was used to measure the operational impact of aircraft in the corridor. The corridor capacity was measured by using the average aircraft throughput per hour. The safety was measured by using the corridor breakout rate, while the aircraft CO2 emissions were considered as the environmental impact measure.

3.2.1. Impacts on Traffic Operation and Corridor Capacity

The total control delay was used to measure the operational impact of aircraft in the parallel-lane corridor. The control delay refers to the time difference between the nominal travel time and the practical travel time that results from different self-separation procedures. Note that different type of aircraft has different nominal travel time, which equals to the length of the corridor divided by the aircraft standard cruise velocity provided by BADA at the corridor altitude. Given the simulation information from the flow corridor model, the operational impacts associated with various self-separation procedures for aircraft were estimated by standard Monte Carlo simulation. The average control delay was measured as follows:
W ¯ d = 1 K j = 1 K [ 1 N | B j | i = 1 , i B j N ( t s i m , i , j L V C R , i ) ]
where W ¯ d [min] is the average control delay for the aircraft that passed the corridor; K is the simulation replications for the particular scenario. N is the number of the simulated aircraft for each replication; Bj is the set of breakout aircraft and |Bj| represents the breakout events happened in the j-th replication; L represents the flow corridor length; VCR,i [kt] represents the standard cruise velocity for aircraft i at the corridor altitude; tsim,i,j [min] represents the actual corridor travel time of aircraft i in the j-th replication. Similarly, the corridor capacity was measured using total passed aircraft divided by the total simulation time. The average capacity for the corridor was estimated as:
C ¯ = 1 K j = 1 K N | B j | Γ j
where C ¯ [aircraft/h] represents the average capacity for the corridor; Γj [h] represents the total simulation time in the j-th replication.

3.2.2. Impacts on Traffic Safety

The safety is measured by the breakout rate which represents the percentage that an aircraft has to break out from the flow corridor to avoid flying with the separation less than the minimum standard. In the simulation, the separations between adjacent aircrafts are calculated at each time step. With the updated performance data, each flight agent checks the potential loss of separation and resolves the conflict by changing its acceleration.
However, if the conflict cannot be resolved in time, and the current separation with the lead flight is already smaller than the minimum separation, it has to exit the corridor. Therefore, the safety metric may also refer to the lane-switch rate or potential conflict rate (sum of breakout rate and lane-switch rate). However, in the collision risk assessment, along with the impending near midair collision (NMAC), the breakout rate could further be used to estimate the overall rate of a collision rate [24], as shown in Equation (3). We decide to use the breakout rate as the metric.
C o l l i s i o n   r a t e   =   b r e a k o u t   r a t e × Pr   ( N M A C   |   b r e a k o u t   r a t e )   × Pr   ( c o l l i s i o n   |   N M A C ,   b r e a k o u t   r a t e )
In addition, this paper only focuses on the potential non-nominal self-separation events that occur in the corridor. We will not further estimate the potential collision rate. The average breakout rate P ¯ r for a particular target separation standard was estimated as follows:
P ¯ r = 1 K j = 1 K | B j | N

3.2.3. Impacts on Environment

The environmental performance was measured by using aircraft emissions, which are typically associated with the aircraft engines. The greenhouse gases are the primarily considered emissions at the higher altitudes for corridor (FL350), and the aircraft engines emissions are made up about 70% of CO2, a little less than 30% H2O, and less than 1% other compounds [27]. CO2 is considered as the environmental impact measure in the paper. Aircraft engine emissions are measured by emission indexes which have units of grams per kilogram of fuel consumed. The emission index of CO2 EICO2 used is 3155 grams/kilogram fuel [26]. In order to estimate aircraft CO2 emissions in the corridor, the fuel consumption was estimated first. For the jet engines, according to the Operations Performance File (OPF) of BADA, the thrust specific fuel consumption η [kg/(min·kN)] is specified as a function of the true airspeed, VTAS [kt]. The cruise fuel flow fcr [kg/min] is calculated by using the thrust specific fuel consumption, the thrust Thr [N], and the cruise fuel flow correction coefficient Cfcr as follows:
η = C f 1 × ( 1 + V T A S C f 2 )
f c r = η × T h r × C f c r
where Cf1 [kg/(min·kN)] is the 1st thrust specific fuel consumption coefficient; Cf2 [knots] is the 2nd thrust specific fuel consumption coefficient. The corridor simulation model could calculate the true airspeed and thrust for all the aircraft at any time interval in the corridor. The average CO2 emissions, E ¯ C O 2 [kg], were estimated as a function of the CO2 emission index EICO2, cruise fuel consumption and cruise time, as shown in Equation (7). Here, t represents the discrete time period; ∆t is the time-step and T is the last time period; fcr,i,t,j is the fuel flow of aircraft i in cruise phase at the simulation time t in the j-th replication.
E ¯ C O 2 = 1 K j = 1 K [ t = 1 T i = 1 , i B j N ( f c r , i , t , j × Δ t × E I C O 2 ) ]

3.3. Multi-Objective Evaluation Compared with the Ideal Solution

To evaluate the performance of different treatments of self-separation procedures, an ideal solution and a negative ideal solution are created as basis for comparison. The ideal solution has the best performance for each index among all alternatives, whereas the negative ideal solution has the worst performance for each index [28,29,30]. The relative closeness between each alternative and the ideal solution is calculated. The alternative with the shortest geometric distance comparing with the ideal solution, or with the largest geometric distance comparing with the negative ideal solution is regarded to have the best performance. Therefore, different alternatives can then be ranked. A key process of the multi-objective evaluation process is to determine the relative importance of different indexes, which is known as the weight. In this paper, the entropy method is used to determine the weight. It is regarded that the performance measure with greater dispersion may contain more information, thus have larger effects on the multi-objective evaluation results [31,32]. The larger the variation, the greater the weight is.
  • Step 1: Generate the evaluation matrix. Suppose that there are m scenarios to be evaluated (m equals ten for each case). Let aij indicate the performance evaluation value for the jth performance measure for the ith scenario (i = 1, 2, …, m, j = 1, 2, …, n); then, the evaluation matrix is illustrated as A = [aij]m × n.
  • Step 2: Normalize the performance measures. As the performance measures are in different units, i.e., the throughput is measured in aircraft/h, the potential conflict rate is measured in probability, the average delay is measured in minutes, and the average fuel consumption is measured in ton, these values are required to be normalized by transforming them into a dimensionless value. The standardization equation is written as:
    r i j = max { a i j | i = 1 , 2 , , m } a i j max { a i j | i = 1 , 2 , , m } min { a i j | i = 1 , 2 , , m }
    or
    r i j = a i j min { a i j | i = 1 , 2 , , m } max { a i j | i = 1 , 2 , , m } min { a i j | i = 1 , 2 , , m }
    where rij represents the jth performance value for the ith scenario after normalization, 0 ≤ rij ≤ 1. The evaluation matrix after normalization is written as R = [rij]m × n.
  • Step 3: Calculate the entropy of different indexes. Let Ej represent the entropy for the jth performance measure. The following equation can be used to calculate Ej:
    E j = k i = 1 m r i j ln r i j
    where 0 ≤ Ej ≤ 1; k is an adjustment factor, which can be estimated as 1/ln m.
  • Step 4: Determine the entropy weight ωj for the jth performance measure.
    ω j = ( 1 E j ) / j = 1 n ( 1 E j )
  • Step 5: Calculate the geometric distance between each alternative and the ideal alternative. Let R+ = {r1+, r2+, , rn+} represent the decision matrix for the ideal solution and R = {r1, r2, , rn} represent the decision matrix for the negative ideal solution, where rj+ = max{rij|I = 1, 2, …, m }, rj = min{rij|I = 1, 2, …, m }, j = 1, 2, …, n. We can calculate the distance from each performance measure to Di+ and Di as follows:
    D i + = j = 1 n ω j 2 ( r i j r j + ) 2
    D i = j = 1 n ω j 2 ( r i j r j ) 2
  • Step 6: Estimate the relative closeness Gi for the ith treatment to the ideal solution.
    G i = D i D i + D i +
The ith treatment can be closer to the ideal solution with the increase of the value of Gi.

4. Numerical Test

This section presents a case study for the established Beijing–Guangzhou flow corridor, which is arguably the busiest city-pair in China. According to the simulation model and the proposed TOPSIS and entropy methods, the comprehensive performance of airborne self-separation procedures were evaluated.

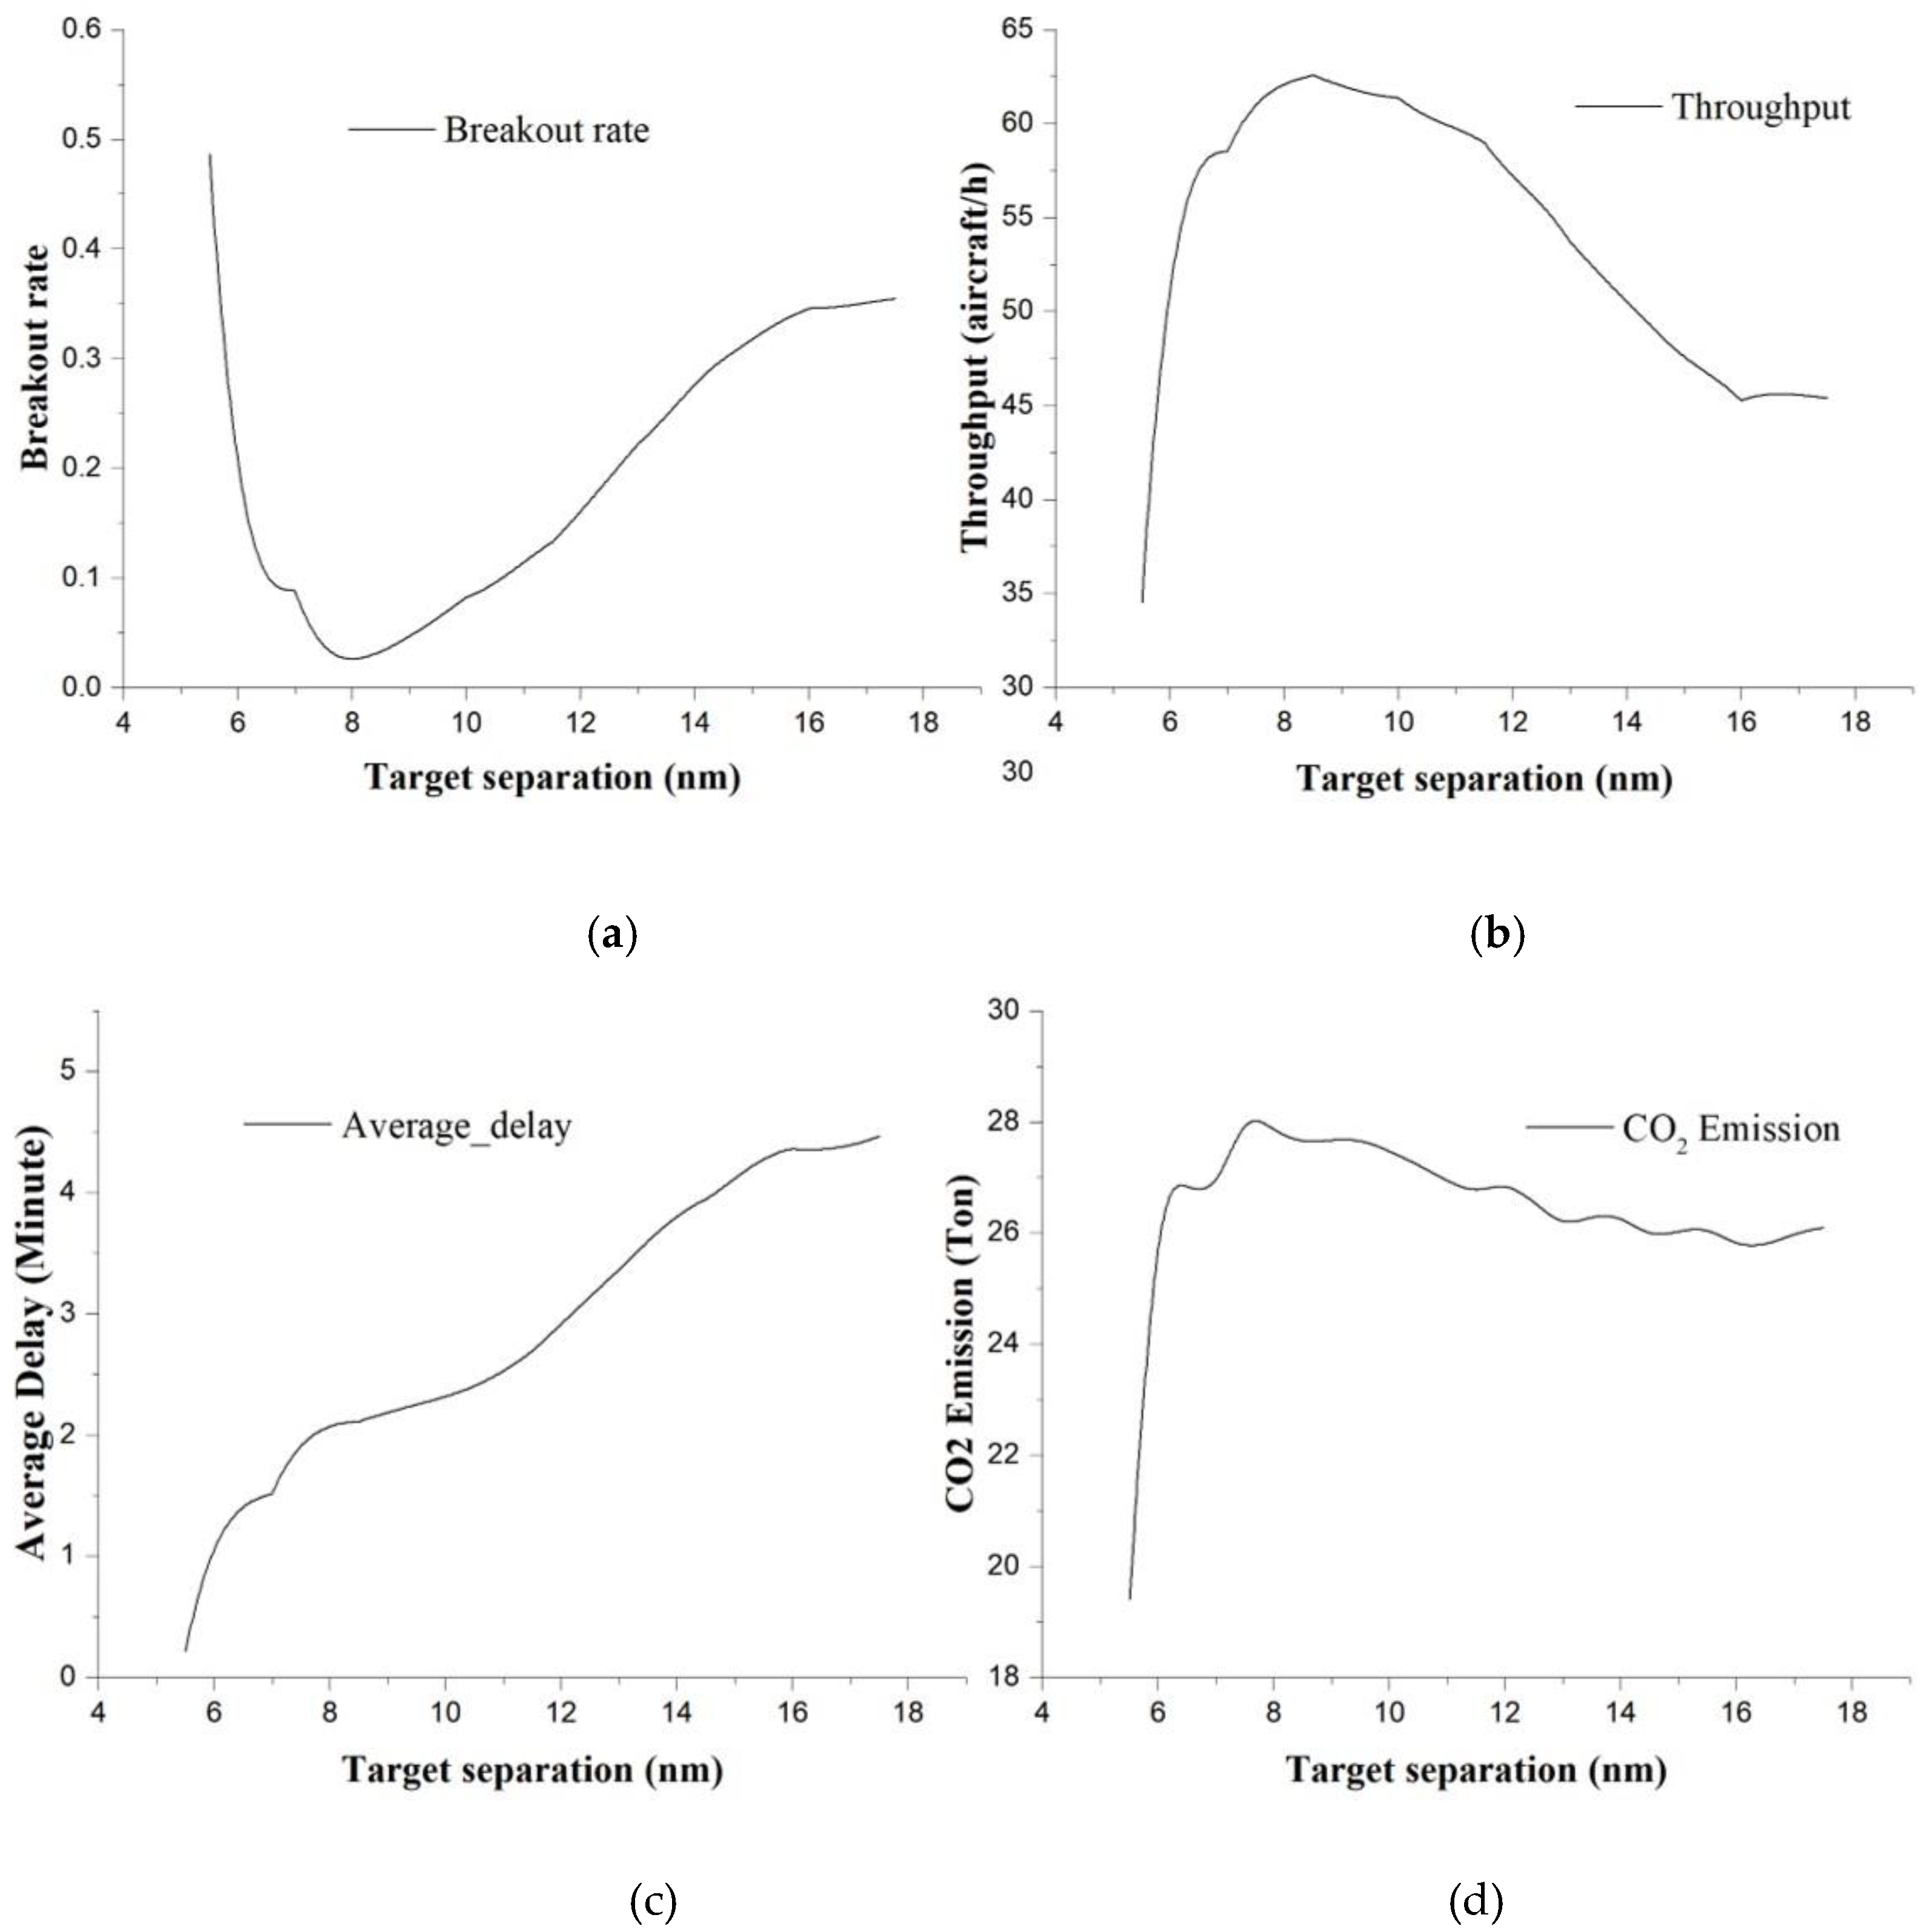
4.1. Results of Self-Separation Simulation in Flow Corridors

The simulation model was initialized by using Chinese domestic flights information of the A461 segment between Beijing and Guangzhou, and it was visually validated by the Google Earth software. To capture the performances of different traffic flow within flow corridors, firstly we simulated the airborne self-separation procedures with different traffic volume. For example, we increased the initial traffic density from 0.01 to 0.2 aircraft/nmi/lane based on the interval arrival of A461, and assuming that the minimum separation is set as 5 nmi, the target separation is set as 7 nmi, the lane-switch buffer is 1 nmi, the target velocity is 0.78 Mach, the distance threshold is 10 nmi, and the velocity difference threshold is 40 nmi. Figure 3 shows the simulation results. In general, with the increase of traffic density, the breakout rate curve shows a slight decrease and sharp increase trend, while the throughput, average delay, and CO2 emissions curves show some increase and decrease trends. Similarly, Figure 4 illustrates the metrics-changing trends with the increase of target separation. It is worth noting that the curves have different turning points and performance trade-off, and it is difficult to decide the best procedure with consideration of multi-objective.

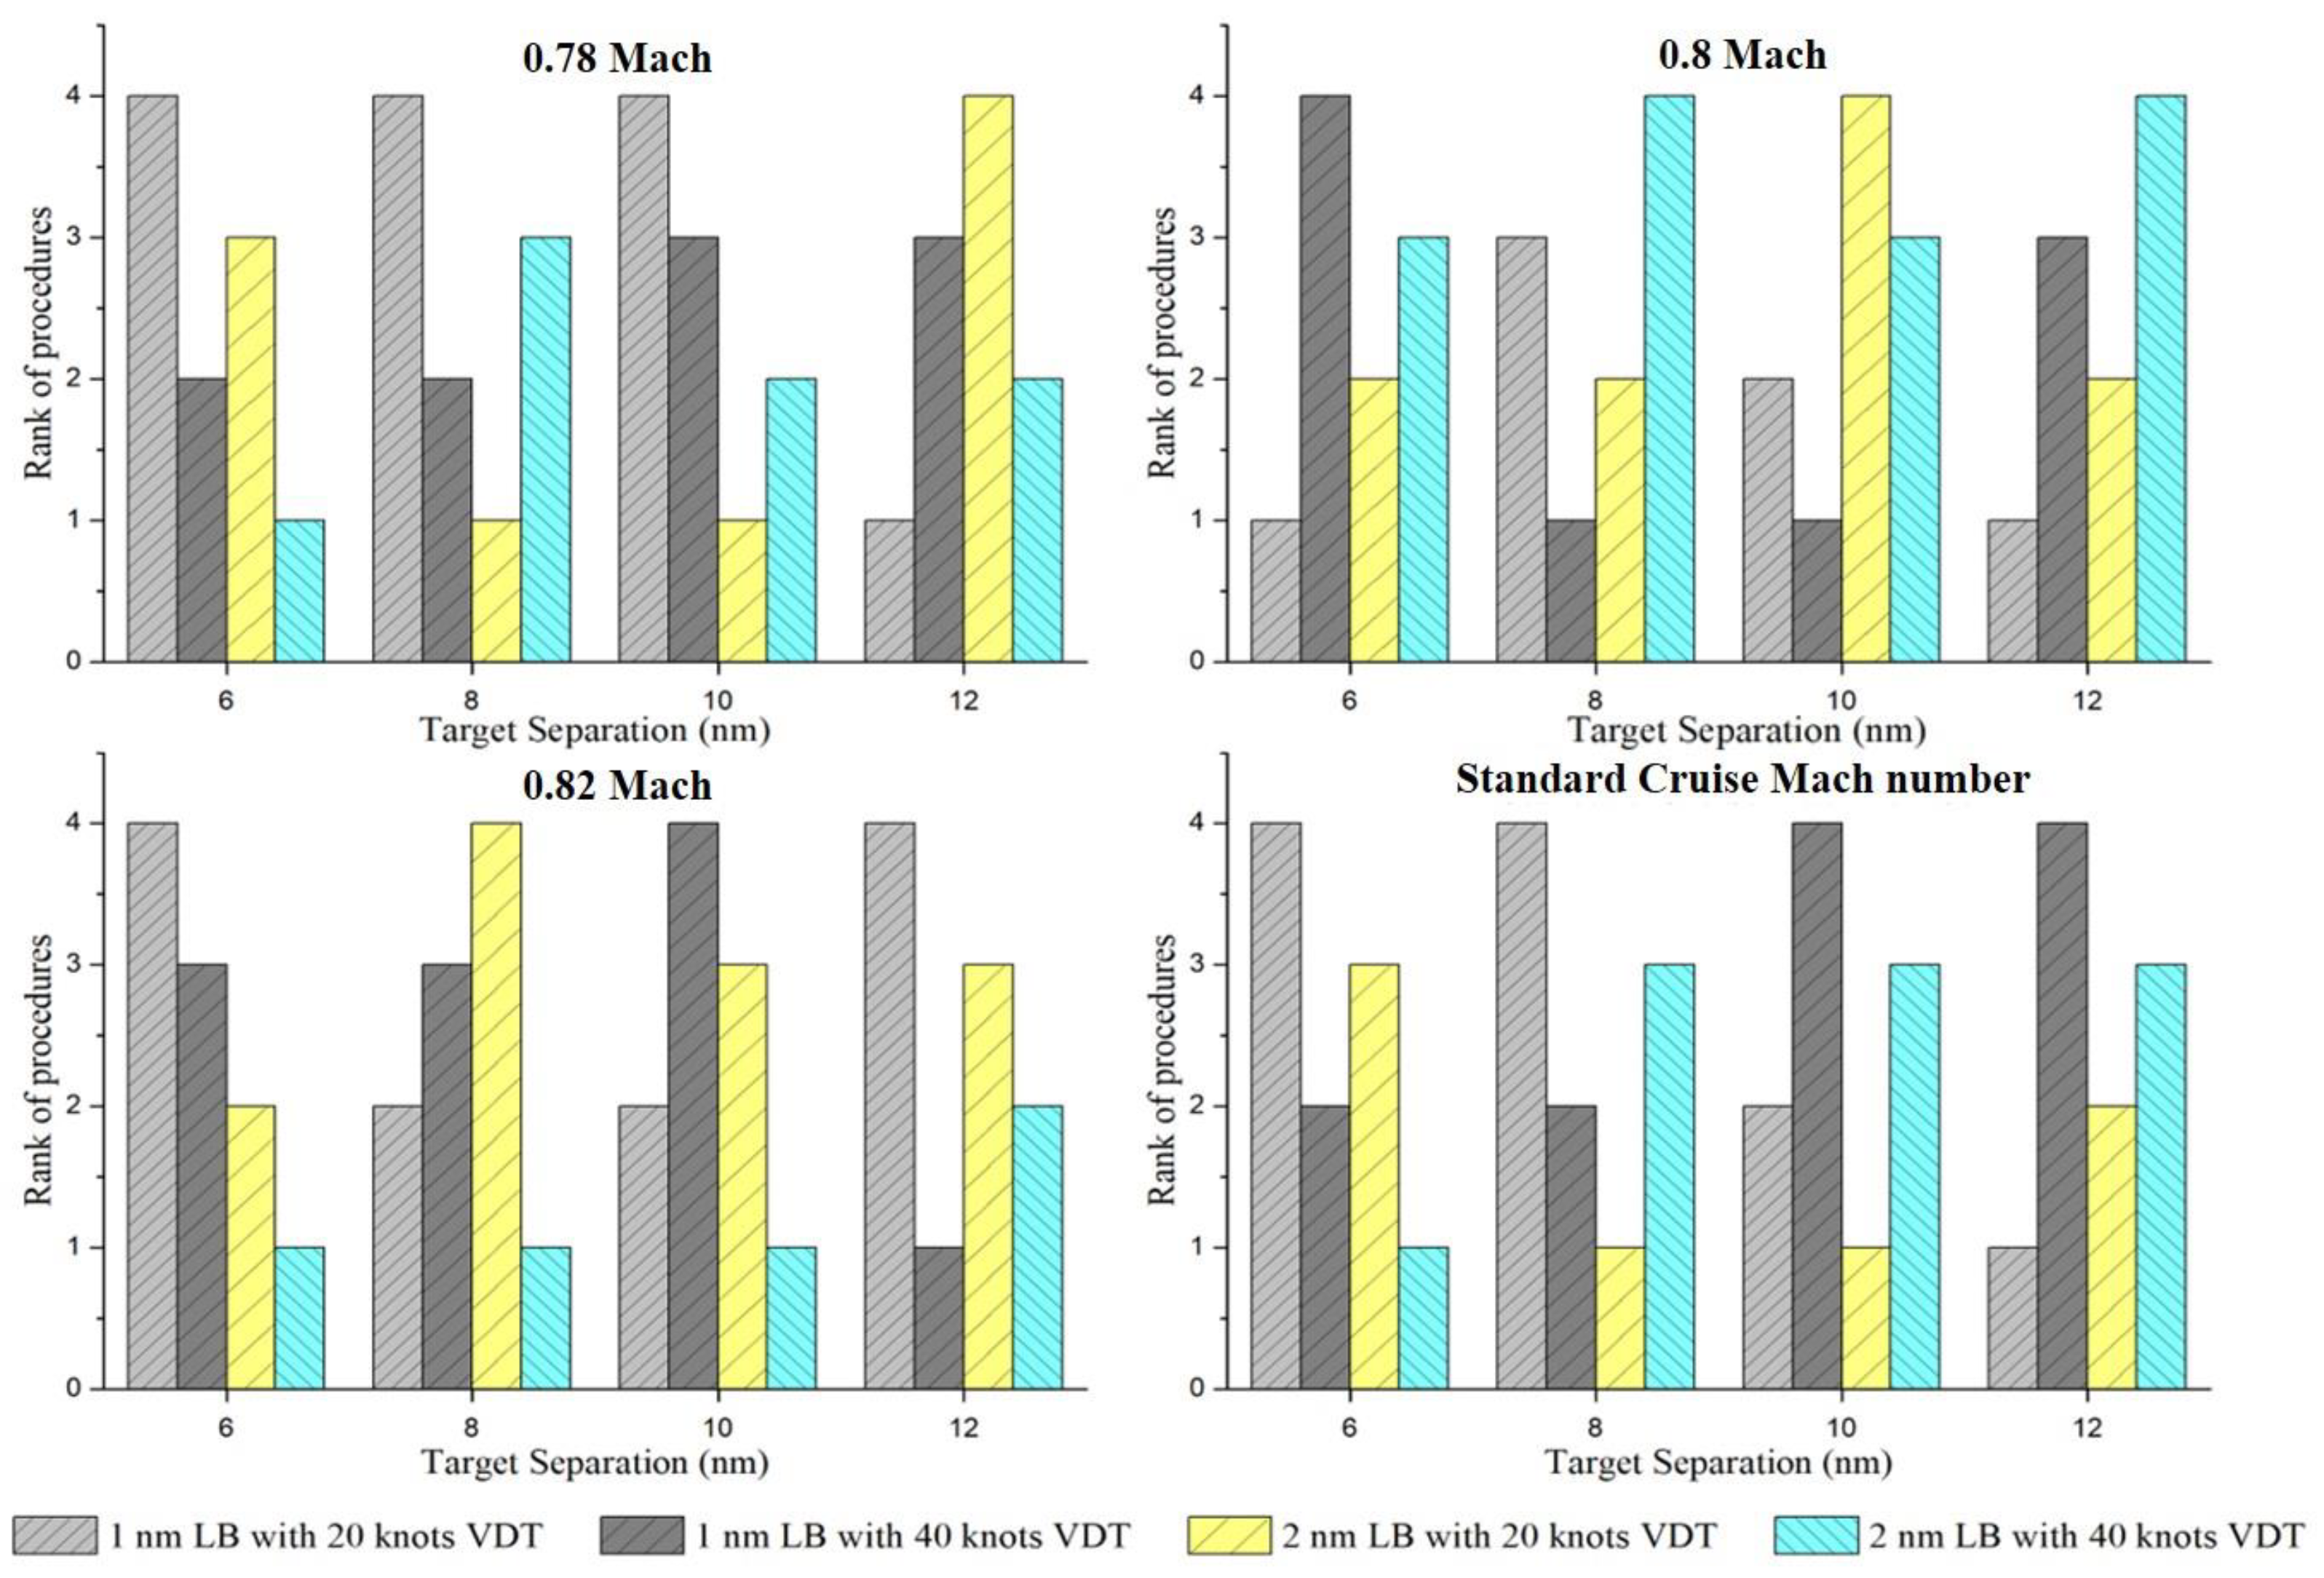
4.2. Multi-Objective Evaluation Based on TOPSIS and Entropy

Taking the TOPSIS and entropy methods discussed above, the self-separation procedures can be evaluated with different treatments. For example, assume that both the target velocity and target separation have two options, which implies four alternative procedure could be used for the flow corridor. The relative closeness for the four treatments of self-separation is shown in Table 3. The procedure with standard cruise Mach number as the target velocity and 6 nmi as the target separation would be considered the best choice if the decision had only been made based on the average delay performance. However, when other objectives were incorporated, the procedure with 0.78 Mach as the target velocity and 6 nmi as the target separation was superior to the other three treatments of self-separation procedure.
Moreover, a sensitivity analysis can be conducted to evaluate the impacts of alternative self-separation procedures in flow corridors with considering other self-separation parameters. Taking the lane-switch buffer and velocity difference threshold combination as example, we can assume that the target velocity ranged from 0.78 to 0.82 Mach, along with standard cruise Mach number, the target separation ranged from 6 to 12 nmi, and the traffic volume from 1X (statistical traffic demand, 81.76 aircraft/nmi/lane) to 4X (4 times traffic demand). Considering the lane-switch buffer (1 or 2 nmi) and the velocity difference threshold (20 or 40 knots), a total of 128 scenarios were considered, as shown in Table 4.
For the 1X traffic density based on the interval arrival of A461, the ranks of different treatments of self-separation procedures with different lane-switch buffer (LB) and velocity difference threshold (VDT) are provided in Figure 5. Different combinations of LB and VDT are represented with different types of bars. For the self-separation procedure with the target velocity of 0.78 Mach as an example, if the target separation is 8 nmi, the 1 nmi LB with 40 knots VDT (treatment 2) has the best comprehensive performance than others. If the target separation is 6, 10, or 12 nmi, the 1 nmi LB with 40 knots VDT (treatment 4) is superior to other treatments. In general, with different target velocities, the rank of treatments changes with the target separation, but the 2 nmi LB with 40 knots VDT (treatment 4) obtains a greater number of the best comprehensive performances than others.
Similar experiments were conducted for the 4X traffic density, as shown in Figure 6. For the self-separation procedure with the target velocity of 0.78 Mach, if the Target Separation is 6, the 1 nmi LB with 40 knots VDT (treatment 4) is still superior to other treatments. However, if the target separation is 8 or 10, the 2 nmi LB with 20 knots VDT (treatment 3) is now superior to other treatments. In addition, if the target separation is 12, the 1 nmi LB with 20 knots VDT (treatment 1) becomes the best comprehensive performance. In general, with different target velocity, the 2 nmi LB with 20 knots VDT (treatment 4) cannot obtain as many the best comprehensive performances as 1X traffic density.

5. Conclusions

This paper proposed a framework for multi-objective evaluation of airborne self-separation procedures in flow corridors, with consideration of the total control delay, flow corridor throughput, breakout rate, and the CO2 emissions of traffic flow. Through combining multiple objectives into one with the TOPSIS and entropy method, we may obtain the optimum scheme to guide the design of self-separation procedures for flow corridors. The research results can be used by airspace managers to dynamically develop appropriate operational procedures and rules for flow corridors given different operational conditions and constraints. Also, the framework proposed in the research may be used to evaluate the design of airspace structure with consideration of multiple objectives.
One limitation of the study is that all variables evaluated for self-separation procedures are discrete from a practical standpoint. To achieve more efficient operational procedures for flow corridors, we can extend the problem to a multi-objective continuous-state optimization problem. In addition, since the safety should be the top consideration, we would like to filter the procedures with unacceptable safety performance in the future. In addition, our analysis was based on the data obtained from proposed microscopic simulation model. Although the self-separation behaviors have been visually validated, it is assumed that all information can be obtained timely and accurately without any time-lag, pilot blunders, and/or wind prediction error. The simulation model can be further improved by incorporating more realistic and stochastic conditions.

Author Contributions

Conceptualization, B.Y.; Data curation, Y.D.; Formal analysis, L.W.; Methodology, Z.Y.; Writing—original draft, B.Y.; Writing—review & editing, Z.Y. All authors have read and agreed to the published version of the manuscript.

Funding

This research was funded by joint-sponsored by China Postdoctoral Science Foundation grant number [2018M632308] and the National Natural Science Foundation of China grant number [U1933119, 61671237,51608268].

Conflicts of Interest

The authors declare no conflict of interest.

References

  1. Federal Aviation Administration. Concept of Operations for the Next Generation Air Transportation System; Technical Report; Federal Aviation Administration: Washington, DC, USA, 2010. [Google Scholar]
  2. Federal Aviation Administration. NextGen Implementation Plan; FAA: Washington, DC, USA, 2017. [Google Scholar]
  3. Alipio, J.; Castro, P.; Kaing, H.; Shahid, N.; Sherzai, O.; Donohue, G.L.; Grundmann, K. Dynamic airspace super sectors (DASS) as high-density highways in the sky for a new US air traffic management system. In Proceedings of the IEEE Systems and Information Engineering Design Symposium, Charlottesville, VA, USA, 24–25 April 2003; pp. 57–66. [Google Scholar]
  4. Yousefi, A.; Donohue, G.L.; Sherry, L. High-volume tube-shape sectors (HTS): A network of high capacity ribbons connecting congested city pairs. In Proceedings of the 23rd Digital Avionics Systems Conference, Salt Lake City, UT, USA, 28 October 2004; pp. 3.C.1-1–3.C.1-7. [Google Scholar]
  5. Hering, H. Air Traffic Freeway System for Europe; EEC Report No. 20/05; Eurocontrol Experimental Centre: Brussels, Belgium, 2005. [Google Scholar]
  6. Wing, D.J.; Smith, J.C.; Ballin, M.G. Analysis of a Dynamic Multi-Track Airway Concept for Air Traffic Management; NASA/TP-2008-215323; Langley Research Center: Hampton, VA, USA, 2008. [Google Scholar]
  7. Yousefi, A.; Zadeh, A.N.; Tafazzoli, A. Dynamic allocation and benefit assessment of NextGen flow corridors. Transp. Res. Part C 2013, 33, 297–310. [Google Scholar] [CrossRef]
  8. Sridhar, B.; Grabbe, S.; Sheth, K.; Bilimoria, K.D. Initial study of tube networks for flexible airspace utilization. In Proceedings of the AIAA Guidance, Navigation, and Control Conference and Exhibit, Keystone, CO, USA, 21–24 August 2006; p. 6768. [Google Scholar]
  9. Kotecha, P.; Hwang, I. Optimization based tube network design for the next generation air transportation system. In Proceedings of the AIAA Guidance, Navigation, and Control Conference, Chicago, IL, USA, 10–13 August 2009; p. 5860. [Google Scholar]
  10. Sridhar, B.; Islam, T.; Gupta, G. Design and Simulation Methodology to Improve the Performance of Airspace Tube Networks. In Proceedings of the AIAA Guidance, Navigation, and Control Conference, Toronto, ON, Canada, 2–5 August 2010; p. 8288. [Google Scholar]
  11. Mundra, A.D.; Simons, E.M. Self-separation corridors. In Proceedings of the 2007 IEEE/AIAA 26th Digital Avionics Systems Conference, Dallas, TX, USA, 21–25 October 2007; pp. 3.C.3-1–3.C.3-11. [Google Scholar]
  12. Doble, N.; Hoffman, R.; Lee, P.; Mercer, J.; Gore, B.; Smith, N.; Lee, K. Current airspace configuration practices and their implications for future airspace concepts. In Proceedings of the 26th Congress of International Council of the Aeronautical Sciences (ICAS), Anchorage, AK, USA, 14–19 September 2008. [Google Scholar]
  13. Sheth, K.S.; Islam, T.S.; Kopardekar, P.H. Analysis of airspace tube structures. In Proceedings of the 2008 IEEE/AIAA 27th Digital Avionics Systems Conference, St. Paul, MN, USA, 26–30 October 2008; pp. 3.C.2-1–3.C.2-10. [Google Scholar]
  14. Belle, A.; Yousefi, A. Analysis of performance of Q routes for establishing future design criteria. In Proceedings of the Integrated Communications Navigation and Surveillance (ICNS) Conference, Herndon, VA, USA, 11–13 May 2010. [Google Scholar]
  15. Yousefi, A.; Lard, J.; Timmerman, J. Nextgen flow corridors initial design, procedures and display functionalities. In Proceedings of the 2010 IEEE/AIAA 29th Digital Avionics Systems Conference (DASC), Salt Lake City, UT, USA, 3–7 October 2010; pp. 4.D.1-1–4.D.1-19. [Google Scholar]
  16. Ye, B.; Hu, M.; Shortle, J. Collision risk-capacity tradeoff analysis of an en-route corridor model. Chin. J. Aeronaut. 2014, 27, 124–135. [Google Scholar] [CrossRef] [Green Version]
  17. Ye, B.; Shortle, J.; Ochieng, W.; Tian, Y. Sensitivity analysis of potential capacity and safety of flow corridor to self-separation parameters. Aeronaut. J. 2018, 123, 56–78. [Google Scholar] [CrossRef]
  18. Xue, M.; Kopardekar, P. High-capacity tube network design using the Hough transform. J. Guid. Control Dyn. 2009, 32, 788–795. [Google Scholar] [CrossRef]
  19. Hoffman, R.; Prete, J. Principles of airspace tube design for dynamic airspace configuration. In Proceedings of the 8th AIAA-ATIO Conference, AIAA-2008-8939, Anchorage, AK, USA, 14–19 September 2008. [Google Scholar]
  20. Xue, M.; Zelinski, S. Complexity Analysis of Traffic in Corridors-in-the-Sky. In Proceedings of the 10th Aviation Technology, Integration, and Operations Conference, AIAA-2010-9112, Fort Worth, TX, USA, 13–15 September 2010. [Google Scholar]
  21. Shortle, J.; Sherry, L.; Yousefi, A.; Xie, R. Safety and sensitivity analysis of the advanced airspace concept for NextGen. In Proceedings of the Integrated Communication, Navigation and Surveillance Conference, Herndon, VA, USA, 24–26 April 2012. [Google Scholar]
  22. Shortle, J.; Zhang, Y. Safety comparison of centralized and distributed aircraft separation assurance concepts. IEEE Trans. Reliab. 2014, 63, 259–269. [Google Scholar] [CrossRef]
  23. Zhang, Y.; Shortle, J.; Sherry, L. Methodology for collision risk assessment of an airspace flow corridor concept. Reliab. Eng. Syst. Saf. 2015, 142, 444–455. [Google Scholar] [CrossRef] [Green Version]
  24. Blom, A.P.H.; Bakker, G.J. Safety Evaluation of Advanced Self-Separation under Very High En Route Traffic Demand. J. Aerosp. Inf. Syst. 2015, 12, 413–427. [Google Scholar] [CrossRef]
  25. Glover, W.; Lygeros, J. A Multi-Aircraft Model for Conflict Detection and Resolution Algorithm Evaluation; Deliverable D1.3; Contract No.: IST-2001-32460 of European Commission; European Commission: Brussels, Belgium, 2004. [Google Scholar]
  26. European Organization for the Safety of Air Navigation, Eurocontrol Experimental Centre. User Manual for the Base of Aircraft Data (BADA); Revision 3.8; Report No.: EEC Note No. 11/06; European Organization for the Safety of Air Navigation, Eurocontrol Experimental Centre: Brussels, Belgium, 2011. [Google Scholar]
  27. Ashok, A.; Balakrishnan, H.; Barrett, S.R.H. Reducing the air quality and CO2 climate impacts of taxi and takeoff operations at airports. Transp. Res. Part D Transp. Environ. 2017, 54, 287–303. [Google Scholar] [CrossRef]
  28. Hwang, C.L.; Yoon, K. Multiple Attribute Decision Making: Methods and Applications; Springer: New York, NY, USA, 1981. [Google Scholar]
  29. Yoon, K.P. A reconciliation among discrete compromise solutions. J. Oper. Res. Soc. 1987, 38, 277–286. [Google Scholar] [CrossRef]
  30. Hwang, C.L.; Lai, Y.J.; Liu, T.Y. A new approach for multiple objective decision making. Comput. Oper. Res. 1993, 20, 889–899. [Google Scholar] [CrossRef]
  31. Huang, I.B.; Keisler, J.; Linkov, I. Multi-criteria decision analysis in environmental science: Ten years of applications and trends. Sci. Total Environ. 2011, 409, 3578–3594. [Google Scholar] [CrossRef]
  32. Yang, Z.; Liu, P.; Xun, X.; Xu, C.C. Multi-objective Evaluation of Midblock Crosswalks on Urban Streets Based on TOPSIS and Entropy Methods. Transp. Res. Rec. 2016, 2586, 59–71. [Google Scholar] [CrossRef]
Figure 1. Self-separation behavior examples.
Sustainability 12 00322 g001
Figure 2. Upper-air-route model linking Beijing to Guangzhou. (a) Current A461 upper route. (b) Great circle Parallel-lane flow corridor.
Sustainability 12 00322 g002
Figure 3. Multiple performance measures change with the traffic density. (a) Breakout rate (b) Throughput (c) Average delay (d) CO2 emission.
Sustainability 12 00322 g003
Figure 4. Multiple performance measures change with the target separation. (a) Breakout rate (b) Throughput (c) Average delay (d) CO2 emission.
Sustainability 12 00322 g004
Figure 5. Rank of different treatments of self-separation procedures for 1X traffic density.
Sustainability 12 00322 g005
Figure 6. Rank of different treatments of self-separation procedures for 4X traffic density.
Sustainability 12 00322 g006
Table 1. Aircraft-type and flying-time preliminary analysis.
Aircraft TypeFlight NumberRatioFlying Time (Min)
Mean ValueStandard Deviation
A320362619%131.848.86
A33210555%128.357.88
A333315616%129.088.52
A3884042%122.707.30
B737825743%131.088.61
B7724652%126.097.89
B77W10966%128.588.08
B78713387%122.517.87
Table 2. Example supply parameters.
ParametersValueParametersValue
Simulation times20 timesInterval arrivalExp (0.0122) nmi
Simulation time-step6 sMinimum separation5 nmi
Aircraft number20,000Separation buffer2 nmi
Time lag6 sLane-switch buffer 1 nmi
Corridor length940 nmiVelocity difference threshold40 nmi
Fleet mixRealistic proportionDistance threshold10 nmi
Table 3. Rank and relative closeness for four alternative self-separation procedures.
Self-Separation Variables and Metrics1234
Target velocity (Mach)0.780.78McrMcr
Target separation (nmi)6 nmi (1)10 nmi (5)6 nmi10 nmi
Throughput (aircraft/h)94.0180.9692.5681.46
Potential conflicts rate0.00360.25320.06010.2681
Average delay (min)1.541.781.101.48
Average fuel consumption (Ton)33.0630.5933.2131.40
Rank1342
Relative closeness0.60820.37100.59350.3156
Table 4. Scenarios considered when selecting optimum self-separation procedure.
FactorsScenarios Being Considered
Lane-switch buffer (nmi)1 nmi2 nmi
Velocity difference threshold (knots)20 knots40 knots
Target velocity (Mach)MCR0.780.80.82
Target separation (nmi)681012
Traffic density (aircraft/nmi/lane)1X4X

