Article

Industry-Specific and Macroeconomic Determinants of Non-Performing Loans: A Comparative Analysis of ARDL and VECM

by
Changjun Zheng
1,
Probir Kumar Bhowmik
1,* and
Niluthpaul Sarker
2
1
School of Management, Huazhong University of Science and Technology, Wuhan 430074, China
2
Department of Accounting and Information Systems, Jagannath University, Dhaka 1100, Bangladesh
*
Author to whom correspondence should be addressed.
Sustainability 2020, 12(1), 325; https://doi.org/10.3390/su12010325
Submission received: 15 December 2019 / Revised: 25 December 2019 / Accepted: 26 December 2019 / Published: 31 December 2019

Abstract

:
With the growth of an economy, the banking industry expands and the competitiveness becomes intense with the increased number of banks in the economy. The objective of this research was to discover the influence of industry-specific and macroeconomic determinants of non-performing loans (NPLs) in the entire banking system of Bangladesh. We performed an analysis for the period from 1979 to 2018 by an autoregressive distributed lag (ARDL) model and checked the robustness of the results in the vector error correction (VEC) model. The outcomes of this research suggest that both industry-specific and macroeconomic factors influence NPLs significantly. Among the industry-specific determinants, bank loan growth, net operating profit, and deposit rates negatively impact NPLs with statistical significance while bank liquidity and lending rates have a significant positive affiliation with NPLs. Gross domestic product (GDP) growth and unemployment, among the macroeconomic variables, have a negative connection with NPLs. Whereas, domestic credit and exchange rates have a significant positive association with NPLs. The contribution of this research is that the outcomes found by means of econometric models can be used for predicting and measuring NPLs in upcoming years, not only for Bangladesh but also for developing and emerging economies. Individual banks, as well as the banking sector, by and large, can get a guideline from this research.
JEL Classification:
C58; G21; E60

1. Introduction

Non-performing loans (NPLs) are a threat to sustainable development for developing countries. NPLs are considered as the major indicator of the financial stability of the banking sector. In developing economies, banks usually take greater risks to increase their market shares. With the chance of higher profit, risk increases, which ultimately results in non-performing loans [1]. NPLs have become a matter of concern for all countries in the world, and as a prerequisite to reinstate the functionality of financial markets, NPLs and its determinants should be addressed carefully [2]. Ex-post credit risk as an element of non-performing loans is one of the key features of the banking system and economic downturn [3,4]. Banks at risk of failing have significant proportions of NPLs in their portfolios of loans before collapse or financial distress [5].
Banks are intertwined and operate with other banks in a competitive industry. Hence, the bad performance of a bank can affect the entire sector and cause performance variability and create fear. Degraded loan quality creates threats of systemic risk, fear and causes drainage of deposits, a hindrance to financial intermediation, and finally, slows down the pace of economic growth and development. Non-performing loans play a crucial part in creating a poor performance of banks [6,7]. Banks are restrained from an intermediation role to the real economy and economic growth by NPLs [8,9]. NPLs have been termed “financial pollution” for their negative impacts on the economy [10,11]. If regulatory authorities implement any policy, the underlying determinants of NPLs should be taken care of first. As per Basel II, a loan unpaid for more than 90 days is considered as uncollectible.
After the global financial crunch of 2007 and 2008 followed by the share market scam in 2010 and 2011 in Bangladesh, the country faced financial turbulence in the economy, and the banking sector went through a transition time. Fifteen new banks have received licenses to operate in the economy in the last 10 years, and 11 banks in the last 5 years. At present, a total of 59 banks are operating in the economy. Hence, there is acute competitiveness in the industry.
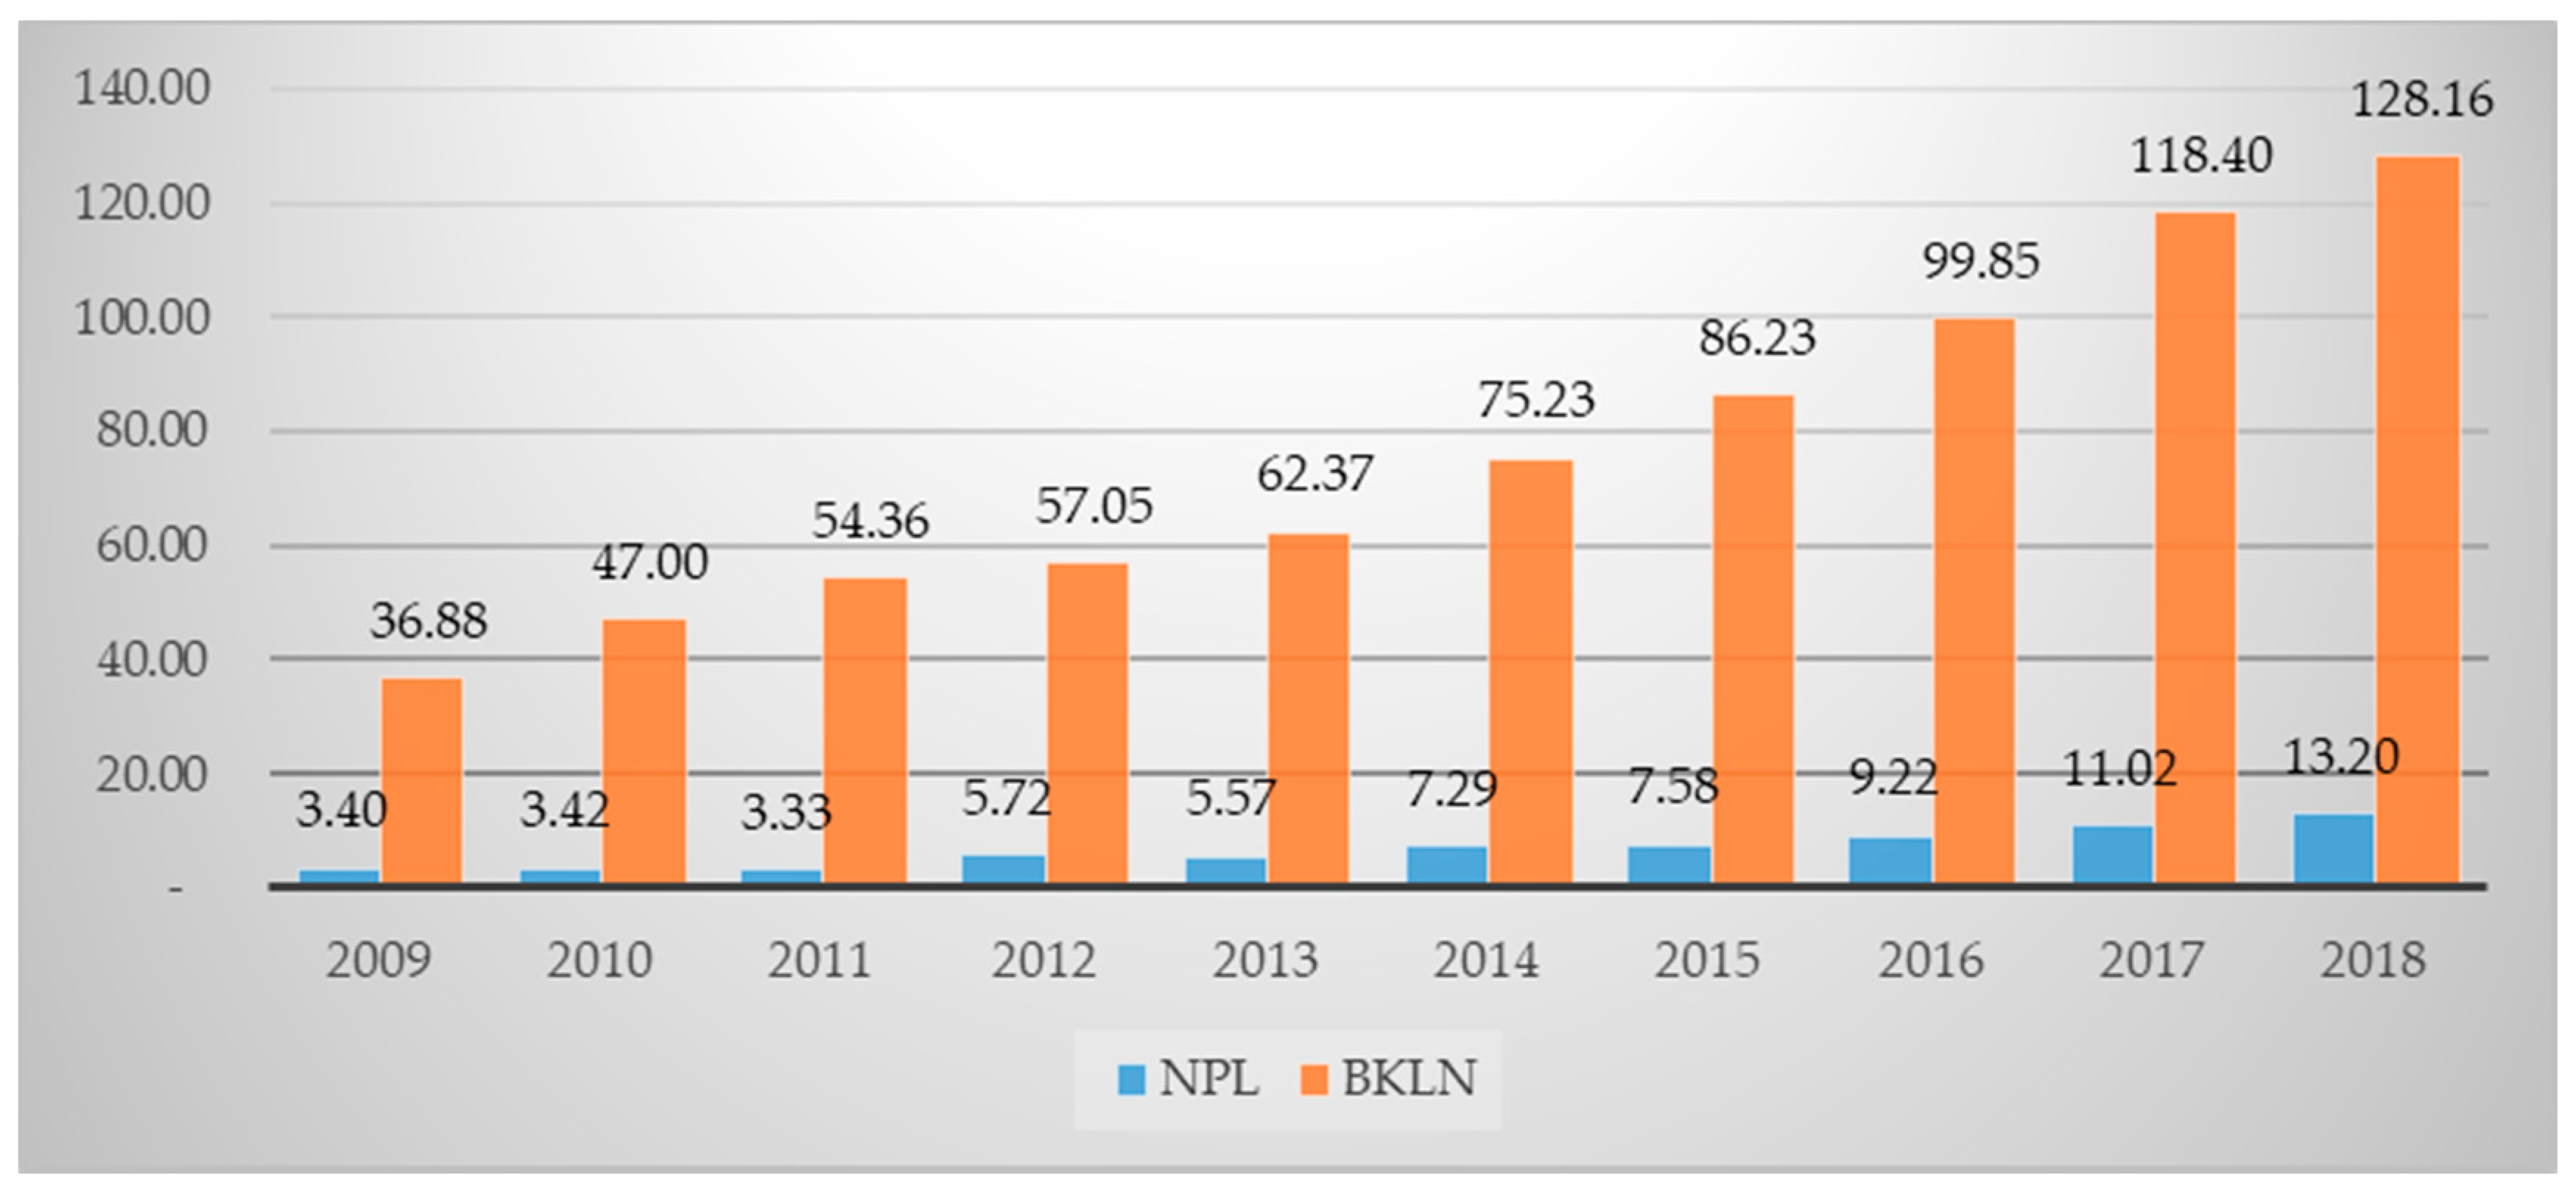
After 2010, non-performing loans started to increase rapidly (Figure 1). In 2011, they were 2.70 billion US dollars; in 2012, they were 5.09 billion US dollars, and in 2018, breaking all records, they soared up to 13.20 billion US dollars. For a developing country like Bangladesh, it is a matter of concern and a threat to sustainable development.
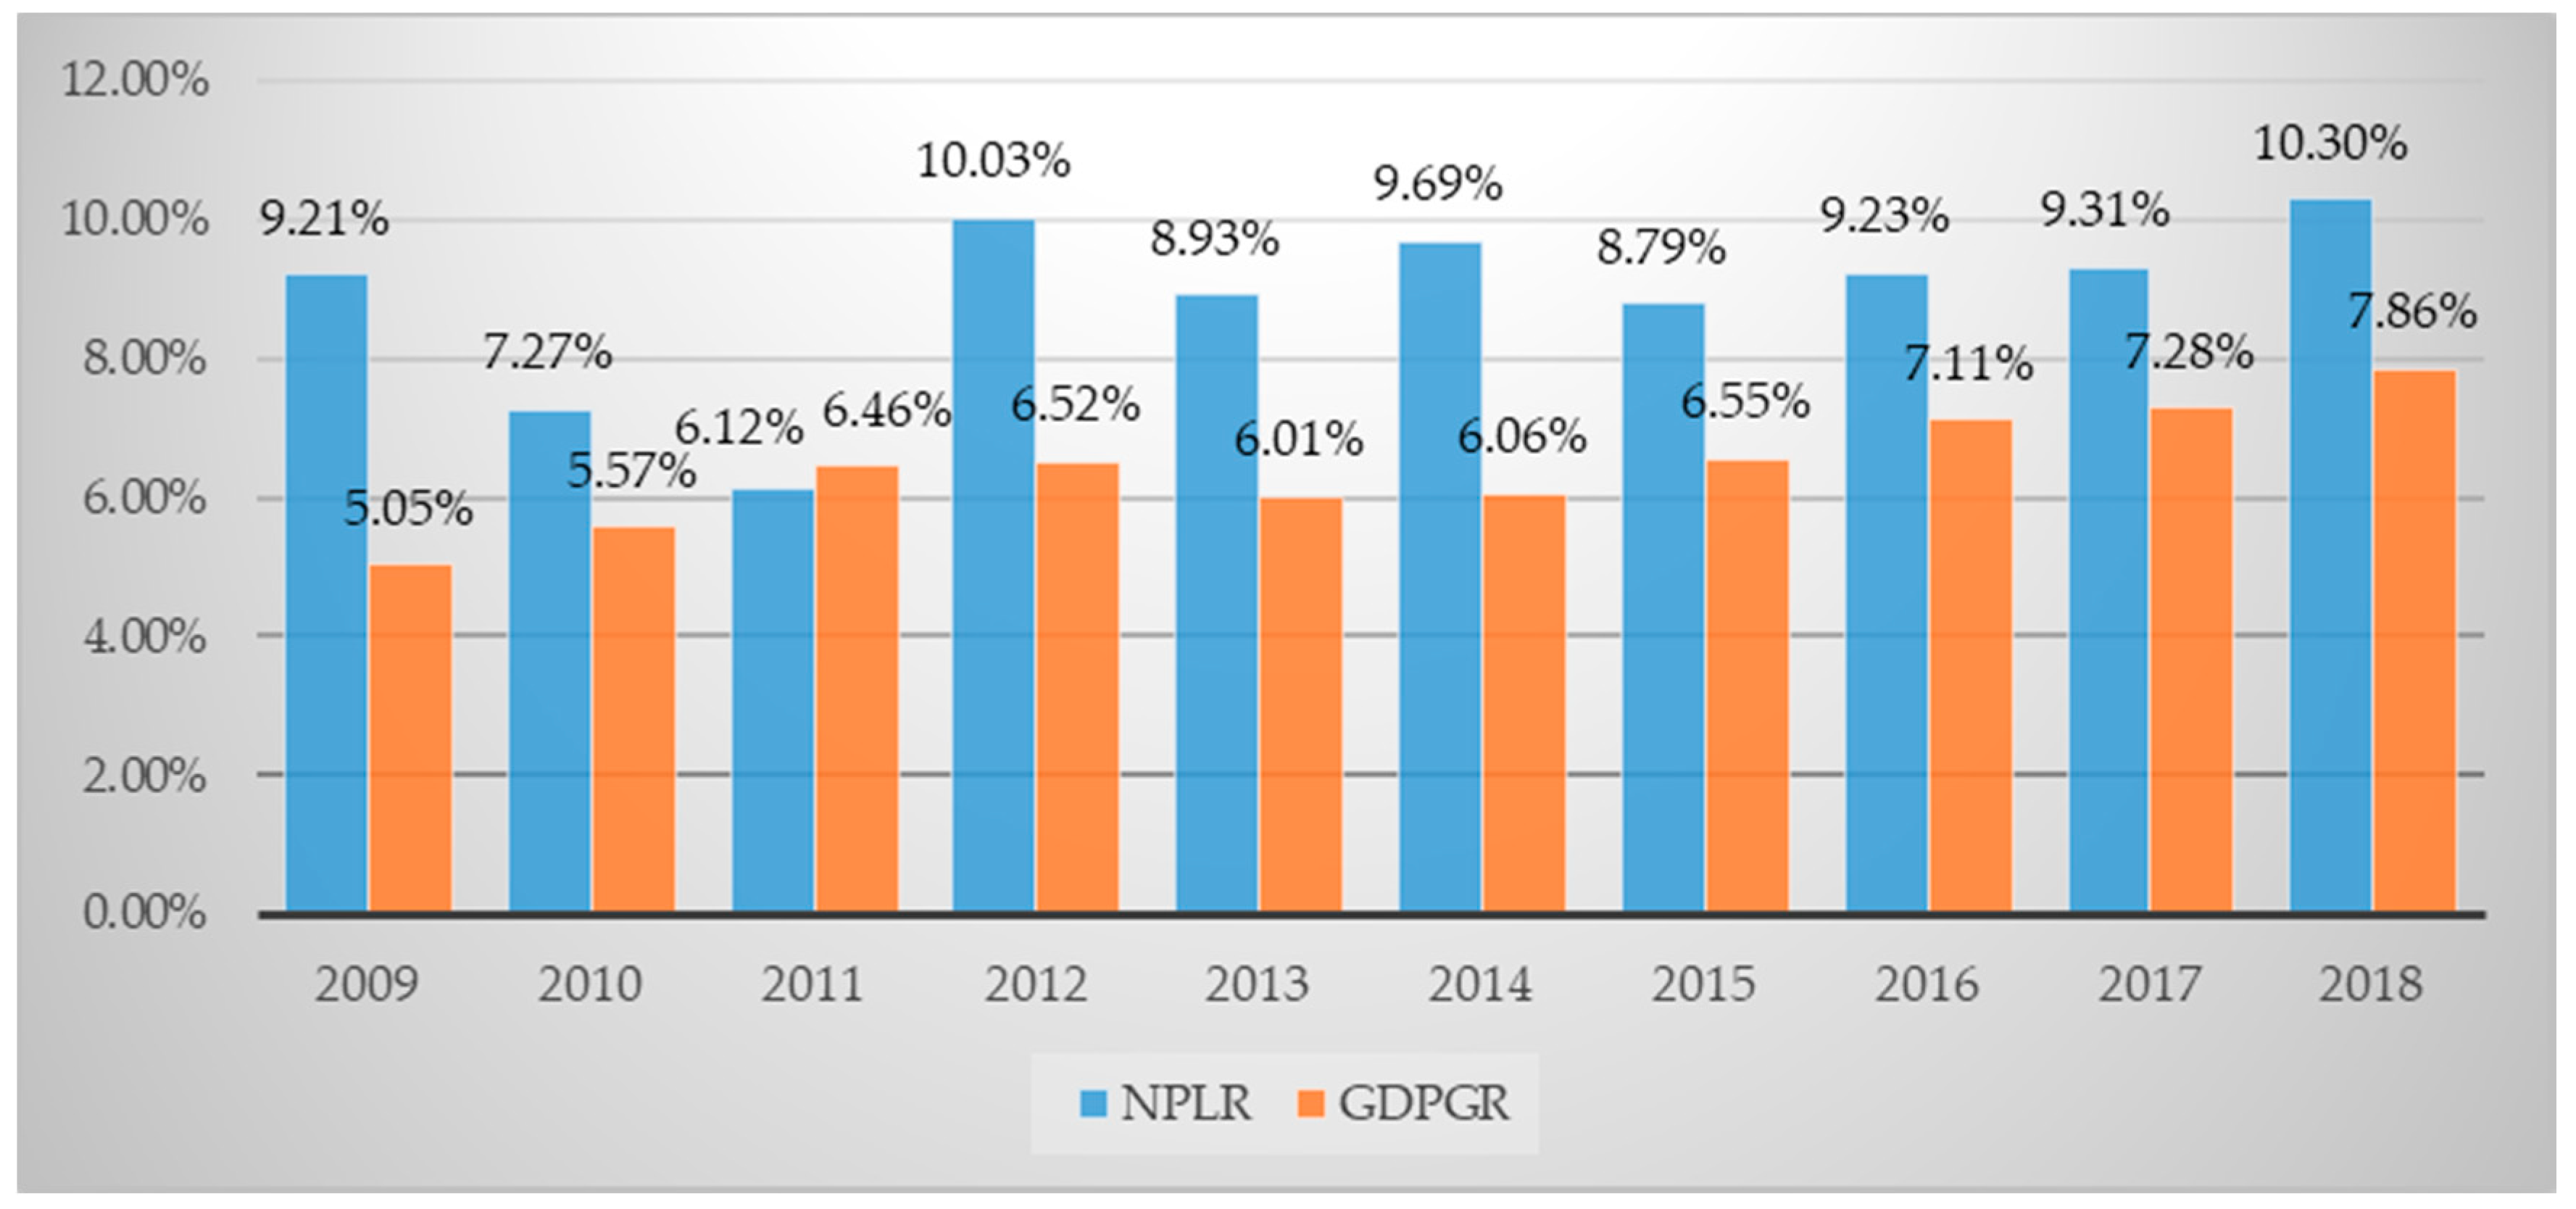
The Non-Performing Loan Ratio (NPLR) reached 40.65% in 1998, which is the highest ever in the history of Bangladesh. Although it gradually came down, this was not enough as it had been 10.30% in 2018 (Figure 2). Total banking sector NPLs were around 4% of the total GDP in 2018. This current research examines both industry-specific and macroeconomic components of NPLs of all 59 banks in the economy for the period from 1979 to 2018. In our study, we used data from the whole banking sector using a time series dataset with an annual frequency. This study can be considered as a reference to understand and measure the determinants of NPLs in Bangladesh and for developing countries like Bangladesh. To analyze our dataset, we first used the ARDL model and then by finding co-integration with the variables through the Johansen test of co-integration, we conducted a VEC model. Results found in both the models are analogous, indicating the robustness of the study. To know the stability of the models used in the study, we performed some diagnostic tests.

2. Theoretical Background

During our study, we went through many literary works to know the variables, models, and backgrounds on which research was conducted already. We found that factors of NPLs are broadly categorized into two major sources. The macroeconomic sources are GDP and inflation [2,12], unemployment [8], and real interest rates [13,14] and the industry-specific factors are management efficacy [4,15] and bank size [3,5], which may impact the ability to repay loans.
Researchers have found an affiliation between macroeconomic determinants and loan quality, which is a crucial yardstick of the banking sector’s health. Previous findings suggest that bad loans decrease with the expansion of the economy. Borrowers have enough income to repay on time. During economic growth, loans are likely to be approved irrespective of the creditworthiness of the customers while during the economic downturn, NPLs tend to increase (Messai and Jouini 2013). Keeton and Morris (1987) studied 2470 commercial banks in the US from 1979 to 1985, which suggested the regional economy and inferior performance of industries had been the key factors for in loan losses. Espinoza and Prasad [16] found relationships of NPLs with economic advancement, risk aversion, and interest rates. NPL used to increase when there is a decreasing trend in economic growth and an increase in risk aversion and interest rates. Louzis, Vouldis et al. [3] looked into types of loans, i.e., consumer, business, mortgage, etc., to find determinants impelling NPLs. They found that macroeconomic variables, such as gross domestic product, interest rates, unemployment, and public debts, can impact the growth of NPLs.
Skarica [17] found that prime sources of NPLs are the economic (GDP) downturn, lack of employment, and the rate of inflation. In a study in France and Germany, it was found that macroeconomic variables influence NPLs [18]. Researchers also found the French economy to be vulnerable to bank-specific factors compared to Germany. Economic expansion and unemployment is positively associated with the reduction of NPLs. Macroeconomic variables, including unemployment and economic development, significantly influence NPLs while industry-specific variables, such as management skill and risk preferences, have consequences on future NPLs [19].
As our quest for literature went on, we found a good number of industry-specific determinants impacting NPLs, i.e., profitability expressed as return on asset (ROA) or return on equity (ROE), capital size expressed as the capital adequacy ratio (CAR), and performance as managerial efficiency. Of these aspects, ROE and ROA have been used as variables to explain managerial efficiency. Weak credit monitoring and poor control over operating expenses led to decreased cost efficiency, which supports the bad management theorem [5]. The bad management theory is also found by [20] while applying NPL as technical efficiency. Shreds of evidence were found on the “too big to fail” syndrome in the US banking sector and it was also argued that an increase in income negatively impacts NPLs [21]. Cost efficiency also impacts NPLs. Poor management and moral hazards have been positively associated with variations in NPLs. Managerial efficiency as a proxy to ROA has negative connections with NPLs [22]. Podpiera and Weill [4] used cost efficiency to describe management quality to find an underlying relationship with NPLs. They performed Granger causality tests to show the unconditional connection of inefficiency to NPLs. Louzis, Vouldis et al. [3] using dynamic panel data found management quality along with GDP, unemployment, interest rate, and public debt are the determinants of NPLs. In a very recent study (2019) on the banking system structure of Bangladesh, Barun Kumar Dey [23] found that poor follow-up of loans after disbursement and lack of willingness to write off bad loans are the root causes that cause NPLs to increase. He also argued that NPLs limit lending capacity, the trickle-down effect of which slows down economic growth in the long run. Also, a high level of NPLs leads to higher requirements of loan loss provisioning, which in turn affects ROA and ROE and creates a threat for solvency and liquidity. Finally, NPLs change the nature risk preferences of the managers that leads to a higher cost of funds and less efficiency.
Vardar and Özgüler [24] found the presence of a steady and long-run affiliation between non-performing loans, macroeconomic variables, and bank-specific factors. Inflation and unemployment were found to be positively and significantly associated with NPLs. Bardhan and Mukherjee [25] found results supporting the ‘bad management hypothesis’ predicting negative future relationships with NPAs (non-performing assets). They used performance as a proxy for managerial efficiency. They also found capital adequacy ratio (CAR) requirements had an impact on the NPAs of banks. According to their research, large banks have more default rates compared to smaller ones.
Rajan, Bardhan, and Mukherjee [25,26] identified that future NPLs are related to past earnings and increases in profit can reduce NPLs. They also explained that managers could manipulate their power to alter credit policies to inflate current earnings, change the terms of the loan, and relax the conditions, which may lead to bad loans. Using the data of 129 Spanish banks from 1993 to 2003 García-Marco and Robles-Fernández [27] found that higher ROEs had been the key reason to boost risk and higher default rates. ROE has positive associations with elevated NPLs [28].
Changes in credit management policy, loan interest rates, fees, and commissions are also other determinants of NPLs. GDP and ROA have a negative impact while unemployment and interest rates have a positive impact on NPLs [14]. In a study in the United States, it was found that elevated interest rates and superfluous lending as internal aspects and economic conditions as external aspects have a significant positive connection to NPLs [29]. Structural differences between countries can create differences in the efficiency of banks as well [30].
Kjosevski [31] conducted sector-wise research and found NPLs of both the enterprise and household were negatively sensitive to profitability, loan growth, and better economic conditions while banks’ solvency and unemployment were positively correlated. The authors of [19] examined NPLs determinants in the Eurozone and, like past examinations, found bank-specific and macroeconomic elements had a remarkable impact clarifying variations in NPLs [32,33].
We found researches on Bangladesh covering a research period of 5 to 20 years. A synopsis is given in Table 1.

3. Research Objective, Methodology, and Data

3.1. Research Objective

The purpose of this study was to identify the significance of industry-specific and macroeconomic determinants of non-performing loans (NPLs) of the banking sector. We conducted our study on a developing country and compared the results in autoregressive distributed lag (ARDL) and vector error correction (VEC) model. The findings of this study will help to understand the underlying causes of NPLs in developing economies and help individual banks to take measures to sustain in the competitive industry.

3.2. Methodology

3.2.1. Model Specification

This paper suggests that NPLs in the economy of Bangladesh depend both on macroeconomic and industry-specific elements. We discuss the functional relationship of the determinants as follows:
N P L R t = f ( I S t , M E t )
where ‘ N P L R t ’ (non-performing loan ratio) is the dependent determinants of time t; ‘ I S t , ’ comprises the industry-specific determinants for time t; and ‘ M E t ’ contains the macroeconomic determinants causing the banking sector for time t.
To evade the hidden multi-collinearity problem, which can ascend from correlated independent variables, we made two different models. Log was used for all variables, and two regression models were developed as:
Model: 1
I n N P L R t = β 0 + β 1 ( I n G D P G R ) t + β 2 ( I n C P I ) t + β 3 ( I n D O C R ) t + β 4 ( I n U N E M ) t + β 5 ( I n E X R ) t + ε t
Model: 2
I n N P L R t = α 0 + α 1 ( I n B K L N ) t + α 2 ( I n L I Q ) t + α 3 ( I n N O P ) t + α 4 ( I n L D R ) t + α 5 ( I n D P R ) t + ε t
where “ I n ” indicates the logarithmic form of the variables under investigation. β 0 and α 0 are the coefficients of the constant. β 1 , β 2 , β 3 , β 4 , β 5 , α 1 , α 2 , α 3 , α 4 , and α 5 represent the partial coefficients of the independent variables. Lastly, ε t represents the stochastic term.

3.2.2. Unit Root Tests

We checked the unit root of the series used in this study using the ADF (Augmented Dickey-Fuller) and PP (Philip and Perron). The null hypothesis indicates that the series have a unit root, whereas the alternative hypothesis suggests stationarity. At ϕ = 1 , variables have a unit root, and at ϕ < 1 , it becomes stationary (Equation (4)). The regression for the ADF test is given below:
Δ Y t = Φ Y t 1 + i = 1 p α i Y t 1 + μ t .

3.2.3. ARDL (Autoregressive Distributed Lag) Model

An autoregressive distributed lag (ARDL) model is an ordinary least square (OLS) used for the time series dataset. ARDL is widely accepted for the co-integration of non-stationary variables corresponding to error-correction (EC) dynamics and it also finds a parametric equation in the EC form [50,51]. An important benefit related to the ARDL modeling approach is that it is useful regardless of regressors being (0) or I (1). Again, ARDL permits a large number of lags. Finally, it accepts the development of a dynamic error correction (EC) model that coordinates short-run elements with the long-run stability, thus losing no long-run data [52,53,54]. The following equation explains the ARDL model:
Δ Y t = β 0 + ( i 1 ) p β i Δ Y ( t i ) + ( i 1 ) p β j Δ X ( t 1 ) + λ 1 Y ( t 1 ) + λ 2 X ( t 1 ) + ε t

3.2.4. Co-Integration Test

As all series were stationary at the first differentiation I (1), Johansen co-integration analysis was used to persuade the convergence in the long run (Johansen and Juselius 1990). The Johansen test recommends the existence of co-integration for at least one co-integrating vector.

3.2.5. Vector Error Correction (Vec) Model

When there are co-integrations among the variables, VECM can be applied to find long-run equilibrium associations. Co-integration is confirmed by Johansen tests for co-integration. We developed the following models to assess the short-run and long-run coefficients of the variables:
Δ I n N P L R t = β 0 + ( i 1 ) n β 1 l n N P L R ( t j ) + β 2 ( Δ I n G D P G R ) ( t j ) + β 3 ( Δ I n C P I ) ( t j ) + β 4 ( Δ I n D O C R ) ( t j ) + β 5 ( Δ I n U N E M ) ( t j ) + β 6 ( Δ I n E X R ) ( t j ) + β 7 ε ( t 1 ) + µ t
Δ I n N P L R t = α 0 + ( i 1 ) n α 1 l n N P L R ( t j ) + α 2 ( Δ I n B K L N ) ( t j ) + α 3 ( Δ I n L I Q ) ( t j ) + α 4 ( Δ I n N O P ) ( t j ) + α 5 ( Δ I n L D R ) ( t j ) + α 6 ( Δ I n D P R ) ( t j ) + β 7 ε ( t 1 ) + µ t
The variation in the independent variables is demonstrated by ‘Δ’, and the error correction term is expressed by ‘ ε ( t 1 ) ’. β 1 and α 1 are the speed of adjustment by which short and long-run disequilibrium is adjusted. ‘ µ t ’ is the error term.

3.3. Data

Time series data were tested in this paper. We collected data from the Civil, Environmental, and Infrastructure Engineering (CEIE) databases, the World Development Indicators (WDI) databases, and the Bangladesh Bank (the central bank of Bangladesh) databases. We collected data for 40 years, from 1979 to 2018, of all 59 commercial banks for the last 40 years (Table 2).

4. Results and Discussion

4.1. Unit Root Test

Unit root tests (Table 3) for macroeconomic variables with ADF found two macroeconomic variables of lnGDPGR and lnEXR found to be stationary at the level I (0) while lnCPI, indoor, and lnUNEM became stationary at first differentiation as indicated by I (1) at the 5% level of confidence. On the other hand, in PP, only lnGDPGR was stationary at the level I (0); all other variables became stationary, except lnCPI, after first differentiation I (1) at a 5% confidence level. lnCPI became stationary at first differentiation I (1) with 10% at the confidence level. Unit root tests (Table 3) for industry-specific variables with ADF found two macroeconomic variables, lnNOP (at 10% confidence level) and lnDPR, to be stationary at the level I (0) while lnBNLN, lnLIQ, and lnLDR became stationary at first differentiation as indicated by I (1) at the 5% level of confidence. On the other hand, in PP, all the variables became stationary after first differentiation I (0).

4.2. ARDL Model

We constructed two different models to reduce the multi-collinearity problem among the variables. The co-integration relationship was examined among the determinants (i.e., analyzing the zero hypotheses (H0: λ = 1, λ = 2 … λn = 0). From the ARDL bounds test, it is apparent that (Table 4) the F statistics are 30.609 and 15.34 for the first and second models. The F values are significant, and in both models, the F statistics are greater than the upper limit. So, we reject the null hypothesis and agree that there are co-integrations among the determinants. Then, we used Akaike’s information criterion (AIC) criterion to choose optimal lag lengths for each model (Table 5). For macroeconomic variables, the AIC selects the ARDL (4,3,4,3,2,1) specification and for industry-specific variables (3,3,4,1,4,2). The reason for using AIC is that AIC provides a smaller standard deviation than the Schwarz information criterion (SIC) when running in a model (Pesaran & Pesraran, 1997). We tested both long-run associations and short-run dynamics (error correction model) in the ARDL model (Table 6 and Table 7). The coefficients were found to have multiple connotations between NPLs and macroeconomic and industry-specific variables.

4.2.1. ARDL Long-Run Results

Among the macroeconomic variables, the results identified that lnGDPGR has a significant negative effect on the lnNPLR, meaning that as the economy becomes stronger, bad lending decreases. If there is an increase of 1% in economic growth, non-performing loans will decrease by 1.40% in the long run in Bangladesh.
lnCPI also has a negative relationship with lnNPLR, but in this case, the relationship is insignificant in the long run. Domestic credit growth (lnDOCR) and exchange rates (lnEXR) both have significant positive relationships with the bad loan ratio (lnNPLR) while unemployment (lnUNEM) in the country has a significant negative relation with increasing bad loans. With every 1% increase in both the domestic credit and exchange rates, there is a 1.07% and 3.76% increase in non-performing loans, respectively. Surprisingly, with the decrease of non-performing loans by 7.64%, there is a 1% increase in unemployment.
The long-run results of industry-specific variables show that bank loan growth (lnBKLN) has a negative association with the non-performing loan ratio (lnNPLR). Net operating profit (lnNOP) and deposit rates (lnDPR) also have the same impact over non-performing loans with significant p values, which means that with the growth of bank lending by 0.52%, there will be a decrease of 1% bad loan, which indicates healthy behavior by the banking sector. NPL reduces bank profitability by 0.02% when it increases by 1%, and also a 1% increase in lnNPLR reduces the capacity of the banks to provide depositors good returns, which is 0.76%. Finally, a 1% increase in lending rates (lnLDR) and liquidity (lnLIQ) increase non-performing loans by 3.79% and 2.67%, respectively.
In both models, the R2, and the adjusted R2 were remarkably good. The R2 and the adjusted R2 for macroeconomic variables are 0.9618 and 0.8971, respectively, while for industry-specific variables, it is 0.9338 and 0.8219, respectively, meaning the models fit quite well, which means that the models can explain 96.18% and 93.38% of the changes in non-performing loans.

4.2.2. ARDL Short-Run Results

The short-run outcomes suggest the growth of GDP has a significant positive influence on lnNPLR. Meaning that if there is a growth of 1% in GDP in Bangladesh, the non-performing loans of banks will rise by 0.36%. Then, only lnUNEM has a significant positive relation with NPLR. A 1% increase in unemployment will cause a 2.45% decrease in bad loans in the short run. The other three variables, lnCPI, lnDOCR, and lnEXR, affect lnNPLR negatively, with lnDOCR being the only insignificant variable. To be specific, a 1% increase in all these variables can cause a 5.01%, 0.27%, and 0.88% decrease consecutively in lnNPLR.
The short-run results of industry-specific variables show that bank loan growth (lnBKLN) has an insignificant positive relationship with non-performing loans (lnNPLR). Net operating profit (lnNOP) and deposit rates (lnDPR) also have the same impact over non-performing loans, which is statistically significant, while liquidity (lnLIQ) and lending rates (lnLDR) were found to have a statistically significant negative connection with non-performing loans.

4.3. Co-Integration Test

We found four co-integration relationships in the first model and for the second model, we found two co-integrating connections. We considered trace statistics to figure out the co-integrating equations at a the 5% level of significance. The existence of more than one co-integrating equation indicates a long-run convergence of the two models (Table 8).

4.4. Vector Error Correction (Vec) Model Results

The VECM was applied to assess the long-run and short-run coefficients (Table 9). We found two lag periods for macroeconomic variables and four lag periods for industry-specific variables using the Schwarz information criterion. We selected the lag length of SIC criterions as it gives better results than AIC criterions. We then calculated the long and short-run coefficients, putting lag length outcomes in the VECM.
The first model states that lnNPLR converges to long-run equilibrium with a 25.58% speed of adjustment every year by the influence of the variables, lnGDPGR, lnCPI, lnDOCR, lnUNEM, and lnEXR. The second model suggests an 18.85% speed of adjustment in lnNPLR by the influence of lnBKLN, lnLIQ, lnNOP, lnLDR, and lnDPR. The results from both the models recommend that long-run adjustment in the independent variables has substantial influence compared to short-run variables on NPLR. The long-run equations are explained in the following manner:
Model 1:
I n N P L R t = β 0 0.4780902 ( I n G D P G R ) t 0.1832198 ( I n C P I ) t + 0.5250594 ( I n D O C R ) t 6.997589 ( I n U N E M ) t + 3.293177 ( I n E X R ) t + ε t
Model 2:
I n N P L R t = α 0 0.3681242 ( I n B K L N ) t + 0.424397 ( I n L I Q ) t 0.0602165 ( I n N O P ) t + 4.923853 ( I n L D R ) t 2.718319 ( I n D P R ) t + ε t
Model 1: In the case of macroeconomic variables, when lnGDPGR has a negative movement by 1%, non-performing loans lnNPLR will rise by 0.4780902%. lnCPI and lnUNEM have the same negative relationship as lnGDPGR, with 0.1832198% and 6.997589%, respectively. Meanwhile, domestic credit lnDOCR and exchange rates lnEXR, if appreciated by 1%, will cause an escalation in non-performing loans (lnNPLR) by 0.5250594% and 3.293177% respectively.
Model 2: Among industry-specific variables, when bank lending (lnBKLN) is decreased by 1%, non-performing loans (lnNPLR) will increase by 0.3681242%. Net operating profit (lnNOP) and deposit rates (lnDPR) also have an inverse relationship with lnNPLR. When lnNOP and lnDPR decrease by 1%, lnNPLR increases by 0.0602165%, and 2.718319% respectively. On the contrary, at a 1% increase in banks’ liquidity (lnLIQ) and lending rates (lnLDR), bad loan (lnNPLR) is hyped by 0.424397% and 4.923853%, respectively.
To check if there is any autocorrelation, we performed the Lagrange-multiplier test (Table 10). Both models are free from the autocorrelation problem.

4.5. Robustness of the Study

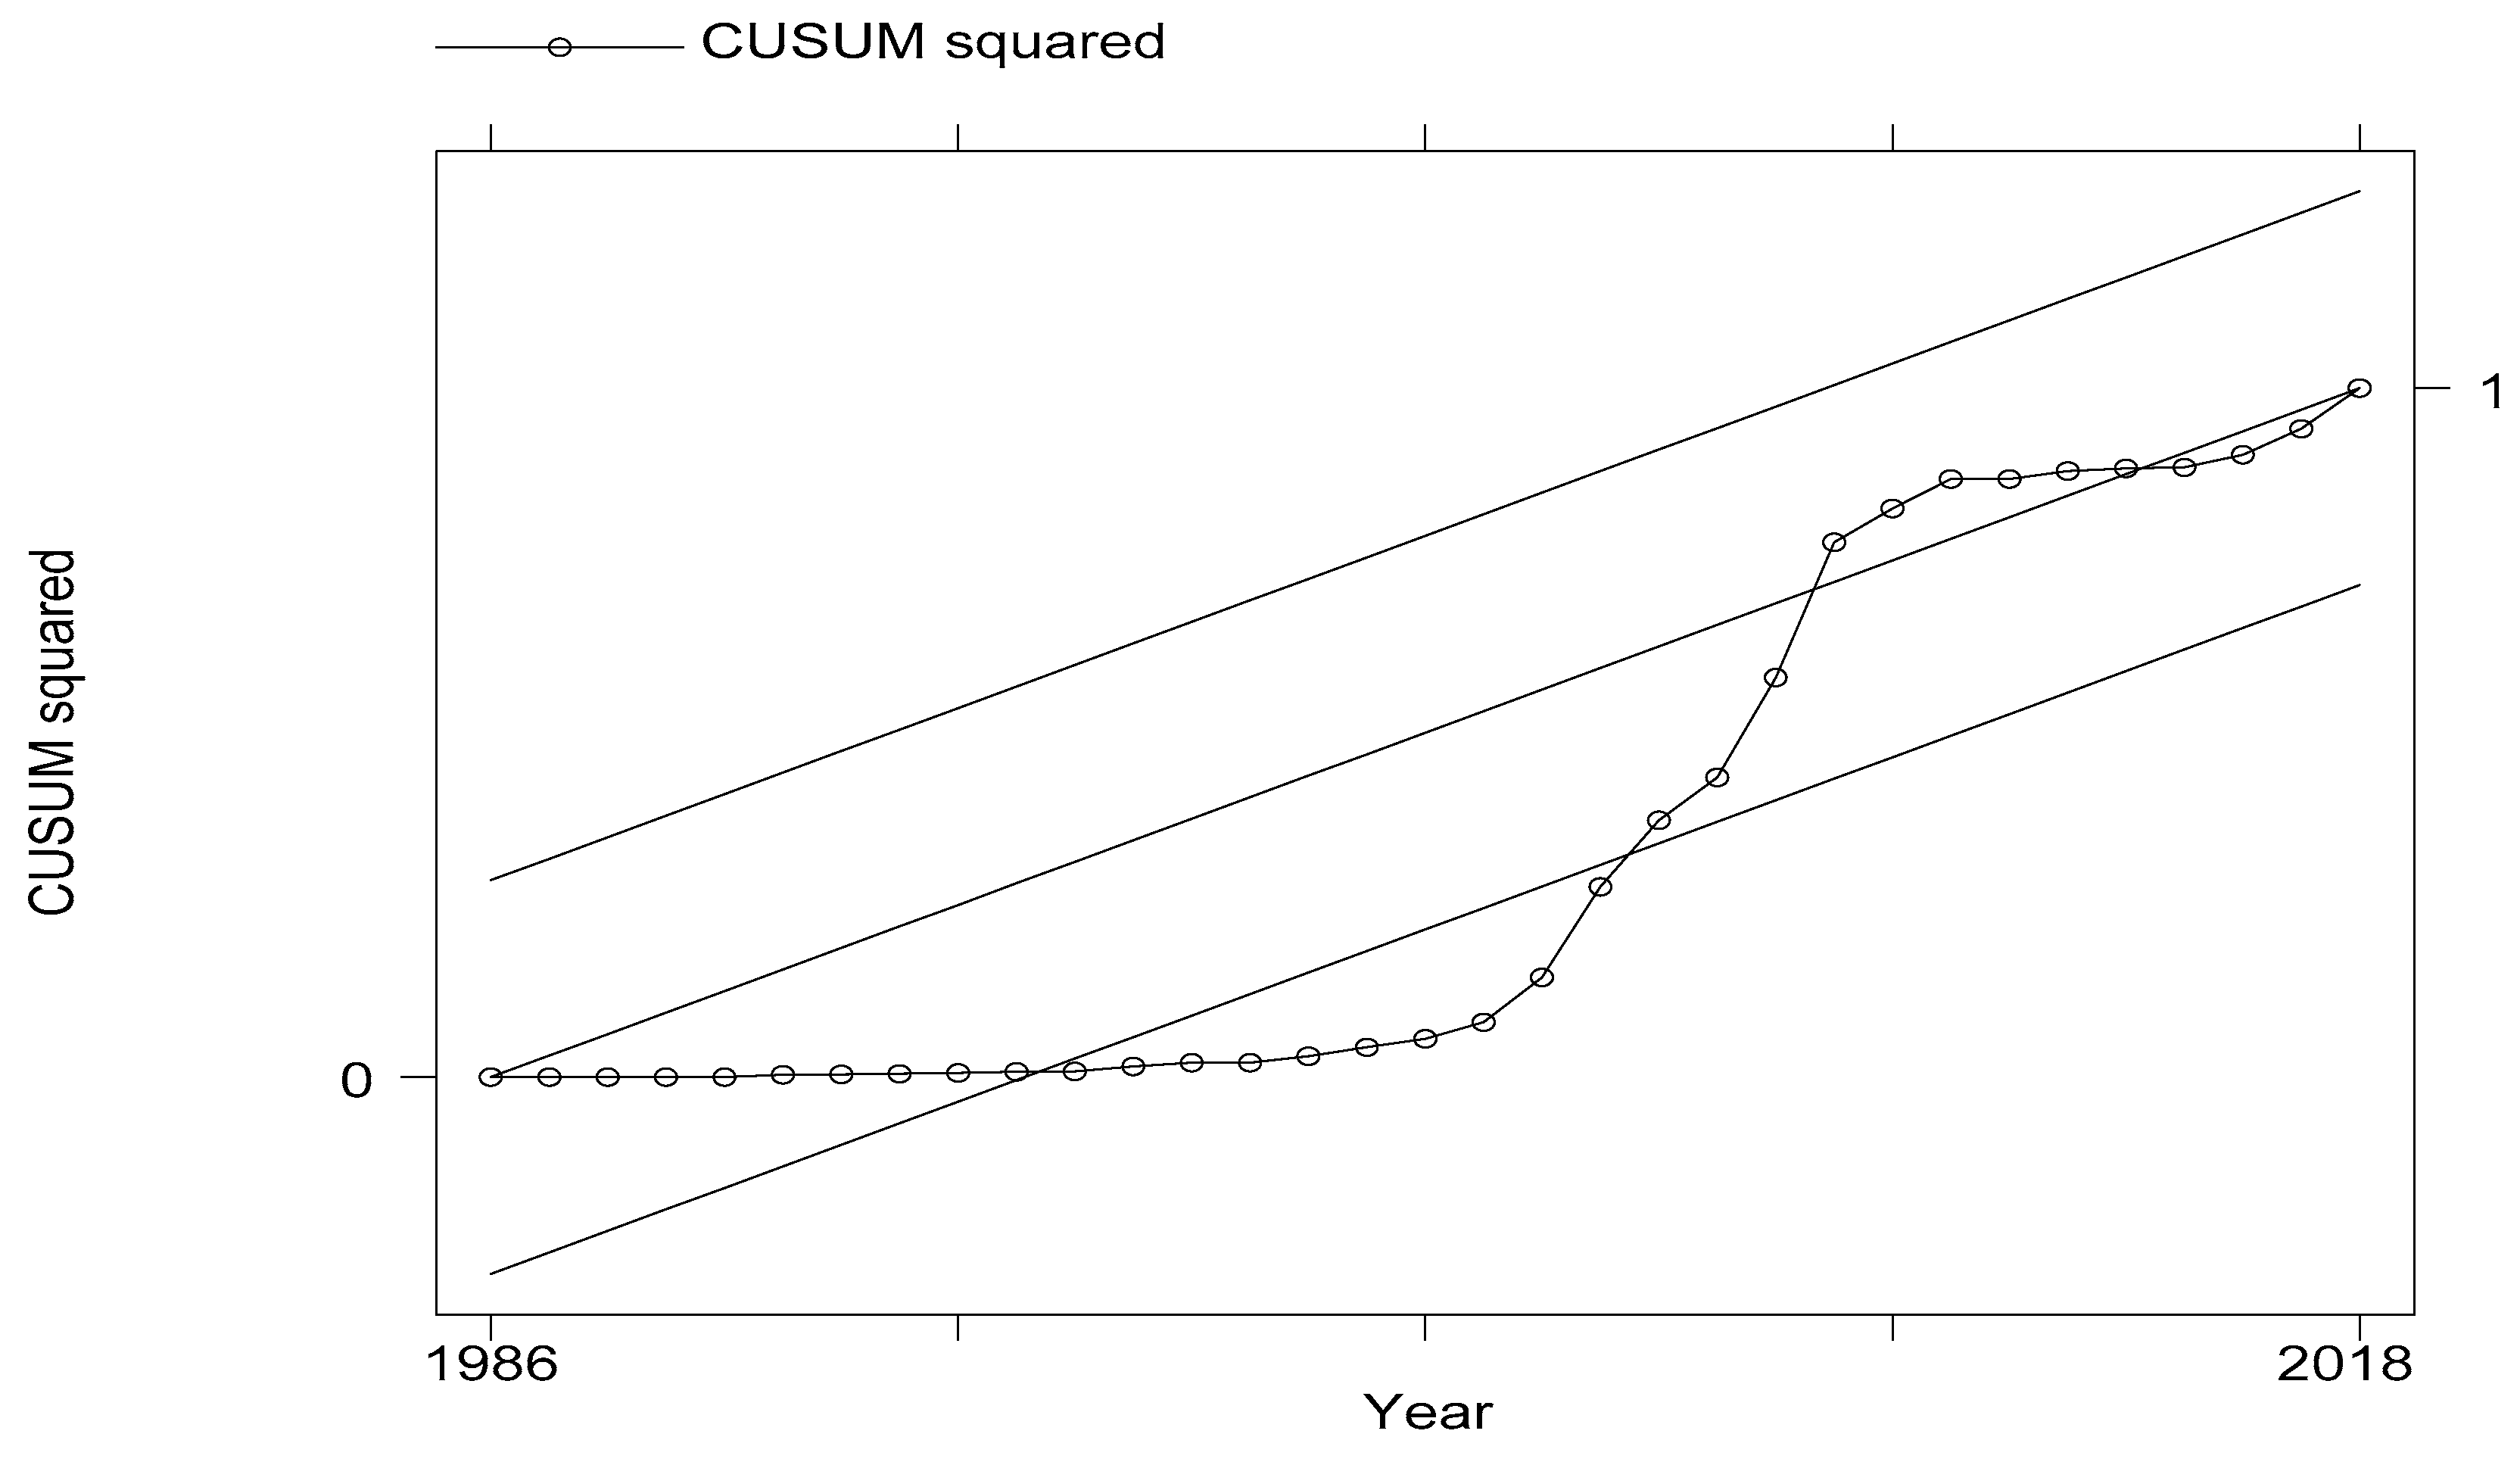
The overall stability of the models was examined through a few diagnostic tests of the ARDL model (Table 11). The Durbin–Watson tests (for autocorrelation) suggest that neither the macroeconomic nor the industry-specific variables have autocorrelations among them. Again, for the Jarque–Bera, Breusch–Godfrey (serial correlation test), and White’s tests (homoscedasticity test), we cannot reject the zero hypothesis as all the coefficients are not significant, and hence, the models are normal; there is no serial correlation among the variables and the models are free from the heteroscedasticity problem. We checked autocorrelation for VECM and found no autocorrelation problem through the Lagrange-multiplier test. The CUSUM (cumulative sum) was tested to check the model stability (Figure 3 and Figure 4). The model with macroeconomic variables seems okay, with a slight deviation in the middle. Again, the results of VECM are consistent with ARDL estimates as the signs of the coefficients are similar (Table 12).

5. Conclusions

Throughout the study, we found significant shreds of evidence that our hypothesis of industry-specific and macroeconomic determinants influencing non-performing loans in Bangladesh is being established. To the best of our information, this research is the first to discover the impact of both industry-specific and macroeconomic determinants of NPLs in Bangladesh at a time horizon of 40 years. Also, very few studies, we found, had been conducted comparing the results in ARDL and VECM. Hence, it can be considered a robust study.
Long-run convergences of ARDL show that non-performing loans negatively impact economic growth. That means as the economy advances to good shape, entrepreneurs are more capable of repaying loans. The movement of exchange rates is another important factor, the consequence of which has a positive impact on NPLs. Results show as the exchange rate increases, entrepreneurs have to pay more on their imports causing a reduction in the capacity to repay. Again, with the increase in NPLs, unemployment rises in the short run, which can create instability in the economy as well.
Loan growth in the long run decreases non-performing loans. As the lending horizon has been increasing during the last decade in small and medium enterprises (SMEs) and micro-finances, non-performing loans have decreased proportionately. We may look into this fact in our future research as this is not the focal point of this study. In the short run, NPLs increase with loan growth. Banks’ profitability decreases with higher NPLs as banks need to increase the base of loan loss provisions for future losses. This has a spillover effect on the lending interest rates and the deposit rates as well. Lending interest rates increase and deposit rates decrease with the growth of NPLs. Finally, the liquidity of banks needs to be handled carefully so that banks do not become too ambitious and make bad lending. There is a high chance of excess liquidity being wrongly managed by the bankers, as our research found a positive correlation between bad loans and liquidity. Central banks and policymakers can step into this to act as a guide in this regard. Banks may be controlled by implementing contractionary lending policies during an economic downturn and expansionary lending policies during economic growth to ensure their sustainability in the long run. Regulatory bodies may carefully monitor the growth of domestic credit and exchange rate fluctuation to scale down the impact of bad loans in the economy.
The results obtained piloting econometric examination can be used to project fundamental grounds of NPLs in the economy of Bangladesh. It will help policymakers of developing countries like Bangladesh to take enough measures to control NPLs or take precautions against it. The contribution of the current study puts light on future research. For example, future research can be conducted in the developing and emerging economies like Bangladesh.

Author Contributions

Conceptualization: P.K.B.; Methodology, P.K.B.; Formal analysis: P.K.B.; Investigation P.K.B.; Writing original draft preparation: P.K.B.; Writing review and editing: N.S.; Supervision: C.Z. All authors have read and agreed to the published version of the manuscript.

Funding

The research is not funded by any source.

Conflicts of Interest

The authors declare no conflict of interest.

References

  1. Norton, J.J.; Olive, C.D. Globalization of financial risks and international supervision of banks and securities firms: Lessons from the Barings debacle. Int. Lawyer 1996, 30, 301–344. [Google Scholar]
  2. Klein, N. Non-performing Loans in CESEE: Determinants and Impact on Macroeconomic Performance; International Monetary Fund: Washington, DC, USA, 2013. [Google Scholar]
  3. Louzis, D.P.; Vouldis, A.T.; Metaxas, V.L. Macroeconomic and bank-specific determinants of non-performing loans in Greece: A comparative study of mortgage, business and consumer loan portfolios. J. Bank. Financ. 2012, 36, 1012–1027. [Google Scholar] [CrossRef]
  4. Podpiera, J.; Weill, L. Bad luck or bad management? Emerging banking market experience. J. Financ. Stab. 2008, 4, 135–148. [Google Scholar] [CrossRef] [Green Version]
  5. Berger, A.N.; De-Young, R. Problem loans and cost efficiency in commercial banks. J. Bank. Financ. 1997, 21, 849–870. [Google Scholar] [CrossRef] [Green Version]
  6. Demirgüç-Kunt, A.; Detragiache, E. The determinants of banking crises in developing and developed countries. Staff. Pap. 1998, 45, 81–109. [Google Scholar] [CrossRef]
  7. González-Hermosillo, M.B. Determinants of Ex-Ante Banking System Distress: A Macro-Micro Empirical Exploration of Some Recent Episodes; International Monetary Fund: Washington, DC, USA, 1999. [Google Scholar]
  8. Makri, V.; Tsagkanos, A.; Bellas, A. Determinants of non-performing loans: The case of Eurozone. Panoeconomicus 2014, 61, 193–206. [Google Scholar] [CrossRef] [Green Version]
  9. Yang, C.-C. Reduction of non-performing loans in the banking industry: An application of data envelopment analysis. J. Bus. Econ. Manag. 2017, 18, 833–851. [Google Scholar] [CrossRef] [Green Version]
  10. Barseghyan, L. Non-performing loans, prospective bailouts, and Japan’s slowdown. J. Monet. Econ. 2010, 57, 873–890. [Google Scholar] [CrossRef]
  11. Zeng, S. Bank non-performing loans (NPLS): A dynamic model and analysis in China. Mod. Econ. 2012, 3, 100. [Google Scholar] [CrossRef] [Green Version]
  12. Fofack, H.L. Nonperforming Loans in Sub-Saharan Africa: Causal Analysis and Macroeconomic Implications; The World Bank: Washington, DC, USA, 2005. [Google Scholar]
  13. Keeton, W.R.; Morris, C.S. Why do banks’ loan losses differ. Econ. Rev. 1987, 72, 3–21. [Google Scholar]
  14. Messai, A.S.; Jouini, F. Micro and macro determinants of non-performing loans. Int. J. Econ. Financ. Issues 2013, 3, 852–860. [Google Scholar]
  15. Matthews, K. Risk management and managerial efficiency in Chinese banks: A network DEA framework. Omega 2013, 41, 207–215. [Google Scholar] [CrossRef] [Green Version]
  16. Espinoza, R.A.; Prasad, A. Nonperforming Loans in the GCC Banking System and Their Macroeconomic Effects; International Monetary Fund: Washington, DC, USA, 2010; pp. 10–224. [Google Scholar]
  17. Škarica, B. Determinants of non-performing loans in Central and Eastern European countries. Financ. Theory Pract. 2014, 38, 37–59. [Google Scholar] [CrossRef]
  18. Chaibi, H.; Ftiti, Z. Credit risk determinants: Evidence from a cross-country study. Res. Int. Bus. Financ. 2015, 33, 1–16. [Google Scholar] [CrossRef]
  19. Dimitrios, A.; Helen, L.; Mike, T. Determinants of non-performing loans: Evidence from Euro-area countries. Financ. Res. Lett. 2016, 18, 116–119. [Google Scholar] [CrossRef]
  20. Partovi, E.; Matousek, R. Bank efficiency and non-performing loans: Evidence from Turkey. Res. Int. Bus. Financ. 2019, 48, 287–309. [Google Scholar] [CrossRef]
  21. Ghosh, A. Banking-industry specific and regional economic determinants of non-performing loans: Evidence from US states. J. Financ. Stab. 2015, 20, 93–104. [Google Scholar] [CrossRef]
  22. Godlewski, C.J. The determinants of multiple bank loan renegotiations in Europe. Int. Rev. Financ. Anal. 2014, 34, 275–286. [Google Scholar] [CrossRef]
  23. Dey, B.K. Managing Nonperforming Loans in Bangladesh. 2019. Available online: https://www.adb.org/publications/managing-nonperforming-loans-bangladesh (accessed on 26 December 2019).
  24. Vardar, G.; Özgüler, I.C. Short Term and Long Term Linkages among Nonperforming Loans, Macroeconomic and Bank-Specific Factors: An Empirical Analysis for Turkey. Ege Akad. Bakış Derg. 2015, 15, 313–326. [Google Scholar] [CrossRef]
  25. Bardhan, S.; Mukherjee, V. Bank-specific determinants of nonperforming assets of Indian banks. Int. Econ. Econ. Policy 2016, 13, 483–498. [Google Scholar] [CrossRef]
  26. Rajan, R.G. Why bank credit policies fluctuate: A theory and some evidence. Q. J. Econ. 1994, 109, 399–441. [Google Scholar] [CrossRef] [Green Version]
  27. García-Marco, T.; Robles-Fernández, M.D. Risk-taking behaviour and ownership in the banking industry: The Spanish evidence. J. Econ. Bus. 2008, 60, 332–354. [Google Scholar] [CrossRef]
  28. Boahene, S.H.; Dasah, J.; Agyei, S.K. Credit risk and profitability of selected banks in Ghana. Res. J. Financ. Account. 2012, 3, 6–14. [Google Scholar]
  29. Sinkey, J.F.; Greenawalt, M.B. Loan-loss experience and risk-taking behavior at large commercial banks. J. Financ. Serv. Res. 1991, 5, 43–59. [Google Scholar] [CrossRef]
  30. Liu, R. Comparison of Bank Efficiencies Between the US and Canada: Evidence Based on SFA and DEA. J. Compet. 2019, 11, 113–129. [Google Scholar] [CrossRef]
  31. Kjosevski, J.; Petkovski, M.; Naumovska, E. Bank-specific and macroeconomic determinants of non-performing loans in the Republic of Macedonia: Comparative analysis of enterprise and household NPLs. Econ. Res. Ekon. Istraživanja 2019, 32, 1185–1203. [Google Scholar] [CrossRef]
  32. Tanasković, S.; Jandrić, M. Macroeconomic and institutional determinants of non-performing loans. J. Cent. Bank. Theory Pract. 2015, 4, 47–62. [Google Scholar] [CrossRef] [Green Version]
  33. Vogiazas, S.D.; Nikolaidou, E. Investigating the determinants of nonperforming loans in the Romanian banking system: An empirical study with reference to the Greek crisis. Econ. Res. Int. 2011, 2011. [Google Scholar] [CrossRef] [Green Version]
  34. Rifat, A.M. An Analytical Study of Determinants of Non-Performing Loans: Evidence from Non-Bank Financial Institutions (NBFIs) of Bangladesh. J. Bus. Technol. (Dhaka) 2016, 11, 55–67. [Google Scholar] [CrossRef] [Green Version]
  35. Shuman, M.A.R. Effect of Bank Specific Variables on the Non-Performing Loan Ratio: A case study on the Commercial Banks of Bangladesh. In Proceedings of the Annual Banking Conference, Dhaka, Bangladesh, 23–29 November 2015. [Google Scholar]
  36. Parvin, A. Determinants of Problem Loan and Its Effect on the Financial Health: Evidence from Private Commercial Banks of Bangladesh. Proceedings of Welcome Message from Conference Chairs, Omaha, NE, USA, 28–31 September 2017. [Google Scholar]
  37. Amir, M.K. Does excess bank liquidity impact non-performing loan? a study on Bangladeshi economy. Int. J. Bus. Technopreneurship 2019, 9, 287–298. [Google Scholar]
  38. Islam, F.T. Evaluating Loan Loss Provisioning for Non-Performing Loans and Its Impact on the Profitability of Commercial Banks in Bangladesh. Asian Financ. Bank. Rev. 2018, 2, 33–41. [Google Scholar]
  39. Rahman, M.; Hai, A. Factors Affecting Non-Performing Loan (NPL) of Private Commercial Banks in Bangladesh. Amity Glob. Bus. Rev. 2017, 12, 7–14. [Google Scholar]
  40. Rahman, M.A.; Asaduzzaman, M.; Hossin, M.S. Impact of financial ratios on non-performing loans of publicly traded commercial banks in Bangladesh. Int. J. Financ. Res. 2016, 8, 181. [Google Scholar] [CrossRef] [Green Version]
  41. Hasan, M.Z. Macroeconomic Determinants of Non-Performing Loans in Bangladesh: An ARDL Approach. Sci. Res. J. 2019, 7, 84–89. [Google Scholar]
  42. Hasan, K.; Khan, R.S. Management of Non-Performing Loans (NPLs) of Banks in Bangladesh-An Evaluative study. J. Econ. Financ. 2013, 1, 1–15. [Google Scholar]
  43. Rahman, B.; Jahan, N. Non-Performing Loans (NPLs) in Islamic Banks of Bangladesh: An Empirical Study. world Rev. Bus. Res. 2018, 8, 12–23. [Google Scholar]
  44. Islam, M.Z.; Aktar, S.; Hossen, M.A.; Islam, M.S. Non-Performing Loan And Asset Utilization of Banks: Evidence From Bangladesh. Rom. Econ. Bus. Rev. 2018, 13, 31–39. [Google Scholar]
  45. Islam, M.Z.; Islam, M.S. Non-Performing Loan As Eroding Factor of Capital Adequacy: Evidence From Banking Industry In Bangladesh. Rom. Econ. Bus. Rev. 2018, 13, 15–21. [Google Scholar]
  46. Roy, S.; Dey, P.K.; Bhowmik, P. Non-performing loans in private commercial banks of Bangladesh: Macro-economic determinants and impacts. Jahangirnagar J. Bus. Stud. 2014, 4, 47–57. [Google Scholar]
  47. Roy, J. Non-Performing Loan on Profitability: Evidence from Banking Sector of Dhaka Stock Exchange. SSRN Electron. J. 2015, 1, 13. [Google Scholar] [CrossRef]
  48. Islam, M.S.; Nishiyama, S.-I. Non-Performing Loans of Commercial Banks in South Asian Countries: Adverse Selection and Moral Hazard Issues. Asian Econ. Financ. Rev. 2019, 9, 1091. [Google Scholar] [CrossRef]
  49. Mondal, T. Sensitivity of non-performing loan to macroeconomic variables: Empirical evidence from banking industry of Bangladesh. Glob. J. Manag. Bus. Res. 2016, 16, 4-C. [Google Scholar]
  50. Engle, R.F.; Granger, C.W. Co-integration and error correction: Representation, estimation, and testing. Econom. J. Econom. Soc. 1987, 55, 251–276. [Google Scholar] [CrossRef]
  51. Hassler, U.; Wolters, J. Autoregressive distributed lag models and cointegration. In Modern Econometric Analysis; Springer: Berlin/Heidelberg, Germany, 2006; pp. 57–72. [Google Scholar]
  52. Masih, M.; Hamdan, B. The impact of monetary policy on deposit and lending rates in industrial and developing countries: An application of ARDL approach. J. Int. Financ. Econ. 2008, 8, 114–122. [Google Scholar]
  53. Mallick, H.; Agarwal, S. Impact of real interest rates on real output growth in India: A long-run analysis in a liberalized financial regime. Singap. Econ. Rev. 2007, 52, 215–231. [Google Scholar] [CrossRef]
  54. Shrestha, M.B.; Chowdhury, K. ARDL Modelling Approach to Testing the Financial Liberalisation Hypothesis; Working Paper 05-15; Department of Economics, University of Wollongong: Wollongong, Australia, 2005; Available online: https://ro.uow.edu.au/commwkpapers/121 (accessed on 22 July 2019).
Figure 1. Non-performing loan (NPL) and bank loan (BKLN) growth in Bangladesh (in billion USD); Source: Bangladesh Bank.
Sustainability 12 00325 g001
Figure 2. Non-performing loan ratio (NPLR) and gross domestic product growth rate (GDPGR) in Bangladesh; Source(s): Fred and WDI Database.
Sustainability 12 00325 g002
Figure 3. Cumulative Sum (CUSUM) Test for Macroeconomic Variables.
Sustainability 12 00325 g003
Figure 4. Cumulative Sum (CUSUM) Test for Industry-Specific Variables.
Sustainability 12 00325 g004
Table 1. Empirical studies related to Bangladesh.
Author(s)Data and Methodology Findings
[34]Panel data: 2003 to 2014 of NBFI; Regression and correlation;Loan growth, firm size, and broad money have statistical significance with NPLs. The researcher found NPL ratio has significant relationships neither with GDP nor with Inflation. The study has been conducted on Non-Banking Financial Intuitions (NBFI).
[35]Panel data: 2010–2014
Simple linear regression
NPLs have positive connections to Net Interest Margin (NIM), inefficiency ratio and aggregate deposit while CAR, solvency ratio, and aggregate credit have a negative relationship with NPLs.
[36]Primary data: 50 respondents; Secondary data: 2011 to 2015 five commercial banks; Linear regressionNon-performing loan ratio negatively influences return on assets (ROA) and return on equity (ROE) with statistical significance.
[37]Data: 2012 to 2016; Linear regressionExcess liquidity can moderately impact non-performing loans.
[38]Data: 2009 to 2017; Least Square Multiple RegressionLoan loss provision (LLP) has a significant negative relationship with profitability.
[39]Primary data: 150 respondents; Descriptive statistics.Researchers found aggressive credit expansion, the willingness of borrowers are the determinants that help increase NPLs.
[40]Data: 2010 to 2015 for 20 banks; Linear regressionResearchers found a positive relationship of NPLs with Credit-deposit ratio, net interest margin. While the capital adequacy ratio and return on assets negatively impact NPLs. NPLs are also influenced by the sensitive sector’s loan and priority sector’s loan. Unsecured loans, investment deposit ratio, capital adequacy ratio, return on assets, profit per employee, have a negative control on NPLs.
[41]Data: 2000 to 2017, ARDL MethodThe researcher of this study disagrees with the point that NPLs are impacted by GDP or inflation. Rather he found no statistical relationship using the ARDL method in his research.
[42]Primary Data: 30 managers and Secondary Data: 1999 to 2008; Linear regressionFrom survey research, researchers found political influence and economic condition directly cause non-performing loans. In the quantitative analysis, they found that collection efforts by banks also play a significant role in a loan to become bad.
[43]Data: 2011 to 2015; 8 Islamic banks; Descriptive Statistics; Varimax rotationThis research put light on the Islamic banking system in Bangladesh and found a significant negative liaison with non-performing investments (NPIs) and profitability. Researchers also argued that creditworthiness, employed ethics, and bureaucracy influence NPIs.
[44]Data: 2008 to 2017 40 banks; Linear RegressionA significant negative relationship between ROA and NPLs has been established by this study.
[45]Data: 2008 to 2017; 40 banks; RegressionThis research suggests that capital adequacy is negatively impacted by the level of non-performing loans in banks of Bangladesh. The researchers also argued that variations in CAR could significantly influence profitability, deposit rates, liquidity, and overall corporate governance of the banks.
[46]Penal Data: 2004 to 2013; 18 banks; Pearson correlation test, Unit root test, Granger causality testResearchers in this study found the theoretical establishment of the concept that GDP and inflation impact true in empirical findings. GDP impacts NPLs negatively, while inflation impacts NPLs positively. They also found that interest spread of the banks is inversely related to NPLs.
[47]Time Series Data: 2008 to 2013; 30 banks; RegressionNPLs have a significant negative relation with the Net profit margin (NPM).
[48]Panel Data: 1997 to 2012; 259 South Asian banks; Multiple regression, Unit root, GMMModal hazard type II and adverse selection problems, poor management of the banks can cause non-performing loans. Researchers also found that the global financial crisis had been another reason for NPLs.
[49]Data: 2005 to 2014; 22 banks; ADF unit root test, Pearson Correlation Matrix, Granger Causality TestThrough econometric analysis, researchers reached the conclusion that NPLs are negatively associated with inflation rate and interest rate spread. Again, NPLs are positively analogous to GDP and the unemployment rate.
[49]Data: 2013 to 2017; 30 banks; Pooled OLS RegressionThe research findings of this study are that return on assets (ROA) is influenced by the capital adequacy ratio (CAR) and non-performing loans. The suggestion from researchers is that banks should go for timely legal action to collect the bad loans.
Table 2. Variable Definition.
VariablesInterpretation
lnNPLRNon-performing loan ratio: Doubtful and bad loans to total loan ratio
Macroeconomic VariableslnGDPGRGross domestic product growth rate: The annual gross domestic product growth rates of Bangladesh.
lnCPIConsumer price index: The weighted average prices of consumer goods and services. The year 2006 has been considered a base year.
lnDOCRDomestic Credit: The aggregate of net dues on the central government and dues on other segments of the national economy.
lnUNEMRate of unemployment: The annual unemployment rate in Bangladesh.
lnEXRExchange rates: The annual exchange rates of BDT (currency of Bangladesh) against USD.
Industry-specific VariableslnBKLNBanking sector gross loan: The annual aggregate loan disbursement by the entire banking sector of Bangladesh
lnLIQBank liquidity: The annual liquid asset ratio provided by Bangladesh Bank. Liquid assets include cash and government securities. It measures the capacity of banks to meet their obligations.
lnNOPNet operating profit: The annual net operating profit of the entire banking sector.
lnLDRBank lending rate: The rate at which banks lend to their customers. Bangladesh bank provides weighted average lending interest rates of all sorts of loans including short term and long term loans.
lnDPRBank deposit rate: Deposit rates are the weighted average interest rates banks at which collect funds from its customers for investment.
Table 3. Augmented Dickey-Fuller (ADF) and Philip and Perron (PP) Unit Root Tests.
VariablesADFPP
At the LevelFirst DifferentiationAt the LevelFirst Differentiation
T-Statistics0.10Test Statistics0.10T-Statistics0.10T-Statistics0.10
Macroeconomic variableslnNPLR−0.7110−2.6140−2.977 **−2.6160−1.0060−10.4800−28.861 ***−10.4600
lnGDPGR−3.4870 ***−2.6140−9.335 ***−2.6160−33.898 ***−10.4800−63.73 ***−10.4600
lnCPI−0.1780−2.6140−3.232 **−2.6160−0.913 *−10.4800−11.298 ***−10.4600
lnDOCR1.1930−2.6140−6.169 ***−2.61600.3640−10.4800−34.838 ***−10.4600
lnUNEM−1.7120−2.6140−5.145 ***−2.6160−2.3000−10.4800−45.254 ***−10.4600
lnEXR−3.5180 ***−2.6140−4.798 ***−2.6160−2.269 **−10.4800−30.731 ***−10.4600
Bank-specificvariableslnBKLN−0.3000−2.6140−5.661 ***−2.6160−0.2920−10.4800−32.355 ***−10.4600
lnLIQ−2.4120−2.6140−3.213 **−2.6160−8.5110−10.4800−29.317 ***−10.4600
lnNOP−2.763 *−2.6140−5.162 ***−2.6160−11.782*−10.4800−37.632 ***−10.4600
lnLDR−1.951 ***−2.6140−3.76 ***−2.6160−4.6360−10.4800−24.115 ***−10.4600
lnDPR−3.181 **−2.6140−4.51 ***−2.6160−8.2240−10.4800−20.525 ***−10.4600
*, **, and *** stand for 10%, 5%, and 1% levels of significance, respectively.
Table 4. Pesaran/Shin/Smith (2001) ARDL (Autoregressive Distributed Lag) Bounds Test.
At 10%At 5%At 2.5%At 1%
CategoryF
Statistics
Lower LimitUpper LimitLower LimitUpper LimitLower LimitUpper LimitLower LimitUpper Limit
Macro-economic30.6092.26003.35002.62003.79002.96004.18003.41004.6800
Industry-specific15.3372.26003.35002.62003.79002.96004.18003.41004.6800
Table 5. VAR (Vector Autoregression) Lag Order Selection Criteria.
Lag RankAkaike’s Information Criterion (AIC)Schwarz Information Criterion (SIC)
Macroeconomic Variables0−13.364−13.1001
1−25.2891−23.4417
2−27.2268−23.7958 *
3−28.5331−23.5186
4−29.3804 *−22.7824
Industry-specific Variables0−2.9061−2.64219
1−12.9529−11.1055
2−13.3905−9.95959
3−14.4065−9.39201
4−18.4346 *−11.8366 *
Note: * denotes the number lag(s).
Table 6. Long-Run coefficients of ARDL Model.
MacroeconomicIndustry-Specific
DeterminantsCoefficientsStandard ErrorDeterminants CoefficientsStandard Error
lnGDPGR−1.396011 **0.5629lnBKLN−0.5203392 ***0.0367
lnCPI−0.96023210.7484lnLIQ2.669881 ***0.5103
lnDOCR1.066338 *0.5631lnNOP−0.0192367 ***0.0032
lnUNEM−7.639355 ***2.0093lnLDR3.790614 ***0.3349
lnEXR3.756394 ***1.1450lnDPR−0.7667929 ***0.1571
Cons0.2079730.2722Cons−3.784955 ***0.6260
R-squared = 0.9618; Adj. R-squared = 0.8971R-squared = 0.9338; Adj. R-squared = 0.8219
*, **, and *** stand for 10%, 5%, and 1% levels of significance, respectively.
Table 7. Short-Run coefficients of ARDL Model.
MacroeconomicIndustry-Specific
Determinants CoefficientsStandard ErrorDeterminants CoefficientsStandard Error
lnGDPGR0.364553 ***0.1142lnBKLN0.20509540.1857
lnCPI−5.017027 ***0.9689lnLIQ−2.247147 ***0.4446
lnDOCR−0.2792480.1682lnNOP0.0092824 ***0.0028
lnUNEM2.445047 ***0.2168lnLDR−1.591485 ***0.3374
lnEXR−0.8860041 **0.3653lnDPR0.21510.2027
Cons0.2079730.2722Cons−3.784955 ***0.6260
R-squared = 0.9618; Adj. R-squared = 0.8971R-squared = 0.9338; Adj. R-squared = 0.8219
*, **, and *** stand for 10%, 5%, and 1% levels of significance, respectively.
Table 8. The Johansen Tests for Co-integration.
Max. RankParmsLLEigenvalueT. Statistics5% Critical Value
Macroeconomic Variables042485.4188 206.519494.1500
153527.68840.8919121.980368.5200
262553.17120.738571.014747.2100
369570.55700.599536.243029.6800
474581.39740.434814.5622 *15.4100
577588.66450.31780.02813.7600
678588.67850.0007
Industry-specific Variables042273.84 112.798294.1500
153294.810.6770.853168.5200
262308.840.5242.7962 *47.2100
369319.770.4420.922429.6800
474325.670.279.130315.4100
577330.050.210.3664
678330.240.01
Note: * denotes the number of co-integrating equation(s) at 5% significance. At * we reject the null hypothesis with a 5% level of significance.
Table 9. Vector Error Correction Model (VECM) Results.
Macroeconomic VariablesIndustry-Specific Variables
DescriptionVariablesCoefficientStandard ErrorT StatisticsVariableCoefficientStandard ErrorT Statistics
Speed of AdjustmentΔlnNPLR−0.2557821 ***0.0246683−10.37ΔlnNPLR−0.18850380.1307467−1.44
Short-run coefficientsΔlnGDPGR−0.6820223 ***0.0918552−7.42ΔlnBKLN−0.19011490.2513614−0.76
ΔlnCPI0.6937023 ***0.13551975.12ΔlnLIQ 0.4885987 **0.21363992.29
ΔlnDOCR−0.05012260.1408345−0.36ΔlnNOP0.27598520.25999341.06
ΔlnUNEM−0.32873840.2686674−1.22ΔlnLDR0.6160724 *0.31570541.95
ΔlnEXR0.23717220.15147361.57ΔlnDPR0.7740481 ***0.20541913.77
Long-run coefficientslnGDPGR0.4780902 **0.24410851.96lnBKLN0.3681242 ***0.032327611.39
lnCPI 0.18321980.46637950.39lnLIQ−0.4243970.3814911−1.11
lnDOCR−0.5250594 **0.2479925−2.12lnNOP0.0602165 ***0.004682312.86
lnUNEM6.997589 ***0.644668410.85lnLDR−4.923853 ***0.2398030−20.53
lnEXR−3.293177 ***0.5921451−5.56lnDPR2.718319 ***0.235806011.53
*, **, and *** stand for 10%, 5%, and 1% levels of significance, respectively.
Table 10. VECM Diagnostic Tests (Lagrange-Multiplier Test).
Industry-Specific VariablesMacroeconomic Variables
Nature of TestLag Orderp ValueInterpretationLag Orderp ValueInterpretation
Auto-correlation testLag 10.7811No AutocorrelationLag 10.1264No Autocorrelation
Lag 20.6193Lag 20.8915
Table 11. Diagnostic Tests for ARDL.
Tests DetailMacroeconomic VariablesIndustry-Specific Variables
Tests PerformedNature of Tests Score/p ValueInterpretationScore/p ValueInterpretation
Durbin-Watson d-statisticAutocorrelation Test2.2850No Autocorrelation2.4313No Autocorrelation
Jarque-Bera testNormality Test0.2483Normal0.3731Normal
Breusch-Godfrey LM testSerial Correlation Test0.2395No Serial Correlation0.0692No Serial Correlation
White’s testHomoscedasticity Test0.4215Homoscedastic0.4215Homoscedastic
Table 12. Comparison of ARDL and VECM Coefficients.
Macroeconomic VariablesIndustry-Specific Variables
Determinants ARDL CoefficientsVECM CoefficientsDeterminantsARDL CoefficientsVECM Coefficients
lnGDPGR−1.396011 **−0.4780902 **lnBKLN−0.5203392 ***−0.3681242 ***
lnCPI−0.9602321−0.1832198lnLIQ2.669881 ***0.424397
lnDOCR1.066338 *0.5250594 **lnNOP−0.0192367 ***−0.0602165 ***
lnUNEM−7.639355 ***−6.997589 ***lnLDR3.790614 ***4.923853 ***
lnEXR3.756394 ***3.293177 ***lnDPR−0.7667929 ***−2.718319 ***
*, **, and *** stand for 10%, 5%, and 1% levels of significance, respectively.

