Are Personal Electric Vehicles Sustainable? A Hybrid E-Bike Case Study


Abstract
1. Introduction
2. Life Cycle Assessment
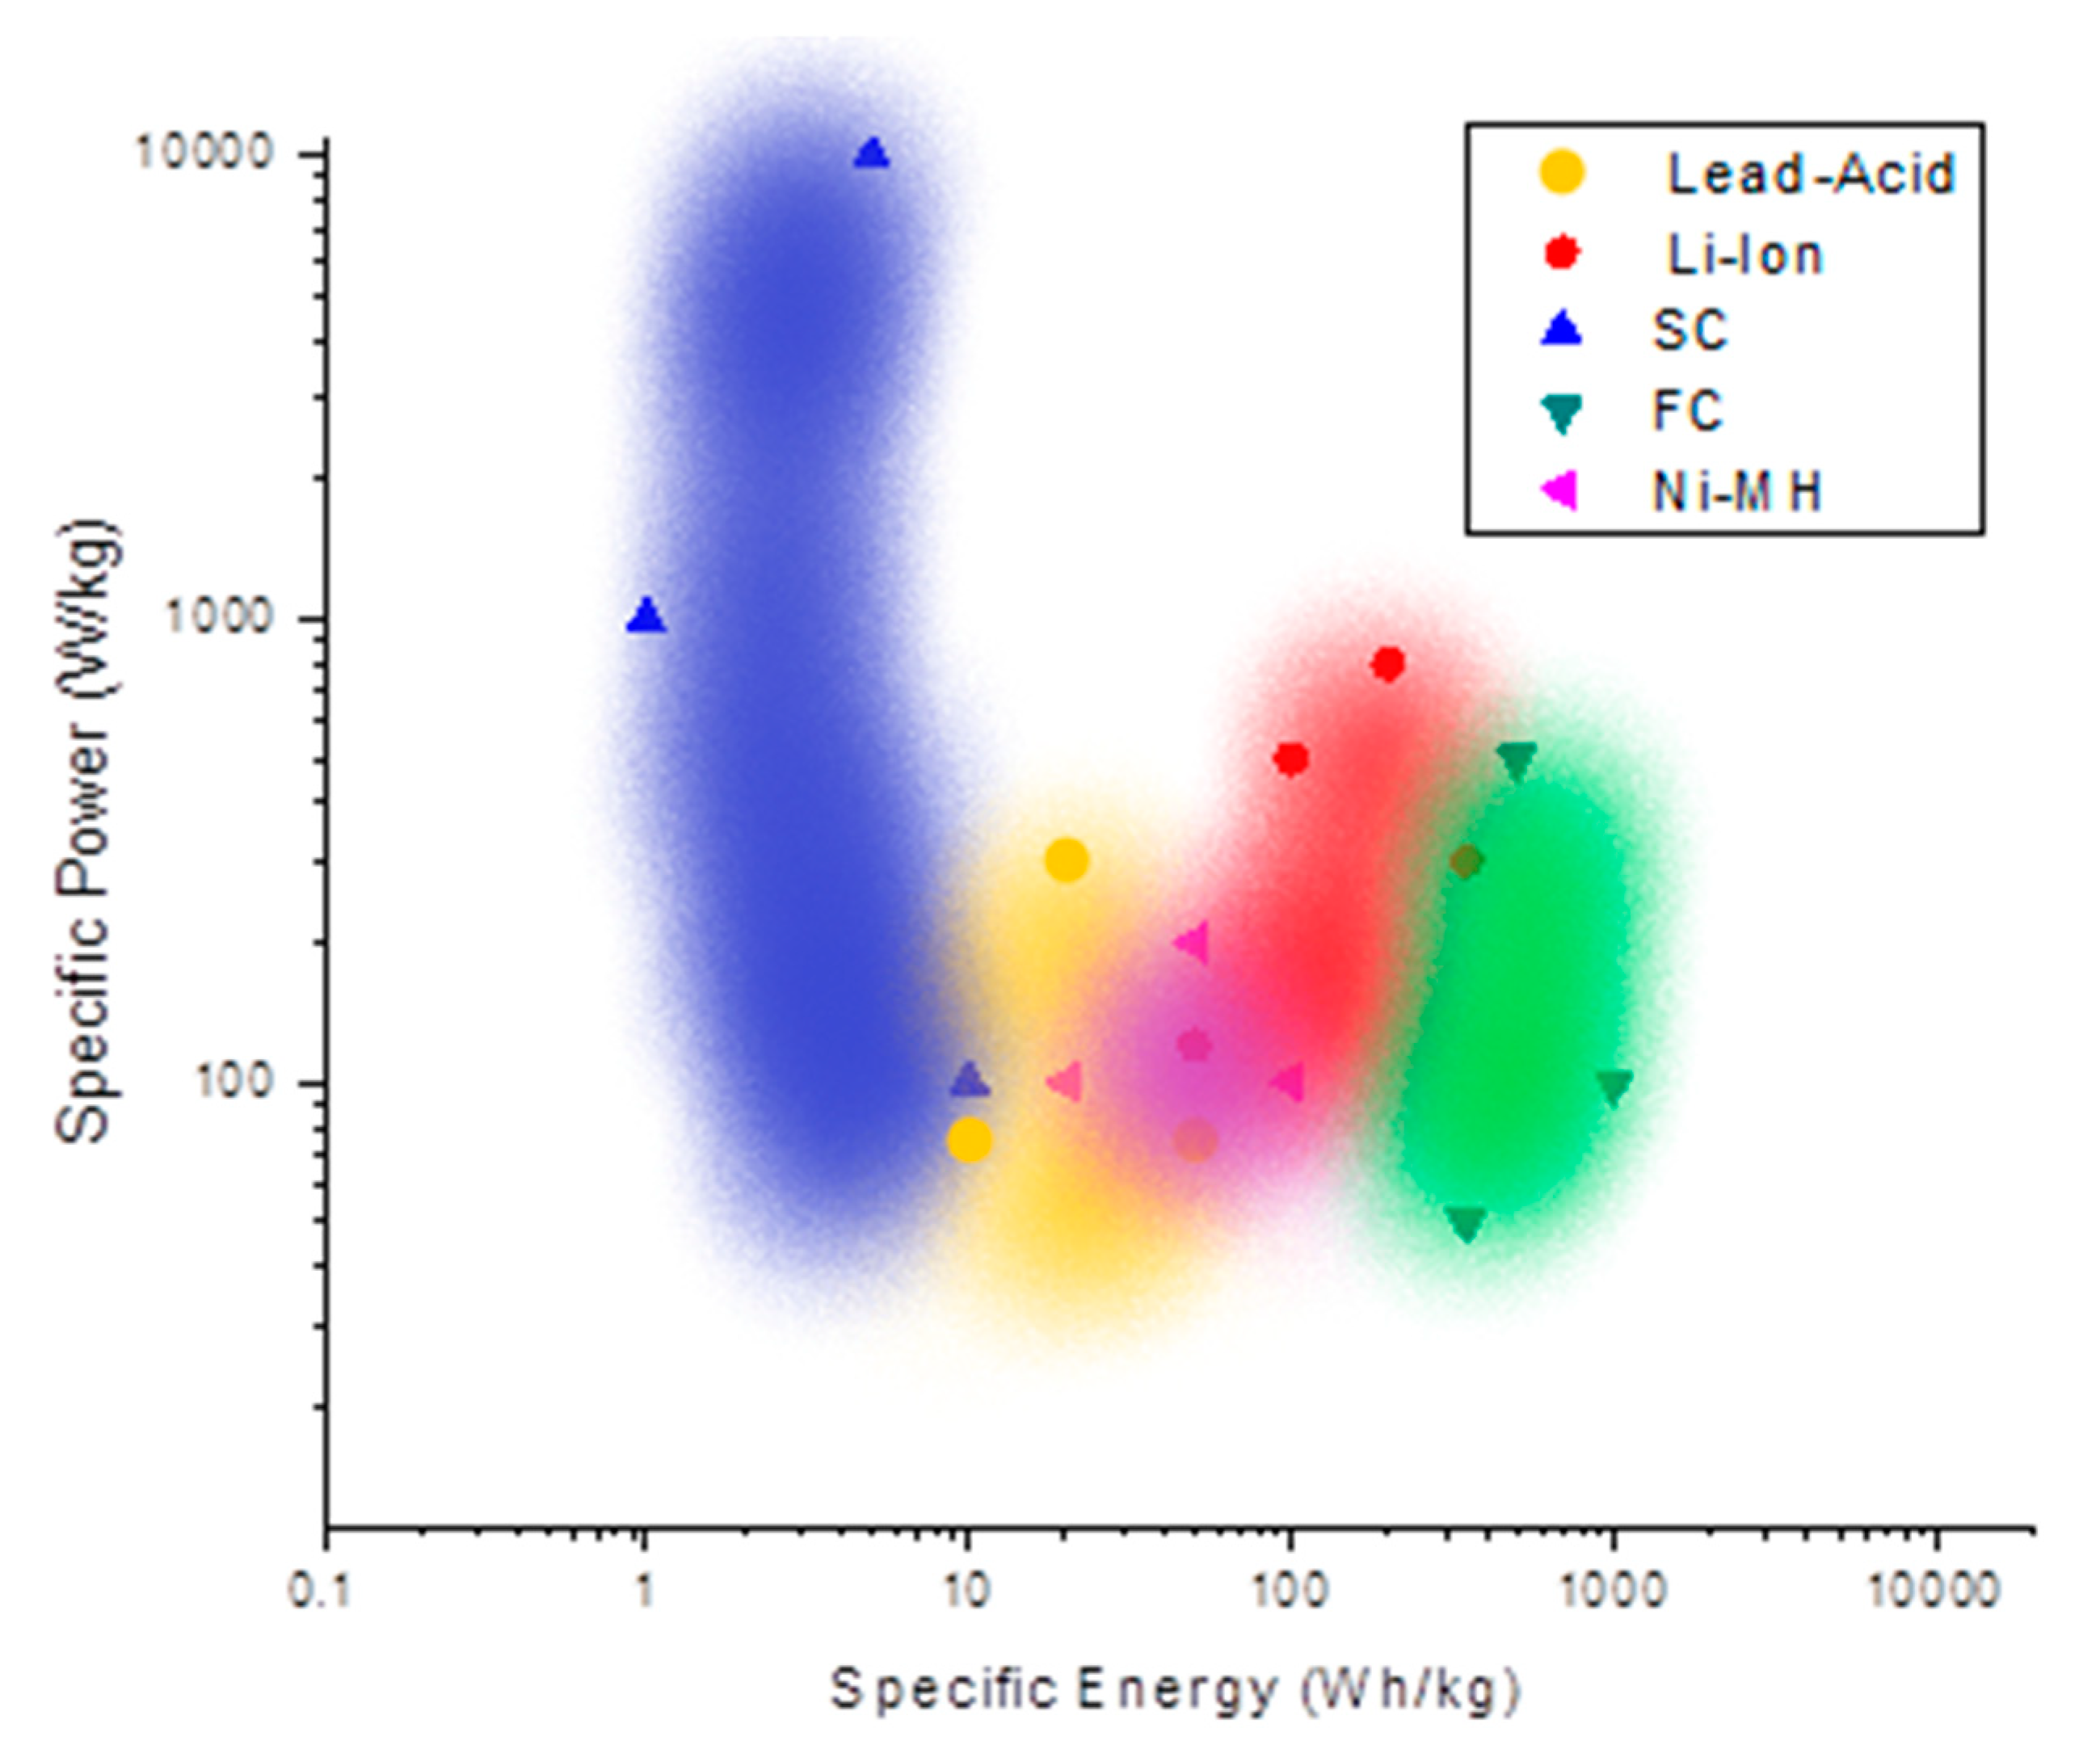
3. Performance Analysis of Main Storage Solutions for PEVs
4. Life Cycle Assessment of Hybrid Storage Implementations/Solutions
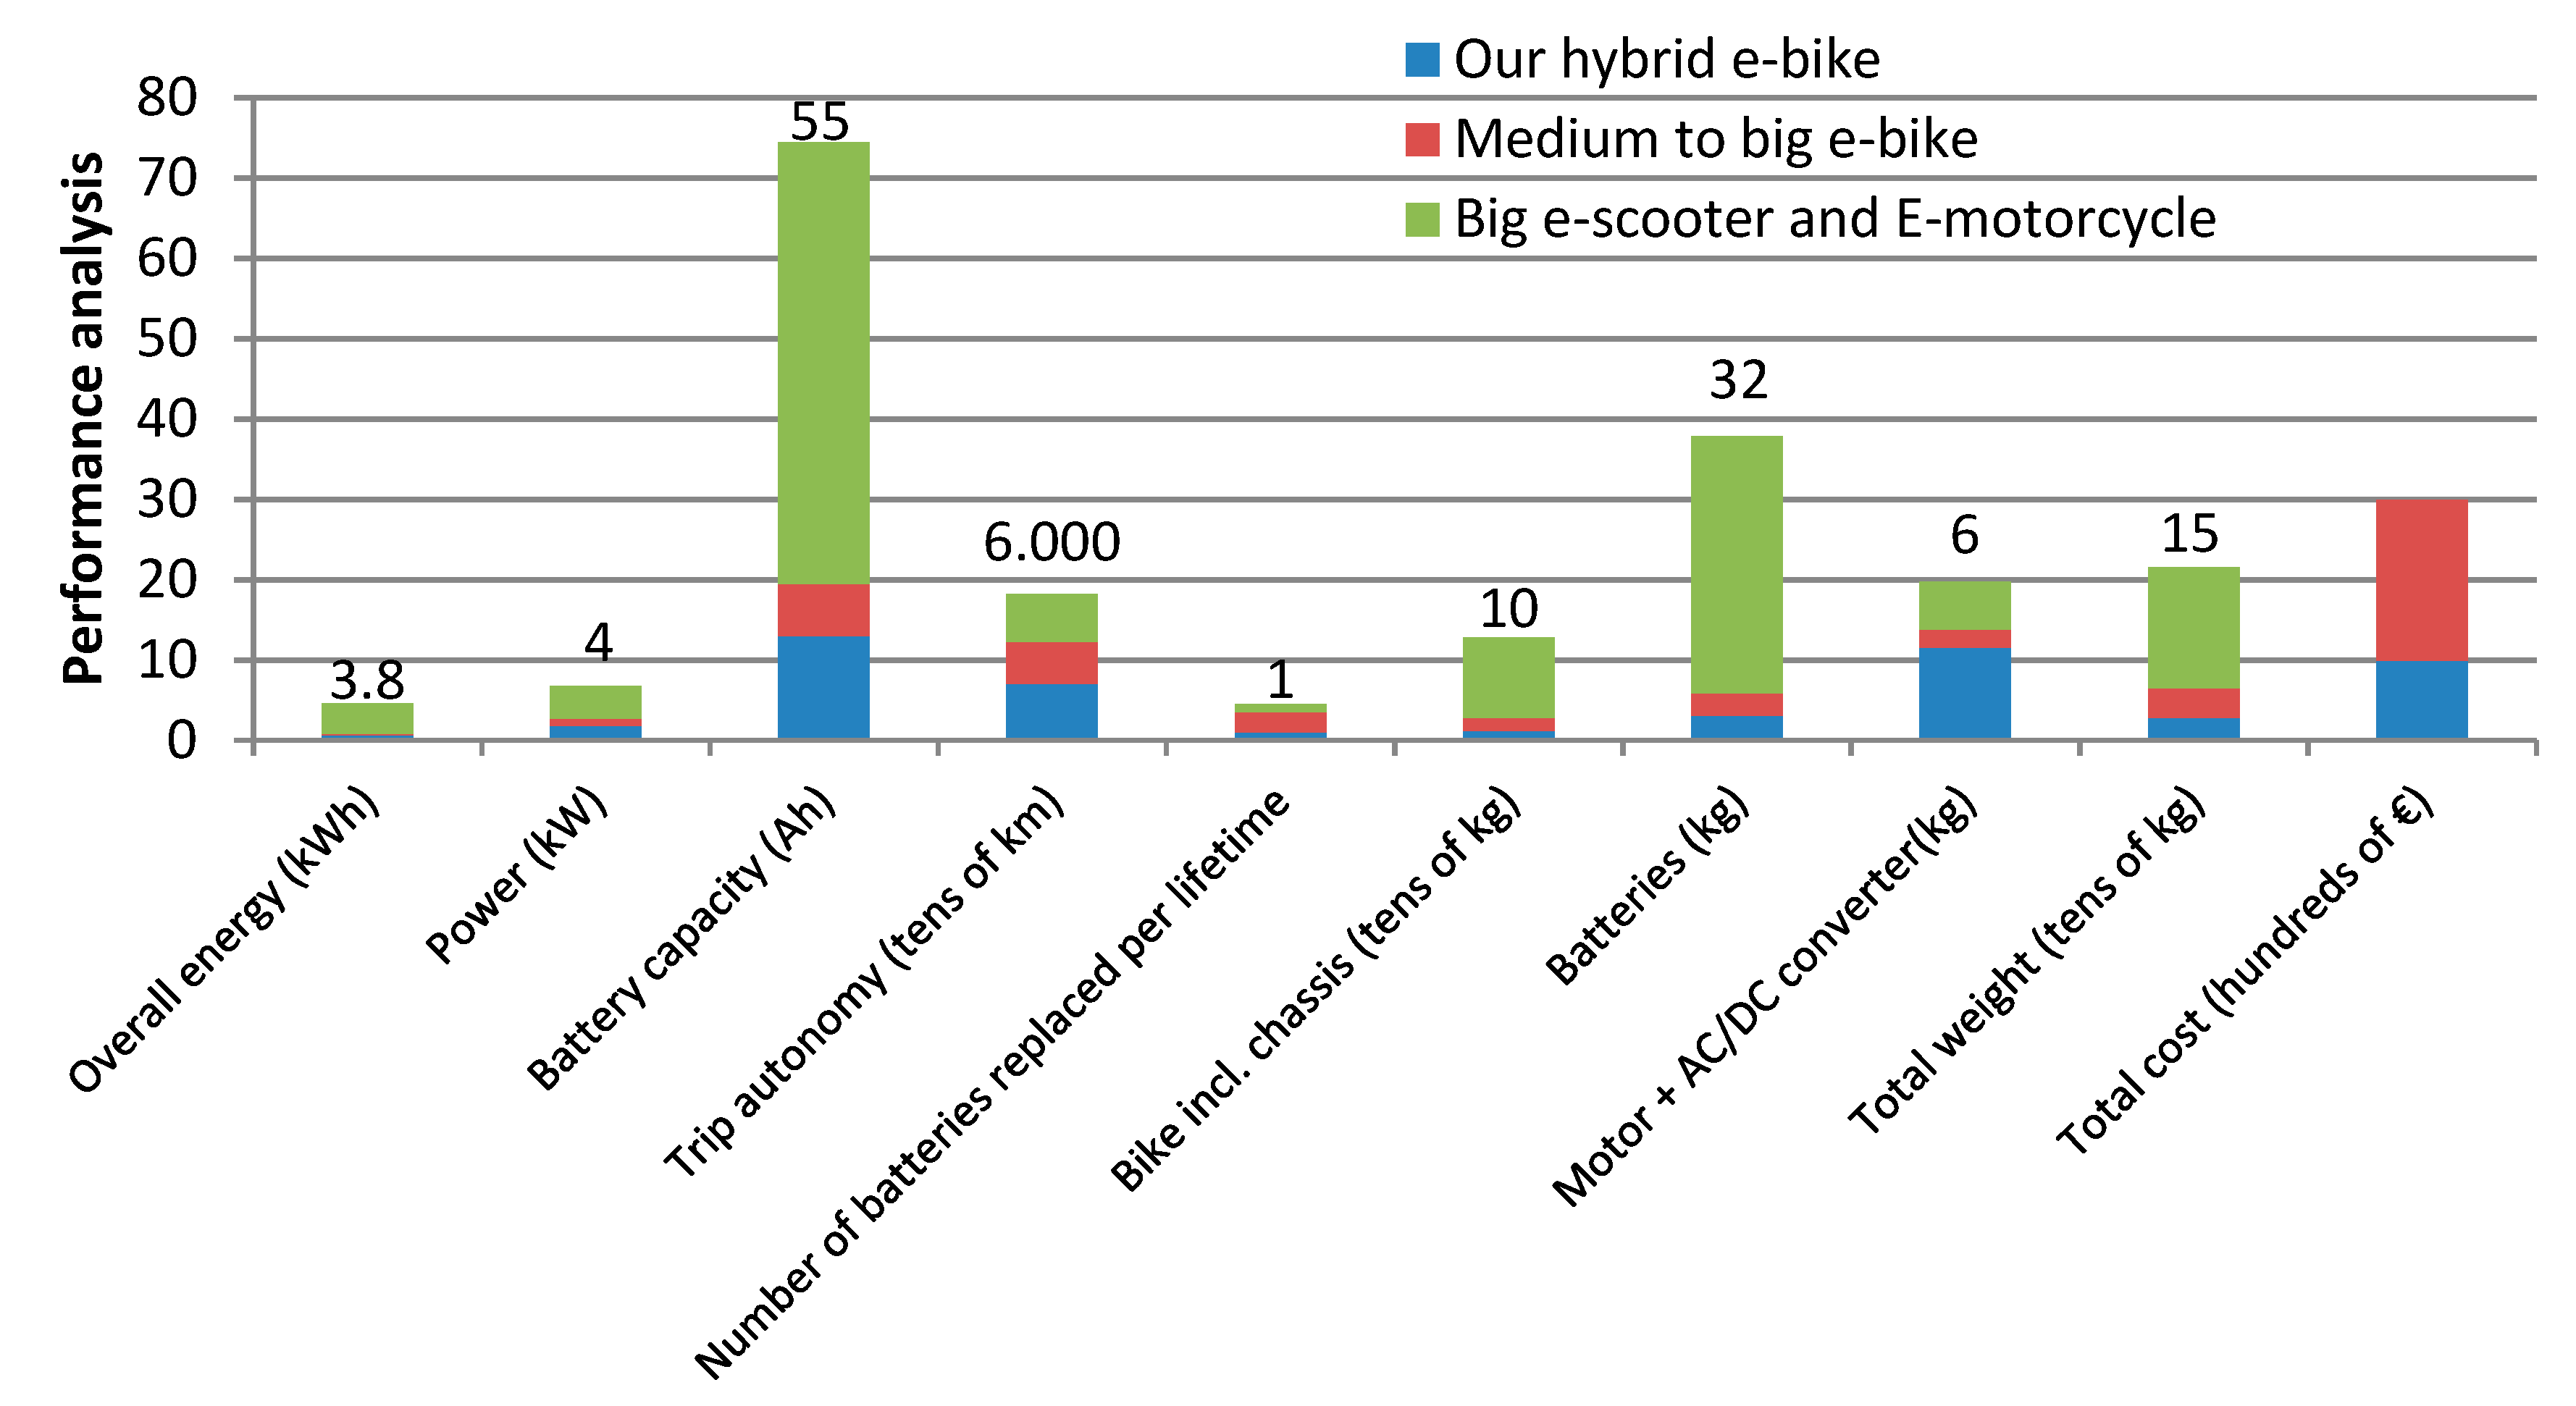
5. Hybrid E-Bike Sizing and Performance Analysis
6. Discussion
7. Conclusions
Author Contributions
Funding
Acknowledgments
Conflicts of Interest
References
- Ling, Z.; Cherry, C.R.; Yang, H.; Jones, L.R. From e-bike to car: A study on factors influencing motorization of e-bike users across China. Transp. Res. Part D Transp. Environ. 2015, 41, 50–63. [Google Scholar] [CrossRef]
- Cherry, C.R.; Yang, H.; Jones, L.R.; He, M. Dynamics of electric bike ownership and use in Kunming, China. Transp. Policy 2016, 145, 127–135. [Google Scholar] [CrossRef]
- Wu, Z.; Wang, C.; Wolfram, P.; Zhang, Y.; Sun, X.; Hertwich, E. Assessing electric vehicle policy with region-specific carbon footprints. Appl. Energy 2019. [Google Scholar] [CrossRef]
- Fahimnia, B.; Bell, M.G.H.; Hensher, D.A.; Sarkis, J. Green Logistics and Transportation: A Sustainable Supply Chain Perspective; Springer: Cham, Switzerland, 2015. [Google Scholar]
- Miller, P.; de Barros, A.G.; Kattan, L.; Wirasinghe, S.C. Public transportation and sustainability: A review. KSCE J. Civ. Eng. 2016. [Google Scholar] [CrossRef]
- Van Nunen, A.E.E.; Huijgrebts, P.; Rietveld, P. Transitions towards Sustainable Mobility: New Solutions and Approaches for Sustainable Transport Systems. In Transitions Towards Sustainable Mobility; Springer: Berlin/Heidelberg, Germany, 2011. [Google Scholar]
- Maes, J. The Potential of Cargo Bicycle Transport as a Sustainable Solution for Urban Logistics. Master’s Thesis, University of Antwerp, Antwerp, Belgium, 1 December 2017. [Google Scholar]
- Ramani, T.; Zietsman, J.; Eisele, W.; Rosa, D.; Spillane, D.; Bochner, B. Developing Sustainable Transportation Performance Measures for TxDOT’s Strategic Plan. In Security; Texas Transportation Institute: College Station, TX, USA, 2009. [Google Scholar]
- Sachs, J.D. The Age of Sustainable Development; Columbia University Press: New York, NY, USA, 2016. [Google Scholar]
- Thoughtco. History of Electric Vehicles. Available online: https://www.thoughtco.com/history-of-electric-vehicles-1991603 (accessed on 8 December 2019).
- Earlyelectric. Time Line. Available online: http://earlyelectric.com/timeline.html (accessed on 8 December 2019).
- Küng, L.; Bütler, T.; Georges, G.; Boulouchos, K. How much energy does a car need on the road? Appl. Energy 2019. [Google Scholar] [CrossRef]
- Matthé, R.; Eberle, U. The Voltec System-Energy Storage and Electric Propulsion. Lithium-Ion Batter. Adv. Appl. 2014. [Google Scholar] [CrossRef]
- Spagnol, P.; Corno, M.; Mura, R.; Savaresi, S.M. Self-sustaining strategy for a hybrid electric bike. In Proceedings of the American Control Conference (ACC), Washington, DC, USA, 17–19 June 2013; pp. 3479–3484. [Google Scholar]
- Wu, Y.; Huang, Z.; Liao, H.; Chen, B.; Zhang, X.; Zhou, Y.; Peng, J. Adaptive power allocation using artificial potential field with compensator for hybrid energy storage systems in electric vehicles. Appl. Energy 2020. [Google Scholar] [CrossRef]
- Diez, C.; Palanca, J.; Sanchez-Anguix, V.; Heras, S.; Giret, A.; Julián, V. Towards a persuasive recommender for bike sharing systems: A defeasible argumentation approach. Energies 2019, 12, 662. [Google Scholar] [CrossRef]
- Abagnale, C.; Cardone, M.; Iodice, P.; Strano, S.; Terzo, M.; Vorraro, G. Power requirements and environmental impact of a pedelec. A case study based on real-life applications. Environ. Impact Assess. Rev. 2015, 53, 1–7. [Google Scholar] [CrossRef]
- Abagnale, C.; Cardone, M.; Iodice, P.; Strano, S.; Terzo, M.; Vorraro, G. A dynamic model for the performance and environmental analysis of an innovative e-bike. Energy Procedia 2015, 81, 618–627. [Google Scholar] [CrossRef]
- Mrkajic, V.; Vukelic, D.; Mihajlov, A. Reduction of CO2 emission and non-environmental co-benefits of bicycle infrastructure provision: The case of the University of Novi Sad, Serbia. Renew. Sustain. Energy Rev. 2015, 49, 232–242. [Google Scholar] [CrossRef]
- Bucher, D.; Buffat, R.; Froemelt, A.; Raubal, M. Energy and greenhouse gas emission reduction potentials resulting from different commuter electric bicycle adoption scenarios in Switzerland. Renew. Sustain. Energy Rev. 2019. [Google Scholar] [CrossRef]
- Baptista, P.; Pina, A.; Duarte, G.; Rolim, C.; Pereira, G.; Silva, C.; Farias, T. From on-road trial evaluation of electric and conventional bicycles to comparison with other urban transport modes: Case study in the city of Lisbon, Portugal. Energy Convers. Manag. 2015, 92, 10–18. [Google Scholar] [CrossRef]
- Kroesen, M. To what extent do e-bikes substitute travel by other modes? Evidence from the Netherlands. Transp. Res. Part D Transp. Environ. 2017, 53, 377–887. [Google Scholar] [CrossRef]
- Cherry, C.; Weinert, J.; Xinmiao, Y. Comparative environmental impacts of electric bikes in China. Transp. Res. Part D 2009, 14, 281–290. [Google Scholar] [CrossRef]
- Dill, J.; Rose, G. E-bikes and transportation policy: Insights from early adopters. Transp. Res. Rec. 2012, 2314, 1–6. [Google Scholar] [CrossRef]
- Mendes, M. On-Road Evaluation of Conventional and Electric Motorcycle and Bicycles Performance in Urban Context. Master’s Thesis, Instituto Superior Técnico, Lisbon, Portugal, 2013. [Google Scholar]
- Cipriani, G.; Di Dio, V.; Miceli, R.; Ricco Galluzzo, G.; Russo, M. Evaluation of performance and efficiency and type approval of an electrically assisted bicycle drive. In Proceedings of the 2013 International Conference on Renewable Energy Research and Applications (ICRERA), Madrid, Spain, 20–23 October 2013. [Google Scholar]
- Roemer, F.; Mrosek, M.; Schmalfuss, S.; Lienkamp, M. New approach for an easily detachable electric drive unit for off-the-shelf bicycles. World Electr. Veh. J. 2018, 9, 37. [Google Scholar] [CrossRef]
- Fishman, E.; Cherry, C. E-bikes in the Mainstream: Reviewing a Decade of Research. Transp. Rev. 2016, 36, 72–91. [Google Scholar] [CrossRef]
- IEA. Energy technology perspectives: 2010. Scenarios & strategies to 2050. Int. Energy Agency 2010. [Google Scholar] [CrossRef]
- Dozza, M.; Werneke, J.; Mackenzie, M. e-BikeSAFE: A Naturalistic Cycling Study to understand how electrical bicycles change cycling behaviour and influence safety. In Proceedings of the International Cycling Safety Conference, Helmond, The Netherlands, 20–21 November 2013. [Google Scholar]
- Adhisuwignjo, S.; Siradjuddin, I.; Rifa’I, M.; Putri, R.I. Development of a solar-powered electric bicycle in bike sharing transportation system. IOP Conf. Ser. Earth Environ. Sci. 2017, 70. [Google Scholar] [CrossRef]
- Salmeron-Manzano, E.; Manzano-Agugliaro, F. The electric bicycle: Worldwide research trends. Energies 2018, 11, 1894. [Google Scholar] [CrossRef]
- Cycle Assessment of Two Wheel Vehicles. Available online: http://treeze.ch/fileadmin/user_upload/downloads/Publications/Case_Studies/Mobility/leuenberger-2010-TwoWheelVehicles.pdf (accessed on 16 November 2019).
- Luo, X.; Wang, J.; Dooner, M.; Clarke, J. Overview of current development in electrical energy storage technologies and the application potential in power system operation. Appl. Energy 2015, 137, 511–536. [Google Scholar] [CrossRef]
- Petrillo, A.; Mellino, S.; De Felice, F.; Scudo, I. Design of a Sustainable Electric Pedal-Assisted Bike: A Life Cycle Assessment Application in Italy. New Front. Life Cycle Assess. Theory Appl. 2018. [Google Scholar] [CrossRef]
- Abu-Rub, H.; Malinowski, M.; Al-Haddad, K. Power Electronics for Renewable Energy Systems, Transportation and Industrial Applications; John Wiley & Sons Ltd.: Chichester, UK, 2014. [Google Scholar]
- Dai, D.; Leng, R.; Zhang, C.; Wang, C. Using hybrid modeling for life cycle assessment of motor bike and electric bike. J. Cent. South Univ. Technol. 2005, 12, 77–80. [Google Scholar] [CrossRef]
- Dave, S. Life Cycle Assessment of Transportation Options for Commuters; Massachusetts Institute of Technology (MIT): Cambridge, MA, USA, 2010; pp. 1–16. [Google Scholar]
- Asaithambi, G.; Treiber, M.; Kanagaraj, V. Life Cycle Assessment of Conventional and Electric Vehicles. Int. Clim. Prot. 2019, 161–168. [Google Scholar] [CrossRef]
- Messagie, M. Life Cycle Analysis of the Climate Impact of Electric Vehicles. Transp. Environ. 2014, 2014, 1–14. [Google Scholar]
- Guanetti, J.; Formentin, S.; Corno, M.; Savaresi, S.M. Optimal energy management in series hybrid electric bicycles. Automatica 2017, 81, 96–106. [Google Scholar] [CrossRef]
- Borza, P.N. Application of the Energy Storage Systems. In Emerging Nanotechnologies in Rechargeable Energy Storage Systems; Rodriguez-Martinez, L.M., Omar, N., Eds.; Elsevier: Amsterdam, The Netherlands, 2017. [Google Scholar]
- Assessment of Environmental Impact, Economic and Societal Competitiveness. Available online: http://www.pro-e-bike.org/wp-content/uploads/2016/02/D-6-4-Assessment-of-environmental-impact-economic-and-societal-competitiveness_December-2015.pdf (accessed on 16 November 2019).
- Coelho, M.C.; Almeida, D. Cycling mobility—A life cycle assessment based approach. Transp. Res. Procedia 2015, 10, 443–451. [Google Scholar] [CrossRef]
- Mahmoudzadeh Andwari, A.; Pesiridis, A.; Rajoo, S.; Martinez-Botas, R.; Esfahanian, V. A review of Battery Electric Vehicle technology and readiness levels. Renew. Sustain. Energy Rev. 2017, 71, 414–430. [Google Scholar] [CrossRef]
- Deng, Y.; Li, J.; Li, T.; Gao, X.; Yuan, C. Life cycle assessment of lithium sulfur battery for electric vehicles. J. Power Sources 2017, 343, 284–295. [Google Scholar] [CrossRef]
- Li, Y.; Yang, J.; Song, J. Electromagnetic effects model and design of energy systems for lithium batteries with gradient structure in sustainable energy electric vehicles. Renew. Sustain. Energy Rev. 2015, 52, 842–851. [Google Scholar] [CrossRef]
- Hannan, M.A.; Lipu, M.S.H.; Hussain, A.; Mohamed, A. A review of lithium-ion battery state of charge estimation and management system in electric vehicle applications: Challenges and recommendations. Renew. Sustain. Energy Rev. 2017, 78, 834–854. [Google Scholar] [CrossRef]
- Wang, Q.; Jiang, B.; Li, B.; Yan, Y. A critical review of thermal management models and solutions of lithium-ion batteries for the development of pure electric vehicles. Renew. Sustain. Energy Rev. 2016, 64, 106–128. [Google Scholar] [CrossRef]
- Zakeri, B.; Syri, S. Electrical energy storage systems: A comparative life cycle cost analysis. Renew. Sustain. Energy Rev. 2015, 42, 569–596. [Google Scholar] [CrossRef]
- Libich, J.; Máca, J.; Vondrák, J.; Čech, O.; Sedlaříková, M. Supercapacitors: Properties and applications. J. Energy Storage 2018, 17, 224–227. [Google Scholar] [CrossRef]
- Cusenza, M.A.; Bobba, S.; Ardente, F.; Cellura, M.; Di Persio, F. Energy and environmental assessment of a traction lithium-ion battery pack for plug-in hybrid electric vehicles. J. Clean. Prod. 2019, 215, 634–649. [Google Scholar] [CrossRef]
- Gandoman, F.H.; Jaguemont, J.; Goutam, S.; Gopalakrishnan, R.; Firouz, Y.; Kalogiannis, T.; Van Mierlo, J. Concept of reliability and safety assessment of lithium-ion batteries in electric vehicles: Basics, progress, and challenges. Appl. Energy 2019, 251. [Google Scholar] [CrossRef]
- Marques, P.; Garcia, R.; Kulay, L.; Freire, F. Comparative life cycle assessment of lithium-ion batteries for electric vehicles addressing capacity fade. J. Clean. Prod. 2019, 229, 787–794. [Google Scholar] [CrossRef]
- Jiang, Y.; Jiang, J.; Zhang, C.; Zhang, W.; Gao, Y.; Guo, Q. Recognition of battery aging variations for LiFePO4 batteries in 2nd use applications combining incremental capacity analysis and statistical approaches. J. Power Sources 2017, 360, 180–188. [Google Scholar] [CrossRef]
- Oeser, D.; Ziegler, A.; Ackva, A. Single cell analysis of lithium-ion e-bike batteries aged under various conditions. J. Power Sources 2018, 397, 25–31. [Google Scholar] [CrossRef]
- Rahe, C.; Kelly, S.T.; Rad, M.N.; Sauer, D.U.; Mayer, J.; Figgemeier, E. Nanoscale X-ray imaging of ageing in automotive lithium ion battery cells. J. Power Sources 2019, 433, 126631. [Google Scholar] [CrossRef]
- Hatwar, N.; Bisen, A.; Dodke, H.; Junghare, A.; Khanapurkar, M. Design approach for electric bikes using battery and super capacitor for performance improvement. In Proceedings of the IEEE Conference on Intelligent Transportation Systems, Proceedings, ITSC, The Hague, The Netherlands, 6–9 October 2013; pp. 1959–1964. [Google Scholar]
- Herrera, V.I.; Milo, A.; Gaztañaga, H.; Etxeberria-Otadui, I.; Villarreal, I.; Camblong, H. Adaptive energy management strategy and optimal sizing applied on a battery supercapacitor based tramway. Appl. Energy 2016, 169, 831–845. [Google Scholar] [CrossRef]
- Manoj, E.; Isa, D.; Arelhi, R. Supercapacitor/battery hybrid powered electric bicycle via a smart boost converter. World Electr. Veh. J. 2011, 4, 280–286. [Google Scholar] [CrossRef]
- García, P.; Fernández, L.M.; Torreglosa, J.P.; Jurado, F. Operation mode control of a hybrid power system based on fuel cell/battery/ultracapacitor for an electric tramway. Comput. Electr. Eng. 2013, 39, 1993–2004. [Google Scholar] [CrossRef]
- Li, X.; Yu, L.; Cui, Y.; Li, A.; Shao, H.; Shao, Z. Enhanced properties of LiFePO4/C cathode materials co-doped with V and F ions via high-temperature ball milling route. Int. J. Hydrog. Energy 2019, 44, 27204–27213. [Google Scholar] [CrossRef]
- Li, Y.; Wang, J.; Yao, J.; Huang, H.X.; Du, Z.Q.; Gu, H.; Wang, Z.T. Enhanced cathode performance of LiFePO4/C composite by novel reaction of ethylene glycol with different carboxylic acids. Mater. Chem. Phys. 2019, 224, 293–300. [Google Scholar] [CrossRef]
- Hu, G.; Gan, Z.; Peng, Z.; Du, K.; Wang, W.; Cao, Y. Enhancing the high rate performance of synergistic hybrid LiFePO4·LiVPO4 F/C cathode for lithium ion battery. Solid State Ion. 2019, 335, 142–150. [Google Scholar] [CrossRef]
- Muzaffar, A.; Ahamed, M.B.; Deshmukh, K.; Thirumalai, J. A review on recent advances in hybrid supercapacitors: Design, fabrication and applications. Renew. Sustain. Energy Rev. 2019, 101, 123–145. [Google Scholar] [CrossRef]
- Baptista, J.M.; Sagu, J.S.; KG, U.W.; Lobato, K. State-of-the-art materials for high power and high energy supercapacitors: Performance metrics and obstacles for the transition from lab to industrial scale—A critical approach. Chem. Eng. J. 2019, 374, 1153–1179. [Google Scholar] [CrossRef]
- Mellino, S.; Petrillo, A.; Cigolotti, V.; Autorino, C.; Jannelli, E.; Ulgiati, S. A Life Cycle Assessment of lithium battery and hydrogen-FC powered electric bicycles: Searching for cleaner solutions to urban mobility. Int. J. Hydrog. Energy 2017, 42, 1830–1840. [Google Scholar] [CrossRef]
- Ortúzar, M.; Moreno, J.; Dixon, J. Ultracapacitor-based auxiliary energy system for an electric vehicle: Implementation and evaluation. IEEE Trans. Ind. Electron. 2007, 54, 2147–2156. [Google Scholar] [CrossRef]
- Saponara, S.; Moras, R.; Roncella, R.; Saletti, R.; Benedetti, D. Performance measurements of energy storage systems and control strategies in real-world e-bikes. In Proceedings of the SAS 2016—Sensors Applications Symposium, Proceedings, Catania, Italy, 20–22 April 2016. [Google Scholar]
- Alli, G.; Formentin, S.; Savaresi, S.M. On the suitability of EPACs in urban use. IFAC Proc. Vol. 2010, 43, 277–284. [Google Scholar] [CrossRef]
- Corno, M.; Berretta, D.; Spagnol, P.; Savaresi, S.M. Design, Control, and Validation of a Charge-Sustaining Parallel Hybrid Bicycle. IEEE Trans. Control Syst. Technol. 2016, 24, 817–829. [Google Scholar] [CrossRef]
- Tal, I.; Ciubotaru, B.; Muntean, G.M. Vehicular-Communications-Based Speed Advisory System for Electric Bicycles. IEEE Trans. Veh. Technol. 2016, 65, 4129–4143. [Google Scholar] [CrossRef]
- Ba Hung, N.; Jaewon, S.; Lim, O. A study of the effects of input parameters on the dynamics and required power of an electric bicycle. Appl. Energy 2017, 204, 1347–1362. [Google Scholar] [CrossRef]
- Malan, K.; Coutlakis, M.; Braid, J. Design and development of a prototype super-capacitor powered electric bicycle. In Proceedings of the ENERGYCON 2014—IEEE International Energy Conference, Cavtat, Croatia, 13–16 May 2014. [Google Scholar]
- Lee, J.; Kim, J.; Woo, B. Optimal design of in-wheel motor for an E-bike. In Proceedings of the 2016 IEEE Transportation Electrification Conference and Expo, Asia-Pacific, ITEC Asia-Pacific, Busan, Korea, 1–4 June 2016. [Google Scholar]
- Nasiri-Zarandi, R.; Ebrahimi, M. Extracting requirements for design a two-wheels electric vehicle and proposing a design procedure. In Proceedings of the 9th Annual International Power Electronics, Drive Systems, and Technologies Conference, PEVSTC, Tehran, Iran, 13–15 February 2018. [Google Scholar]
- Designing of Improved Hybrid Electric Bikes. Available online: https://pdfs.semanticscholar.org/52f0/4bfd49590859113d8628f050c77a144a7c6e.pdf (accessed on 16 November 2019).
- Lencwe, M.J.; Chowdhury, S.P.; Olwal, T.O. A multi-stage approach to a hybrid lead acid battery and supercapacitor system for transport vehicles. Energies 2018, 11, 2888. [Google Scholar] [CrossRef]
- Vitols, K.; Poiss, E. Development of electric scooter battery pack management system. In Proceedings of the 2018 IEEE 59th Annual International Scientific Conference on Power and Electrical Engineering of Riga Technical University, RTUCON, Riga, Latvia, 12–14 November 2018. [Google Scholar]
- Corno, M.; Busnelli, F.; Savaresi, S.M. Design and control of an electrically assisted kick scooter. In Proceedings of the American Control Conference, Boston, MA, USA, 6–8 July 2016. [Google Scholar]
- Leger, S.J.; Dean, J.L.; Edge, S.; Casello, J.M. “If I had a regular bicycle, I wouldn’t be out riding anymore”: Perspectives on the potential of e-bikes to support active living and independent mobility among older adults in Waterloo, Canada. Transp. Res. Part A Policy Pract. 2019, 123, 240–254. [Google Scholar] [CrossRef]
- Liu, W.; Sang, J.; Chen, L.; Tian, J.; Zhang, H.; Olvera Palma, G. Life cycle assessment of lead-acid batteries used in electric bicycles in China. J. Clean. Prod. 2015, 108, 1149–1156. [Google Scholar] [CrossRef]
- Elliot, T.; McLaren, S.J.; Sims, R. Potential environmental impacts of electric bicycles replacing other transport modes in Wellington, New Zealand. Sustain. Prod. Consum. 2018, 16, 227–239. [Google Scholar] [CrossRef]
- Timmermans, J.M.; Lataire, P.; Van Mierlo, J. Optimization of the energy consumption of the electric drive for a postal delivery bicycle. In Proceedings of the 2010 IEEE Vehicle Power and Propulsion Conference, VPPC, Lille, France, 1–3 September 2010. [Google Scholar]
- Corno, M.; Berretta, D.; Savaresi, S.M. Human machine interfacing issues in SeNZA, a Series Hybrid Electric Bicycle. In Proceedings of the American Control Conference, Chicago, IL, USA, 1–3 July 2015. [Google Scholar]
- Brankovic, A.; Berretta, D.; Formentin, S.; Corno, M.; Savaresi, S.M. Modeling and speed limitation control of an electric kick scooter. In Proceedings of the 2015 European Control Conference, ECC, Linz, Austria, 15–17 July 2015. [Google Scholar]
- Sankaranarayanan, V.; Ravichandran, S. Torque sensorless control of a human-electric hybrid bicycle. In Proceedings of the 2015 International Conference on Industrial Instrumentation and Control, ICIC, Pune, India, 9 July 2015. [Google Scholar]
- Caruso, M.; Cecconi, V.; Cipriani, G.; Di Dio, V.; Di Tommaso, A.O.; Genduso, F.; Trapanese, M. A photovoltaic charging system of an electrically assisted tricycle for touristic purposes. In Proceedings of the AEIT Annual Conference 2013: Innovation and Scientific and Technical Culture for Development, Mondello, Italy, 3–5 October 2013. [Google Scholar]
- Study & Development of Wind Energy Powered Hybrid Cycle. Available online: http://www.ijirset.com/upload/2016/march/174_39_Study_new.pdf (accessed on 16 November 2019).
- Khalik, Z.; Romijn, T.C.J.; Donkers, M.C.F.; Weiland, S. Effects of Battery Charge Acceptance and Battery Aging in Complete Vehicle Energy Management. IFAC-Pap. Line 2017, 50, 2145–2151. [Google Scholar] [CrossRef]
- Wu, J.; Wang, X.; Li, L.; Qin, C.; Du, Y. Hierarchical control strategy with battery aging consideration for hybrid electric vehicle regenerative braking control. Energy 2018, 145, 301–312. [Google Scholar] [CrossRef]
- Redondo-Iglesias, E.; Venet, P.; Pelissier, S. Calendar and cycling ageing combination of batteries in electric vehicles. Microelectron. Reliab. 2018, 80–90, 1212–1215. [Google Scholar] [CrossRef]
- Lucu, M.; Martinez-Laserna, E.; Gandiaga, I.; Camblong, H. A critical review on self-adaptive Li-ion battery ageing models. J. Power Sources 2018, 401, 85–101. [Google Scholar] [CrossRef]
- Maures, M.; Zhang, Y.; Martin, C.; Delétage, J.-Y.; Vinassa, J.-M.; Briat, O. Impact of temperature on calendar ageing of Lithium-ion battery using incremental capacity analysis. Microelectron. Reliab. 2019, 100–101, 113364. [Google Scholar] [CrossRef]
- Zhou, X.; Huang, J.; Pan, Z.; Ouyang, M. Impedance characterization of lithium-ion batteries aging under high-temperature cycling: Importance of electrolyte-phase diffusion. J. Power Sources 2019, 426, 216–222. [Google Scholar] [CrossRef]
- Wang, S.L.; Fernandez, C.; Zou, C.Y.; Yu, C.M.; Chen, L.; Zhang, L. A comprehensive working state monitoring method for power battery packs considering state of balance and aging correction. Energy 2019, 171, 444–455. [Google Scholar] [CrossRef]
- Jafari, M.; Khan, K.; Gauchia, L. Deterministic models of Li-ion battery aging: It is a matter of scale. J. Energy Storage 2018, 20, 67–77. [Google Scholar] [CrossRef]
- Zhang, S.; Hu, X.; Xie, S.; Song, Z.; Hu, L.; Hou, C. Adaptively coordinated optimization of battery aging and energy management in plug-in hybrid electric buses. Appl. Energy 2019, 256, 113891. [Google Scholar] [CrossRef]
- Esfandyari, M.J.; Esfahanian, V.; HairiYazdi, M.R.; Nehzati, H.; Shekoofa, O. A new approach to consider the influence of aging state on Lithium-ion battery state of power estimation for hybrid electric vehicle. Energy 2019, 176, 505–520. [Google Scholar] [CrossRef]
- Bai, Y.; He, H.; Li, J.; Li, S.; Wang, Y.; Yang, Q. Battery anti-aging control for a plug-in hybrid electric vehicle with a hierarchical optimization energy management strategy. J. Clean. Prod. 2019, 237, 117841. [Google Scholar] [CrossRef]
- Hu, X.; Johannesson, L.; Murgovski, N.; Egardt, B. Longevity-conscious dimensioning and power management of the hybrid energy storage system in a fuel cell hybrid electric bus. Appl. Energy 2015, 137, 913–924. [Google Scholar] [CrossRef]
- Herrera, V.I.; Saez-de-Ibarra, A.; Gaztañaga, A.; Camblong, H. Optimal Energy Management of a Hybrid Electric Bus with a Battery-Supercapacitor Storage System using Genetic Algorithms. In Proceedings of the Electrical Systems for Aircraft, Railway, Ship Propulsion and Road Vehicles ESARS, Aachen, Germany, 3–5 March 2015. [Google Scholar]
- Cheng, L.; Wang, W.; Wei, S.; Lin, H.; Jia, Z. An improved energy management strategy for hybrid energy storage system in light rail vehicles. Energies 2018, 11, 423. [Google Scholar] [CrossRef]


| Characteristic | Cars, Trains, Trams, Trucks, Buses | Medium and Heavy-Duty EVs | Motorcycles, Big Scooters, Mopeds | Bikes, Small Scooters | E-Bikes |
|---|---|---|---|---|---|
| Air pollution | 4–30 1 kilotons/year | 2–5 1 kilotons/year | 10 1 kilotons/year | Negligible * | 1–2 1 kilotons/year |
| Health & fitness factor | No impact on fitness, no health benefits * | Beneficial to both 7 | |||
| Infrastructure | Yes * | Conditional Yes: Road * | Cond. Yes: Bike lane/road * | ||
| Safety | High (industry regulations) to medium (when on road) * | Medium (when on road) * | Medium to low 3 (when on road + high speed) | ||
| Limits in speed, power, weight | No* | mopeds: 45 km/h *, motorcycle: Tens of kW * | 100–300 W * | 25–32 km/h,100–750 W, <45kg 2 | |
| Energy consumption | 10–40 MJ/user 4; 2778–11,111 Wh/user | 5–15MJ/user 4; 1389–4667Wh/user | 5–30MJ/user *; 1389–8333Wh/user | Negligible * | <1MJ/user *; 278Wh/user |
| Life span | 10–20 years * | 8–10 years* | Up to 3–4 years * | ||
| Life expectancy | >160,000 km *(cars); 0.5–1*10 6 km (trucks) | >160,000 km *(e-cars); –(e-trucks) | 25,000–50,000 8 km | 15,000 8 km | 4000–15,000 8 km |
| Recharging time | - | Tens of minutes to few hours ** | - | - | 5–8h6 |
| Range | High: Up to thousands of km * (infrastructure & storage-dependent) | High to medium: A few hundreds of km *(storage-dependent, max. 500 km) | Medium: Daily use, hundreds of km * | - | Medium to low: Hours, 45–50 km 5 |
| Trip time | (Congested) 15–35 min 4; (Light traffic) 5min * | (Cong.) 15–20 min *; (Light tr.) 5–10 min * | 30min–1h * | 15–20 min 4 | |
| Purchase costs | Tens/hundreds of thousands € * | 3000 to 10,000 € * | below 1000€ * | 500 to 5000 € * | |
| Maintenance costs | High: Up to tens of thousands € | Medium: Hundreds to thousands of € * | Low to medium: Hundreds of € * | ||
| Metric | Conventional Bike | E-Bike | BEV * | Conventional Motorcycle |
|---|---|---|---|---|
| Environmental impact (emissions and other products) | ||||
| Main Pollutants | ||||
| CO (g/km) | - | 0.02 3 | 2.1–8.47 2 | 1.7–5 6; 12.5–18 3 |
| NOx (g/km) | - | 0.06 3 | 0.11–0.37 2 | 0.05–0.15 3; 0.1–0.34 6 |
| HC (g/km) | - | - | 0.29–1.16 2 | 0.56–4.69 6 |
| PM10 (g/km) | - | 0.02 3 | - | 0.06–0.33 3 |
| PM2.5 (g/km) | - | 0.01 3 | - | 0.03–0.16 3 |
| SO2 (g/km) | - | 0.13 3 | - | 0 3 |
| HC (g/km) | - | 0.007 3 | - | - |
| CO2 (g/km) | - | 21.5 3 | 20.2–40.53; 308 | 40–553; 68–1056 |
| Production/Manufacturing Processes | ||||
| SO2 (kg) | 0.275 2 | 1.563 2 | 2.198 2 | 1 2 |
| PM (kg) | 1.176 2 | 5.824 2 | 8.173 2 | 4 2 |
| GHG(tones SCE) | 0.097 2 | 0.603 2 | 0.875 2 | 0.284 2 |
| Waste water (kg) | 393 2 | 1488 2 | 2092 2 | 1397 2 |
| Solid waste (kg) | 0.641 2 | 4.463 2 | 7.139 2 | 3 2 |
| Life Cycle of Lead Acid Battery Based Vehicles | ||||
| CO2 (g/km) | 4.7 3 | 15.6–31.2 3 | 20.2–40.5 3 | 64–128 3 |
| SO2 (g/km) | 0.01 3 | 0.07–0.14 3 | 0.09–0.17 3 | 0.04–0.08 3 |
| PM (g/km) | 0.06 3 | 0.07–0.14 3 | 0.1–0.19 3 | 0.2–0.4 3 |
| CO (g/km) | - | 0.007–0.014 3 | 0.009–0.017 3 | 6.3–12.5 3 |
| HC (g km) | - | 0.027–0.053 3 | 0.032–0.064 3 | 1.13–2.25 3 |
| NOx (g/km) | - | 0.01–0.02 3 | 0.014–0.027 3 | 0.08–0.15 3 |
| Pb (mg/km) | 0 3 | 145–290 3 | 210–420 3 | 16–32 3 |
| Energy impact | ||||
| Energy Used When Operating | ||||
| Energy consumption (MJ/user) | 0.25 10; 69.44 Wh | 0.19 9–0.52 1; 52.77–144.4 Wh | 4.68–14.97 1; 1300–4160 Wh | - |
| Energy per km (MJ/km) | 0.013 1; 3.62 Wh/km | 0.028 1; 7.78 Wh/km | 0.73 9; 203 Wh/km | 0.67–0.85 9; 186–236 Wh/km |
| Energy use (kWh/100 pax-km) | 4.88 3 | 3.8–7.6 3 | 4.9–9.9 3; 5.7 7 | 21–42 3 |
| Battery (kWh) | - | 0.36 9 | 1.68–5.4 9 | - |
| Energy Used Per Activity(KJ/PKT) | ||||
| Fuel production | 0 5 | 1.25 5 | - | 50–150 ** |
| Infrastructure | 126 5 | 126 5 | - | 200–500 ** |
| Maintenance | 5.5 5 | 5.5 5 | - | 60–150 ** |
| Manufacturing | 66 5 | 87 5 | - | 140–200 ** |
| Operation | 0 5 | 0 5 | - | 600–700 ** |
| Energy Used Per Life Cycle (MJ) | ||||
| Manufacture | - | 12,000 4 | 20,000 4 | - |
| Use | - | 87,000 4 | 265,000 4 | - |
| Disposal | - | 1200 4 | 3000 4 | - |
| Life cycle energy consumption | - | 102,000 4 | 288,000 4 | - |
| Metric | Conventional Bike | E-Bike | BEV * | Conventional Motorcycle |
|---|---|---|---|---|
| Weight of materials used | ||||
| Total weight (kg) | 15 6;17 3; 18 2 | 23 4–24 3; 26 1–41 2 | 65.8 2; 140 4–144 3; 80–208 5 | 90 3,4; 94 2 |
| Steel | 13 2 | 18.2 2 | 26.22 | 76.4 2 |
| Plastic | 2 2 | 5.7 2 | 15.22 | 9.1 2 |
| Lead | - | 10.3 2 | 14.72 | 1.7 2 |
| Nickel | - | - | - | 0.3 3 |
| Fluid | - | 2.92 | 4.22 | - |
| Copper | - | 2.62 | 3.52 | 1 2 |
| Rubber | 2 2 | 1.1 2 | 1.2 2 | 3.2 2 |
| Aluminum | 1 2 | 0.5 2 | 0.6 2 | 1.5 2 |
| Maintenance | 50%Plastic, 5%Steel 4 | 50%Plastic, 5%Steel 4 | 10%Steel, 10%Aluminum 4 | 10%Steel, 10%Aluminum 4 |
| Lead Acid Battery Losses (kg Per Battery) | ||||
| Battery weight | - | 10.3 kg 2 | 14.7 kg 2; 32 kg 4 | 1.7 kg 2 |
| Mining and concentration loss | - | 1.1–1.2 2 | 1.5–1.72 | 0.17–0.19 2 |
| Smelt loss (primary) | - | 0.4 2 | 0.6 2 | 0.06–0.07 2 |
| Smelt loss (sec.) | - | 0.9–1 2 | 1.3–1.4 2 | 0.14–0.16 2 |
| Manufacture loss | - | 0.5 2 | 0.7 2 | 0.082 |
| Total production emissions | - | 2.9–3 2 | 4.2–4.3 2 | 0.48–0.49 2 |
| Solid waste | - | 0–1 2 | 0–1.5 2 | 0–0.17 2 |
| Characteristic | Lead Acid | Li Ion | Supercapacitors | Hydrogen Fuel Cells | Ni-MH & Ni-Cd |
|---|---|---|---|---|---|
| Energy density (Wh/l) | 50–70 1; 50–90 4 | 150–200 1; 150–500 4 | 10–30 4; 3–180 6 | 500–3000 4 | 200 1; 170–420 4 |
| Power density (W/l) | 10–400 4 | 1500–10,000 4 | 100,000+ 4 | 500+ 4 | 80–600 4 |
| Specific energy (Wh/kg) | 20–40 1; 35 2; 25–50 4 | 100–200 1;<120–150 2; >200 3; 75–200 4; 150–350 5 | 0.05–15 4 | 100 5–10,000 4 | 40–60 1; <70 2; 70–100 4; 15–300 5 |
| Specific power (W/kg) | 300 1; 150–900 2; 75–300 4,5 | 300–800 1; <120–150 2; <150–2000 4 | 500–10,000 4 | 5–800 4; 500 5 | 130–500 1;<200 2 |
| Power range (MW) | 0–40 4; <20 5 | 0–100 4; <0.001 5 | 0–0.3 4 | 10–58.8 4; 0.3–50 5 | 0–40 4,5 |
| Rated energy capacity (MW h) | 0.001–40 4 | 0.004–10 4 | 0.0005 4 | 0.3–39 4 | 6.75 4 |
| Voltage (V) | 2.1 1,2 | 3.6 1,2 | 2.3–2.8 6 | - | 1.2 1,2 |
| Overall efficiency (%) | 85 1; 70–90 5 | 93 1; 85–95 5 | 82–98 5 | 33–42 5 | 60–73 5; 80 1 |
| Cycle efficiency (%) | 63–90 4 | 75–97 4 | 84–97 4 | 20–66 4 | 60–83 4 |
| Discharge efficiency (%) | 85 4 | 85 4 | 95–98+ 4 | 59 4 | 85 4 |
| Cycle life @80%DOD | 200 1; 500–1000 2 | < 2500 1;>1000 2 | 100,000–1,000,000 6 | - | > 2500 1; >2000 2 |
| Lifetime (years) | 5–15 4,5 | 5 5–16 4 | 10–30 4 | 5–20+ 4 | 3 4–20 5 |
| Life cycles (cycles) | 200–1800 4; 2000–4500 5 | 1000–20,000 4; 1500–4500 5 | >50,0005; >100,000 4 | 1000–20,000+ 4 | 2000 5–3500 4 |
| Self-discharge (%/Day) | 0.1–0.3 4,5 | 0.1 5–5 4 | 5–40 4 | Almost 0 4,5 | 0.03–0.6 4 |
| Fastest 80% recharge time (min) | 15 2 | <60 2 | - | - | 35 2 |
| Response time | Milliseconds, 1/4 cycle 4 | Seconds, <1/4 cycle 4,* | Milliseconds, <1/4 cycle 4 | ||
| Suitable storage duration | Minutes-days (short to medium term) 4,5 | Minutes-days (short to med. term) 4,5 | Seconds-hours (short term, <1 h) 4 | Hours-months 4,** | Minutes-days 4,5 |
| Discharge time at power rating | seconds-hours (up to 10 h) 4,5 | minutes-hours (1–8 h) 4,5 | miliseconds-1 h 4 | seconds-24 h+ 4 | seconds-hours (1–8 h) 4,5 |
| Operating and maintenance cost | 50 $/kW/year 4 | - | 0.005–6 $/kW-year 4 | 0.0019–0.0153 $/kW-year 4 | 50 $/kW/year 4 |
| Total capital cost, per unit of power rating (€/kW) | 1388–3254 5 | 2109–2746 5 | 214–247 5 | 2395–4674 5 | 2279–4182 5 |
| Total capital cost, per unit of storage capacity (€/kWh) | 346–721 5 | 456–560 5 | 691–856 5 | 399–779 5 | 596–808 5 |
| Maturity | Mature 4 | Demonstrated 4 | Demo./Developing 4 | Demo./Developing 4 | Demo. 4 |
| Characteristic | NCA | LMO/LTO | LFP | NMC | LMO-NMC |
|---|---|---|---|---|---|
| Nickel Cobalt Aluminum Oxide | Lithium Manganese/Titanium Oxide | Lithium Iron Phosphate | Nickel Manganese Cobalt Oxide | - | |
| Specific energy (Wh/kg) | 200–260 2 | 50–80 2 | 90–120 2 | 150–220 2 | - |
| Energy density (Wh/kg) | 130 7 | 857(LTO), 114 3–120 7 (LMO) | 93 3–130 7(poor 8) | 170 7 | 120–170 * |
| Power | Acceptable 7: 100–200 W | Good7: 200–500 W (LTO), Acceptable 7 | Acceptable 7 | Average 7: 50–100 W, AccepTable 8 | - |
| Energy consumption (Wh/km) | - | 105–214 3 | 114–223 3 | - | - |
| Energy capacity (kWh) | − | 24–34.2 1 | 18.5 4,5–24 3 | 26.6 1;63.5 3 | 24 1 |
| Nominal capacity (Ah) | - | - | 60 4; 40 9; 2.3 10; 90 12 | 2.3–12.4 5;40–50 6 | - |
| Nominal current (A) | - | - | 18.3 11; 40 4 | - | - |
| Nominal voltage (V) | 3.6 2; 3.65 7 | 2.4 2,7 (LTO); 3.8 2–4 7 (LMO) | 3.2 2,3; 3.3 2 | 3.6 (3.7) 2; 3.8–4 7 | 3.6–4 * |
| Charge (C-rate) | 0.7 C, (4.2 V), typical charge time 3 h 2 | 1 C, (2.85 V) 2 | 1 C typical, max.10 C 13 (3.65 V 4), typical charge time 3 h 2 | 0.7–1 C, (4.2 to 4.3 V), typical charge time 3 h 2 | - |
| Discharge (C-rate) | 1 C (3 V) 2 | 10 C (1.8 V) 2 | 1 C (2.5 V) 2,4; max.5 C-15 C 14 | 1 C, 2 C (2.5 V) 2 | - |
| Battery efficiency (%) | - | 95 1 | 82.3 (1.2 C)–94.5 (0.1 C) 4 | 95–96 1 | 95–96 * |
| Depth of discharge (%) | - | 70 3 | 70 3 | - | - |
| Cycle life | 500 2 | 2000–25,000 2; 1400–1500 3 | 1000–20002 | 1000–2000 2; 1500 5 | - |
| Cost ($ per kWh) | ~350 2 | ~1005 2 | ~580 2 | ~420 2 | - |
| Safety | Average 7, poor 8 | Good 7 (LTO), acceptable 7 | Good 7, acceptable 8 | Average 7, poor 8 | - |
| Characteristic | Supercapacitors (SC) | Li-Ion Battery | Hydrogen Fuel Cells | ||
|---|---|---|---|---|---|
| EDLC SC | Pseudo SC | Hybrid SCAsymmetric | |||
| Type of electrolyte | Aprotic or protic 1 | Protic 1 | Aprotic 1 | Aprotic 1 | - |
| Energy density (Wh/kg) | 5–20 4; 3–5 1; <6.5 2 | 10 1; <25 2 | 180 1; 20–30 2; <125 2 | 250 1; 120–200 2 | 100 3–10,000 6 |
| Power density (W/kg) | 1500 4; Up to 6000 2 | Up to 6000 2 | 10–1000 2 | 300–800 4; <120–150 5; <150–2000 6 | 5–800 6; 500 3 |
| Cell voltage (V) | 2.5 4; 2.7 1 | 2.3–2.8 1 | 2.3–2.8 1 | 3.6 1 | - |
| Charge time (s) | 1–10 1 | 1–10 1 | 100 1 | 600 1 | - |
| Life Cycles | 1,000,000 1 | 100,000 1 | 500,000 1 | 500 1; <2500 4; >1000 5 | 1000–20,000+ 6 |
| Overall efficiency (%) | 97 4; 82–98 3 | 82–98 3 | <90 2 | 85–95 4 | 33–42 3 |
| Self discharge per month (%) | 30 4; 60 1 | 60 1 | - | 4 1; 1–5 4 | 20 4 |
| Temperature of operation (°C) | −30–65 4; −40–65 1 | −40–65 1 | −40–65 1 | −20–60 1; −20–55 4 | - |
| Cost per kWh ($) | ~10,000 1; <1000 3; 2200 4 | ~10,000 1; <1000 3 | <1000 3; 300–2000 3 | 140 1; 500–600 3; 8004; 150 5; 600–3800 6 | 450–900 3 |
| Cost per kW ($) | 55 4; 100–450 6 | 55 5–4; 100–450 6 | 55 4; 100–450 6 | 55–80 5; 900–4000 6 | 20 4; 500–1500 6 |
| Metric | Li-Ion Battery | Fuel Cells | |
|---|---|---|---|
| Health (1) and Environmental Impact (2) for Production Phase | |||
| Unit | E-bike | Hydrogen bike | |
| (1) Carcinogens | kg C2H3Cleq | 0.0028 1 | 0.003 1 |
| (1) Non-carcinogens | kg C2H3Cleq | 0.0035 1 | 0.0035 1 |
| (1) Respiratory inorganics | kg PM2.5eq | 0.039 1 | 0.051 1 |
| (1) Ionizing radiation | Bq C-14 eq | Below 0.0001 1 | Below 0.0001 1 |
| (1) Ozone layer depletion | kg CFC-11 eq | Below 0.0001 1 | Below 0.0001 1 |
| (1) Respiratory organics | kg C2H4eq | Below 0.0001 1 | Below 0.0001 1 |
| (1) Human toxicity | kg 1.4-DB eq | 230 1 | 581 1 |
| (1) Particulate matter formation | kg PM10 eq | 0.52 1 | 1.04 1 |
| (1) Photochemical oxidant formation | kg NMVOC | 0.67 1 | 1.21 1 |
| (2) Aquatic ecotoxicity | kg TEG water | Below 0.0001 1 | Below 0.0001 1 |
| (2) Terrestrial ecotoxicity | kg TEG soil | 0.0035 1 | 0.0039 1 |
| (2) Terrestrial acid/nutri | kg SO2 eq | 0.0005 1 | 0.0007 1 |
| (2) Land occupation | m2org.arable | 0.0002 1 | 0.0002 1 |
| (2) Aquatic acidification | kg SO2 eq | 0.0001 1 | 0.0001 1 |
| (2) Aquatic eutrophication | kg PO4 P-lim | 0.0001 1 | 0.0001 1 |
| (2) Fossil depletion | kg oil eq | 41.2 1 | 66.2 1 |
| (2) Metal depletion | kg Fe eq | 118.5 1 | 176 1 |
| Climate Change (3) and Resources (4) for Production Phase | |||
| (3) Global warming | kg CO2 eq | 0.02 1; 165.2 2 | 0.023 1; 276.35 2 |
| (4) Non-renewable energy | MJ primary | 0.0155 1 | 0.018 1 |
| (4) Mineral extraction | MJ surplus | 0.0005 1 | 0.0013 1 |
| Health (1), Environmental Impact (2), and Climate Change (3) for Use Phase | |||
| Hybrid e-bike (Battery-FC) | E-bike | Hydrogen bike (FC) | |
| (1) Photochemical oxidant formation | 0.002 2 | 0.004 2 | 0.001 2 |
| (1) Particulate matter formation | 0.002 2 | 0.003 2 | 0.001 2 |
| (1) Human toxicity | 0.9 2 | 1.07 2 | 0.55 2 |
| (2) Fossil depletion | 0.2 2 | 0.4 2 | 0.07 2 |
| (2) Metal depletion | 0.49 2 | 0.51 2 | 0.31 2 |
| (3) Global warming | 0.8 2 | 1.42 2 | 0.31 2 |
| Metric | Hybrid E-Bikes (SC-Battery and FC-Battery) | E-Bike (Pedelec/Battery only, SC only) and Small E-Scooter | Big E-Scooter and E-Motorcycle (Battery only) |
|---|---|---|---|
| Specific energy (Wh/kg) | - | 32.7–51.4 1 | - |
| Energy expenditure (Wh/km) | - | 59.8 2 (CB:69.8 2); 6.92–8.57 6 | 202.86 2 (big EM) |
| Battery energy (MJ) | 4.52 19(SC-bat) | 0.25–0.52 12(CB: 0.1212);4.67 18 (SC only) | 5 12 (LEV) |
| SC energy (MJ) | 0.071 13 (SC only) | - | |
| Overall energy (Wh) | - | 155 1–360 1,2; 160 8 | 1680–2880 2; 5400 2 (big EM) |
| Power (W) | max.693 20 (SC-bat) | 250 7(small e-scooter); 250 1,3,8,9–800 1; max.: 539 3; max.: 731–950 11; 143–1018 15; 2 000 14 (big e-bike); 150–500 13 (SC only); | 2000 2–6000 2,21; 20,020 2 (big EM) |
| Battery capacity (Ah) | 12 19 (SC-bat) | 5.2 7 (small e-scooter); 5.4 1–10 1,3,9; 75 20 | 40–80 21 (big e-scooter); |
| Voltage (V) | 15–48 18;12–16 20 (SC-bat) | 48 3; 30 8; 36 1,9,10; 29.6 1; 12.73 20; 70–78 13 (SC only); | 74 21 (big e-scooter) |
| Current (A) | 8.816 (FC-Bat); 12.23 19 (SC-bat) | 18.39 19 | - |
| Charging time (hours) | - | 5 3 | - |
| Life Cycles | SC: 100,000–1,000,000 7; Li-Ion Battery: 500 4–800 3 | Li-Ion Battery:500 4–800 3 | - |
| Life expectancy (km) | 15,000 4 | 15,000 4,5; 24,000 22 | 50,000 4,5 |
| Trip autonomy (km) | - | 37–55 2; 46–82 12(CB: real, 4–8 2); real:25–30 10; 13–80 13 (SC only) | 26.6 2 (big EM); 100 21 (big e-scooter) |
| Battery type | Li-Ion 16 (FC-Bat) | Li-Po 3; Li-Ion 13 | Lithium-based, Lead-based 2 |
| Total weight (kg) | 23 5; 27.1 16(FC-Bat) | 18 19; 23 2–26 3,2; 20.2–28 1; 41.3–65.8 17 (big e-bike) | 90–144 3; ~140 5; 208 2 (big EM) |
| Weight ratio (vehicle/80 kg rider) | 0.28–0.34 * | 0.23–0.35 *; 0.51–0.82 * (big e-bike) | 1.12–1.8 *; 2.6 * (big EM) |
| Metric | Our Hybrid E-Bike | E-Bike (in %) | Big E-Scooter and E-Motorcycle (in %) |
|---|---|---|---|
| Battery energy (MJ) | 2.190; 608.33 Wh | 12–24% 1(CB: 6% 1) | 228% 1 (LEV) |
| SC energy (MJ) | 0.0148; 4.11 Wh | - | - |
| Overall energy (Wh) | 612.44 | 26 10–59% 2,10 | 276–473% 2; 887% 2 (big EM) |
| Maximum power (W) | 1800 | 8–56.5% 12; 14% 6(small e-scooter); 111% 11 (big e-bike) | 111 2–333% 2,15; 1112% 2 (big e-motorcycle) |
| Battery capacity (Ah) | 13 | 42 10–77% 3,8,10; 40% 6 (small e-scooter) | 308–616% 15 (big e-scooter) |
| Voltage (V) | 46.8 | 64 10–102% 3 | 158% 15 (big e-scooter) |
| Current (A) | 42 * | 44% 14 | - |
| Trip autonomy (km) | ~70* | 53–78.5% 2; 66–102% 1 (CB: real, 10% 2); real:40% 9 | 38% 2 (big EM); 142% 15 (big e-scooter) |
| Battery type | Li-Ion | Li-Po 3; Li-Ion 10 | Lithium-based, Lead-based 2 |
| Number of batteries replaced per lifetime | 1 | 275% 5 | 100% 4 |
| Life time (years) | 2–4 ** | 33–50% ** | - |
| Bike incl. chassis ($& kg) | 200$; 11.6 kg | 144% in kg 5 | 861% in kg 5 |
| Batteries ($& kg) | 250$; 3.1 kg | 84 5–97 9 % in kg; 332 13 % in kg | 1030% in kg 5 |
| SC + DC/DC converter ($& kg) | 250$;1.3 kg | - | - |
| Motor + AC/DC converter($& kg) | 400$; 11.5 kg | 18–22% in kg 5 | 46–56% in kg 5 |
| Total cost ($) | 1100 | ~200% 7 | - |
| Total weight (kg) | 27.5 | 65–101% 10; 140–234% 13 (big e-bike) | 324–518% 3; 720% 2 (big EM) |
© 2019 by the authors. Licensee MDPI, Basel, Switzerland. This article is an open access article distributed under the terms and conditions of the Creative Commons Attribution (CC BY) license (http://creativecommons.org/licenses/by/4.0/).
Share and Cite
Machedon-Pisu, M.; Borza, P.N. Are Personal Electric Vehicles Sustainable? A Hybrid E-Bike Case Study. Sustainability 2020, 12, 32. https://doi.org/10.3390/su12010032
Machedon-Pisu M, Borza PN. Are Personal Electric Vehicles Sustainable? A Hybrid E-Bike Case Study. Sustainability. 2020; 12(1):32. https://doi.org/10.3390/su12010032
Chicago/Turabian StyleMachedon-Pisu, Mihai, and Paul Nicolae Borza. 2020. "Are Personal Electric Vehicles Sustainable? A Hybrid E-Bike Case Study" Sustainability 12, no. 1: 32. https://doi.org/10.3390/su12010032
APA StyleMachedon-Pisu, M., & Borza, P. N. (2020). Are Personal Electric Vehicles Sustainable? A Hybrid E-Bike Case Study. Sustainability, 12(1), 32. https://doi.org/10.3390/su12010032