Abstract
This study seeks a scientific methodology for ecological leisure industry planners to contribute to a more ecologically friendly leisure industry. This study creates an environment suitability model (LIDES) for leisure industry development. This model sees the natural ecological environment as just as important as the artificial environment. This study identifies the following factors: suitable land, unsuitable land, park plaza, scenic spot, river system, global network reachability, local network reachability, business impact, industrial impact. The Spatial Syntax method is used to account for effects of the urban road network. This method is incorporated into a geographic information system-analytic hierarchy process (GIS-AHP) approach, thus developing this method further. The method is demonstrated in the leisure industry in Shapingba District of Chongqing, China. The final suitability index map for ecological leisure industry is divided into four types: highly suitable, moderately suitable, marginally suitable, and low suitability areas. As a result, 8.08% (42.55 km2) of the study area has low suitability, 82.61% (435.15 km2) has marginal suitability, 8.62% (45.42 km2) has moderate suitability and 0.69% (3.65 km2) has the best suitability for creating an ecological leisure industry area. Discussion and relevant suggestions are given for further research.
1. Introduction
With the rapid development of the leisure economy in recent years, an increasing number of cities focus on the development of the leisure industry. Short-term behaviour in pursuit of economic growth, here as well as in other industries, has destroyed the ecological environment [1]. In the early stages of leisure industry development, in order to increase economic benefits, tourist areas (including some protected areas) constructed a large number of entertainment facilities. The immediate economic benefits increased, but the ecological environment was damaged. Decades of this will not only lead to a decline in the quality of the leisure industry, but also to the loss of leisure functions, which will make the local leisure resource unsustainable [2].
The current situation of the leisure industry in China is that a supply and demand imbalance obstructs the rational development model and planning, due to a lack of proper guidance, lack of basic knowledge regarding the concept of leisure, and its generally weak foundation [3]. There is a lack of effective macro-control and regional guidance in the Chinese leisure industry. Most leisure projects are scattered and uncoordinated, and their lack of originality and the scale of the leisure industry has a detrimental impact on society and the environment [4]. This condition is not only a problem in the city studied in this research, but reflects the general problem of the entire leisure industry in China. Traditional leisure industry planning often does not consider wider sustainability goals or negative environmental impacts. It has become an urgent issue for governments, planners, and scholars to find a scientific methodology and develop theory from empirical case studies to solve this issue. Scholars also point out that the evidence of pollution shows that the leisure industry in China is unsustainable and that individuals must take greater responsibility for their actions if there is to be any change for the better [5].
In order to solve the root causes of this problem, this research needs to trace the root causes to the basic concepts. The development of a leisure economy has resulted in the emergence of a series of related concepts, such as leisure, leisure industry, and ecological leisure industry. The first author to see leisure as a kind of social phenomenon in modern research was Veblen, who explained his thoughts about leisure in his book The Theory of the Leisure Class. The publication of this book also marks the birth of leisure science in the United States [6]. More and more scholars began to explore leisure research [7,8,9]. However, there is no consensus regarding a common academic definition of “leisure” [10,11,12]. People’s understanding of leisure also changes over time [13,14,15]. We examined the literature and found that leisure can be defined in three ways. First, leisure is a concept of time [16,17,18]. Second, it is also a subjective activity and behaviour [19]. Finally, it is also the psychological orientation and mental state of the person [7,12,20,21]. The leisure industry first took root in North America and Western Europe in the early part of the 20th century, spreading rapidly to the rest of the world after the Second World War [22]. There has been no consensus among scholars around the world regarding the definition of “leisure industry” [23,24,25].
A concept of ecological leisure industry seems could alleviate this problem. An ecological leisure industry meets the needs of contemporary people’s leisure, and at the same time, does not damage the potential livelihoods of future generations [26]. We argue that an ecological leisure industry needs to combine the concept of sustainable development with ideas from industrial ecology. Firstly, sustainable development refers to a holistic approach and temporal processes that lead us to the endpoint of sustainability [27]. The sustainability target will be met by the leisure industry if the diversity and integrity of the environment, as well as the living conditions and status of the original residents of the area, are maintained or improved [28]. Industrial ecology is the study of the flows of materials and energy in industry and consumer activities, of the effects of these flows on the environment, and the influences of economic, political, regulatory, and social factors on the flow, use, and transformation of resources [29]. Industrial ecology looks at the functioning of natural ecosystems as a model for industrial systems [30]. This flow can be understood from two points of view. First, resources should be developed appropriately, and second, a predatory development model should not be used with natural resources. Tourists should also improve their ecological consciousness, avoiding harm to the environment. An ecological leisure industry can also be an opportunity to promote the value of nature protection areas and offer higher long-term profits to investing stakeholders [31]. The ecological leisure industry has increasingly gained environmental consciousness regarding services and products and is gradually considering the integration of environmental problems into the development of the sector [32].
The existing literature on the distribution of the leisure industry is mainly based on the general principles and theories of spatial distribution and the location of industries. According to the literature review, scholars usually study eco-tourism planning in combination with eco-leisure industry planning [33]. They also used data-based methods in the eco-tourism planning field [34,35]. Michel considered the core competitiveness of every factor of the leisure industry as regards its spatial distribution and formulated an industrial development planning strategy [36]. Mitchell and Murphy [37] studied a conceptual frame-of-reference that consists of a matrix based on two trichotomies, which, in a comprehensive spatial framework, helps to study all aspects of leisure tourism. Chinese scholars used Mitchell’s theory and a Shanghai case to identify the growth of domestic demand, policy-driven supply, and transportation networks as the three determinants of a spatial interaction model [38]. Goossen [39] classified the quality of leisure projects into utility quality and perceived quality and selected the environmental index, reachability index, water quality index and noise index as important quality evaluation indicators to judge the suitability of leisure projects. From the perspective of economic geography, Öner studied the market size demand of the leisure industry to support the planning location of eight leisure services in Sweden [40]. The geographic information system can be used for determining location suitability, resource inventory and non-contact areas to protect specific environments when studying ecological leisure industry [41]. The GIS-AHP method - a combination of analytic hierarchy process (AHP) and geographic information systems (GIS) can provide the planning or land suitability assessment by providing suitability mapping [42]. The GIS-AHP method could be applied to this research. According to reports of the use of GIS-AHP method [42,43,44], most research lacks the evaluation of traffic factors. Simple buffer evaluation methods do not take into account the effects of the urban road network, nor the public’s perspective on urban road proximity. This paper contributes to the definition of the ecological leisure industry by using point of interest data (POI) and spatial syntax to solve these two problems separately in this paper and to improve the GIS-AHP method, which is a more systematic way of studying the spatial distribution of the leisure industry layout. The park plaza and scenic spots, commercial impact, and industrial impact areas are derived from POI data. The spatial syntax is used to analyse the overall transport accessibility and local transport accessibility. These methodologies are used to map the sustainable land of the ecological leisure industry.
The structure of this paper is as follows: First, this paper clarifies the definition of leisure industry and ecological leisure industry. Section 3 provides the flowchart of the site selection model for the ecological leisure industry and creates the leisure industry development environment suitability model (LIDES). After an introduction to the study area, data sources and methods, the results of site selection that adopted the improved GIS-AHP method are presented, followed by a discussion. Finally, the authors identify relevant suggestions for further research.
2. Materials and Methods
2.1. Study Area
The Shapingba area is located in the eastern part of the Sichuan Basin. The Yanshan movement and the Himalaya movement made the Earth’s crust bend drastically and strongly, forming the Sichuan Basin. Other geomorphological patterns in the basin include the landforms of the Shapingba District, which comprise four main parts, including the Jinyun low-relief terrain, the western hilly area, the eastern hilly area, and the Gele low-relief terrain (Figure 1). Shapingba is a typical mountainous city, dissected by the river, with generally beautiful scenery. The district houses a range of leisure resources, including a strong historical and cultural heritage, making it a suitable place for the development of leisure industry. Although the mountainous terrain impedes the development of this area, resulting in a fragmented spatial layout.
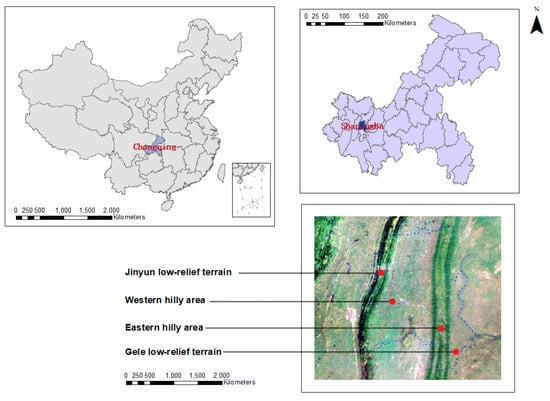
Figure 1.
Location of the Study Area. (Source: Own elaboration based on National Geographic Information Public Service Platform; the picture in the lower right corner is from Google.).
2.2. Data Sources
This paper collected data to be used in the AHP and the GIS spatial analysis (see also Section 3). For the first category, we selected various indices based on the literature review and eight expert interviews. Semi-structured interviews were used to identify the indices affecting the distribution of the ecological leisure industry. The experts then completed questionnaires to score the final nine indices on a Likert Scale [45]. The interviews and questionnaires were conducted in 2016, with university academics focused on ecological leisure industry layout, the president from the Chongqing Architectural Design Institution, and a section chief from Chongqing Shapingba District Tourism Bureau (See Table 1).

Table 1.
List of Interviewed Experts.
Data for the GIS analysis was derived from a variety of sources (Table 2). ArcGIS 10.2 and Depthmap 10.14 were used for the spatial analysis and spatial syntax calculation, respectively. Each data layer, such as land suitability, water area, and construction land, was obtained and summarised on a 50-m grid for spatial analysis.
Table 2.
List of Data and Data Sources.
2.3. Methods
Figure 2 presents the flowchart of the site selection model for the ecological leisure industry. The GIS-AHP method integrates the characteristics of AHP and GIS, maintaining the advantages they each have for solving spatial decision problems. We used the point of interest data (POI) and Space Syntax to improve the GIS-AHP method. The supplement to the GIS-AHP method treated as the creation of a new model is presented in Figure 2. The data analysis comprises two key steps: (1) constructing an analytic hierarchy process model: the leisure industry development environment suitability model (LIDES) (Figure 3) and (2) a spatial analysis combining AHP and GIS and spatial syntax and POI data.
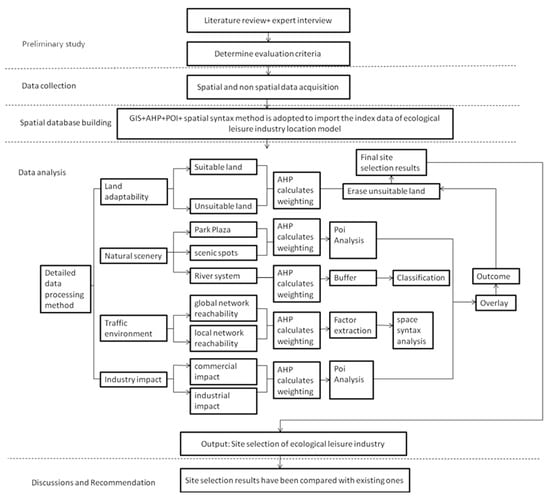
Figure 2.
Flowchart of the Site Selection Model of the Ecological Leisure Industry.
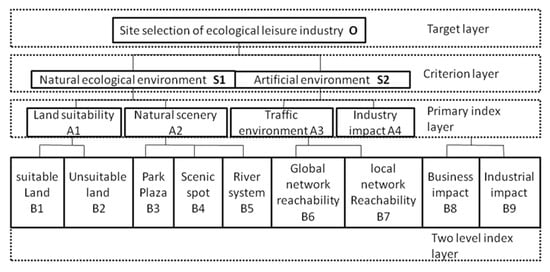
Figure 3.
The Site Selection Model of the Ecological Leisure Industry.
Several indices, including park squares, scenic spots, commercial impact, and industrial impact, are captured in the Baidu POI data, which is rasterised according to the evaluation criteria. The raster data is then analysed by buffer analysis in GIS, and the results of each index are obtained by reclassification. Taking the most complicated factor as an example; the traffic environment is processed by spatial syntax. First of all, the traffic data analysis used Arc GIS 10.2 software to extract all the main roads and some secondary roads and rail transit networks in the road network planning of the Chongqing city master plan (2007–2020), which are imported into Depthmap for spatial syntax-dependent variables calculation and then saved as mif formatted files. In this paper, the raster cell size is set to 50m × 50m, and five spatial syntactic parameters are defined. The spatial syntax calculation results are then imported into the model. The global integration radius is set to 1600. The kernel density estimation method is used in the GIS platform to convert the linear data into surface raster data, which is the distribution of kernel density.
2.3.1. Analytic Hierarchy Process (AHP) Model
AHP is a method to organise and analyse complex decisions [46]. In AHP, several sub-criteria (indices) are added up for their respective criteria, which are weighted and aggregated according to their impact on a predefined goal or target [47]. AHP can then be used to compare different alternatives affecting indices in different ways and, hence, affecting the overall goal differently [48]. The establishment of each index in this paper was based on a literature review [49,50,51] and expert interviews, combined with the ecological leisure industry definition and main regional conditions to identify the index of the site selection model for ecological leisure industry. The goal of the AHP is to select a site for the ecological leisure industry, established by two criteria: natural ecological environment and artificial environment [52]. The impact factors are stratified in the target layer, criterion layer, and index layer respectively. The index layer is divided into the primary index layer and the secondary index layer (Figure 3). Indices are suitable land, unsuitable land, park plaza, scenic spot, river system, global network reachability, local network reachability, business impact, industrial impact.
Finally, the index weight is calculated according to the comparison judgment matrix.
2.3.2. Spatial Analysis
Methods in this process include GIS spatial analysis and spatial syntax to extract the POI data from each index. The evaluation criteria and weight description blank serve as a connection between the previous study and further study (Table 3). Taking artificial environmental factors as an example, it was divided into four major criteria index, which was also called a four primary criteria layer: global network accessibility, local network accessibility, commercial impact, and industrial impact. According to the evaluation criteria, the park square and scenic spots, river system, and global and local accessibility were classified into five grades, and 1–5 points were evaluated. One denotes, taking the park plaza in this criteria index as an example, that this area is 1200 m away from any of the parks or plazas. The value 1 represents that this area is between 1,000 and 1,200 m away from the park or plaza.
Table 3.
Evaluation Criteria and Weight Description.
Commercial and industrial impacts were classified into two grades. The closer to business a site is, the better the conditions for forming the ecological leisure industry existed, and the higher the score is evaluated on the commercial impact index. However, the closer to the factory a site is, the higher the environmental pollution, and so a lower score is evaluated on the industrial impact index. A grid classification diagram for each criteria layer can be obtained to determine the evaluation criteria and score by consulting data and doing an on-the-spot survey. The weights of the criteria index were obtained from the above research (Table 4), preparing for the use of a weighted overlay for a suitable map for the ecological leisure industry in Shapingba.
Table 4.
The Comparison Judgment Matrix of O-S-A Each Index and A2-B, A3-B, A4-B, A5-B.
2.3.3. Spatial Syntax
Spatial form and function affect traffic routes in a region. Changes to the spatial layout and structure of the ecological leisure industry need to take the accessibility of the global and local road networks into account.
Global reachability refers to the difficulty of reaching the other ecological leisure industry attraction points in the study area (Shapingba) from any other ecological leisure industry attraction point in the study area (Shapingba). We considered the spatial relations between all roads in Shapingba area using the GInteg measure spatial syntax and the degree of dispersion and aggregation of other roads in the study area:
The depth value is the axis number from any axis in the study area to the shortest distance from the nearest axis of the ecological leisure industry attraction point. The average depth value is the average value of all the depth values of the ecological leisure industry attraction point. Where MDi is the average depth of the destination on behalf of the i; n is the total number of roads.
Local accessibility is measured on a finer scale, which indicates the difficulty of reaching an adjacent ecological leisure industry attraction point from the location of the study area. The local reachability of the Shapingba study area is measured by the degree of dispersion and aggregation of the nearest road axis and the nearby road axis, using the local integration degree (LInteg) in the space syntax. The calculation method is similar to that for the global integration degree, and a final kernel density analysis diagram is used to compare the local integration degree (LInteg) and the global integration degree (GInteg).
2.3.4. Points of Interest (POI)
POIs (points of interest) comprise all kinds of urban facilities, such as urban infrastructure, and developing and natural information hotspots, and are thus a useful tool for planning professionals. Integrated POI hotspot information can be a quantitative data source for urban development planning and industrial layout and location, and can also provide decision support. In this method, the nearer the target is, the larger the radiation value. For example, we can see each index evaluation criteria from Table 3: if an area is closer to the scenic spots, this area will be evaluated with a high score, from 1–5 points, the index must all comply with the evaluation criteria. Scenic spots and park squares, and the impact of commercial areas and industries are analysed with POI in this paper (Figure 2).
2.3.5. Kernel Density Estimation
Kernel density is estimated by drawing a circular region around each sample point and using the kernel function to calculate the smooth and continuous surface according to each sample point [53]. The application transforms the results of the kernel spatial syntax from kernel data into raster data for GIS.
Where K is the kernel function; H is the bandwidth, and n is the number of known points in the bandwidth range. The distribution POI is generally analysed using a Euclidean distance point model, but a large number of kernel density estimates has replaced the distribution analysis of POI. The reason for this is that spatial density estimation based on Euclidean distance ignores the global accessibility of roads, and the assumption of spatial homogenization is too ideal. It is easy to overestimate the degree, size, and scope of POI aggregation, and consequently, kernel density estimation is one of the most scientific and effective contemporary methods.
3. Results
3.1. Determination of Weight Value for Each Criterion
The factors influencing the suitability of the environment for the leisure industry were rated according to the expert scoring method, by constructing a comparison judgment matrix, combining the judgment matrixes of the first level index and the second-grade index. All factors from the primary index layer were compared in pairs with the AHP method, using Saaty’s scale [46] which is numbered from 1–9, and its reciprocal as the comparison scale, in order to construct the judgment matrix A = (bij) nn, in which bij indicates the impact of various factors on the target.
The calculation steps are as follows: the elements of A are multiplied by a column to get a new vector; each component of the new vector is opened n times; the result of these steps is the weight vector of each index (Table 5).
Table 5.
Weight of Each Index.
Where λmax is the largest eigenvalue; CR is the consistency ratio index; RI is the experience value. If it is a one or two order matrix, then CR is generally 0. Saaty [54] suggests that if it is above the two order matrix, meeting the CR < 0.1, then this factor can go through the next step. As can be seen from Table 6, CR < 0.10, and therefore, the judgment matrix satisfies consistency checking. The weight values (Table 3) can be applied to GIS spatial analysis.
Table 6.
Test Results of Consistency of Each Judgment Matrix.
3.2. Evaluating Results of Each Criterion
3.2.1. Natural Ecological Environment
Evaluation results of natural ecological environment criterion is showed in Table 7 specific graphic information in the Figure 4. For evaluating results of park plazas, the results showed that in the West and southeast of Shapingba District, the scores are higher. For evaluating results of scenic spots, the results showed that the scores are higher in the middle and southeast of Shapingba District. For evaluating results of the river system, there are two main rivers: Jialing River and Liangtan River, as well as other small river systems belonging to the Yangtze River system. Therefore, in general, the distribution of Shapingba river system is good, which is suitable for the ecological leisure industry.
Table 7.
Evaluation Results of Natural Ecological Environment Criterion.


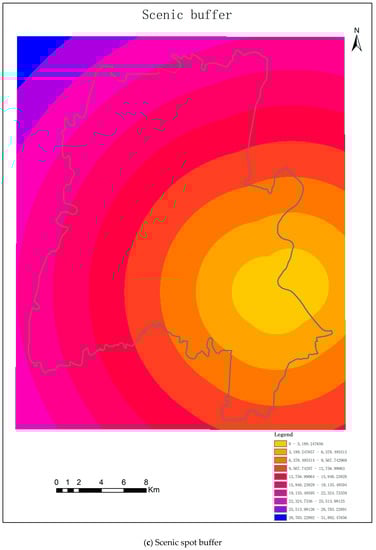


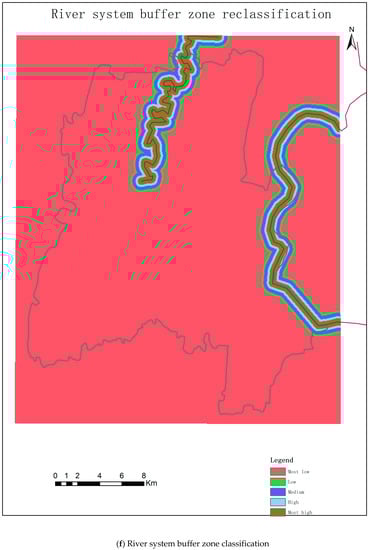
Figure 4.
Evaluating Results of Each Criterion in the Natural Ecological Environment (a–f).
3.2.2. Artificial Environment
Evaluation results of artificial environment criterion is showed in Table 8 and specific graphic information in the Figure 5. This paper compared the evaluation of results of global network reachability and the evaluation of results of local network reachability. However, different from the local accessibility, the area with better global accessibility is wider and more roads are radiated. Compared with the actual situation, it is found that the results of spatial syntax analysis are highly consistent with the actual situation: such as the Shapingba southeast cluster area, University Town, and the Xiyong town area. These areas with strong accessibility also face traffic jams. The reason for the high density and accessibility of the road network in the southeast cluster area of Shapingba is that the southeast of Shapingba District is close to other areas of Chongqing.
Table 8.
Evaluation Results of Artificial Environment Criterion.


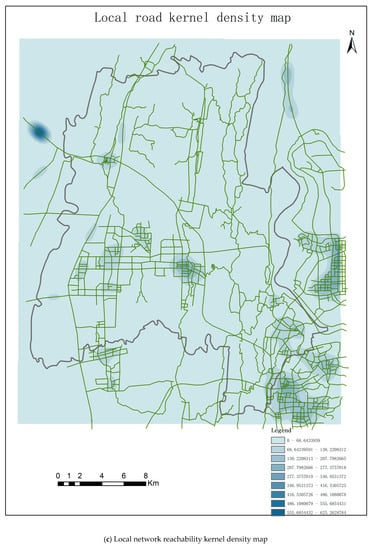


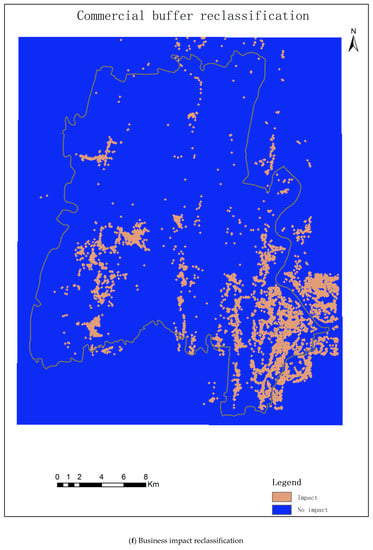

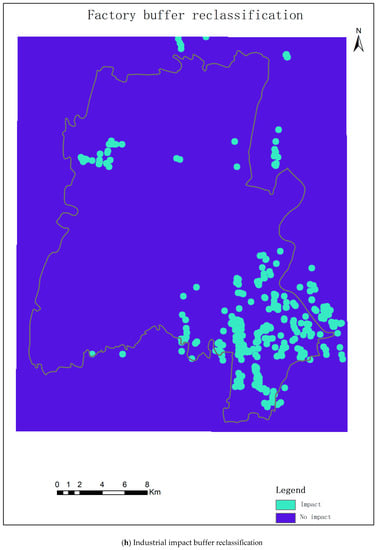
Figure 5.
Evaluating Results of Each Criterion in Artificial Environment (a–h).
For evaluating the results of business impact, the results show that the Shapingba District has a high degree of commerce, and these areas of commerce are mainly concentrated in the south, the new area of university town mainly in the southwest, and the old urban area mainly in the southeast. These areas have a good commercial foundation for leisure industry construction. For evaluating the results of industrial impact, the results show that the Shapingba factories are mainly concentrated in the old urban area in the southeast, as well as in the southwest and north. The yellow area on the right side of Figure 5d is the area with the greatest industrial impact. If the impact of industrial area on the surrounding areas cannot be solved in terms of technology, these areas are not suitable for the layout of leisure industry.
3.3. General Evaluation of the Suitability Index Map for the Ecological Leisure Industry
A suitability index map was determined by the improved GIS-AHP method for the logical location of an ecological leisure industry site in Shapingba, Chongqing, China according to the standard layer weights for the grid overlay analysis, using the grid calculator tool, by the equal interval. The analysis results are divided into four types: highly suitable, moderately suitable, marginally suitable, and low suitability areas. As a result, 8.08% (42.55 km2) of the study area has low suitability, 82.61% (435.15 km2) has marginal suitability, 8.62% (45.42 km2) has moderate suitability and 0.69% (3.65 km2) has the best suitability for an ecological leisure industry area.
4. Discussion and Implications
Compared with the outcome of each criteria analysis, the study revealed strong associations between the suitability map for the ecological leisure industry and indices such as traffic environment index, natural scenery, and industry impact. The results show that the river system has significance for a spatial pattern of ecological leisure industry (comparing Figure 4f and Figure 6). The higher the average score of the ecological leisure industry site, the closer to the rivers.
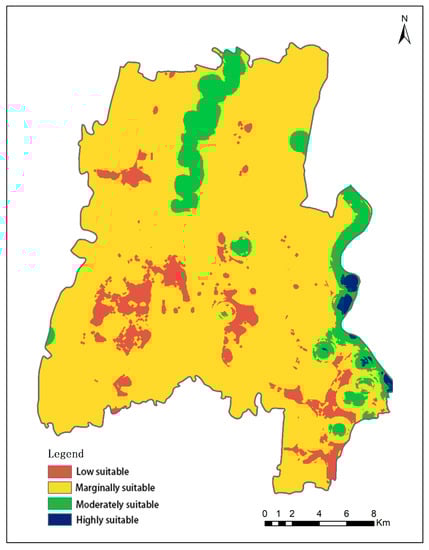
Figure 6.
The Suitability Index Map for Ecological Leisure Industry in Shapingba, Chongqing, China.
Based on the analysis of the suitability index map and ecological leisure industry requirement, this study recommends four types of sites. First, the ‘Highly suitable’ category is located in the southwestern parts of Shapingba. The old southeast Shapingba city area has excellent traffic accessibility and a high degree of commercialization. The distribution of park squares and scenic spots is also concentrated in this area, and the river system is in excellent condition, so most of the leisure industry is concentrated in this area. The leisure industry in the old city is not part of the ecological leisure industry defined in this analysis. Therefore, the existing leisure industry that takes advantage of the location should actively optimise and upgrade, change the extensive management mode of the past, adjust the structure development of the old urban area, and promote the harmonious and healthy development of the whole area’s ecological leisure industry. Second, the ‘Moderately suitable’ category is mainly located in the river area. This category involves the most sensitive area. It is a very suitable area for ecological leisure industry. However, there are sensitive area attributes; the area can only allow some activities that do not affect the original environment, such as education and site seeing. Large scale human activities will lead to disaster and threaten this sensitive area [55]. This category development should consider government guidelines and limitations. Third, the ‘Marginally suitable’ category is located in 82.61% of Shangpingba. This area can be considered for ecological leisure industry construction work and passive tourist activities. Fourth, the ‘low suitability areas’ category is 8.08% of Shangpingba.
5. Conclusions and Suggestion
With the era of the leisure economy, the local government has a new understanding and set of thoughts about the ecological leisure industrial space and structure. The distribution of the leisure industry affects the economic structure of a region, but also the competitiveness of the city and even the country. The economic structures forming regional ecological leisure industrial planning are difficult to change, and the impact is long-lasting; however, it is tough to determine a scientific basis for ecological leisure industrial planning. The judgement of whether the industrial layout is of high quality has been based on economic benefits only, which is just one side of sustainable development. Among the factors determining the distribution of the industry, natural elements are essential constituents. If one element is missing, this will compromise sound planning.
In this study, we proposed a more scientific way to solve the above problem. We conducted expert interviews to create the leisure industry development environment suitability model (LIDES). This model sees the natural ecological environment as just as necessary as the artificial environment. Based on a literature review, we improved the GIS-AHP by adding a point of interest (POI) and space syntax approaches. The findings demand further exploration including coping with further limitations. The selection of impact factors was mainly based on the goals of the leisure industry development environment suitability model (LIDES) in the improved AHP; a large amount of work has already been done for the literature research and obtaining experts’ interviews and surveys. There are also cases where the evaluation index is illogical or missing. The experts are involved in the project assigned weights to each index [56]. This method has been criticised for lacking objectivity, even though it is the experts’ work that is related to our research. The indicators should, therefore, be more scientific and quantitative in the future.
In order to carry out ecological leisure industry planning in China, we must acquire experience in urban construction and reconstruction at an early stage to rationally optimise the industrial structure, effectively allocate social and natural resources, optimise industrial layout, and explore new growth modes. The social and academic development of cutting-edge knowledge combined in this study, to seek a better ecological leisure industry spatial organisation model based on a database analysis method. At the same time, support for developing the ecological leisure industry in the Chongqing District of Shapingba should also follow the general implementation of the “13th Five-Year” plan. The government is making relevant policies, actively guiding and promoting the construction of ecological development of the leisure industry in Shapingba district, in an effort to solve the problem of single industry structure in ecological leisure industry. The ecological leisure industry should be considered as a part of the entire material energy exchange cycle of the whole society [57].
Author Contributions
T.D. contributed to the research concepts, methods, investigation, data collection, formal analysis, weight calculation, manuscript writing, and editing. C.F. and P.X. and H.V. provided editing and research advice. I am grateful to the editorial board of this journal and the anonymous reviewers for their comments. All authors have read and agreed to the published version of the manuscript.
Funding
This article was supported by the China Scholarship Council and Chongqing Shapingba District Science Committee through the Mandatory Plan Project of Soft Science Research (grant no. PJ20140031).
Acknowledgments
The author would like to thank the Shapingba District Tourism Bureau administrative support and all the experts who have contributed to the model. The authors are grateful to the editors and anonymous reviewers.
Conflicts of Interest
The authors declare no conflict of interest.
References
- Hill, J.L.; Gale, T. Ecotourism and Environmental Sustainability: Principles and Practice; Ashgate Publishing, Ltd.: Farnham, UK, 2009. [Google Scholar]
- Vaugeois, N.; Parker, P.; Yang, Y. Is leisure research contributing to sustainability? A systematic review of the literature. Leis. Loisir 2017, 41, 297–322. [Google Scholar] [CrossRef]
- Tribe, J. The Economics of Recreation, Leisure and Tourism; Routledge: Abingdon-on-Thames, UK, 2011. [Google Scholar]
- Qu, F.; Sun, R.; Guo, Z.; Yu, F. Ecological Economics and Harmonious Society; Springer: Berlin/Heidelberg, Germany, 2016. [Google Scholar]
- Pegg, S. Finding leisure in China. Ann. Leis. Res. 2018, 21, 254–256. [Google Scholar] [CrossRef]
- Veblen, T. The Theory of the Leisure Class; Routledge: Abingdon-on-Thames, UK, 2017. [Google Scholar]
- Pieper, J. Leisure: The Basis of Culture; Ignatius Press: San Francisco, CA, USA, 2009. [Google Scholar]
- Stebbins, R.A. Casual leisure: A conceptual statement. Leis. Stud. 1997, 16, 17–25. [Google Scholar] [CrossRef]
- Kelly, J.R. Leisure; Prentice-Hall International, Inc.: Upper Saddle River, NJ, USA, 1990. [Google Scholar]
- Heintzman, P. Leisure Sciences and the Humanities. Leis. Sci. 2018, 40, 36–42. [Google Scholar] [CrossRef]
- Johnson, C.W.; Parry, D.C.; Wagler, F.-A. Introduction to the Special Issue Looking Back, Looking Forward: 40 Years of Leisure Sciences. Leis. Sci. 2018, 40, 1–8. [Google Scholar] [CrossRef]
- Roberts, K. Leisure: The importance of being inconsequential. Leis. Stud. 2011, 30, 5–20. [Google Scholar] [CrossRef]
- Watkins, M.N. A longitudinal study of changeability in leisure meanings. Leis. Stud. 2010, 29, 361–376. [Google Scholar] [CrossRef]
- Henderson, K.A.; Bialeschki, M.D. Leisure and active lifestyles: Research reflections. Leis. Sci. 2005, 27, 355–365. [Google Scholar] [CrossRef]
- Rui, S. Review on Domestic and Foreign Leisure Research: On the Establishment of Leisure Discipline in China. Tour. Trib. 2004, 3, 008. [Google Scholar]
- Sylvester, C. Fiftieth Anniversary of Time, Work, and Leisure; Taylor & Francis: Abingdon, UK, 2013. [Google Scholar]
- Robinson, J.; Godbey, G. Time for Life: The Surprising Ways Americans Use Their Time; Penn State Press: University Park, PA, USA, 2010. [Google Scholar]
- Chenu, A.; Lesnard, L. Time use surveys: A review of their aims, methods, and results. Eur. J. Sociol. Arch. Eur. Sociol. 2006, 47, 335–359. [Google Scholar] [CrossRef]
- Kelly, J.R.; Freysinger, V.J. 21st Century Leisure: Current Issues; Allyn & Bacon: Boston, MA, USA, 2000. [Google Scholar]
- Iso-Ahola, S.E. Ahola, S.E. A psychological analysis of leisure and health. In Work, Leisure and Well-Being; Routledge: Abingdon-on-Thames, UK, 2006; pp. 143–156. [Google Scholar]
- Heintzman, P.; Mannell, R.C. Spiritual functions of leisure and spiritual well-being: Coping with time pressure. Leis. Sci. 2003, 25, 207–230. [Google Scholar] [CrossRef]
- Harvey, J.; Whitson, D. Leisure Industries. Loisir Soc. Soc. Leis. 2004, 27, 17–21. [Google Scholar] [CrossRef]
- García, M.; Fernandez, Y.; Zobio, J. The Economic Dimension of the Culture and Leisure Industry in Spain: National, Sectoral and Regional Analysis. J. Cult. Econ. 2003, 27, 9–30. [Google Scholar] [CrossRef]
- Park, S.; Kim, N.; Ahn, H.; Kang, H. The Domestic Leisure Industry Overview and Growth Outlook. HANAIF Publ. 2008, 11. [Google Scholar]
- Karlis, G. The future of leisure, recreation and sport in Canada: A SWOT for small sized enterprises. Sport J. 2006, 9. [Google Scholar]
- Gordon, C. Sustainable leisure. Ecos 1991, 12, 7–13. [Google Scholar]
- Williams, O.F. Sustainable Development: The UN Millennium Development Goals, the UN Global Compact, and the Common Good; University of Notre Dame Press: Notre Dame, IN, USA, 2014. [Google Scholar]
- Honey, M. Ecotourism and Sustainable Development: Who Owns Paradise? Island Press: Washington, DC, USA, 2008. [Google Scholar]
- Lifset, R.; Graedel, T.E.; Ayres, R.U.; Ayres, L. Industrial ecology: Goals and definitions. In A Handbook of Industrial Ecology; Edward Elgar Publishing: Cheltenham, UK, 2017. [Google Scholar]
- Idowu, S.O.; Capaldi, N.; Zu, L.; Gupta, A.D. Encyclopedia of Corporate Social Responsibility; Springer: New York, NY, USA, 2013; Volume 21. [Google Scholar]
- Ok, K. Multiple criteria activity selection for ecotourism planning in Igneada. Turk. J. Agric. For. 2006, 30, 153–164. [Google Scholar]
- Beard, C. The Outdoor Leisure Industry and the Environment. Horizons 1998, 2, 8–11. [Google Scholar]
- Travis, A.S. Planning for Tourism, Leisure and Sustainability: International Case Studies; CABI: Wallingford, UK, 2011; pp. xxv + 330 pp. [Google Scholar] [CrossRef]
- Fung, T.; Wong, F.K.K. Ecotourism planning using multiple criteria evaluation with GIS. Geocarto Int. 2007, 22, 87–105. [Google Scholar] [CrossRef]
- Ullah, K.M.; Hafiz, R. Finding suitable locations for ecotourism development in Cox’s Bazar using Geographical Information System and Analytical Hierarchy Process. Geocarto Int. 2014, 29, 256–267. [Google Scholar] [CrossRef]
- Page, S.J.; Hall, C.M. The Geography of Tourism and Recreation: Environment, Place and Space; Routledge: Abingdon-on-Thames, UK, 2014. [Google Scholar]
- Mitchell, L.S.; Murphy, P.E. Geography and tourism. Ann. Tour. Res. 1991, 18, 57–70. [Google Scholar] [CrossRef]
- Wu, B.; Cai, L.A. Spatial Modeling: Suburban Leisure in Shanghai. Ann. Tour. Res. 2006, 33, 179–198. [Google Scholar] [CrossRef]
- Goossen, M.; Langers, F. Assessing quality of rural areas in the Netherlands: Finding the most important indicators for recreation. Landsc. Urban Plan. 2000, 46, 241–251. [Google Scholar] [CrossRef]
- Öner, Ö.; Klaesson, J. Location of leisure: The new economic geography of leisure services. Leis. Stud. 2017, 36, 203–219. [Google Scholar] [CrossRef]
- Orsato, R.J. The Ecological Modernisation of Industry: Developing Multi-Disciplinary Research on Organisation & Environment; University of Technology Sydney: Sydney, Australia, 2001. [Google Scholar]
- Javadian, M.; Shamskooshki, H.; Momeni, M. Application of sustainable urban development in environmental suitability analysis of educational land use by using AHP and GIS in Tehran. Procedia Eng. 2011, 21, 72–80. [Google Scholar] [CrossRef]
- Bunruamkaew, K.; Murayam, Y. Site suitability evaluation for ecotourism using GIS & AHP: A case study of Surat Thani province, Thailand. Procedia -Soc. Behav. Sci. 2011, 21, 269–278. [Google Scholar]
- Ying, X.; Zeng, G.-M.; Chen, G.-Q.; Tang, L.; Wang, K.-L.; Huang, D.-Y. Combining AHP with GIS in synthetic evaluation of eco-environment quality—A case study of Hunan Province, China. Ecol. Model. 2007, 209, 97–109. [Google Scholar] [CrossRef]
- Al-Harbi, K.M.A.-S. Application of the AHP in project management. Int. J. Proj. Manag. 2001, 19, 19–27. [Google Scholar] [CrossRef]
- Saaty, T.L. Decision making with the analytic hierarchy process. Int. J. Serv. Sci. 2008, 1, 83–98. [Google Scholar] [CrossRef]
- Schmoldt, D.; Kangas, J.; Mendoza, G.A.; Pesonen, M. The Analytic Hierarchy Process in Natural Resource and Environmental Decision Making; Springer: Berlin/Heidelberg, Germany, 2013; Volume 3. [Google Scholar]
- Wang, J.; Chen, Q. Strategic decision making: Applying the analytic hierarchy process. Interfaces 2005, 35, 260–261. [Google Scholar]
- Zhong, L.; Deng, J.; Song, Z.; Ding, P. Research on environmental impacts of tourism in China: Progress and prospect. J. Environ. Manag. 2011, 92, 2972–2983. [Google Scholar] [CrossRef] [PubMed]
- Zucca, A.; Sharifi, A.M.; Fabbri, A.G. Application of spatial multi-criteria analysis to site selection for a local park: A case study in the Bergamo Province, Italy. J. Environ. Manag. 2008, 88, 752–769. [Google Scholar] [CrossRef] [PubMed]
- Aronsson, L. Sustainable tourism systems: The example of sustainable rural tourism in Sweden. J. Sustain. Tour. 1994, 2, 77–92. [Google Scholar] [CrossRef]
- Li, W. Environmental management indicators for ecotourism in China’s nature reserves: A case study in Tianmushan Nature Reserve. Tour. Manag. 2004, 25, 559–564. [Google Scholar] [CrossRef]
- Karunamuni, R.J.; Zhang, S. Some improvements on a boundary corrected kernel density estimator. Stat. Probab. Lett. 2008, 78, 499–507. [Google Scholar] [CrossRef]
- Saaty, T.L. Analytic hierarchy process. In Encyclopedia of Operations Research and Management Science; Springer: Berlin/Heidelberg, Germany, 2013; pp. 52–64. [Google Scholar]
- Ritchie, J.R.B. Managing the Human Presence in Ecologically Sensitive Tourism Destinations: Insights from the Banff-Bow Valley Study. J. Sustain. Tour. 1998, 6, 293–313. [Google Scholar] [CrossRef]
- Ramanathan, R. A note on the use of the analytic hierarchy process for environmental impact assessment. J. Environ. Manag. 2001, 63, 27–35. [Google Scholar] [CrossRef] [PubMed]
- Fang, Y.; Cote, R.P.; Qin, R. Industrial sustainability in China: Practice and prospects for eco-industrial development. J. Environ. Manag. 2007, 83, 315–328. [Google Scholar] [CrossRef]
© 2019 by the authors. Licensee MDPI, Basel, Switzerland. This article is an open access article distributed under the terms and conditions of the Creative Commons Attribution (CC BY) license (http://creativecommons.org/licenses/by/4.0/).