Integrating Ecosystem Services and Human Demand for a New Ecosystem Management Approach: A Case Study from the Giant Panda World Heritage Site


Abstract
1. Introduction
2. Methods
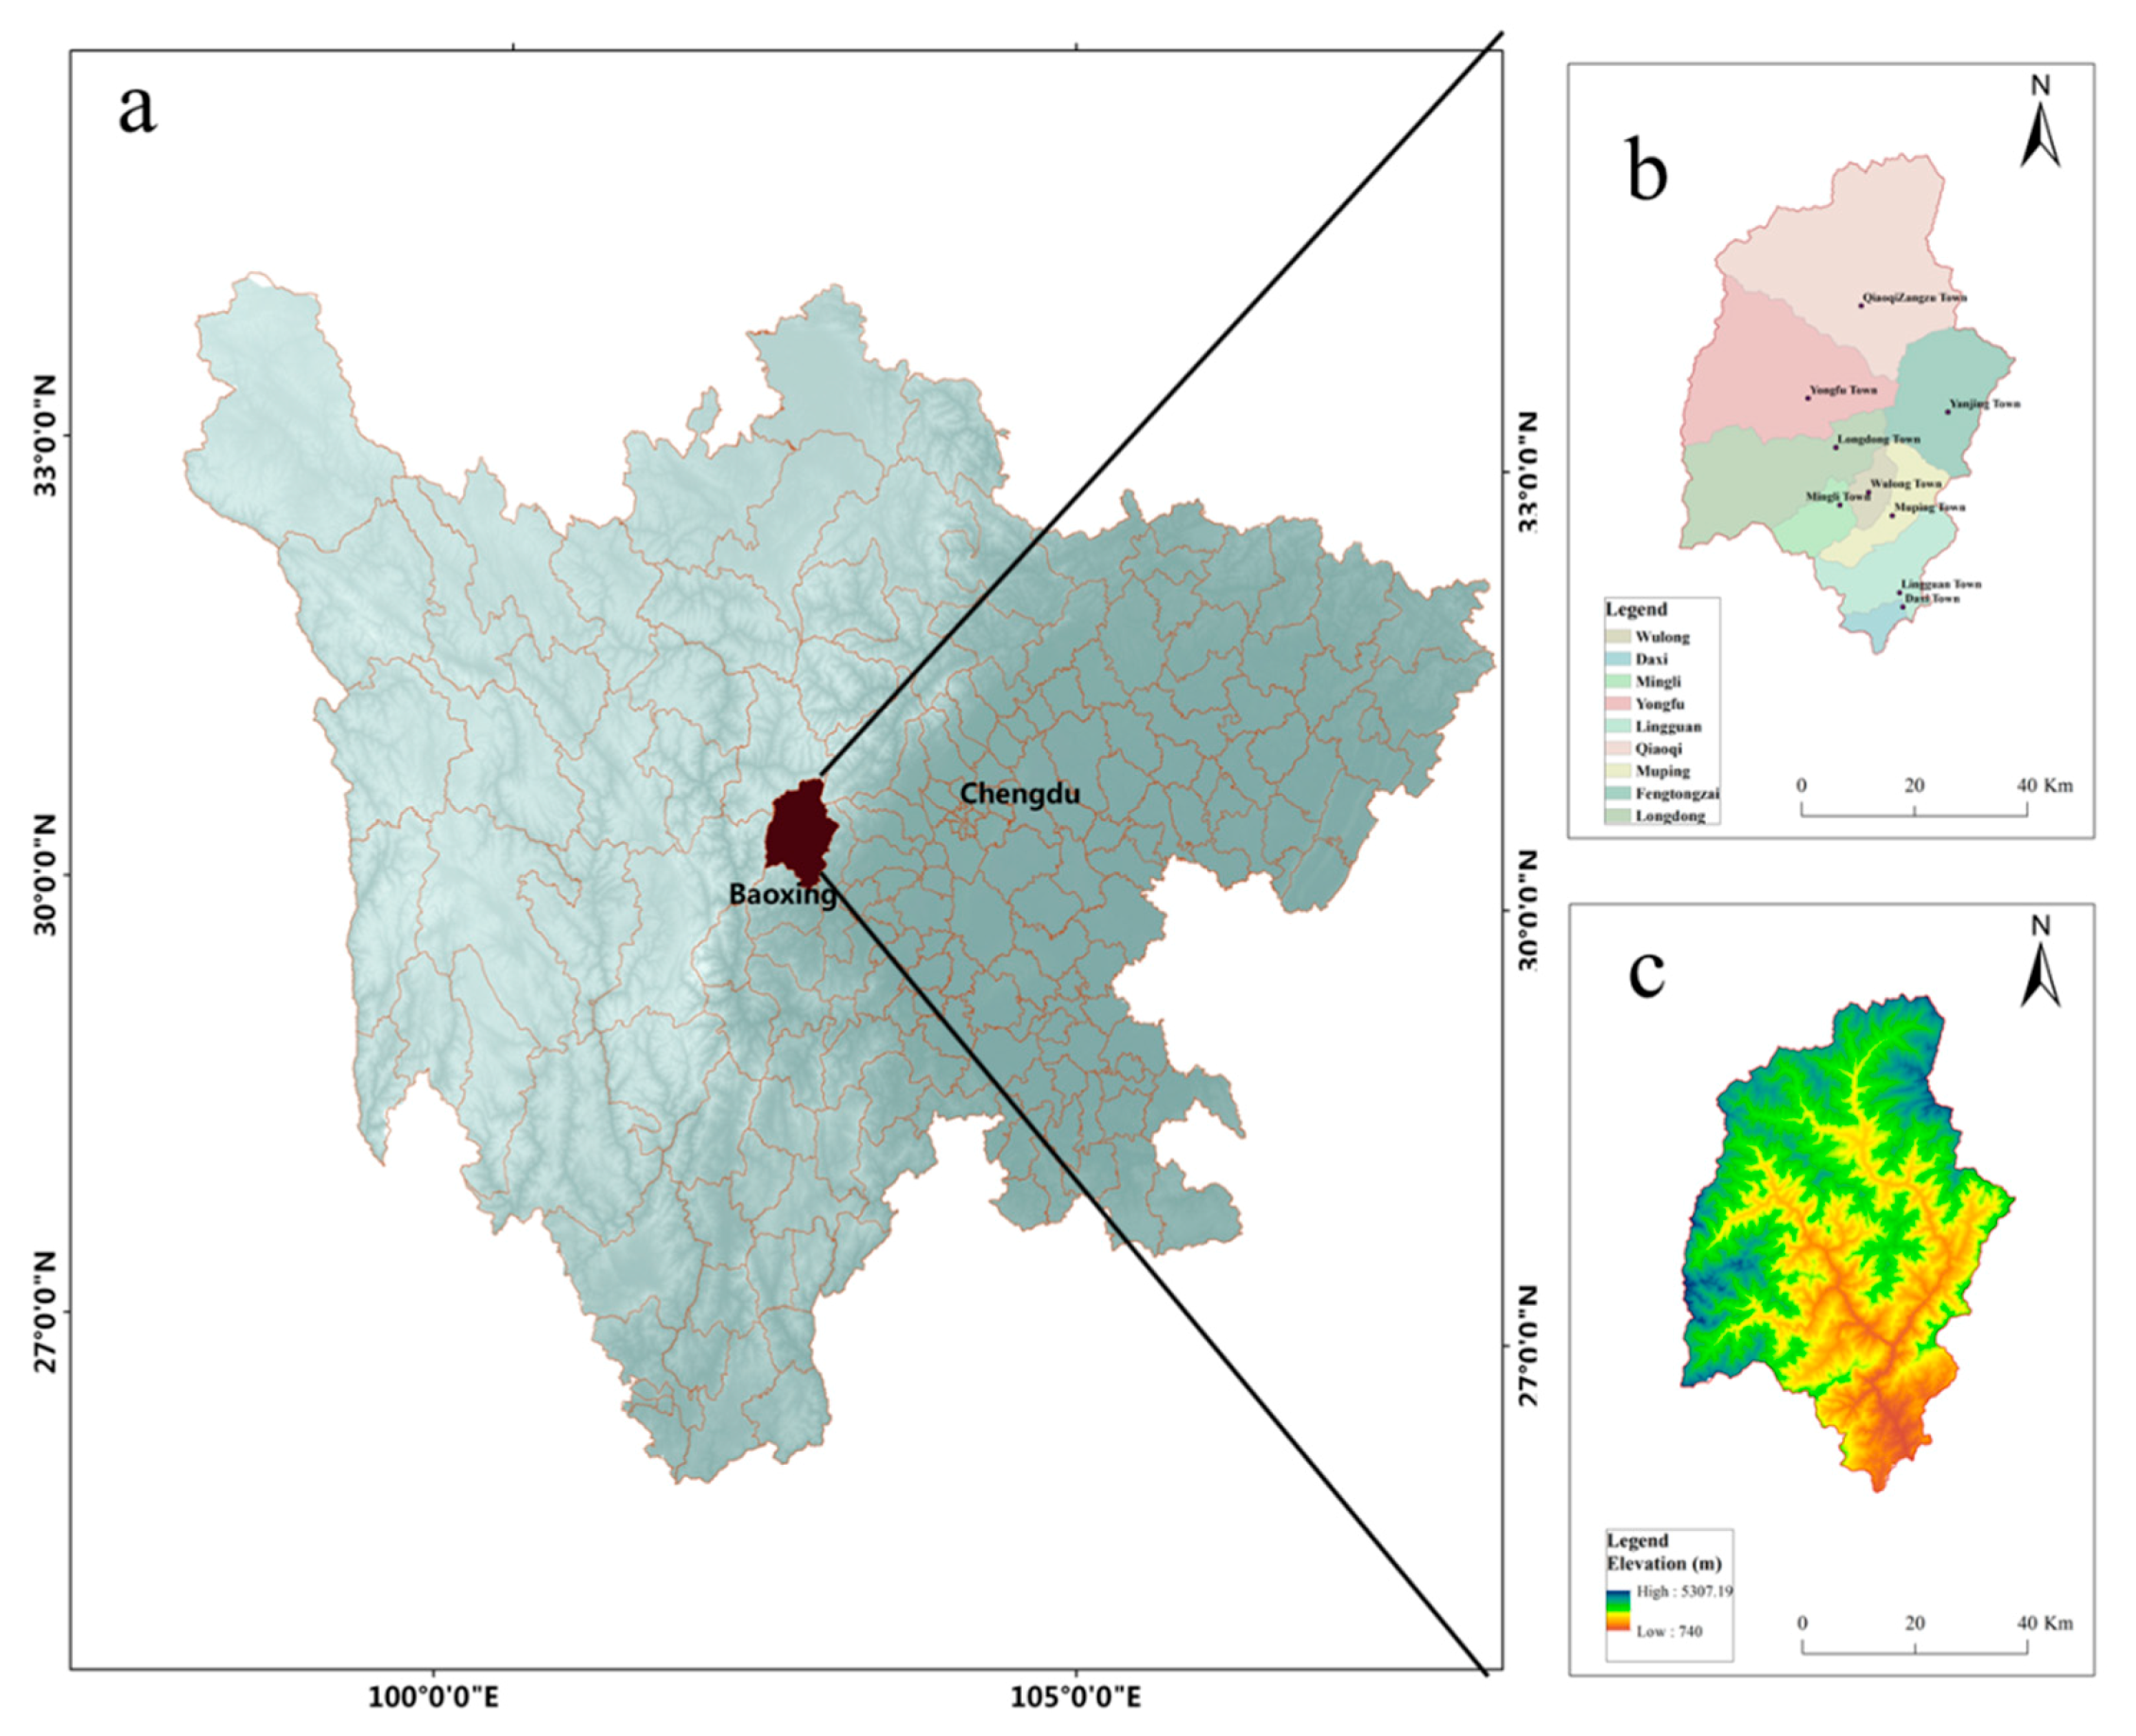
2.1. Study Area
2.2. Ecosystem Management Framework
- (1)
- Assessment framework: Both the ecosystem and the social system must be considered when developing an ecosystem management framework. A number of conceptual frameworks for ecosystem management have been proposed. For example, Kremen et al. (2005) proposed an integrated ecosystem framework based on social-economic data and devised a clear methodology toward ecosystem management research [18]. Carpenter et al. (2009) proposed a more complex system of ecological and social-economic frameworks under different temporal and spatial conditions, with a particular focus on driving forces [19]. Diaz et al. (2011) incorporated the feedback effect between ecosystems and social systems, in which the latter impacts the former through land-use changes, which in turn impacts the supply of ecosystem services and subsequently the social-economy [20]. De Groot et al. (2010) carried out a series of studies to establish a management framework of ecosystem services based on their value, including; (1) ecosystem structures and processes to ecosystem function, (2) a single value to a total value for ecosystem services, (3) the decision-making process, and (4) the role of ecosystem structures and processes [21]. Ecological function zoning is an important component of ecosystem management, the purpose of which is to carry out targeted protection according to the supply of ecological services. The 50 national important ecological function areas proposed in the National Ecological Function Zoning have important guiding significance for national and regional ecological security guarantees [22]. For example, the evaluation of the benefits of ecological function zones (EFZ) [23], changes in human settlements in ecological function zones [24], livelihoods of rural households, and poverty mitigation [25]. Therefore, it can be seen that the division of ecological function zones is the basis for implementing ecological protection. However, on the county-scale, considering only the supply of services cannot effectively divide the ecological function area. Therefore, we propose an ecological function zoning framework based on the relationship between supply and demand of ecosystem services, which mainly includes four parts, as follows (Figure 2):
- Step 1:
- Combining field surveys and background data analysis to determine the main ecosystem services in the study area. Then, biophysical models (mainly InVEST models) are used to map ecosystem services, and clarify the number and distribution of ecosystem services;
- Step 2:
- Based on population distribution, analyze and spatialize the demand for major ecosystem services from the perspective of human well-being;
- Step 3:
- Spatially overlay the analysis of the supply and demand of ecosystem services to clarify how well the supply of ecological services meets demand. Since the minimum scale of demand statistics for ecosystem services is at the township-scale, a spatial overlay analysis is performed by township boundaries;
- Step 4:
- Trade off different ecosystem services, calculate the net ecosystem services after deducting local consumption, clearly dominate the ecosystem services, and conduct ecological function zoning to explore the relationship between different zonings.
- (2)
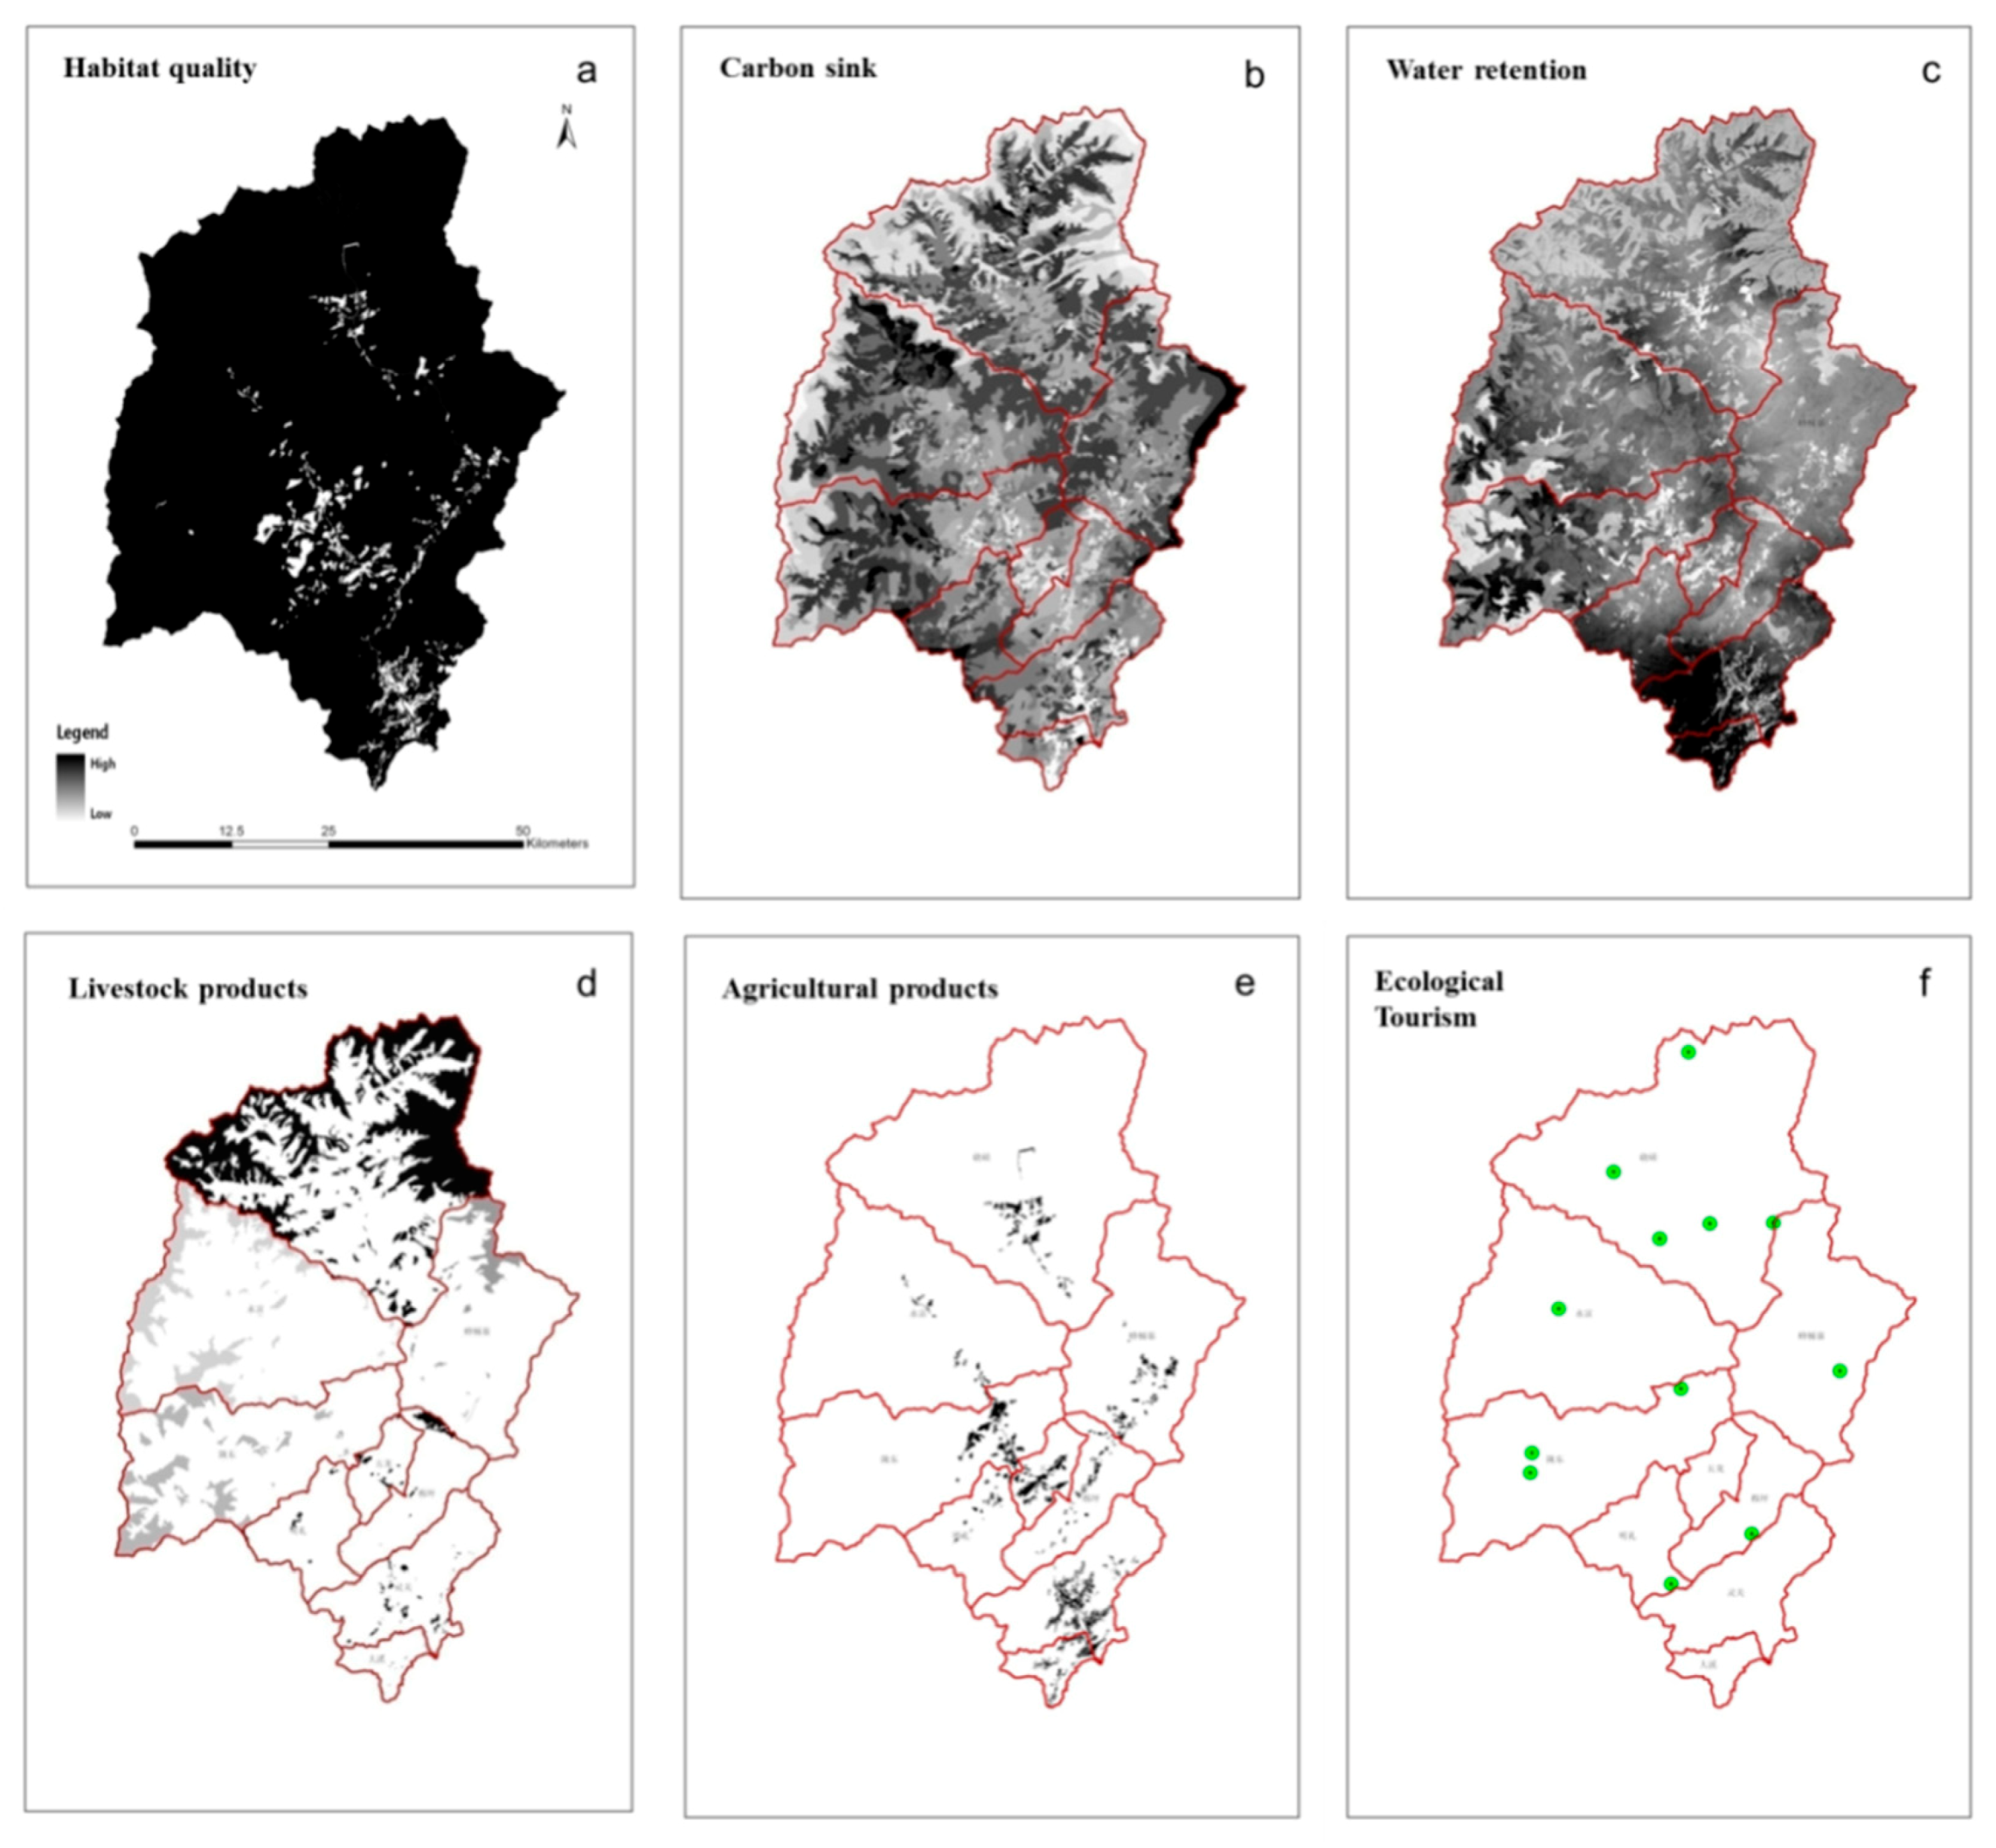
- Model principle: Quantification and spatialization of ecological services are the focus of current ecological research. Currently, the most widely used method internationally is InVEST. This is an evaluation model developed by a natural capital project initiated by Stanford University, World Wildlife Foundation (WWF), and the Nature Conservancy (TNC) [26]. Its main characteristics are layering, modularization, and spatialization. The main modules used in this study include water production, carbon sink, and habitat models. In this study, we assessed the key ecosystem services in Baoxing County, which include water retention, carbon sequestration, product supply, biological diversity, and cultural services. Baoxing County has implemented a number of forest protection projects since the 1990s, which include returning farmland to forest, natural forest protection measures, and the prohibition of timber harvesting. As a result, we excluded the forest timber-supply service in this study. We determined habitat quality, water retention, and carbon sinks using the ecosystem services space mapping tool InVEST developed from the Nature Capital Project [26,27]. The model accurately quantifies the major ecosystem services using a “production function”. Supplies of food and livestock products were assessed using local statistical data, and cultural services were assessed based on the distribution of tourist attractions. The water production model in InVEST calculates the runoff of each grid in the basin based on the principle of water balance based on climate, terrain, and land use. Water production is the rainfall of each grid cell in the area minus the actual evaporation, and the balance between rainfall and evaporation and other series of meteorological factors, soil characteristics, and surface cover (land-use type or vegetation-cover type), etc., are closely related. The calculation principle is as follows:where Yjx is the annual water production, Px is the average annual rainfall of grid unit x, and AETxj is the actual average annual evapotranspiration of grid unit x on land use type j.The carbon absorption function describes the CO2 absorbance by ecosystems, which alleviates the rising trend of CO2 in the atmosphere, thereby contributing to mitigating global warming. The InVEST model mainly considers the forest carbon absorption function. First, based on the net primary productivity (NPP) of different types of forest land vegetation, the carbon absorption of forest land can be estimated for one year, which reflects the carbon absorption capacity of the forest ecosystem per unit of time. The final carbon absorption is adjusted by the normalized difference vegetation index (NDVI) of the woodland. The InVEST biodiversity model mainly evaluates biodiversity from the perspective of habitat quality and assumes that areas with high habitat quality have high biodiversity. The concept of habitat quality is actually the potential ability of ecosystems to provide conditions for the reproduction of species. It is evaluated in terms of external threat intensity and ecosystem sensitivity.
- (3)
- Human needs: Water retention is arguably the most important ecological service, as it has a number of applications, including domestic purposes, agricultural irrigation, and industrial and hydropower generation. To define the spatial patterns for domestic water, we combined the water source distribution with the population distribution. For industrial water consumption, we determined the industrial output value of water consumption for each town. For agricultural water consumption, we determined the water consumption of irrigated farmlands and their spatial distribution. The hydropower needs of each town were calculated in terms of statistical electricity consumption, and food demand was calculated by per capita grain demand. Demands for animal husbandry products were determined based on slaughter and transaction datasets, and habitat needs were determined by the number of protected species inhabiting the area. The eco-tourism demand was assessed by normalized tourist numbers. We excluded assessments on carbon sinks due to the lack of a clear demand.
- (4)
- Integrating ecosystem services and human needs: We assessed ecosystem services supply and demand based on stakeholder identification. The ecosystem services framework established by Hein et al. (2006) emphasized the importance of consumer identification and highlighted the need to establish connections through the spatial relationships between stakeholders [4]. Identification of stakeholders is complex, as the role of ecosystem services varies significantly on multiple scales. Maps are therefore useful tools to analyze the complex relationship between the supply and demand of ecosystem services [6]. The spatial supply-demand relationship can be divided into four categories: (1) Local supply and consumption, such as the provision of agricultural products; (2) local supply and downstream consumption, such as water retention; (3) local supply and consumers beyond the local range, such as carbon sequestration and biodiversity, and; (4) mixed modes, i.e., multiple regions for the same type of service consumers, such as tourism. We analyzed the spatial relationships between ecosystem services consumption and supply using geographic information system (GIS) spatial analysis and the supply to demand ratios. Regarding water retention services, we combined the demands for domestic, agricultural, and industrial water and compared this value to the available water supply. Water supply for hydropower was not included, as the demand for hydropower water does not influence water retention services.
- (5)
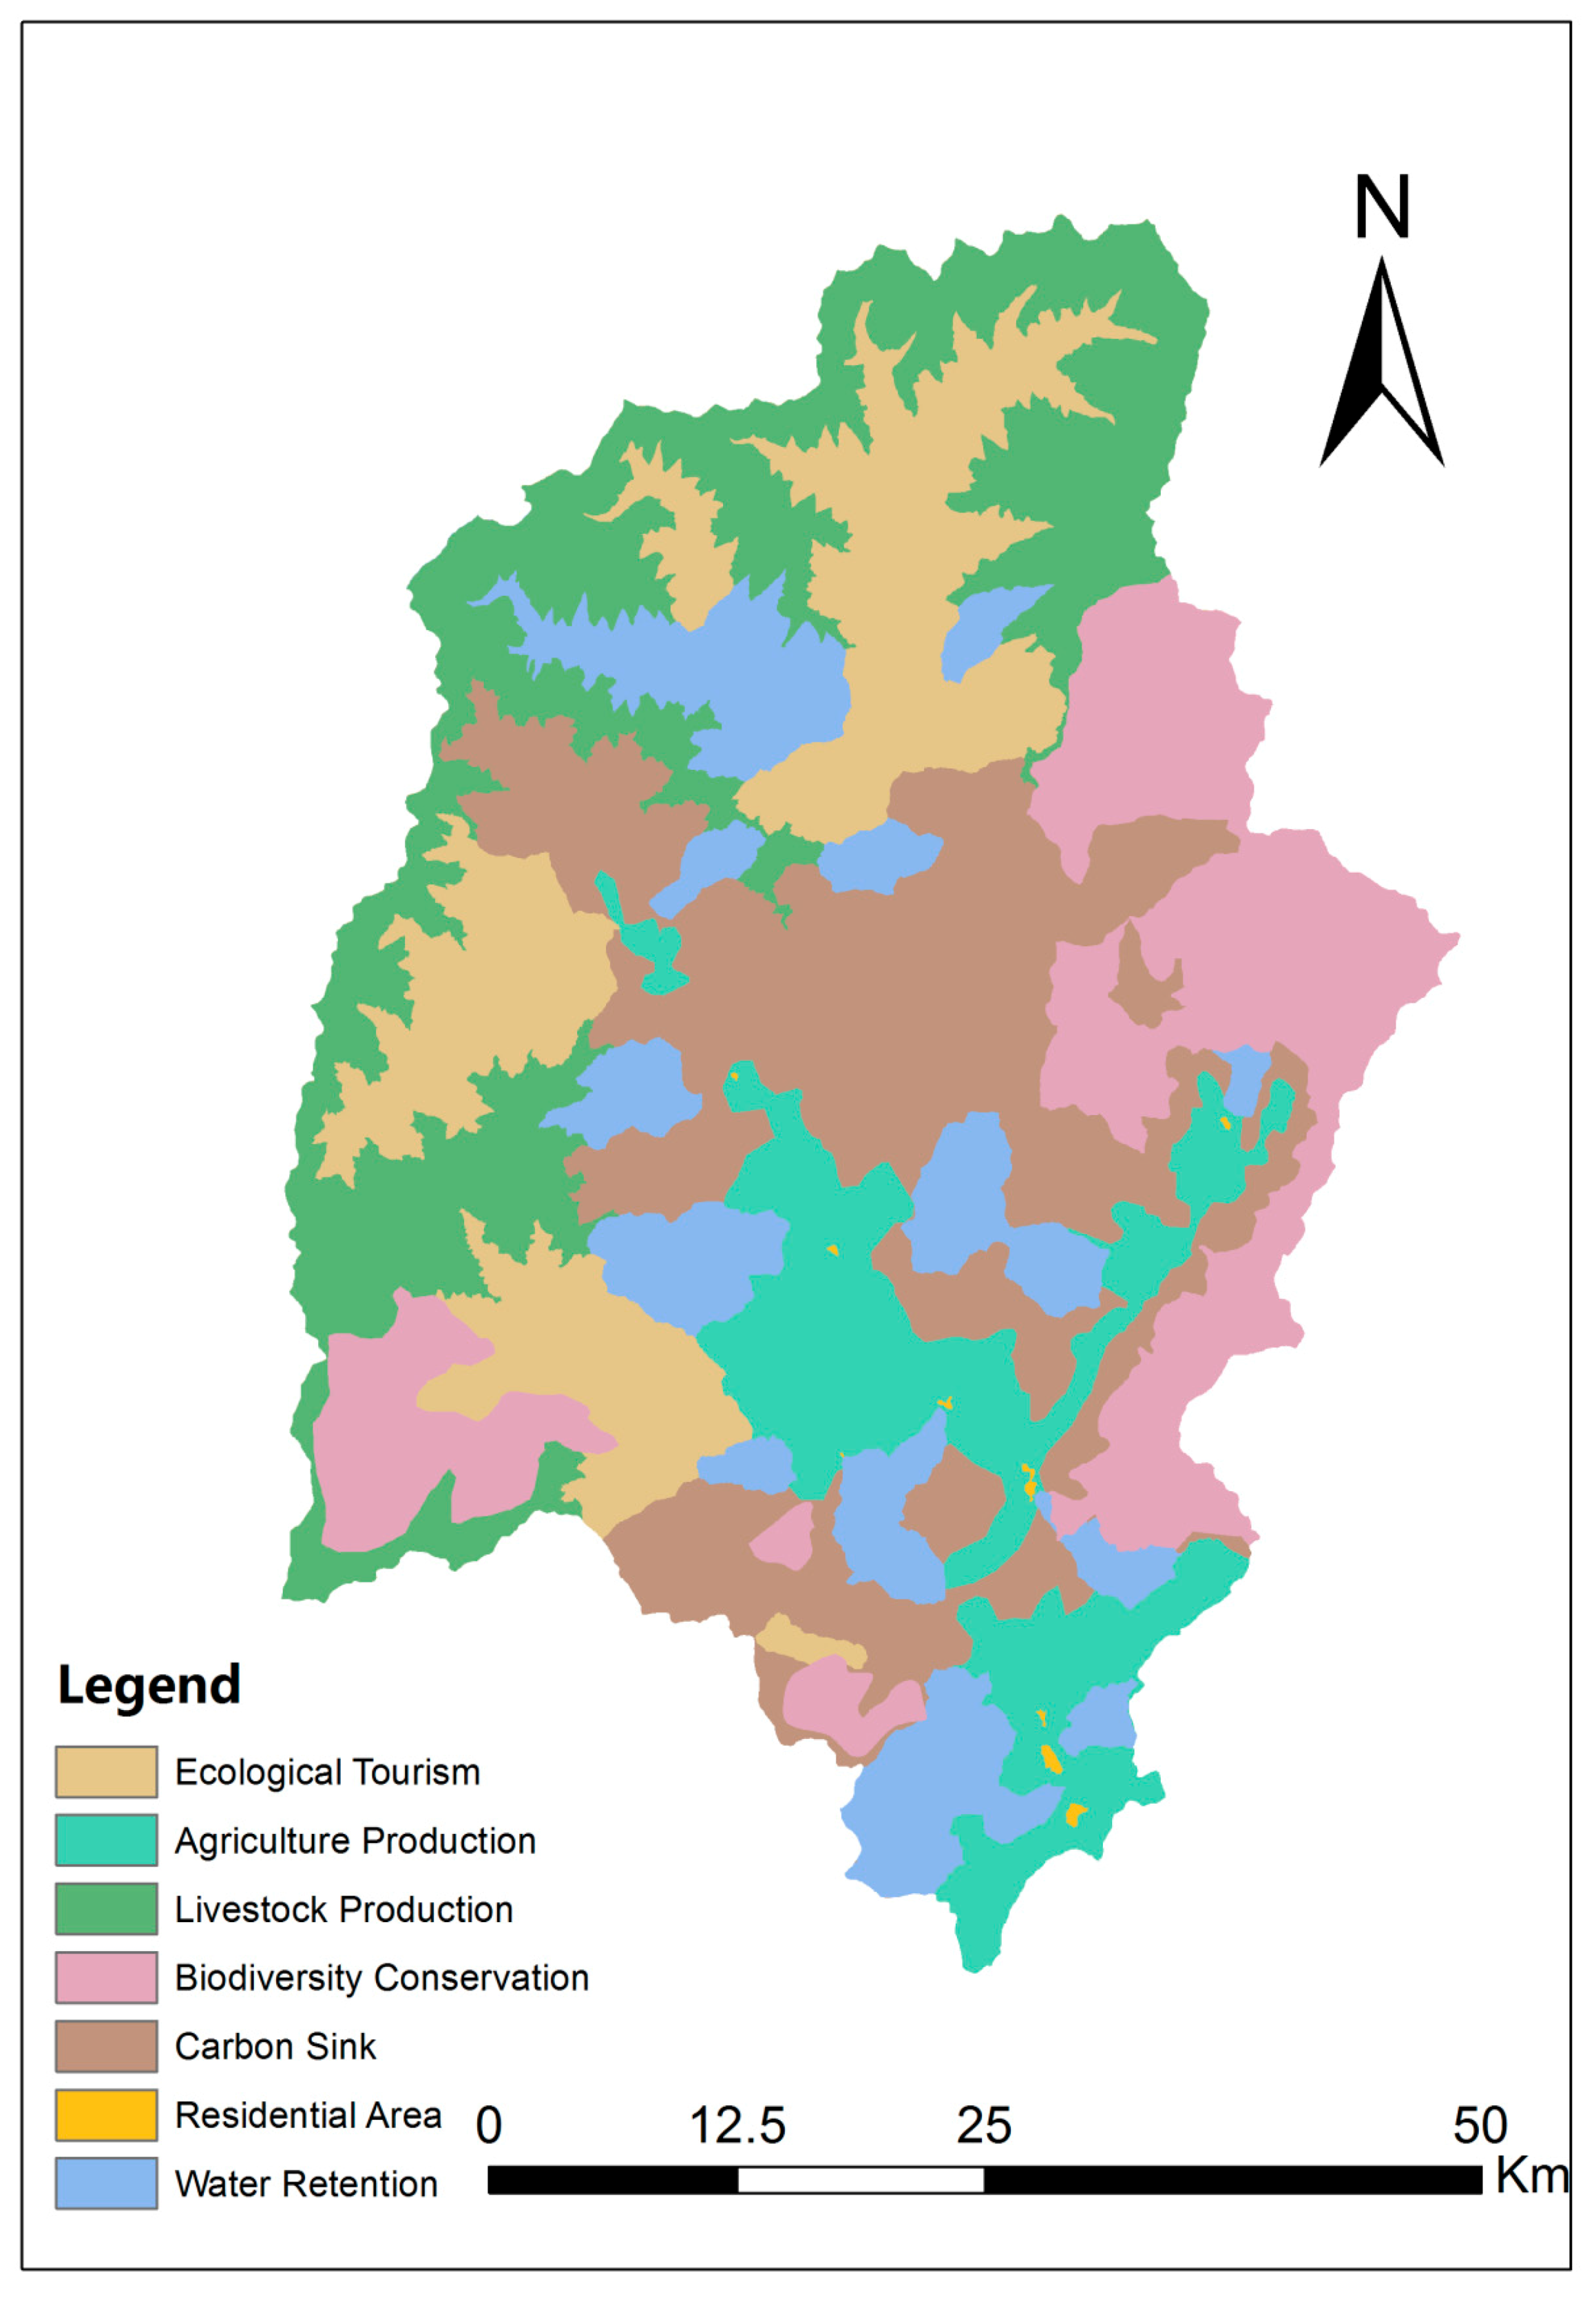
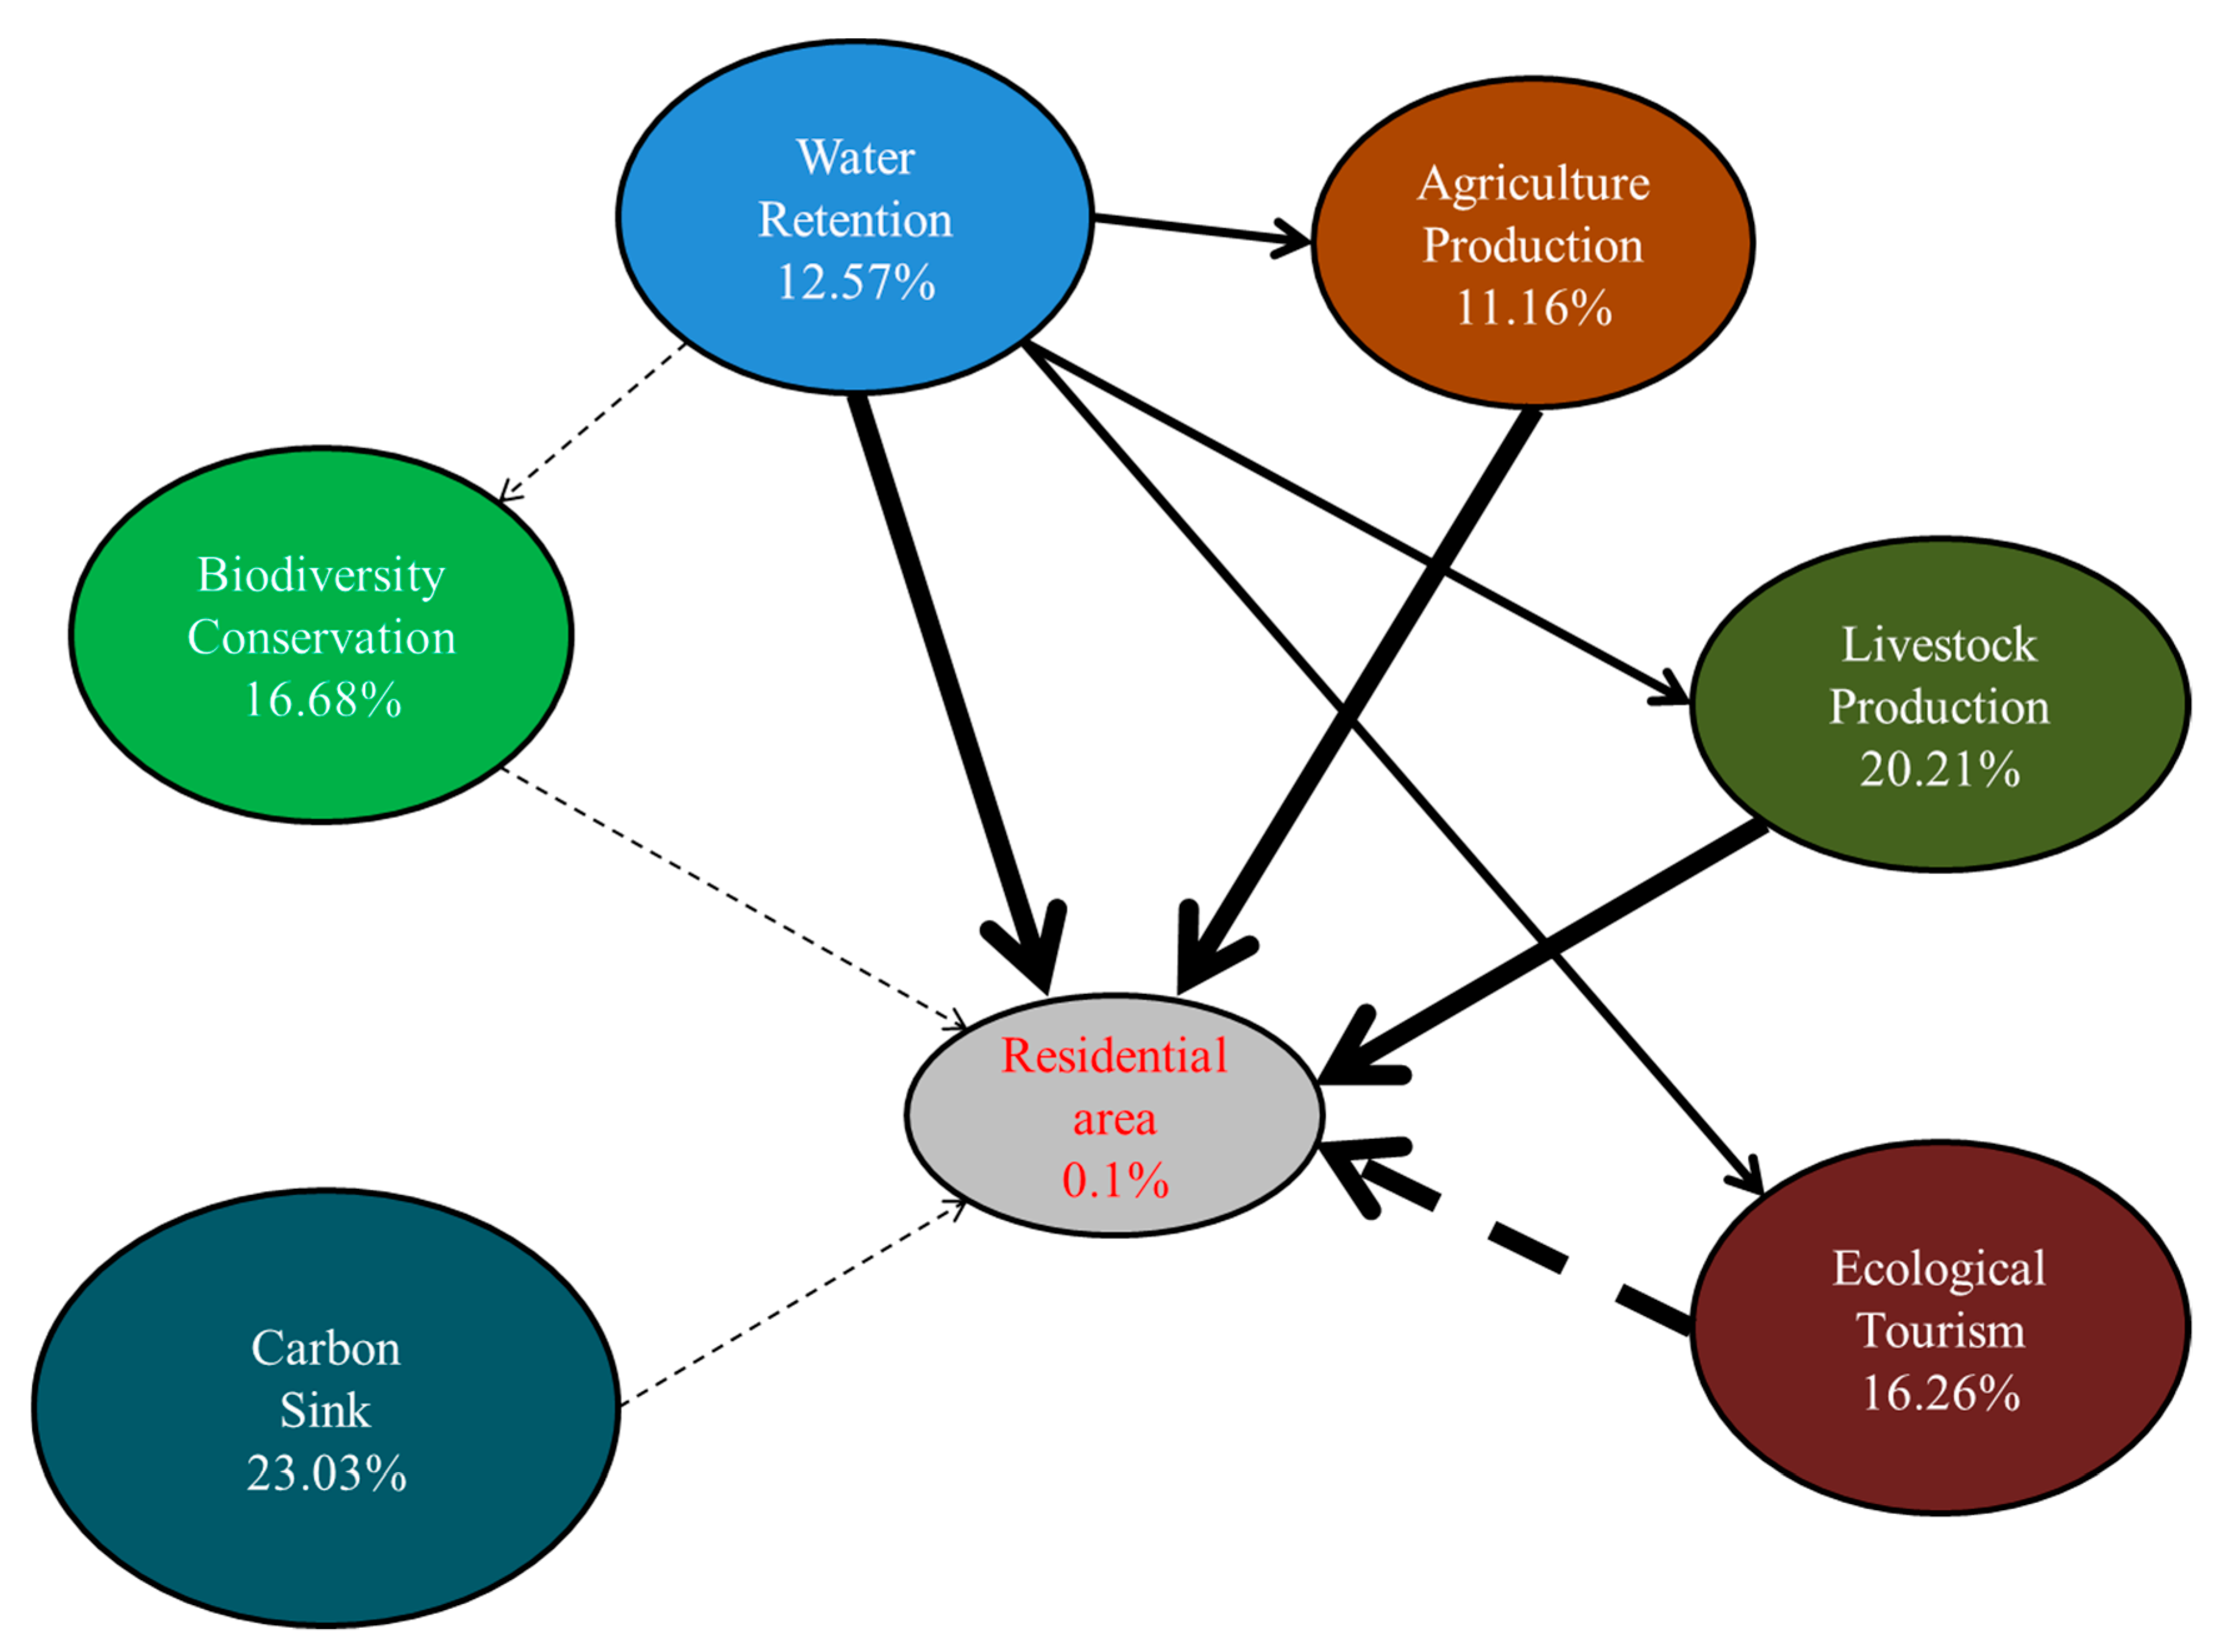
- Ecological function zoning: Zoning is based on the relationship between supply and demand, clarifying the services that are led by different regions and the services that can be provided to the outside. Its essence is supply, however, net output of local demand is deducted. We conducted ecological function zoning based on our analysis of ecosystem services supply and demand. The zoning of ecological functions considers both the priority and trade-offs of the different ecosystem services. To identify the various spatial zones, a single ecosystem service was partitioned based on ecosystem boundaries; we used ARCGIS 10.0 (Esri, Redlands, CA, USA) for partitioning. The net ecosystem service supply was superimposed as a layer, the main services were analyzed, the service concentrated area was selected, and the watershed boundary was used to partition. The first was the residential area, then the biodiversity conservation area, the water retention area, agricultural products, animal husbandry products, and eco-tourism area, and finally the carbon sink area.
- (6)
- Data: The InVEST model does not have high data requirements. Multiple service evaluation models mainly include data from local government departments, such as land-use data, soil survey data, etc. (Table 1). Demand data for ecosystem services were obtained from statistical yearbooks, and data that was not included in the statistic was obtained through field surveys, including parameters for model evaluation. The main data and their sources are shown in Table 1.
3. Results
3.1. Ecosystem Services
3.2. Human Demand
3.3. Integrating Supply and Demand of Ecosystem Services
- (1)
- Degree of demand satisfaction: Supply of ecosystem services is expressed in unit ecosystem, and the use of the service is expressed in population density. To visually represent the relationship between supply and demand, we adopted the township as a single spatial unit of analysis. The blue lines in Figure 5 represent demand and the red lines represent supply of ecosystem services. The water retention service is substantially higher than its demand (by an order of magnitude). Power generation was calculated based on the number of hydropower stations in each township and the contribution of water to the downstream power stations. The majority of towns generated more electricity than was consumed, except for Daxi, Linguan, etc. The total grain demand for food is 18,557 t, and the total grain production is 19,492 t based on the recommended diet for per capita grain demand (322 kg/a). This suggests that grain supply only just meets demand in Baoxing County, although we observed some regional variability. For example, supply was less than demand in regions under the administration of Muping and Longdong, and thus, grains must be supplied externally from nearby towns. These villages and towns are the most economically developed in the region, and their agricultural demands can, therefore, be satisfied through transactions. Livestock products meet the basic needs of each town, with the highest surpluses observed in Qiaoqi, Wulong, and Yongfu.
- (2)
- Comparisons between ecosystem demand: Overall, water retention is the richest ecosystem service. Local consumption only accounts for a small percentage of the total supply (<1%), while hydropower consumption only accounts for 10% of the supply. Further, product supply remains relatively balanced. Ecological protection in the county predominantly provides services external of the county, which is the basis for ecological compensation.
- (3)
- Spatial differences: Generally, the supply of ecosystem services predominantly exceeds demand, though some spatial variability in the supply–demand relationship can be observed. Demand mostly exceeds supply in Qiaoqi, Mingli, Longdong, and Fengtongzhai. For hydroelectricity services, we identified seven townships where supply exceeds demand, only one township (Lingguan) in which supply and demand are balanced, and only one township (Daxi) where demand exceeds supply. For food services, we identified only two townships where supply is significantly higher than demand, three townships where supply and demand are balanced, and four townships where demand exceeds supply.
3.4. Ecosystem Management Zoning
4. Discussion
4.1. Integrated Ecosystem Service Supply and the Ecosystem Management Model of Consumption
4.2. Trade-offs Between Ecosystem Services Based on the Supply–Demand Relationship
4.3. Spatial Heterogeneity of Ecosystem Service Supply and Demand
4.4. Dynamic Changes in the Supply–Demand Relationship of Ecosystem Services
4.5. Ecosystem Services Stakeholders
4.6. Limitations
5. Conclusions
- (1)
- We identified inconsistencies in the spatial distribution between supply and consumption of ecosystem services, which is the basis for the spatial partitioning of ecosystem management measures;
- (2)
- The values of the different ecosystem services need to be weighed to integrate the supply and demand of each service. The distribution patterns of individual services must also be compared in different regions, and the integration should be conducted vertically and horizontally;
- (3)
- To promote both ecological protection and economic development, the spatial distribution of ecological protection and economic partitioning is necessary for ecosystem management;
- (4)
- Spatial differences in the supply–demand relationship of ecosystem services can reflect ecosystem variability and the mutual links among different interest groups and between the ecological and social systems. However, these links are highly complex and, thus, require comprehensive analyses. Further, the relationship between supply and demand can change significantly on different spatial and temporal scales. Nevertheless, this study provides a detailed methodology for the implementation of an ecosystem management framework on the county-scale.
Author Contributions
Funding
Conflicts of Interest
References
- Christensen, N.L.; Bartuska, A.M.; Brown, J.H.; Carpenter, S.R.; Dantonio, C.M.; Francis, R.C.; Franklin, J.F.; Macmahon, J.A.; Noss, R.F.; Parsons, D.J. The Report of the Ecological Society of America Committee on the Scientific Basis for Ecosystem Management. Ecol. Appl. 1996, 6, 665–691. [Google Scholar] [CrossRef]
- Daily, G.C.; Polasky, S.; Goldstein, J.; Kareiva, P.M.; Mooney, H.A.; Pejchar, L.; Ricketts, T.H.; Salzman, J.; Shallenberger, R. Ecosystem services in decision making: Time to deliver. Front. Ecol. Environ. 2009, 7, 21–28. [Google Scholar] [CrossRef]
- Milner-Gulland, J.E. Integrating fisheries approaches and household utility models for improved resource management. Proc. Natl. Acad. Sci. USA 2011, 108, 1741–1746. [Google Scholar] [CrossRef]
- Hein, L.; Van Koppen, K.; De Groot, R.; Van Ierland, E.C. Spatial scales, stakeholders and the valuation of ecosystem services. Ecol. Econ. 2006, 57, 209–228. [Google Scholar] [CrossRef]
- Raymond, C.M.; Bryan, B.A.; Macdonald, D.H.; Cast, A.; Strathearn, S.; Grandgirard, A.; Kalivas, T. Mapping community values for natural capital and ecosystem services. Ecol. Econ. 2009, 68, 1301–1315. [Google Scholar] [CrossRef]
- Burkhard, B.; Groot, R.D.; Costanza, R.; Seppelt, R.; Jorgensen, S.E.; Potschin, M. Solutions for sustaining natural capital and ecosystem services. Ecol. Indic. 2012, 21, 1–6. [Google Scholar] [CrossRef]
- Wang, Y.; Meng, J.J.; Yang, Q.I.; Peng, F.L. Review of ecosystem management based on the InVEST model. Chin. J. Ecol. 2015, 79, 325–327. [Google Scholar]
- Kovacs, K.; Polasky, S.; Nelson, E.; Keeler, B.L.; Pennington, D.; Plantinga, A.J.; Taff, S. Evaluating the Return in Ecosystem Services from Investment in Public Land Acquisitions. PloS ONE 2013, 8, e62202. [Google Scholar] [CrossRef]
- Harmáčková, Z.V.; Vačkář, D. Modelling regulating ecosystem services trade-offs across landscape scenarios in T?eboňsko Wetlands Biosphere Reserve, Czech Republic. Ecol. Model. 2014, 295, 207–215. [Google Scholar] [CrossRef]
- Bhagabati, N.K.; Ricketts, T.; Sulistyawan, T.B.S.; Conte, M.; Ennaanay, D.; Hadian, O.; McKenzie, E.; Olwero, N.; Rosenthal, A.; Tallis, H. Ecosystem services reinforce Sumatran tiger conservation in land use plans. Biol. Conserv. 2013, 169, 147–156. [Google Scholar] [CrossRef]
- Zhan, J.Y.; Shi, N.N.; Deng, X.Z. Spatial identification and representation of the core ecosystem services in Poyang Lake area. Geogr. Res. 2009, 28, 1022–1030. [Google Scholar]
- Aalders, I.; Stanik, N. Spatial units and scales for cultural ecosystem services: A comparison illustrated by cultural heritage and entertainment services in Scotland. Landsc. Ecol. 2019, 34, 1635–1651. [Google Scholar] [CrossRef]
- Luck, G.W.; Harrington, R.; Harrison, P.A.; Kremen, C.; Berry, P.M.; Bugter, R.; Haslett, J.R.; Dawson, T.R.; De Bello, F.; Díaz, S.; et al. Quantifying the Contribution of Organisms to the Provision of Ecosystem Services. Bioscience 2009, 59, 223–235. [Google Scholar] [CrossRef]
- Lamarque, P.; Tappeiner, U.; Turner, C.; Steinbacher, M.; Bardgett, R.D.; Szukics, U.; Schermer, M.; Lavorel, S. Stakeholder perceptions of grassland ecosystem services in relation to knowledge on soil fertility and biodiversity. Reg. Environ. Chang. 2011, 11, 791–804. [Google Scholar] [CrossRef]
- Hui, Y.; Zhao, Y.; Ma, Y.; Sun, Y.; Zhang, H.; Yang, S.; Luo, Y. A Remote Sensing-based Analysis on the Impact of Wenchuan Earthquake on the Core Value of World Nature Heritage Sichuan Giant Panda Sanctuary. J. Mt. Sci. 2011, 8, 102–109. [Google Scholar]
- Bing, H.; Jun, M. Panda’s Hometown and Legendary Baoxing-Integrated Ecological Management Practices in Baoxing Sichuan; China Environmental Science Press: Beijing, China, 2012; p. 361. [Google Scholar]
- Province, F.D.O.S. The 4th Survey Report on Giant Pandas in Sichuan Province; Sichuan Science and Technology Press Co., Ltd.: Chengdu, China, 2015. [Google Scholar]
- Kremen, C.; Ostfeld, R.S. A call to ecologists: Measuring, analyzing, and managing ecosystem services. Front. Ecol. Environ. 2005, 3, 540–548. [Google Scholar] [CrossRef]
- Carpenter, S.R.; Mooney, H.A.; Agard, J.; Capistrano, D.P.; Defries, R.S.; Diaz, S.; Dietz, T.; Duraiappah, A.; Otengyeboah, A.A.; Pereira, H.M. Science for managing ecosystem services: Beyond the Millennium Ecosystem Assessment. Proc. Natl. Acad. Sci. USA 2009, 106, 1305–1312. [Google Scholar] [CrossRef]
- Diaz, S.; Quetier, F.; Caceres, D.M.; Trainor, S.F.; Perez-Harguindeguy, N.; Bret-Harte, M.S.; Finegan, B.; Pena-Claros, M.; Poorter, L. Linking functional diversity and social actor strategies in a framework for interdisciplinary analysis of nature’s benefits to society. Proc. Natl. Acad. Sci. USA 2011, 108, 895–902. [Google Scholar] [CrossRef]
- De Groot, R.; Wilson, M.A.; Boumans, R. A typology for the classification, description and valuation of ecosystem functions, goods and services. Ecol. Econ. 2002, 41, 393–408. [Google Scholar] [CrossRef]
- Zou, C.X.; Xu, M.J.; Gao, J.X.; Yang, S.S. Ecological Security Evaluation of National Important Ecological Function Areas. J. Ecol. Rural Environ. 2014, 30, 688–693. [Google Scholar]
- Zhang, X.; Zheng, Y.; Wang, Y.P. Application of TOPSIS Model to Beneficial Evaluation of Soil and Water Conversation of Qinling Ecological Function Region Based on Gray Correlation Degree. Res. Soil Water Conserv. 2013, 20, 188–191. [Google Scholar]
- Zeng, J.X.; Yang, Q.Q.; Liu, Y.J.; Zhao, C.F.; Li, B.H. Research on evolution and influential mechanism for rural human settlement in national key ecological function areas: A case of Lichuan. Hum. Geogr. 2016, 31, 81–88. [Google Scholar]
- Liang, Y.; Zhang, G.; Huo, X. Study on the Effect of Ecological Compensation on the Residents’ Sustainable Livelihoods in the National Key Ecological Functional Areas—Based on the Perspective of “Targeted Poverty Alleviation”. Theory Pract. Financ. Econ. 2017, 37, 188–196. [Google Scholar]
- Nelson, E.J.; Mendoza, G.; Regetz, J.; Polasky, S.; Tallis, H.; Cameron, D. Modeling multiple ecosystem services, biodiversity conservation, commodity production, and tradeoffs at landscape scales. Front. Ecol. Environ. 2009, 7, 4–11. [Google Scholar] [CrossRef]
- Kareiva, P.; Tallis, H.; Ricketts, T.H. Natural Capital. Theory and Practice of Mapping Ecosystem Services; Oxford University Press: Oxford, UK, 2011. [Google Scholar]
- Egoh, B.; Rouget, M.; Reyers, B.; Knight, A.T.; Cowling, R.M.; Jaarsveld, A.S.V.; Welz, A. Integrating ecosystem services into conservation assessments: A review. Ecol. Econ. 2007, 63, 714–721. [Google Scholar] [CrossRef]
- Wei, H.; Fan, W.; Wang, X.; Lu, N.; Dong, X.; Zhao, Y.; Xijia, Y.; Zhao, Y. Integrating supply and social demand in ecosystem services assessment: A review. Ecosyst. Serv. 2017, 25, 15–27. [Google Scholar] [CrossRef]
- Palomo, I.; Martín-López, B.; Alcorlo, P.; Montes, C. Limitations of Protected Areas Zoning in Mediterranean Cultural Landscapes Under the Ecosystem Services Approach. Ecosystems 2014, 17, 1202–1215. [Google Scholar] [CrossRef]
- Wang, G.; Yang, D.; Xia, F.; Zhong, R.; Xiong, C. Three Types of Spatial Function Zoning in Key Ecological Function Areas Based on Ecological and Economic Coordinated Development: A Case Study of Tacheng Basin, China. Chin. Geogr. Sci. 2019, 29, 689–699. [Google Scholar] [CrossRef]
- Apitz, S.E.; Elliott, M.; Fountain, M.; Galloway, T.S. European environmental management: Moving to an ecosystem approach. Integr. Environ. Assess. Manag. 2009, 2, 80–85. [Google Scholar] [CrossRef]
- Reyers, B.; Roux, D.J.; Ofarrell, P.J. Can ecosystem services lead ecology on a transdisciplinary pathway. Environ. Conserv. 2010, 37, 501–511. [Google Scholar] [CrossRef]
- Liu, J.; Li, S.; Ouyang, Z.; Tam, C.; Chen, X. Ecological and socioeconomic effects of China’s policies for ecosystem services. Proc. Natl. Acad. Sci. USA 2008, 105, 9477–9482. [Google Scholar] [CrossRef] [PubMed]
- Syrbe, R.U.; Walz, U. Spatial indicators for the assessment of ecosystem services: Providing, benefiting and connecting areas and landscape metrics. Ecol. Indic. 2012, 21, 80–88. [Google Scholar] [CrossRef]
- Flach, R.; Ran, Y.; Godar, J.; Karlberg, L.; Suavet, C. Towards more spatially explicit assessments of virtual water flows: Linking local water use and scarcity to global demand of Brazilian farming commodities. Environ. Res. Lett. 2016, 11, 1–10. [Google Scholar] [CrossRef]
- Titus, T.R. Biodiversity: The Need for a National Policy. Fisheries 1992, 17, 31–34. [Google Scholar] [CrossRef]
- Zhang, Z.; Wei, F.; Ming, L.I.; Jinchu, H.U. Winter Microhabitat Separation between Giant and Red Pandas in Bashania faberi Bamboo Forest in Fengtongzhai Nature Reserve. J. Wildl. Manag. 2009, 70, 231–235. [Google Scholar] [CrossRef]
- Dan, Z.; Min, Q.; Liu, M.; Cheng, S. Ecosystem service tradeoff between traditional and modern agriculture: A case study in Congjiang County, Guizhou Province, China. Front. Environ. Sci. Eng. 2012, 6, 743–752. [Google Scholar]
- Divinsky, I.; Becker, N.; Bar, P. Ecosystem service tradeoff between grazing intensity and other services—A case study in Karei-Deshe experimental cattle range in northern Israel. Ecosyst. Serv. 2017, 24, 16–27. [Google Scholar] [CrossRef]
- Lu, N.; Fu, B.; Jin, T.; Chang, R. Trade-off analyses of multiple ecosystem services by plantations along a precipitation gradient across Loess Plateau landscapes. Landsc. Ecol. 2014, 29, 1697–1708. [Google Scholar] [CrossRef]
- Martín-López, B.; Iniesta-Arandia, I.; García-Llorente, M.; Palomo, I.; Casado-Arzuaga, I.; Del Amo, D.G.; Gómez-Baggethun, E.; Oteros-Rozas, E.; Palacios-Agundez, I.; Willaarts, B. Uncovering Ecosystem Service Bundles through Social Preferences. PloS ONE 2012, 7, e38970. [Google Scholar] [CrossRef]
- Burkhard, B.; Kroll, F.; Nedkov, S.; Muller, F. Mapping ecosystem service supply, demand and budgets. Ecol. Indic. 2012, 21, 17–29. [Google Scholar] [CrossRef]
- Kroll, F.; Muller, F.; Haase, D.; Fohrer, N. Rural-urban gradient analysis of ecosystem services supply and demand dynamics. Land Use Policy 2012, 29, 521–535. [Google Scholar] [CrossRef]
- Nedkov, S.; Burkhard, B. Flood regulating ecosystem services—Mapping supply and demand, in the Etropole municipality, Bulgaria. Ecol. Indic. 2012, 21, 67–79. [Google Scholar] [CrossRef]
- Bradford, J.B.; Amato, A.W.D. Recognizing trade-offs in multi-objective land management. Front. Ecol. Environ. 2012, 10, 210–216. [Google Scholar] [CrossRef]
- De Groot, R.S.; Alkemade, R.; Braat, L.; Hein, L.; Willemen, L. Challenges in integrating the concept of ecosystem services and values in landscape planning, management and decision making. Ecol. Complex. 2010, 7, 260–272. [Google Scholar] [CrossRef]
- Raudsepphearne, C.; Peterson, G.D.; Bennett, E.M. Ecosystem service bundles for analyzing tradeoffs in diverse landscapes. Proc. Natl. Acad. Sci. USA 2010, 107, 5242–5247. [Google Scholar] [CrossRef]
- Turner, M.G.; Donato, D.C.; Romme, W.H. Consequences of spatial heterogeneity for ecosystem services in changing forest landscapes: Priorities for future research. Landsc. Ecol. 2012, 28, 1081–1097. [Google Scholar] [CrossRef]
- Hauck, J.; Go, C.; Varjopuro, R.; Ratama, O.; Jax, K. Benefits and limitations of the ecosystem services concept in environmental policy and decision making: Some stakeholder perspectives. Environ. Sci. Policy 2012, 5, 13–21. [Google Scholar] [CrossRef]
- Orenstein, D.E.; Groner, E. In the eye of the stakeholder: Changes in perceptions of ecosystem services across an international border. Ecosyst. Serv. 2014, 8, 185–196. [Google Scholar] [CrossRef]
- Raum, S. A framework for integrating systematic stakeholder analysis in ecosystem services research: Stakeholder mapping for forest ecosystem services in the UK. Ecosyst. Serv. 2018, 29, 170–184. [Google Scholar] [CrossRef]


| No | Data | Unit | Application | Source |
|---|---|---|---|---|
| 1 | Land use | No | Water retention, carbon sinks, biodiversity assessment | Baoxing County Integrated Ecosystem Management Office |
| 2 | DEM—Digital elevation model | m | Hydropower valuation | Baoxing County Integrated Ecosystem Management Office |
| 3 | Soil type | No | Water retention assessment | Baoxing County Integrated Ecosystem Management Office |
| 4 | Residential area | no | Human demand | Baoxing County Integrated Ecosystem Management Office |
| 5 | Generated hydropower | Kwh | Hydropower valuation | Baoxing County Integrated Ecosystem Management Office |
| 6 | Conserved species | no | Biodiversity assessment | Baoxing County Integrated Ecosystem Management Office |
| 7 | Rainfall | mm | Water retention assessment | China Meteorological Data Network |
| 8 | Temperature | °C | Water retention assessment | China Meteorological Data Network |
| 9 | Agricultural production | Kg/hm2 | Agricultural production assessment | Baoxing County Integrated Ecosystem Management Office |
| 10 | Livestock production | Per | Livestock production assessment | Baoxing County Integrated Ecosystem Management Office |
| 11 | Number of tourists | Person | Tourism assessment | Baoxing County Integrated Ecosystem Management Office |
| EFZ | Area (km2) | Water (mm) | Carbon (t/hm2) | Livestock Products (Sheep unit/hm2) | Agricultural Products (Kg/hm2) | Annual Generation Capacity (Million KWh) |
|---|---|---|---|---|---|---|
| Agriculture production | 347.49 | 155.52 | 52.38 | 0.94 | 1056.15 | 87.6 |
| Water retention | 391.28 | 179.22 | 69.78 | 1 | 184.2 | 192.0 |
| Ecological tourism | 506.33 | 164.86 | 81.26 | 0.77 | 106.65 | 403.0 |
| Biodiversity conservation | 519.40 | 156.87 | 76.72 | 1.04 | 0.75 | 333.0 |
| Livestock production | 629.27 | 125.5 | 42.09 | 4.52 | 0 | 519.0 |
| Carbon sink | 717.26 | 163.03 | 75.11 | 0.23 | 40.8 | 351.0 |
| Residential area | 2.97 | / | / | / | / | / |
© 2019 by the authors. Licensee MDPI, Basel, Switzerland. This article is an open access article distributed under the terms and conditions of the Creative Commons Attribution (CC BY) license (http://creativecommons.org/licenses/by/4.0/).
Share and Cite
Fu, B.; Xu, P.; Wang, Y.; Guo, Y. Integrating Ecosystem Services and Human Demand for a New Ecosystem Management Approach: A Case Study from the Giant Panda World Heritage Site. Sustainability 2020, 12, 295. https://doi.org/10.3390/su12010295
Fu B, Xu P, Wang Y, Guo Y. Integrating Ecosystem Services and Human Demand for a New Ecosystem Management Approach: A Case Study from the Giant Panda World Heritage Site. Sustainability. 2020; 12(1):295. https://doi.org/10.3390/su12010295
Chicago/Turabian StyleFu, Bin, Pei Xu, Yukuan Wang, and Yingman Guo. 2020. "Integrating Ecosystem Services and Human Demand for a New Ecosystem Management Approach: A Case Study from the Giant Panda World Heritage Site" Sustainability 12, no. 1: 295. https://doi.org/10.3390/su12010295
APA StyleFu, B., Xu, P., Wang, Y., & Guo, Y. (2020). Integrating Ecosystem Services and Human Demand for a New Ecosystem Management Approach: A Case Study from the Giant Panda World Heritage Site. Sustainability, 12(1), 295. https://doi.org/10.3390/su12010295