Article

Renewable Energy and Land Use in India: A Vision to Facilitate Sustainable Development

1
Global Lands, The Nature Conservancy, 117 E. Mountain Ave, Suite 201, Fort Collins, CO 80524, USA
2
India Program, The Nature Conservancy, Link Road, Lajpat Nagar Part III, New Delhi 110024, India
3
Center for Study of Science, Technology and Policy, No. 18 & 19, 10th Cross, Mayura Street, Papanna Layout, Nagashettyhalli (RMV II Stage), Bengaluru 560094, India
*
Authors to whom correspondence should be addressed.
Sustainability 2020, 12(1), 281; https://doi.org/10.3390/su12010281
Submission received: 25 November 2019 / Revised: 15 December 2019 / Accepted: 19 December 2019 / Published: 30 December 2019
(This article belongs to the Section Energy Sustainability)

Abstract

:
India has committed to reduce emissions with a goal to increase renewable energy production to 175 gigawatts (GW) by 2022. Achieving this objective will involve rapidly increasing the deployment of solar and wind energy, while at the same time addressing the related challenges of the financing requirements, environment impacts, and power grid integration. Developing energy on lands degraded by human activities rather than placing new infrastructure within natural habitats or areas of high production agriculture would reduce cumulative impacts and minimize land use conflicts. We estimated that converted lands have the potential capacity of 1789 GW across India, which is >10 times the 2022 goals. At the same time, the total land footprint needed to meet India’s 2022 renewable energy target is large, ranging from ~55,000 to 125,000 km2, which is roughly the size of Himachal Pradesh or Chhattisgarh, respectively. If renewable energy is advanced with the singular aim of maximizing resource potential, approximately 6700–11,900 km2 of forest land and 24,100–55,700 km2 of agricultural land could be impacted. Subsidies and incentive programs aimed at promoting low-impact renewable energy deployment and establishing mitigation obligations that raise costs for projects that create land-impacts could improve the public support for renewable energy.

1. Introduction

India, the world’s third largest greenhouse gas (GHG) emitter, has committed to renewable energy as a solution to reduce emissions and to address the challenges of energy access and poverty. The Government of India (GoI) declared its intention to increase domestic renewable energy to 175 gigawatts (GW) by 2022. Within the 2022 target, wind energy will comprise ~60 GW and photovoltaic (PV) solar will be ~100 GW (40 GW from rooftop installations) [1]. In addition, India aims to achieve 40% cumulative electric power installed capacity from renewable sources by 2030 and 100% electrification of vehicles by 2030: goals that are expected to add an additional power requirement of 125 GW and 150 GW, respectively [2]. Many studies have, however, questioned the land-based targets for solar energy deployment and have highlighted the difficulties related to grid access and disputes over land use [3,4,5]. The acquisition of the land is also a major challenge for private companies operating in the wind energy sector [6,7]. With a significant portion of India’s land already under high human modification, and given its population is projected to increase by 20% in the next 40 years [8], meeting the land requirements needed to install renewable energy in line with 2022 target can, therefore, exacerbate land conflicts in India [9,10].
In addition to commitments to expand renewable energy production, India’s Green India Mission (GIM) acknowledges the impact of the forestry sector on climate mitigation, food and water security, conservation of biodiversity, and livelihood of forest dependent communities [11]. The GIM seeks to increase forest/tree cover and forest condition on 10 million hectares over 10 years [11]. Moreover, by 2025, India’s population is also projected to surpass China’s [8], consequently requiring more land to house, feed, and provide energy for this growing population [10]. Simultaneously meeting renewable energy development goals, increasing forest cover, and devoting land to support a growing population (e.g., food production) will require proactive land use planning in order to avoid dire land use conflicts.
Previous studies [3,12,13,14,15] have estimated the total amount of renewable energy potential available in India, and even whether India can meet 2022 goals [16], but to the best of our knowledge, none have examined the potential impacts to existing agricultural and natural lands from renewable energy development if it is sited without the consideration of existing land use. The aim of this study was to quantify the potential impacts to existing agricultural and natural lands from renewable energy development if it is sited regardless of current land use (unconstrained scenario). We also assessed if the 2022 goals can be met if the renewable energy development was constrained to lands already converted or degraded by human activities (constrained scenario). We suggest that doing so reduces future conflict with other human uses and would minimize the loss and degradation of natural lands and associated biodiversity and ecosystem services. Our projections are based on the GoI’s 2022 vision for wind and solar energy development projected for each state (Figure 1, Table 1). The 2022 forecast details a spatial and temporal roadmap to achieve the wind and solar renewable energy goals, including unique wind and solar GW targets for each state. Because some renewable energy facilities have already been installed (~60 GW), we report results as a range between the full 2022 goals and the remaining goals (i.e., 2022 goals—2017 installed capacity; hereafter referred to as full goals and remaining goals, respectively). Lastly, proliferation of rooftop solar has been slow in India and solar development to date largely consists of ground-mounted solar [15] (Table 1). If this trend continues it could increase the land use requirement for development. To address the potential of rooftop solar we compared the land use change impacts when all solar renewable energy targets are met only with ground-mounted development, and when states and territories meet their rooftop and ground-mounted solar goals separately. By calculating the different land use change results between the two analyses we determined the amount of natural and agricultural lands conversion that can be avoided if rooftop and ground-mounted solar goals were met separately.

2. Methods

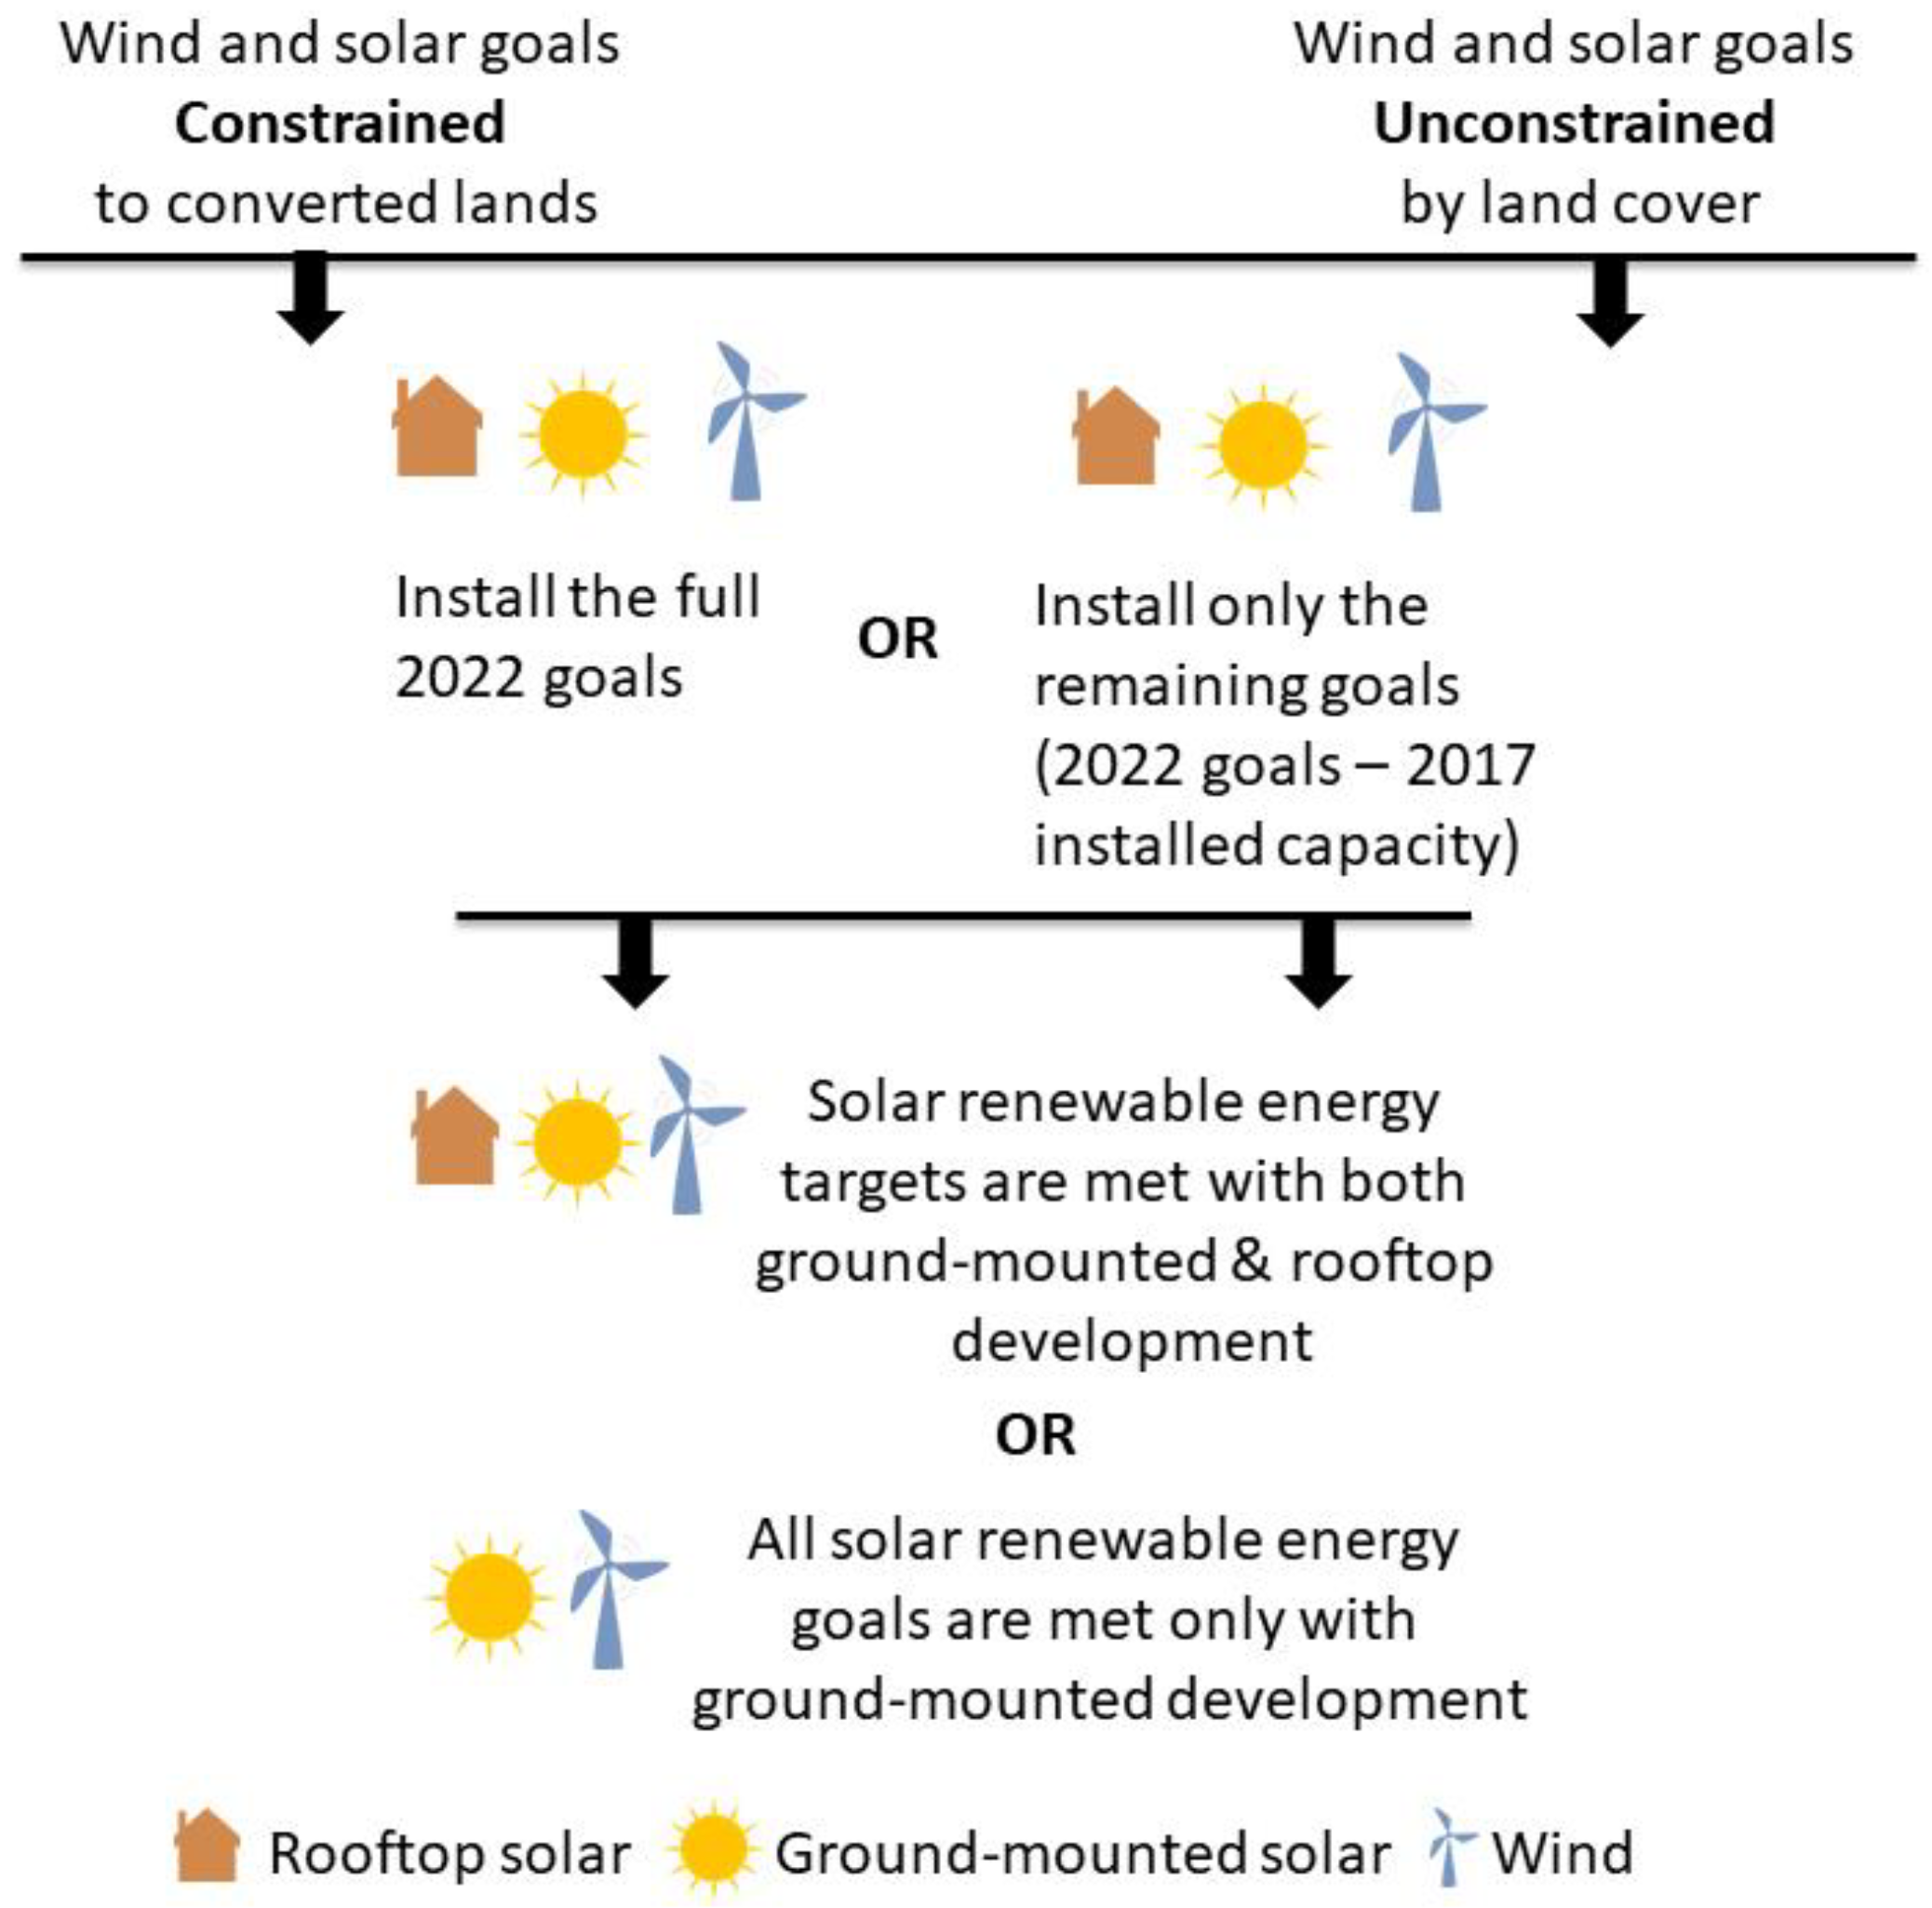
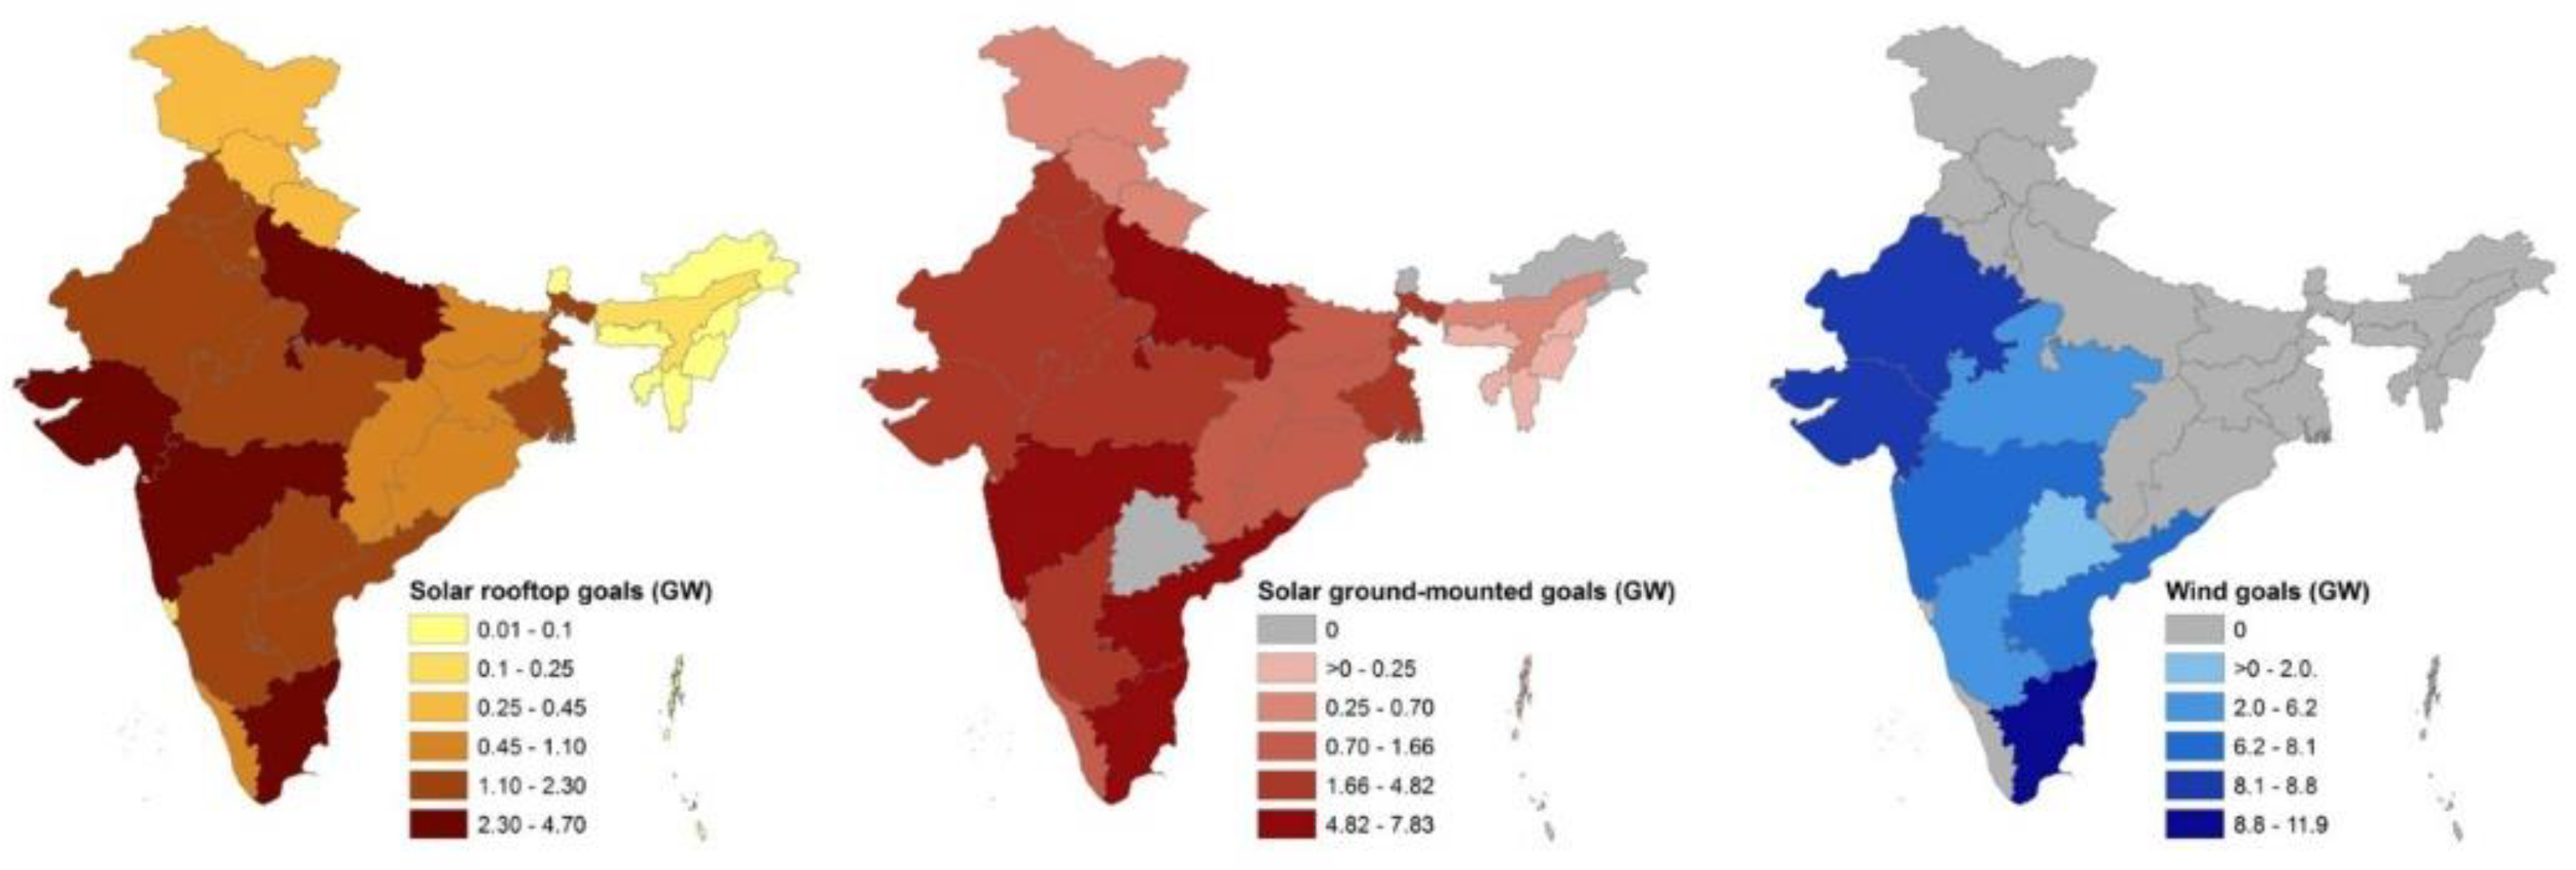
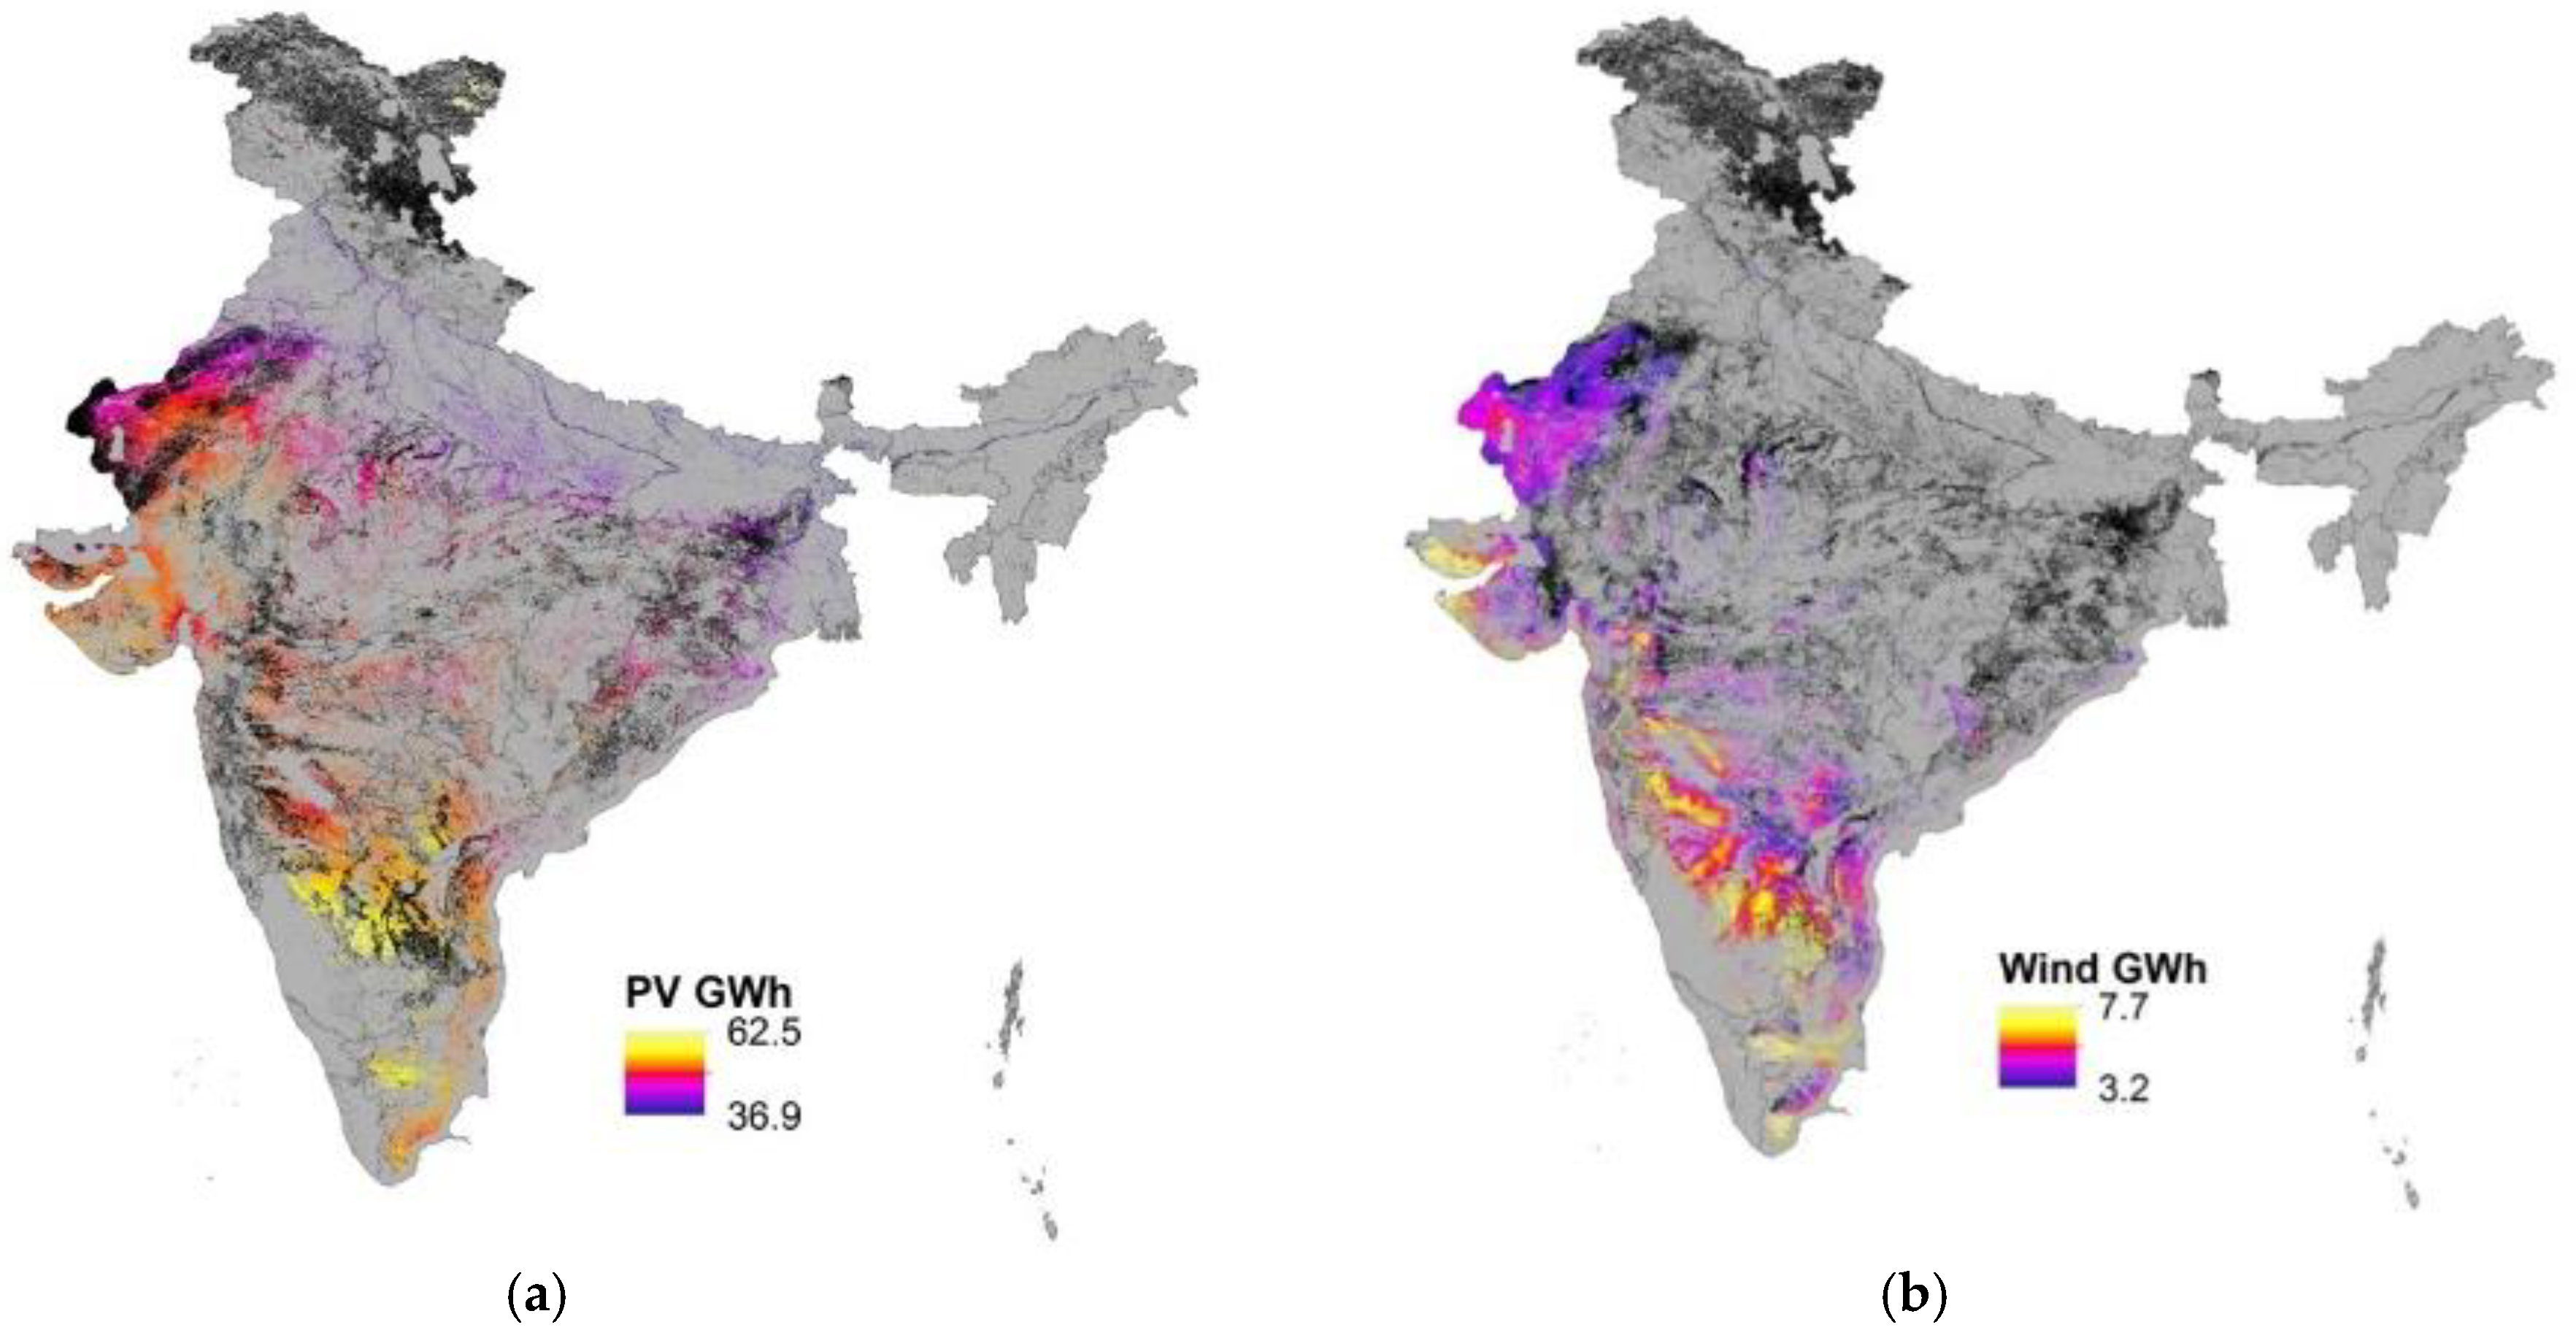
2.1. Renewable Energy Potential on Converted Lands

We focused our analyses on terrestrial lands and excluded water bodies and snow cover types based on the 2011–2012 Land Use Land Cover (LULC) layer provided by India’s National Remote Sensing Centre [17]. We also excluded areas where utility-scaled ground mounted wind and solar energy development is less likely to occur, i.e., within urban areas (build-up cover types in LULC) and protected areas (including all types of designation) [18,19]. All spatial analyses were conducted in ArcMap v. 10.3 (Environmental Systems Research Institute, Redlands, CA, USA) [20] and program R version 3.4.3 (R Foundation for Statistical Computing, Vienna, Austria) [21].
We then estimated renewable energy technical potential on suitable terrestrial lands for utility-scale wind and photovoltaics solar (PV; also referred to as ground-mounted solar) at 1-km resolution, following what is set out in Baruch-Mordo et al. 2019 [22]. Consistent with the feasibility criteria for each sector’s development we excluded for wind: any cell with wind speed <5 m/s, slope >30% and elevation >2000 m; and for PV: any cell with slope >5%. PV technologies harvest global horizontal irradiance (GHI). Because many global or regional PV technical potential estimates do not apply GHI thresholds [23,24,25,26], and because GHI values in India exceeded most thresholds previously used (e.g., 1500 kWh/m2 and 1400 kWh/m2 [27,28]), we did not apply any GHI resource threshold for PV. For each remaining ith suitable cell, we then estimated the available annual GWh generation using: PD*CFi*8760/1000, where PD is power density or the MW produced per km2 (2 MW/km2 for wind, and 26 MW/km2 for PV), CFi is the spatially explicit capacity factor based on Wu et al. [29] as estimated in Baruch-Mordo et al. [22], 8760 are the number of hours per year, and 1000 is a conversion factor from MW to GW. Finally, we refined the derived wind and PV technical potential maps to include only cells that overlapped with converted lands, which were defined as any cell with LULC categories of current fallow, gullied, other wasteland, scrubland, and shifting cultivation. While we recognize that electricity transmission capacity can influence siting, the basis for identifying the most attractive locations to site new facilities is most commonly a measure of energy resource intensity [30]. This is especially relevant for larger facilities sought by the Indian government [31,32], for which the benefits of high production can outweigh the need to be close to electricity consumption [33]. In addition for the planning of PV and wind-power infrastructure, region-specific thresholds are used to determine an energy resource intensity (ERI), below which generation facilities would not likely be cost-effective. While these vary depending on regional characteristics, the thresholds typically capture those areas with an ERI greater than 85–95% of the maximum regional ERI [31,32], supporting our focus on maximizing the energy resource potential as a key guide for siting.

2.2. Renewable Energy Credits and Deficits

Once we estimated technical potential for wind and ground-mounted solar (PV) on converted lands, we summarized for each state or territory the available GW capacity and GWh energy generation. We compared the summed wind and solar technical potential on converted lands to the sector specific (wind, ground-mounted solar) full or remaining renewable energy goals for each state (Table 1; see definitions for full and remaining goals in main text). We derived generation goals (GWh) by multiplying the 2022 vision capacity goals reported in MW by 8760 h per year and dividing by 1000 (MW/GW).

2.3. Impacts of Renewable Energy Footprint
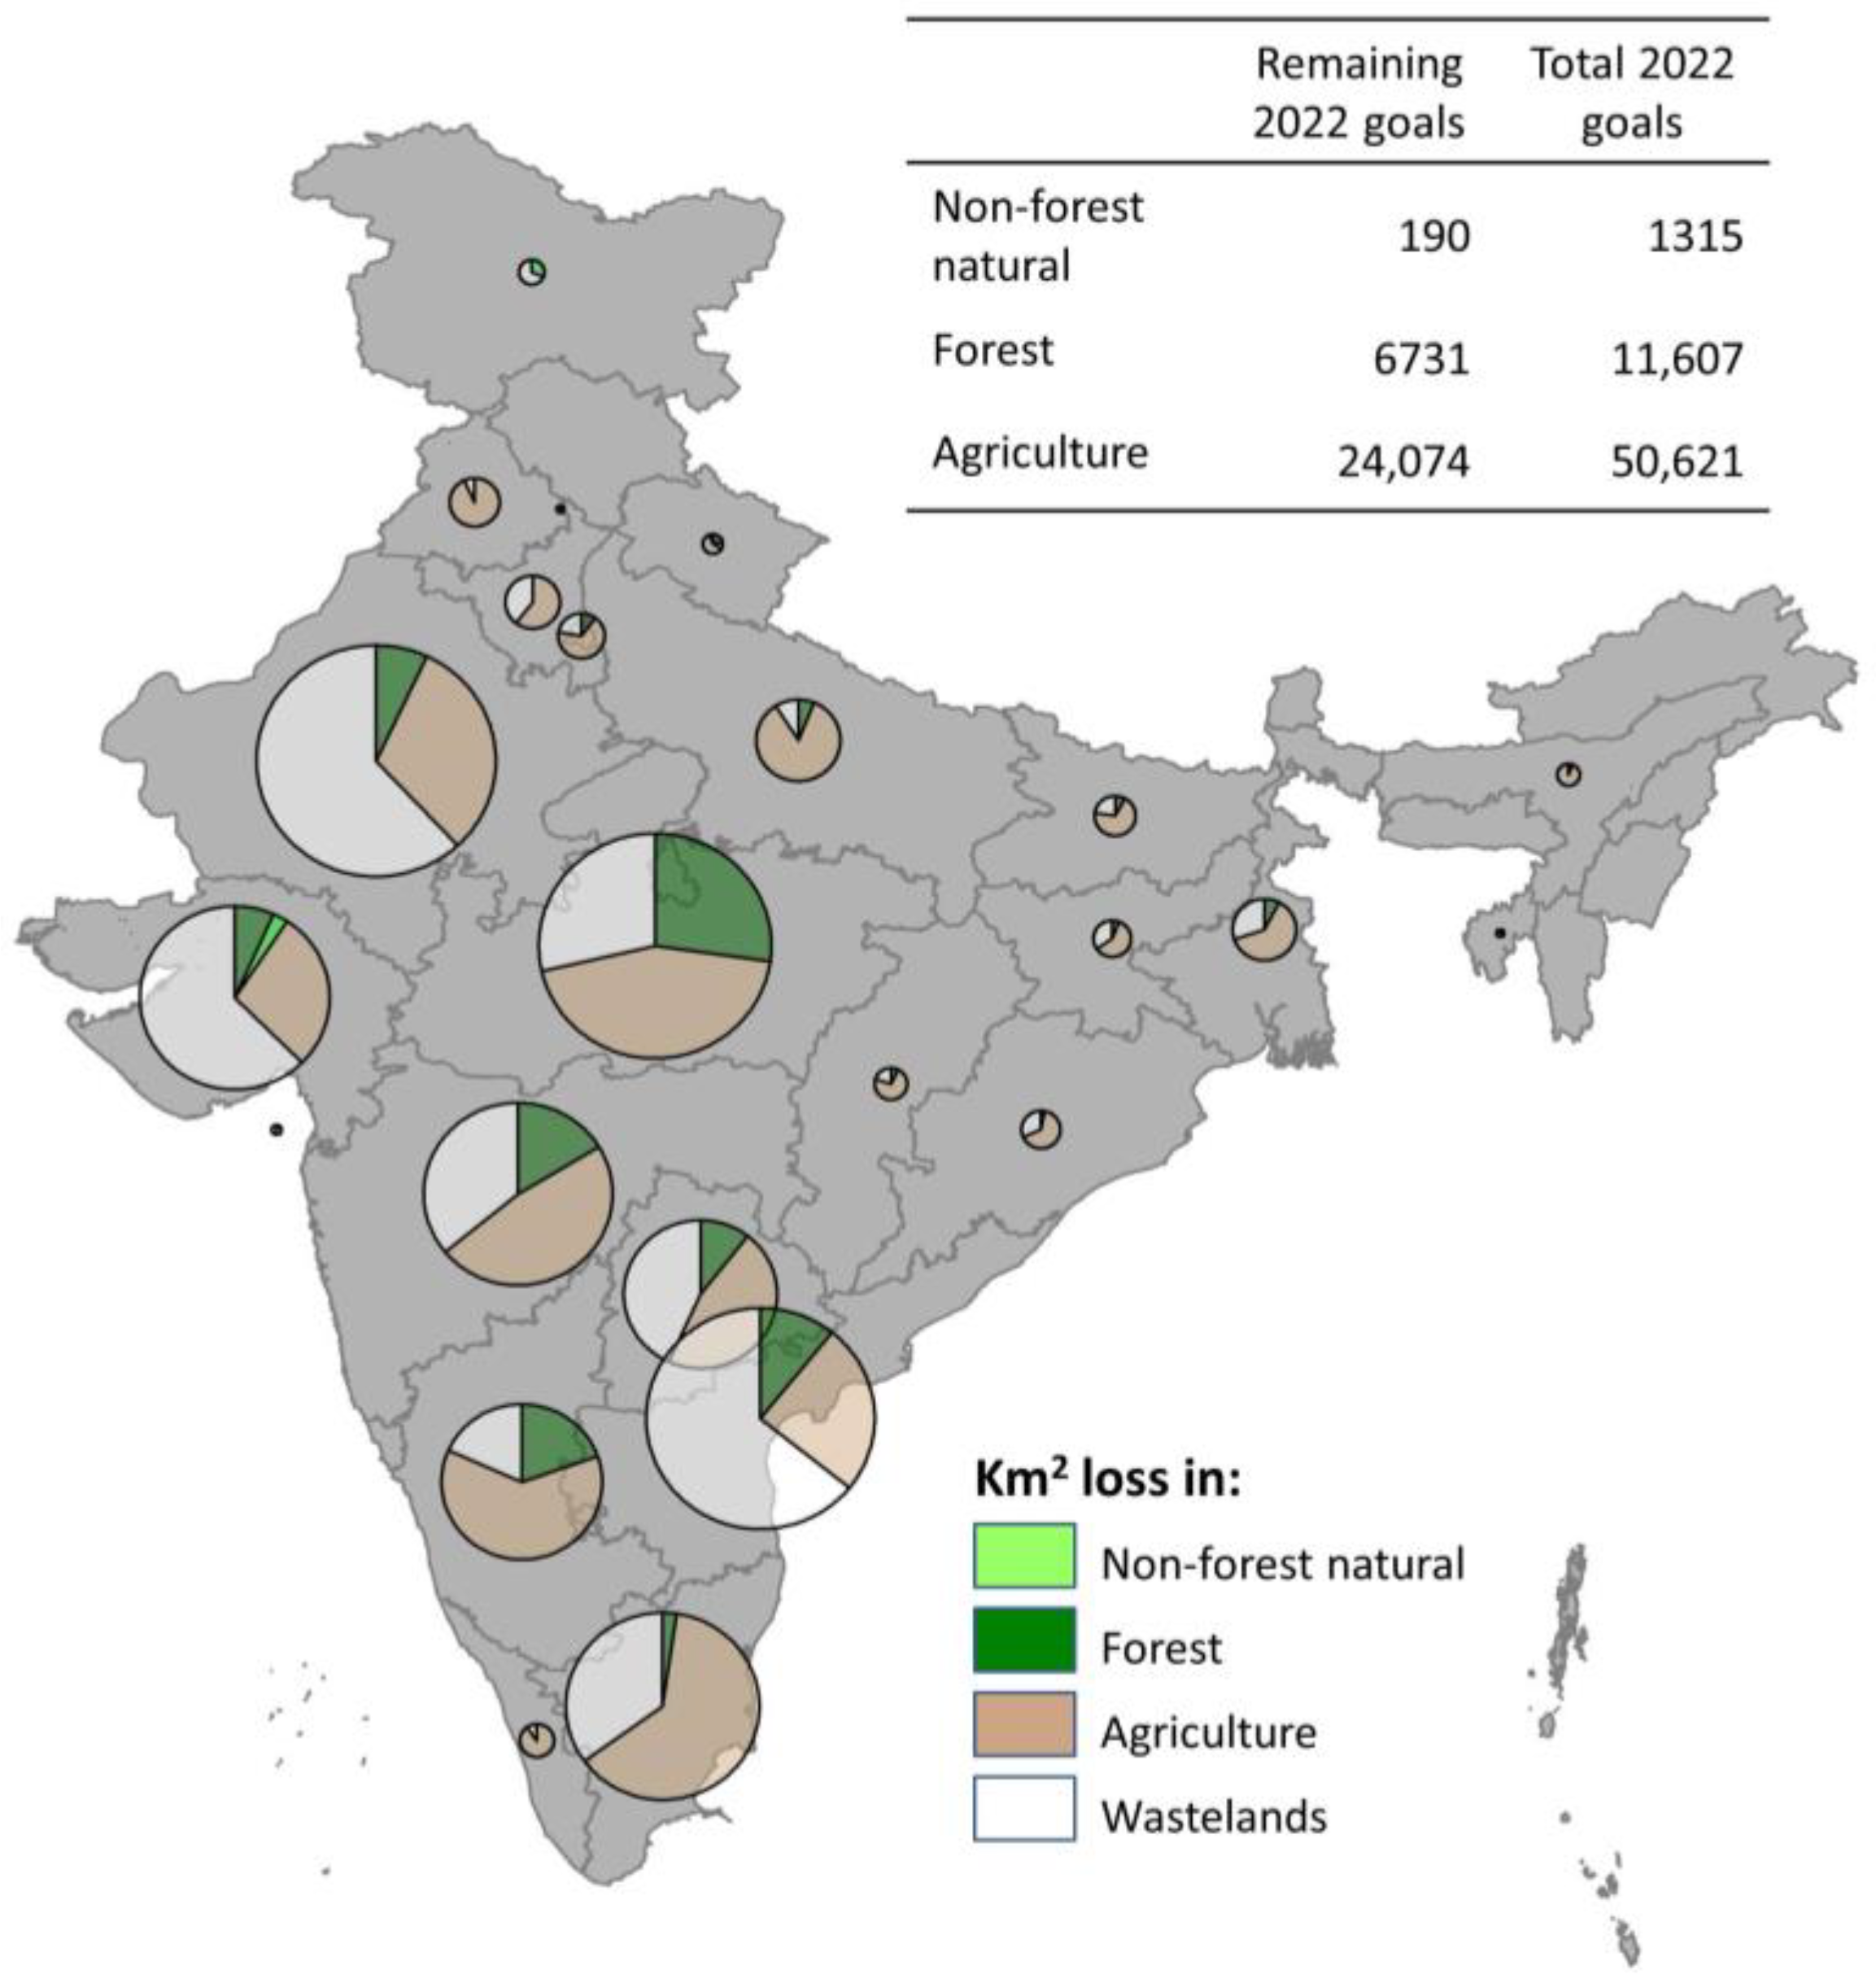
We examined the impacts of renewable energy siting on the potential conversion of current natural lands (forested and non-forested) and agricultural lands under the unconstrained scenario, where the full or remaining renewable energy goals were met by facilities being located where wind and solar energy resources are the highest. Because goals were specified separately for solar and wind, and because any given location may have the potential to produce energy for both sectors, we first sited ground-mounted solar and then allocated the remaining suitable cells for wind. Because installation of rooftop solar has been, to date, slow in India [15,34], we repeated the two allocation scenarios (full or remaining goals) where we assumed ground-mounted solar would provide both ground-mounted and rooftop solar goals (Figure 1). The latter allowed us to compare the amount of impact that can be avoided if rooftop solar installations are included as planned in the 2022 vision. Once targets were identified in accordance with the scenarios (Figure 1), we spatially allocated renewable energy to maximize output by (1) ranking cells within each state by sector from highest to lowest based on their technical potential, and (2) starting from the top classified cell, and then siting each sector’s development by ranked order until the total sited energy potential equaled or just surpassed the capacity goals. If at the stopping point more than one cell had similar technical potential value, we randomly sited renewable energy to the last few cells to meet goals. We then examined the potential impact of converting selected cells to each renewable energy sector by calculating losses (km2) of forested natural lands (LULC categories: evergreen forest, deciduous forest, and scrub/degraded forest cover types), non-forested natural lands (LULC categories: littoral swamp, grassland, and Rann cover types), and agricultural lands (LULC categories: Karif, Rabi, Zaid, double/triple crop, and plantation/orchard cover types).

3. Results

After removing areas unsuitable for renewable energy development (i.e., urban areas, permanently protected lands, and areas without economically viable wind and solar resource potential), our analysis indicates that a network of land-based wind turbines and solar arrays have the potential capacity of 1789 GW (or generation of >15 million GWh) across India in areas already converted by human activities (Figure 2; Table S1). Despite the extensive solar resources across India, seven states (Goa, Kerala, Manipur, Meghalaya, Mizoram, Nagaland, and Tripura) and three union territories (Dadar & Nagar Haveli, Daman & Diu, and Delhi) are unable to meet their full 2022 goals for ground-mounted solar within already converted lands (Table S1). However, when focused on the remaining goals, only Daman & Diu, Delhi, Kerala, and Tripura were unable to meet ground-mounted solar objectives. Notwithstanding the overage of wind resources across India, two states (Madhya Pradesh and Tamil Nadu) are unable to meet the full goals within already converted lands, while all can meet the remaining wind goals (Table S1).
The total land footprint needed to meet India’s 2022 renewable energy target is large, ranging from ~55,000 to 125,000 km2, but a development scenario that would meet the full goals by siting on converted lands would avert the displacement of 50,621 km2 of agricultural land, 11,607 km2 of forest, and 1315 km2 of other natural lands relative to the unconstrained scenario in which development is focused on exploiting the max wind and solar renewable energy potential (Figure 3 and Figure 4; Table S2). By constraining only remaining goals to converted lands, it would still avert the conversion of 24,074 km2, 6731km2, and 190 km2 of agricultural land, forest, and non-forest natural lands, respectively. In addition, impacts to agricultural and natural habitats can be further reduced if rooftop solar energy goals are met; achieving the full goals of ~40 GW rooftop solar would avert the conversion of an additional 5089 km2 of agricultural land, 331 km2 of forest, and 32 km2 of other natural lands with similar outcomes for only the remaining goals (Table S2). Not surprisingly, states with the largest projected renewable energy goals had the most agricultural and natural lands impacted.

4. Discussion

It is clear that in order to reach its 2022 vision, renewable energy goals India will need to strengthen the political economy for clean energy [35], expand the renewable energy certificate market [36], improve grid integration and management [37] and create financial viability [38]. It is also clear that investments in energy conservation and improved efficiency can help reduce the new energy needed by India, reducing the area impacted by new energy development. Solutions to the challenge of land acquisition are less obvious given the high population density and strong rights afforded to private landowners in India [39]. Our results demonstrate that potential land-use conflicts from renewable energy in India have both challenges and opportunities. The transition from fossil-fuel based energy generation to renewable energy generation would require a greater land footprint [40], leading to tradeoffs on land use and potentially exacerbating land use conflicts [41]. The total land footprint needed to meet India’s renewable energy targets is large, ranging from approximately 55,000 to 125,000 km2, or areas roughly the size of Himachal Pradesh or Chhattisgarh, respectively. Depending on the scenario’s goals (full or remaining, with rooftop solar or all ground-mounted solar), if renewable energy development proceeds with the singular aim of maximizing resource potential, approximately 6700–11,900 km2 of forest land and 24,100–55,700 km2 of agricultural land could be impacted. This lower range based on the remaining goal is likely optimistic because some solar and wind projects have already been sited on forest or natural lands [42,43]. These losses could cause environmental and social conflicts, jeopardize financial investment, and in turn slow the expansion of renewable energy in the country. Fortunately, our analyses also show that there is ample opportunity (>10 times what is needed) to achieve India’s solar and wind goals on converted lands, which are likely to have lower biodiversity or agricultural values.

4.1. Blending Renewable Energy Planning with The Mitigation Hierarchy

Accelerating renewable energy development while meeting India’s commitment to increase forest cover, along with other social and environmental goals, requires planning and implementation tools in order to evaluate tradeoffs [44] and facilitate decisions to avoid, minimize and mitigate impacts [45]. The converted lands prioritized for development in our scenarios likely represent lower-quality habitats, which are unlikely to support populations of imperiled species and natural community assemblages. These areas may also have relatively lower potential for social conflicts for food security, settlement, and use for biomass harvesting [17]. Thus, our results suggest that converted lands provide an opportunity to meet renewable energy goals that reduce impacts for people and nature. However, we recognize that ~27% India’s 329 million hectares are classified as wasteland, a key component of our converted area designation, and that there is still a significant portion of the population that depends on this land for livelihood [46]. Furthermore, given that the current designation of wastelands is based on remotely sensed data [17], care should be taken to ensure the converted lands designation is not a misclassification of important natural habitats, such as grasslands or wetlands [46,47]. If India wants to reach its renewable energy development goals, then they will encounter land use tradeoffs—and our analysis will help to illustrate the tradeoffs and provide options that may reduce conflicts—but the assessment of tradeoffs involved with the conversion of land for renewable energy development will need to happen at a scale where land use values can be accurately mapped and quantified.
In marked contrast to the converted lands that we prioritized in the constrained scenario, forested areas are critically important for biodiversity [48]. Species of conservation concern that require large intact habitats, such as tigers, are sensitive to human activity and may avoid lands with human disturbance. In India, the significance of human disturbance in areas important for tiger movement between protected areas has been highlighted as an important issue [48]. Poorly sited renewable energy development that results in the clearing of natural habitats may be incompatible with preserving the viability of species requiring large intact habitats. Apart from renewable energy, India also has ambitious reforestation and forest restoration goals as described in the GIM and further articulated in its Nationally Determined Contribution to UNFCCC [2]. Unplanned renewable energy development has the potential to undermine these reforestation goals. Unfortunately, renewable energy development is already occurring in areas outside of the converted lands we identified. These observations indicate that the current regulatory process is largely inadequate at ensuring that wind and solar production are low-impact. For example, by 2017, more than 4600 hectares of forest land was impacted by wind projects [42,43]. Similarly, several solar projects have impacted native grasslands that are home to endangered species such as the great Indian bustard [49].

4.2. Implementation Challenges and Opportunities

In India, wind and solar projects are considered “green” by most state regulatory agencies, which means that projects do not need an Environmental Impact Assessment (EIA) regardless of their size or location. Improving oversight through the use of an EIA or other centralized regulatory processes could be an easy mechanism to reduce impacts. Since there is a lack of a centralized regulatory framework or incentive structure, relying on farsighted developers to actively avoid a site with significant biodiversity or agricultural value is unlikely to achieve the desired results as past development patterns have demonstrated [42,43]. However, significant additional legislation restricting the production of renewable energy resources on private land based on wildlife concerns is unlikely given the present political climate [39]. Instead, improved incentives that provide a competitive advantage to developers that comply can be helpful for the adoption of low-impact development practices. Development of compliance standards could function as the basis for decision-making on power procurement by utilities. Since the production of renewable energy would usually not be funded without a long-term power purchase agreement, that would give developers strong incentives to comply with any requirements. These guidelines should not only recognize low-impact areas, but also identify areas of avoidance that cannot be approved for development. Formal standards and accreditation that guide power procurement, as well as guiding subsides to low impact projects, can all advance low impact siting [50]. Decision support tools that help to identify low conflicts solutions [51] can provide the necessary foundation to implement formal guidelines and certification schemes.
Ensuring that renewable energy avoids productive agricultural lands will also reduce conflicts that may slow proliferation. Maintaining the stability of the agriculture sector is an important part of India’s overall economic progress. Besides providing food, agricultural development represents 17–18% of total national income and >50% of the workforce is engaged in agricultural production [52,53]. In turn, growth in other sectors and economic stability overall depend, to a considerable extent, on the performance of India’s agriculture sector. Because agriculture continues to be the dominant sector in the Indian economy, ensuring that renewable energy avoids productive agricultural lands will reduce conflicts that may slow proliferation. Furthermore, agricultural expansion is one of the most important immediate deforestation drivers [54,55,56]; therefore, if we avoid displacing agriculture with renewable energy, then it will reduce the “domino-effect” of additional natural land conversion to replace the lost agricultural lands. However, while solar plants produce a major change in land use, wind farms usually only use 2–4 percent of an area and can be co-developed within areas of agricultural production [57]. In addition, farmers in the U.S.A. may earn $4000–$8000 per turbine each year when they lease cropland for wind energy development [58]. However, wind requires almost 6 times as much land as solar [40], and if feasible given constraints, switching solar for wind could reduce the overall land needed to meet goals.

4.3. Analysis Caveats

While our study shows that wind and solar deployment can be placed in ways that mitigate conflicts about land use, our research fails to consider several important issues and does not seek to delineate exactly where renewable energy should be installed. For example, the opportunity to establish renewable energy facilities on converted land can be limited by site-specific features or landowner preferences. The proactive inclusion of land ownership, especially land claims of marginalized peoples, such as indigenous groups, should be an important component of the decision making process. However, the deployment of new renewable power facilities is restricted by transmission capacity; therefore, the availability of transmission lines can have a huge impact on the development of new wind farms and solar arrays. Transmission lines also result in land conversion and fragmentation, which can substantially increase impacts to agriculture and natural lands. We, therefore, suggest that site-specific siting (and general guidelines) target transmission lines to low-impact areas. Finally, we suggest that our identification of converted lands represents the first step to guide renewable energy development to reduce impacts to natural and agricultural land. Even in the areas that we say should be the priority for future development, there may be important conservation values that can mitigated by good micro-siting practices and better on-site management (e.g., reducing blade movement to reduce bat or bird mortality) [59]. With the national surplus in wind and solar energy, it is possible for states that do not meet wind and solar targets on converted lands to import electricity from states with surpluses of low impact renewable energy. In fact, several states have a substantial overage of renewable energy on low impact lands (Figure 3), where further growth could help mitigate disputes over land use. If transmission and political restrictions make it practical, increasing the deployment of renewable energy facilities to states with a surplus of renewable energy potential on converted areas may mitigate some of the possible conflicts in land use. It may also be possible to reduce potential land conflicts by switching the mix of wind and solar that states use to meet their goals.

5. Conclusions

The first obvious step towards sustainable renewable energy development will involve guiding production onto previously converted or degraded lands [41]. Utilizing the power of systematic conservation planning would allow stakeholders to evaluate the impact of development scenarios that impact lands with a high conservation value while concurrently identifying low impact renewable energy “go-zones”, thereby reducing conflicts that can slow investment [40,41,50]. There are two main applications from the results of our study that can guide additional analysis. First and foremost, our study will help decision-makers understand the scope and scale of future impacts of renewable energy, providing the incentive to invest in the development of principles and planning that improve renewable energy siting. As our research has shown, if these new renewable energy facilities are not deployed carefully, they will adversely affect vital ecosystem services. For this level of development to be sustainable in India, the challenge is to co-develop environments that satisfy the increasing energy demand and reduce their impacts on both nature and people. Nevertheless, Indian society remains largely unaware of the significant footprint from future energy development and the urgent need to prepare for it [39,42,43]. Secondly, our research will help to identify areas where conservation values are most at risk as a result of the expansion of renewable energy development and where more detailed planning is urgently required. This type of planning will have to include stakeholders and data sets that are normally not brought together—blending the fields of environmental science and energy engineering. Given this difficulty, it will be important to carefully focus where these investments will avoid the most harm and in turn deliver the best return on investment. States with the highest wind and solar development objectives would also likely have the greatest difficulty finding solutions that avoid impact. Nonetheless, these same states vary with respect to potential impacts on natural habitat and high-production agriculture, and our research will help ensure that attention is focused on the most vulnerable states (Table 1, Figure 3 and Figure 4).
In areas where the production of renewable energy will interfere with protecting natural habitats, approaches are needed to balance development objectives and conservation outcomes. Targeting renewable energy to converted areas with lower potential conflict will concurrently help society achieve clean energy targets, maintain food security, improve restoration and health of forests, and protect biodiversity. Our analysis shows that all wind and solar energy demand from India’s 2022 target can be met on lands likely to have a low impact on agriculture production and biodiversity conservation. Avoiding the exacerbation of current and future land scarcity in the second most populous country in the world would entail proactive landscape planning coupled with proper incentive mechanisms from power purchasers and lending institutions. In India, renewable energy production on converted lands could provide over 10 times the 2022 target, but the development of new strategies and interventions are needed to ensure siting is sustainable.

Supplementary Materials

The following are available online at https://www.mdpi.com/2071-1050/12/1/281/s1, Table S1: India’s renewable energy generation goals (GWh), the available renewable energy technical potential on converted lands (wastelands), and the ratio of GWh on converted to generation goals by state or union territory. Goals and ratio are specified for the full 2022 vision goals for solar (rooftop and ground-mounted) and wind renewable energy, and for the remaining goals if 2017 installed capacity is subtracted. Goals were converted from MW to GWh by multiplying by 8760 h per year and dividing by 1000 (MW/GW). Ratios are also specified if all solar goals (i.e., rooftop and ground-mounted) are met using ground-mounted solar based on current installation trends. NA entries for GWh available on converted lands may reflect no suitable areas meeting development criteria (e.g., slope < 5% for solar) are available on converted lands, or that input layers (e.g., GHI irradiation) did not cover the state or territory. Table S2: The amount of km2 allocated by state or union territory to ground-mounted solar or wind renewable energy to meet India’s renewable energy goals, and the potential impacts (km2 loss) to agriculture, forest, and on-forest natural lands if renewable energy is sited where solar and wind resources are the highest. Allocation and impacts are provided for four goals scenarios considering the full 2022 vision goals or only the remaining goals after subtracting 2017 installed capacity, and considering allocation of all solar goals (rooftop and ground-mounted) to ground-mounted installation reflecting current trends, or allocation of rooftop and ground-mounted goals separately. Differences summary row represent the difference of km2 impact between the latter scenarios (i.e., rooftop solar goals are fulfilled separately, or where all solar goals are met with ground mounted solar).

Author Contributions

J.K. and D.N. conceived the study; S.B.-M. and J.K designed the study; S.B.-M. and M.H. collected and analyzed the data, and produced figures and tables; J.O., P.C. assisted in data collection and provided input on the analysis approach; J.K. and S.B.-M. interpreted results and wrote the paper with contributions from D.N., C.K., J.O., and P.C. All authors have read and agreed to the published version of the manuscript.

Funding

Macarthur Foundation of India, Enterprise Foundation, The Nature Conservancy, and Roy Vagelos.

Acknowledgments

We Thank Macarthur Foundation of India, Enterprise Foundation, The Nature Conservancy, and Roy Vagelos for Funding Support. We appreciate input from Kunal Sharma, Sushil Saigal, Seema Paul, Jai Asundi, Saroo Brierley and Gaurav Kapoor.

Conflicts of Interest

The authors declare no conflict of interest. The funders had no role in the design of the study; in the collection, analyses, or interpretation of data; in the writing of the manuscript, or in the decision to publish the results.

References

  1. Palchak, D.; Cochran, J.; Ehlen, A.; McBennett, B.; Milligan, M.; Chernyakhovskiy, I.; Sreedharan, P.W. Greening the Grid: Pathways to Integrate 175 Gigawatts of Renewable Energy into India’s Electric Grid, Vol. I—National Study (2017); National Renewable Energy Lab. NREL: Golden, CO, USA, 2017. Available online: https://www.osti.gov/servlets/purl/1369138 (accessed on 20 October 2019). [CrossRef] [Green Version]
  2. Government of India. India’s Intended Nationally Determined Contribution, as Submitted to the United Nations Framework Convention on Climate Change. 2016. Available online: https://www4.unfccc.int/sites/submissions/indc/Submission%20Pages/submissions.aspx (accessed on 28 December 2019).
  3. Khare, V.; Nema, S.; Baredar, P. Status of solar wind renewable energy in India. Renew. Sustain. Energy Rev. 2013, 27, 1–10. [Google Scholar] [CrossRef] [Green Version]
  4. NITI Aayog. Report on India’s Renewable Electricity Roadmap 2030: Toward Accelerated Renewable Electricity Deployment; NITI Aayog: New Delhi, India, 2015. Available online: http://niti.gov.in/writereaddata/files/document_publication/RE_Roadmap_ExecutiveSummary.pdf (accessed on 4 April 2018).
  5. Patil, M. Modi Government’s Big Solar Push Could Run into Land Hurdle the Economic Times 2017. Available online: http://economictimes.indiatimes.com/industry/energy/power/modi-governments-big-solar-push-could-run-into-land-hurdle-readwhy/articleshow/57850475.cms (accessed on 8 January 2018).
  6. Rajaram, R. The Biggest Challenge is Acquiring Land for Wind Farms. Project Monitor 2012. Available online: http://www.projectsmonitor.com/interviews/thebiggest-challenge-is-acquiring-land-for-wind-farms/ (accessed on 8 January 2019).
  7. Siraj, M.A. Wind Power Faces Rough Weather [WWW Document]. The Hindu. 2015. Available online: http://www.thehindu.com/features/homes-and-gardens/wind-power-faces-roughweather/article7064997.ece (accessed on 8 January 2018).
  8. United Nations, Department of Economic and Social Affairs, Population Division. World Population Prospects: The 2017 Revision, Custom Data Acquired via Website; United Nations, Department of Economic and Social Affairs, Population Division: New York, NY, USA, 2017. [Google Scholar]
  9. Chakravorty, S. The Price of Land: Acquisition, Conflict and Consequence; Oxford University Press: New Delhi, India, 2015. [Google Scholar]
  10. Rights and Resources Initiative. Land Conflicts in India—An Interim Analysis, Technical Report (2016), Tata Institute of Social Sciences. Available online: https://rightsandresources.org/en/publication/land-conflicts-india-interim-analysis/#.XT6tYOtKjIU (accessed on 27 March 2019).
  11. India Ministry of Environment and Forests (2015). National Mission for a Green India (Under the National Action Plan on Climate Change). Available online: http://www.moef.gov.in/sites/default/files/GIM_Mission%20Document-1.pdf (accessed on 12 May 2018).
  12. Mahtta, R.; Joshi, P.K.; Jindal, A.K. Solar power potential mapping in India using remote sensing inputs and environmental parameters. Renew. Energy 2014, 71, 255–262. [Google Scholar] [CrossRef]
  13. Mentis, D.; Siyal, S.H.; Korkovelos, A.; Howells, M. A geospatial assessment of the techno-economic wind power potential in India using geographical restrictions. Renew. Energy 2016, 97, 77–88. [Google Scholar] [CrossRef]
  14. CSTEP; WFMS; SSEF. Reassessment of India’s Onshore Wind Potential, Technical Report, Center for Study of Science, Technology, and Policy, WinDForce Management Services, and Shakti Sustainable Energy Foundation. 2016. Available online: http://www.indiaenvironmentportal.org.in/files/file/IndiaWindPotentialAssessment.pdf (accessed on 28 December 2019).
  15. India Ministry of New and Renewable Energy, Government of India. 2018. Available online: https://mnre.gov.in/physical-progress-achievements# (accessed on 4 November 2019).
  16. Deshmukh, R.; Wu, G.C.; Callaway, D.S.; Phadke, A. Geospatial and techno-economic analysis of wind and solar resources in India. Renew. Energy 2019, 134, 947–960. [Google Scholar] [CrossRef] [Green Version]
  17. National Remote Sensing Centre of India. Land Use/Land Cover Database on 1:50,000 Scale, Natural Resources Census Project, LUCMD, LRUMG, RS & GIS AA; National Remote Sensing Centre, ISRO: Hyderabad, India, 2012.
  18. UNEP-WCMC and IUCN. Protected Planet: India; The World Database on Protected Areas (WDPA)/The Global Database on Protected Areas Management Effectiveness (GD-PAME); UNEP-WCMC and IUCN: Cambridge, UK, 2018; Available online: www.protectedplanet.net (accessed on 27 March 2019).
  19. International Union for Conservation of Nature. World Database on Protected Areas (WDPA). 2017. Available online: https://www.iucn.org/theme/protected-areas/our-work/quality-and-effectiveness/world-database-protected-areas-wdpa (accessed on 27 March 2019).
  20. ESRI ArcGIS for Desktop: Release 10; Environmental Systems Research Institute: Redlands, CA, USA, 2015.
  21. R Core Team. R: A Language and Environment for Statistical Computing; R Foundation for Statistical Computing: Vienna, Austria, 2017; Available online: https://www.R-project.org/ (accessed on 28 December 2019).
  22. Baruch-Mordo, S.; Kiesecker, J.; Kennedy, C.M.; Oakleaf, J.R.; Opperman, J.J. From Paris to practice: Sustainable implementation of renewable energy goals. Environ. Res. Lett. 2019, 14. [Google Scholar] [CrossRef]
  23. Deng, Y.Y.; Haigh, M.; Pouwels, W.; Ramaekers, L.; Brandsma, R.; Schimschar, S.; Grözinger, J.; de Jager, D. Quantifying a realistic, worldwide wind and solar electricity supply. Glob. Environ. Chang. 2015, 31, 239–252. [Google Scholar] [CrossRef] [Green Version]
  24. Lopez, A.; Roberts, B.; Heimiller, D.; Blair, N.; Porro, G.U.S. Renewable Energy Technical Potentials: A GIS Based Analysis; Report no. NREL/TP-6A20–51946; National Renewable Energy Laboratory: Golden, CO, USA, 2012.
  25. Köberle, A.C.; Gernaat, D.E.H.J.; van Vuuren, D.P. Assessing current and future techno-economic potential of concentrated solar power and photovoltaic electricity generation. Energy 2015, 89, 739–756. [Google Scholar] [CrossRef] [Green Version]
  26. Hernandez, R.R.; Hoffacker, M.K.; Murphy-Mariscal, M.L.; Wu, G.C.; Allen, M.F. Solar energy development impacts on land cover change and protected areas. Proc. Natl. Acad. Sci. USA 2015, 112, 13579–13584. [Google Scholar] [CrossRef] [Green Version]
  27. Hermann, S.; Miketa, A.; Fichaux, N. Estimating the Renewable Energy Potential in Africa GIS-Based Approach; IRENA Working Paper; International Renewable Energy Agency: Abu Dhabi, UAE, 2014. [Google Scholar]
  28. He, G.; Kammen, D.M. Where, when and how much solar is available? A provincial-scale solar resource assessment for China Renew. Energy 2016, 85, 74–82. [Google Scholar] [CrossRef] [Green Version]
  29. Wu, G.C.; Deshmukh, R.; Ndhlukula, K.; Radojicic, T.; Reilly-Moman, J.; Phadke, A.; Callaway, D.S. Strategic siting and regional grid interconnections key to low-carbon futures in African countries. Proc. Natl. Acad. Sci. USA 2017, 114, E3004–E3012. [Google Scholar] [CrossRef] [Green Version]
  30. Oakleaf, J.R.; Kennedy, C.M.; Baruch-Mordo, S.; Gerber, J.S.; West, P.C.; Johnson, J.A.; Kiesecker, J. Mapping global development potential for renewable energy, fossil fuels, mining and agriculture sectors. Sci. Data 2019, 6, 101. [Google Scholar] [CrossRef] [PubMed]
  31. IRENA (International Renewable Energy Agency). Data Quality for the Global Renewable Energy Atlas—Solar and Wind. 2013. Available online: https://www.irena.org/publications/ (accessed on 28 December 2019).
  32. IRENA (International Renewable Energy Agency). Global Atlas for Renewable Energy, Overview of Solar and Wind Maps. 2014. Available online: https://www.irena.org/publications/ (accessed on 28 December 2019).
  33. Li, X.; Hubacek, K.; Siu, Y.L. Wind power in China—Dream or reality? Energy 2012, 37, 51–60. [Google Scholar] [CrossRef]
  34. Goel, M. Solar rooftop in India: Policies, challenges and outlook. Green Energy Environ. 2016, 1, 129–137. [Google Scholar] [CrossRef] [Green Version]
  35. Rehman, S.; Hussain, Z. Renewable Energy Governance in India: Challenges and Prospects for Achieving the 2022 Energy Goals. J. Resour. Energy Dev. 2018, 14, 13–22. [Google Scholar] [CrossRef] [Green Version]
  36. Kaladharan, M. Renewable Energy in India: An Analysis of the Regulatory Environment and Evolving Policy Trends. Centre for Policy Research. 2016. Available online: https://cprindia.org/ (accessed on 17 November 2019).
  37. KAPSARC (King Abdullah Petroleum Studies and Research Center). Renewable Energy Policy in India: Creation, Implementation and Efficacy. 2016. Available online: https://www.kapsarc.org/wp-content/uploads/2016/08/KS-1632-WB031A-Renewable-Energy-Policy-in-India_Creation-Implementation-and-Efficacy.pdf (accessed on 27 September 2019).
  38. IEEFA (Institute for Energy Economics and Financial Analysis). India Electricity Sector Transformation: Global Capacity Building. 2015. Available online: http://ieefa.org/wp-content/uploads/2015/11/IEEFA-India-Electricity-Sector-Transformation_Global-Capacity-Building_11112015.pdf (accessed on 20 September 2019).
  39. Mohan, A. Whose land is it anyway? Energy futures & land use in India. Energy Policy 2017, 110, 257–262. [Google Scholar]
  40. McDonald, R.I.; Fargione, J.; Kiesecker, J.; Miller, W.M.; Powell, J. Energy Sprawl or Energy Efficiency: Climate Policy Impacts on Natural Habitat for the United States of America. PLoS ONE 2009, 4, e6802. [Google Scholar] [CrossRef] [Green Version]
  41. Kiesecker, J.M.; Naugle, D.E. (Eds.) Energy Sprawl Solutions: Balancing Global Development and Conservation; Island Press: Washington, DC, USA, 2017. [Google Scholar]
  42. Government of India, Loksabha Unstarred Question 1026. 2018. Available online: http://164.100.47.190/loksabhaquestions/annex/14/AU1026.pdf (accessed on 4 October 2019).
  43. Egreenwatch, e-Green Watch—FCA Projects, Diverted Land, Compensatory Land Management 2018. Available online: http://egreenwatch.nic.in/FCAProjects/Public/Rpt_State_Wise_Count_FCA_projects.aspx (accessed on 4 October 2019).
  44. Kennedy, C.M.; Hawthorne, P.L.; Miteva, D.A.; Baumgarten, L.; Sochi, L.; Matsumoto, M.; Kiesecker, J. Optimizing land use decision-making to sustain Brazilian agricultural profits, biodiversity, and ecosystem services. Biol. Conserv. 2016, 204, 221–230. [Google Scholar] [CrossRef] [Green Version]
  45. Kiesecker, J.M.; Copeland, H.; Pocewicz, A.; McKenney, B. Development by design: Blending landscape-level planning with the mitigation hierarchy. Front. Ecol. Environ. 2010, 8, 261–266. [Google Scholar] [CrossRef]
  46. Vanak, A.; Hiremath, A.; Rai, N. Wastelands of the Mind: The Identity Crisis of India’s Tropical Savannas; Current Conservation, Issue 7.3. Delhi, India, 2013. Available online: https://www.currentconservation.org/wastelands-of-the-mind-the-identity-crisis-of-indias-tropical-savannas/ (accessed on 28 December 2019).
  47. Rawat, G.S.; Adhikari, B.S. (Eds.) Ecology and Management of Grassland Habitats in India; Wildlife Institute of India: Dehradun, India, 2015.
  48. Borah, J.; Jena, J.; Yumnam, B.; Puia, L. Carnivores in corridors: Estimating tiger occupancy in Kanha—Pench corridor, Madhya Pradesh, India. Reg. Environ. Chang. 2016, 16, 43–52. [Google Scholar] [CrossRef]
  49. Vanak, A.; Kulkarni, A.; Gode, A.; Sheth, C.; Krishnaswamy, J. Extent and Status of Semi-Arid Savanna Grasslands in Peninsular India. In Grassland Vegetation of India: An Update; Rawat, G.S., Adhikari, B.S., Eds.; ENVIS Bulletin: Wildlife & Protected Areas; Wildlife Institute of India: Dehradun, India, 2015; pp. 192–201. Available online: http://wiienvis.nic.in/WriteReadData/Publication/19_Grassland%20Habitat_2016.pdf (accessed on 4 October 2019).
  50. Cameron, D.R.; Crane, L.; Parker, S.S.; Randall, J.M. Solar Energy Development and Regional Conservation Planning. In Energy Sprawl Solutions; Kiesecker, J.M., Naugle, D., Eds.; Island Press: Washington, DC, USA, 2017; pp. 66–75. [Google Scholar]
  51. The Nature Conservancy of India. Renewable Energy by Design Siting Tool. Available online: www.tncindia.in/siteright (accessed on 28 December 2019).
  52. Tripathi, A.; Prasad, A.R. Agricultural Development in India since Independence: A Study on Progress, Performance, and Determinants. J. Emerg. Knowl. Emerg. Mark. 2009, 1, 8. [Google Scholar] [CrossRef] [Green Version]
  53. India Ministry of Finance. India Economic Survey 2017–18; Ministry of Finance, Government of India: New Delhi, India, 2018.
  54. Jha, C.S.; Dutt, C.B.S.; Bawa, K.S. Deforestation and Land Use Changes in Western Ghats, India. Curr. Sci. 2000, 79, 231–238. [Google Scholar]
  55. Reddy, C.S.; Jha, C.S.; Dadhwal, V.K.; Hari Krishna, P.; Pasha, S.V.; Satish, S.K.; Diwakar, P.G. Quantification and Monitoring of Deforestation in India over Eight Decades (1930–2013). Biodivers. Conserv. 2016, 25, 93–116. [Google Scholar] [CrossRef]
  56. Yadav, P.K. Slash-and-Burn Agriculture in North-East India. J. Expert Opin. Environ. Biol. 2013, 2, 2–5. [Google Scholar] [CrossRef]
  57. AWEA (American Wind Energy Association) Wind Energy and Wildlife. 2009. Available online: http://www.awea.org/documents/factsheets/Wind_Energy_and_Wildlife_Mar09.pdf (accessed on 4 October 2019).
  58. Burt, M.; Firestone, J.; Madsen, J.A.; Veron, D.E.; Bowers, R. Tall towers, long blades and manifest destiny: The migration of land-based wind from the Great Plains to the thirteen colonies. Appl. Energy 2017, 206, 487–497. [Google Scholar] [CrossRef]
  59. Arnett, E.B.; Huso, M.M.P.; Schirmacher, M.M.; Hayes, J.P. Altering turbine speed reduces bat mortality at wind-energy facilities. Front. Ecol. Environ. 2011, 9, 209–214. [Google Scholar] [CrossRef] [Green Version]
Figure 1. Scenarios considered in the assessment. The aim of this study was to quantify the potential impacts to existing agricultural and natural lands from renewable energy development if it is sited regardless of current land use (unconstrained scenario) or constrained to lands already converted or degraded by human activities (constrained scenario). Because some renewable energy facilities have already been installed (~60 GW), we examined impacts as a range between the full 2022 goals and the remaining goals (i.e., 2022 goals—2017 installed capacity. Because proliferation of rooftop solar has been slow in India and solar development to date largely consists of ground-mounted solar, we compared the land use change impacts when all solar renewable energy targets are met only with ground-mounted development, and when states meet their rooftop and ground-mounted solar goals separately as planned.
Sustainability 12 00281 g001
Figure 2. Solar (rooftop and ground mounted photovoltaics) and wind GW goals for each state, union territory, and district based on the Indian government’s 160 GW forecast of wind and solar energy production to meet the 2022 vision.
Sustainability 12 00281 g002
Figure 3. Ground-mounted solar (PV) (a) and Wind (b) technical potential in GWh overlaid on converted lands, defined as land use land cover categories of current fallow, gullied, other wastelands, scrubland, and shifting cultivation. Black areas are converted lands that did not have renewable energy potential based on our biophysical thresholds (e.g., amount of wind resource, slope, elevation, etc.).
Sustainability 12 00281 g003
Figure 4. Results of development scenario that allow for unconstrained development based solely on maximizing wind and solar renewable energy potential. Pie charts and insert table highlight agricultural lands, forest, and other natural land cover types that could be impacted if development is based solely on maximizing wind and solar renewable energy potential and is not placed in a restricted manner on converted lands of low value to agriculture and biodiversity, which is defined as land use land cover categories of current fallow, gullied, other wastelands, scrubland, and shifting cultivation.
Sustainability 12 00281 g004
Table 1. Solar (rooftop and ground mounted photovoltaics), wind, and total GW goals based on the 2022 vision [1], and installed capacities up to 2017 for each state, union territory, and district [15].
Name2022 Vision Targets (GW)2017 Installed Capacity (GW)Name2022 Vision Targets (GW)2017 Installed Capacity (GW)
Solar RooftopSolar Ground-MountedWindSolar RooftopSolar Ground-MountedWindSolar RooftopSolar Ground-MountedWindSolar RooftopSolar Ground-MountedWind
Andaman & Nicobar0.0200.007 0.0010.011 Lakshadweep0.010 0.001
Andhra Pradesh2.0007.8348.1000.0222.1433.835Madhya Pradesh2.2003.4756.2000.0171.1932.498
Arunachal Pradesh0.050 0.004<0.001 Maharashtra4.7007.2267.6000.1520.6204.778
Assam0.2500.413 0.0020.010 Manipur0.0500.055 0.001
Bihar1.0001.493 0.0040.138 Meghalaya0.0500.111 <0.001
Chandigarh0.1000.053 0.0140.005 Mizoram0.0500.022 <0.001
Chhattisgarh0.7001.083 0.0130.166 Nagaland0.0500.011 0.001
Dadar & Nagar Haveli0.2000.249 0.003 Odisha1.0001.377 0.0030.076
Daman & Diu0.1000.099 <0.0010.010 Puducherry0.1000.146 <0.001<0.001
Delhi1.1001.662 0.0670.003 Punjab2.0002.772 0.0780.836
Goa0.1500.208 0.001 Rajasthan2.3003.4628.6000.0532.2594.282
Gujarat3.2004.8208.8000.0921.2625.537Sikkim0.050 <0.001
Haryana1.6002.542 0.0860.130 Tamil Nadu3.5005.38411.9000.1101.7127.970
Himachal Pradesh0.3200.456 0.001 Telangana2.000 2.0000.0272.9630.101
Jammu & Kashmir0.4500.705 0.0010.001 Tripura0.0500.055 <0.0010.005
Jharkhand0.8001.195 0.0070.017 Uttar Pradesh4.3006.397 0.0560.495
Karnataka2.3003.3976.2000.0851.7173.793Uttarakhand0.3500.550 0.0180.231
Kerala0.8001.070 0.0380.0500.052West Bengal2.1003.236 0.0230.017

