3.1. First Stage
In line with Cobo et al. [
15], a five step process of theme detection was used: (1) raw data collection (Social Science Citation Index of WoS), (2) selection of item type for analysis (author keywords), (3) relevant information extraction from the raw data (co-occurrence frequencies of keywords), (4) calculation of item similarities based on the extracted information and (5) theme detection using a clustering algorithm.
An analysis of keywords related to the articles in the research sample was carried out to study the themes addressed in this line of research. In line with previous works, keywords were considered to be representative terms for the themes studied [
15,
28]. Further, the keywords analyzed were those used by the authors and the WoS database for each document. Prior to constructing the co-word analysis, the keywords were standardized in line with Choi et al. [
28]. The following rules were used:
Keywords were standardized into a unique form, e.g., ethic and ethics.
Abbreviations were avoided. When both the original word and the abbreviated form(s) appeared in the keyword list, they were consolidated into the original word, e.g., corporate social responsibility, CSR.
Synonyms were unified. When there were two or more synonyms in the list, they were exchanged for the most general keyword, e.g., traditional banking and conventional banking.
Terms that were too general or did not have a clear meaning were eliminated, e.g., model, framework.
These rules were applied to 735 different keywords. This refinement produced a keyword database with 459 keywords. The most frequent keywords (WoS) appear in
Table 10.
VOS Viewer software [
29] was used to analyze the structure of the keyword network constructed from this database. In addition, Bibexcel [
30] and Microsoft Excel were used to carry out a descriptive bibliometric analysis of the database. Finally Pajek [
31] was used to perform a special analysis that could not be performed with VOS Viewer.
Principal research themes were pinpointed computing co-occurrences of keywords considered to be representative of each document based on the periods of time studied [
32]. The decision was made to consider just two periods of time to perform the co-word analysis. The first period contains documents published from 2009 to 2014. The second period includes papers published from 2015 until November 2019.
The association index is calculated after calculating the co-occurrence matrix. There are various approaches in the literature to performing this calculation. One of the most common approaches is called association strength. This approach, following Van Eck and Walman [
33], has advantages with respect to other measures. From the indexes that result from the calculation, a clustering algorithm is applied to identify subgroups of keywords that are strongly associated, and are topics on which researchers focus. Among techniques for applying clustering algorithms, the VOS algorithm stands out [
34,
35]. As a result of the application of the algorithm, it is possible to distinguish different thematic groups, which can then be characterized.
3.2. Second Stage
Co-words are used in mapping science to obtain clusters of keywords viewed as themes [
15]. The second stage involves identifying themes and thematic networks.
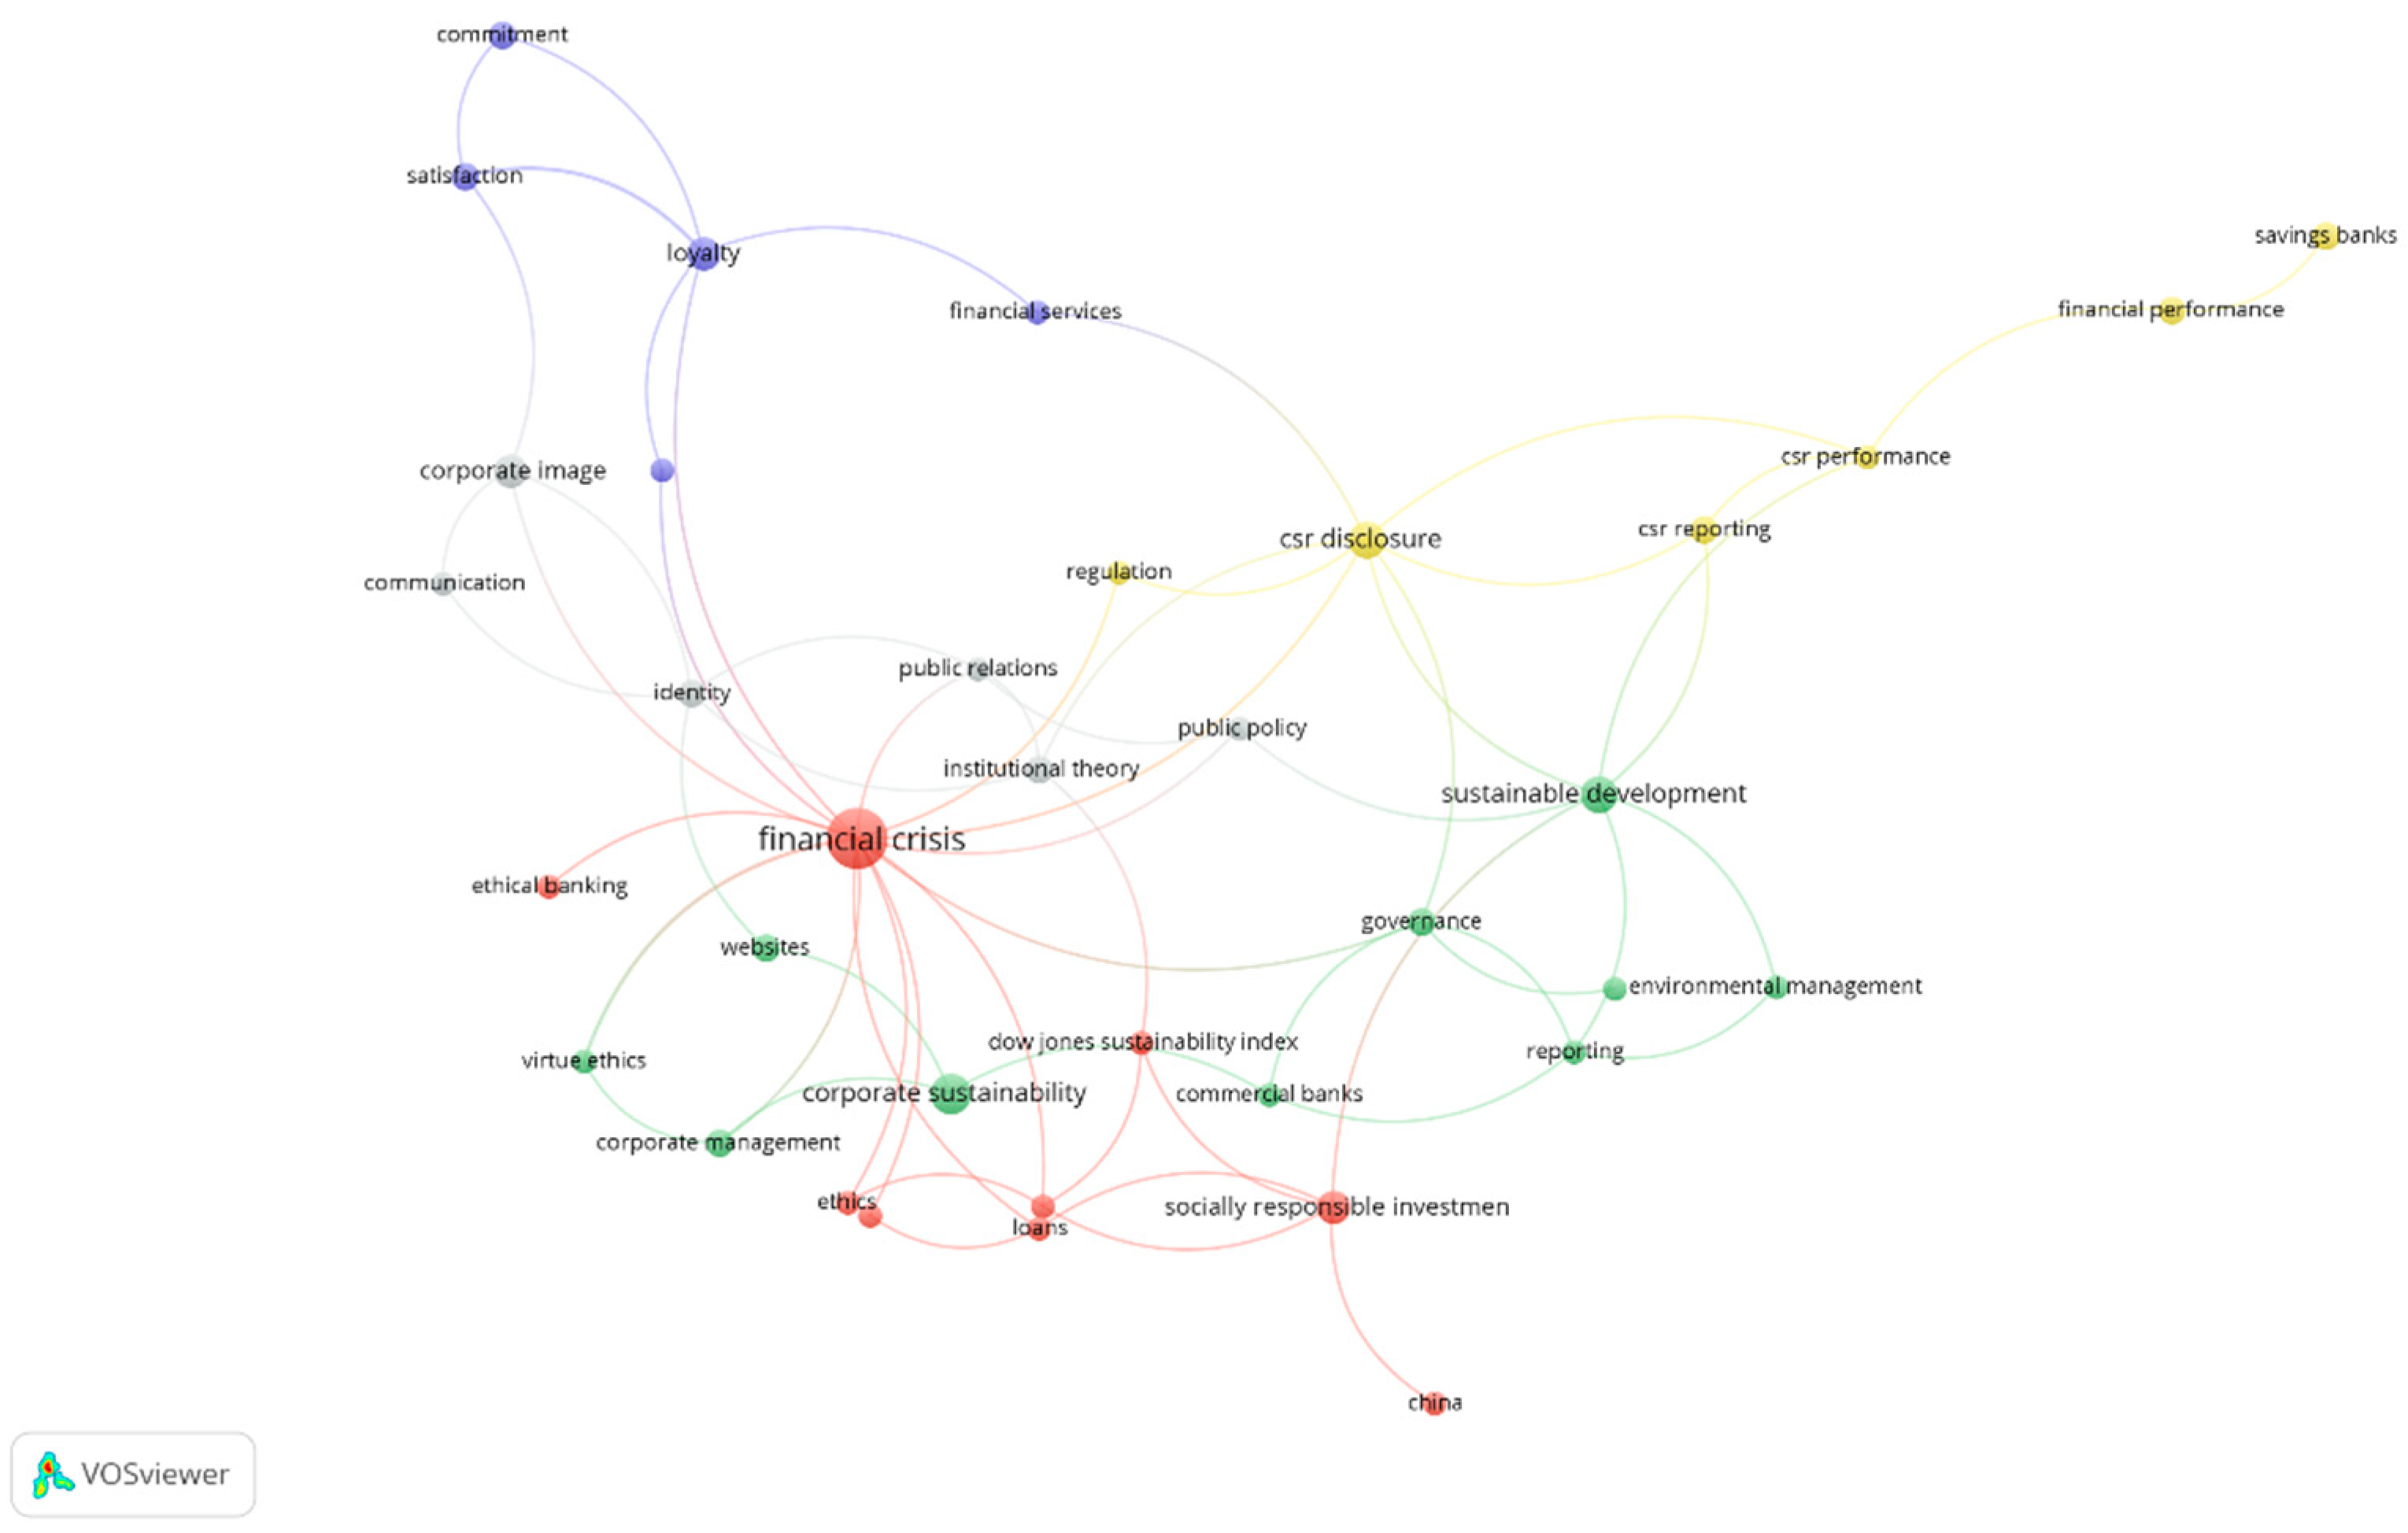
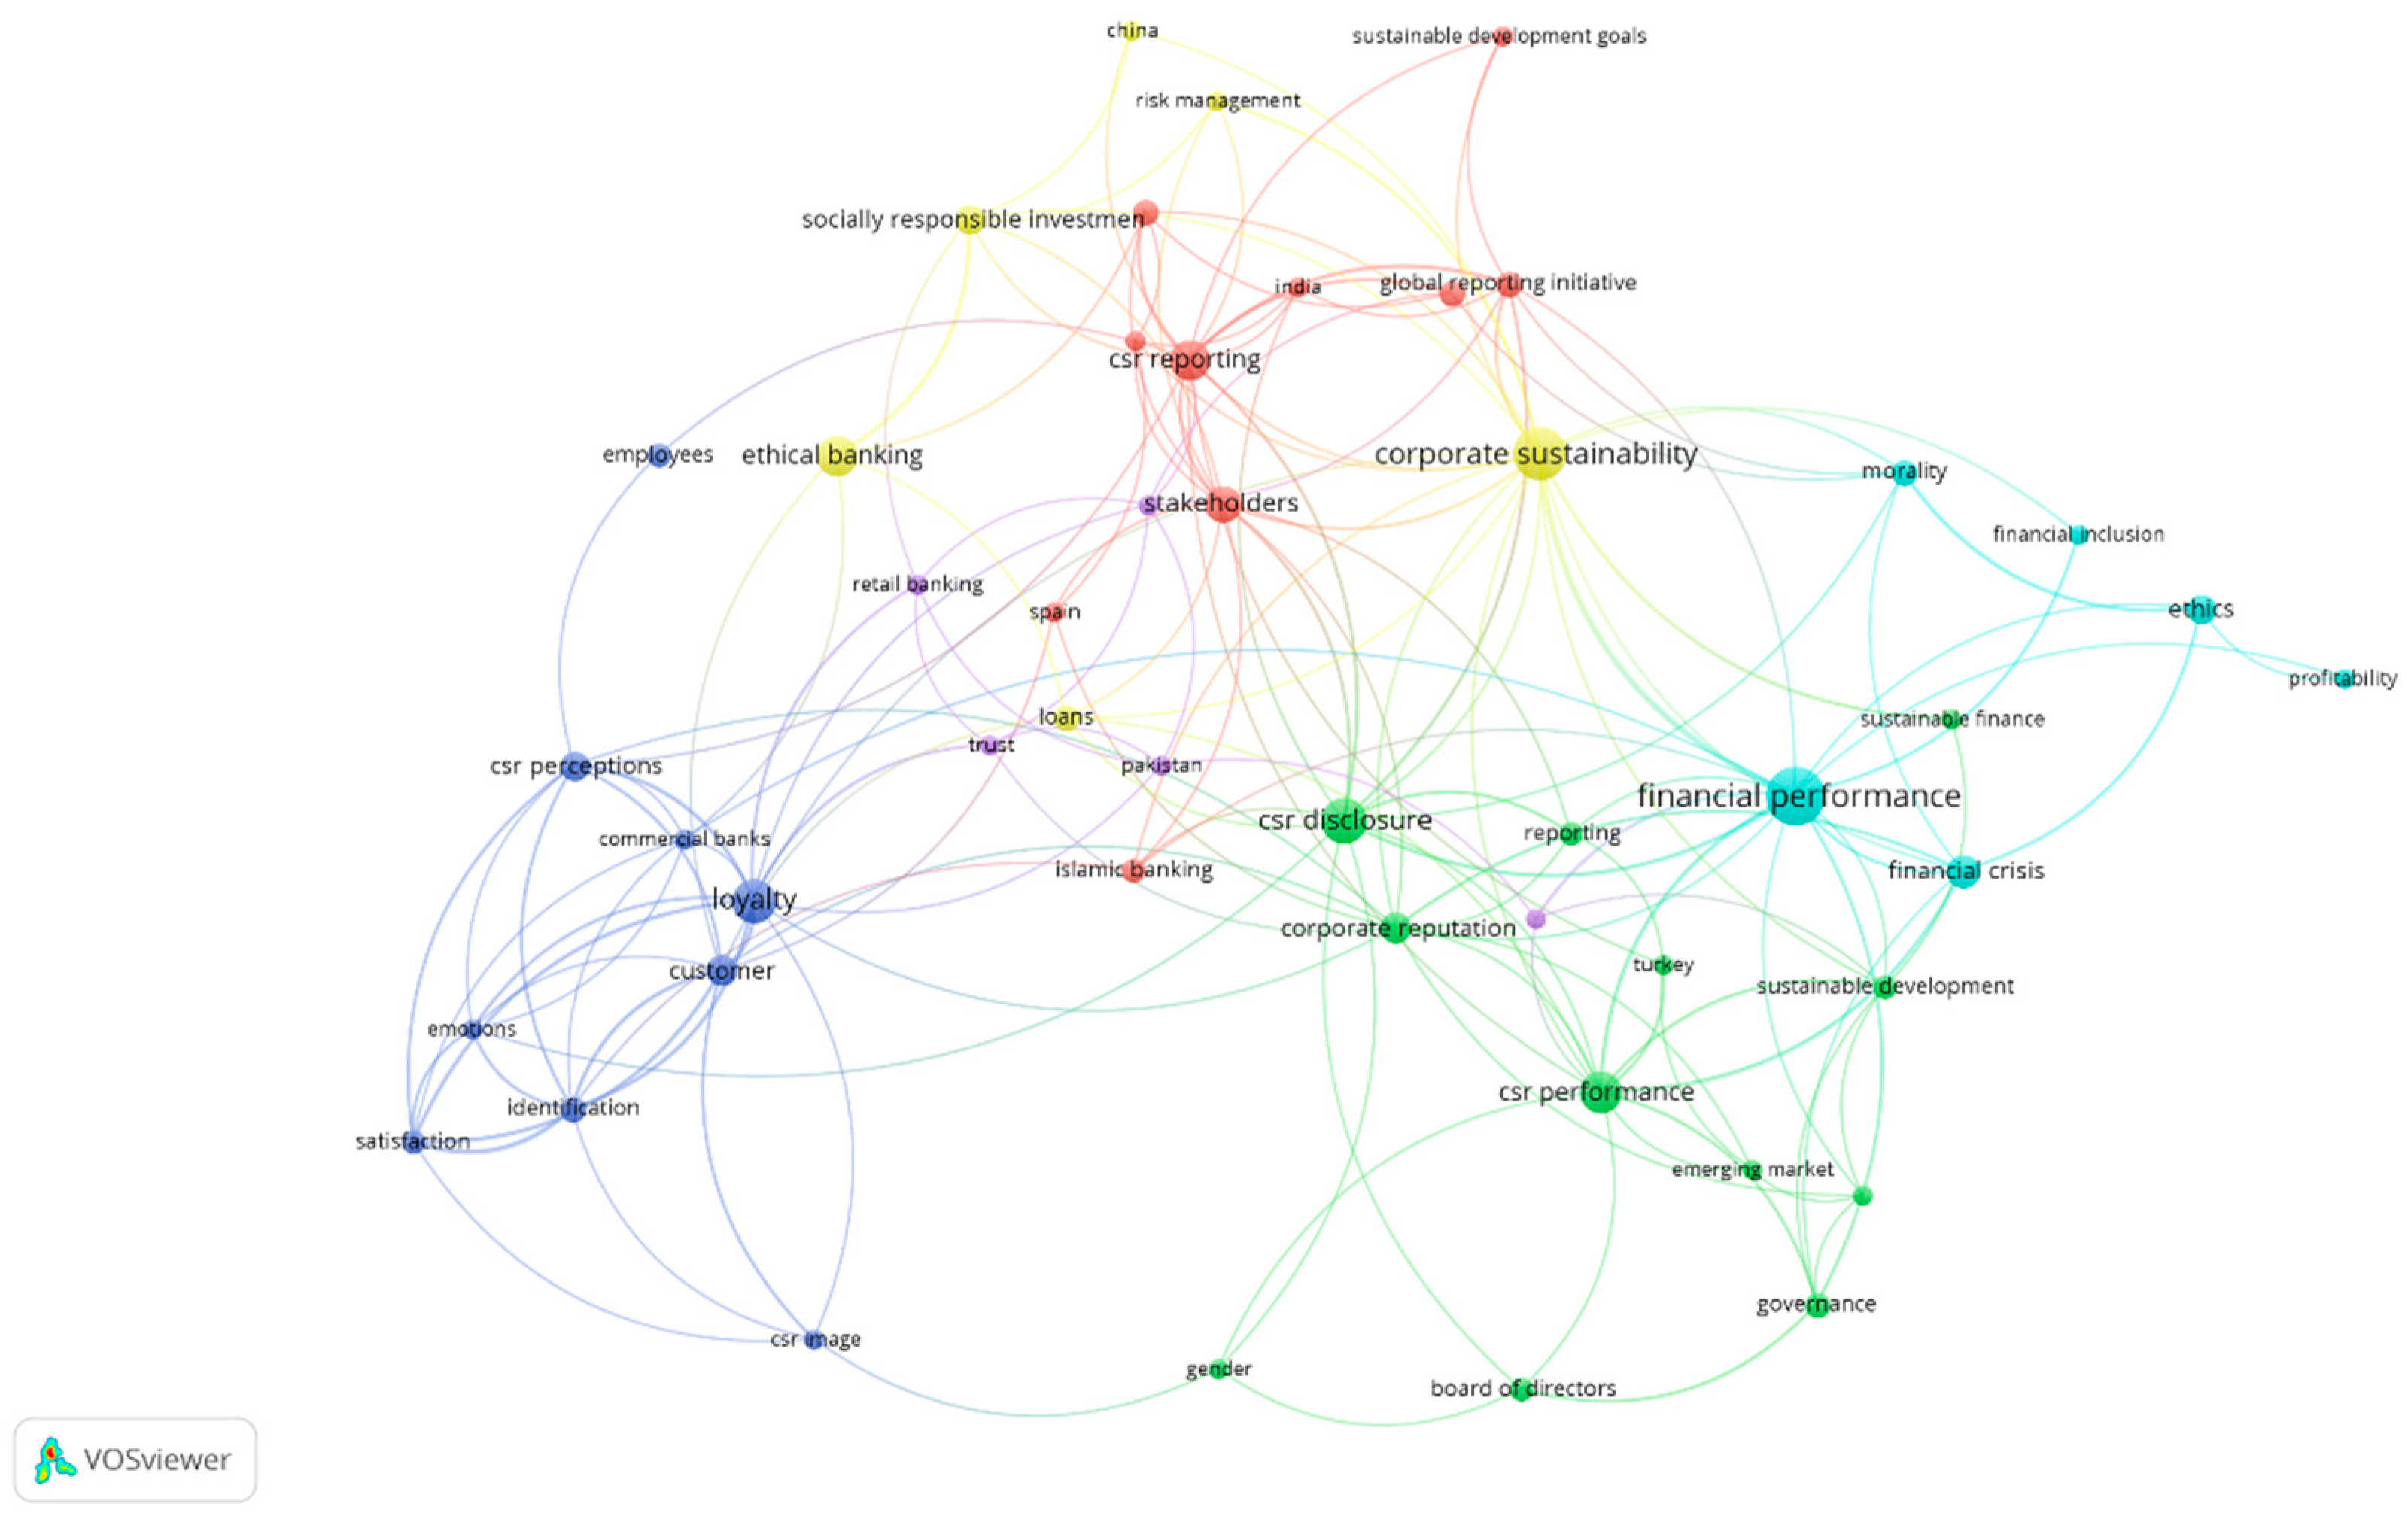
Figure 3 and
Figure 4 represent the co-word networks for the periods 2009–2014 and 2015–2019, respectively. To build them, I have considered just the terms that appear at least two times in the period 2009–2014, and three times in the period 2015–2019. In these networks I have used different colors to differentiate the thematic group associated with each term. To perform this analysis, four terms were removed because they are generic terms in the topic: “corporate social responsibility”, “banks”, “banking sector” and “sustainable banking”. These terms have the potential to appear in every single document so it is not valuable to include them in the analysis. Additionally, terms that refer to research methods were omitted.
One can observe that the elements that form the different groups that coexist in the networks of each period, not only maintained relationships between one another, but also with elements of the rest of the groups. In general, clustering algorithms like the one used here involve grouping the terms according to the degree of co-occurrence, maximizing co-occurrence within the group. Logic says that terms that appear together in one or more documents are related.
To further represent the characteristics of the groups, some authors have used strategic diagrams based on centrality and density measures [
24,
32]. A strategic diagram identifies four types of themes, according to Callon et al. [
32] “motor themes” appear in the upper right quadrant. Their characteristics include a high degree of internal development and strong ties to other concepts in a given research field. “Highly developed and isolated themes” are in the upper left quadrant. While they have a high degree of internal development their importance to the rest of the scientific area is marginal. “Emerging or declining themes” appear in the lower left quadrant. Emerging themes do not yet have sufficient relevance to the field studied, and may not gain this relevance. Declining themes have a high degree of internal development for the period studied, but have started to lose importance. Finally, “basic and transversal themes” are in the lower right quadrant. These themes show strong ties with issues outside the network, and are therefore relevant to the knowledge area considered. However, they have lower levels of internal development. The diagram is enriched based on the size of a circle that represents the topic, incorporating quantitative or qualitative measures in the graph following the proposal of Cobo et al. [
15]. Examples of these metrics include number of documents in a network, number of references to documents in a network, and number of authors who have investigated a particular topic.
Each thematic group has been tagged with the word that has the highest level of centrality within each subnetwork.
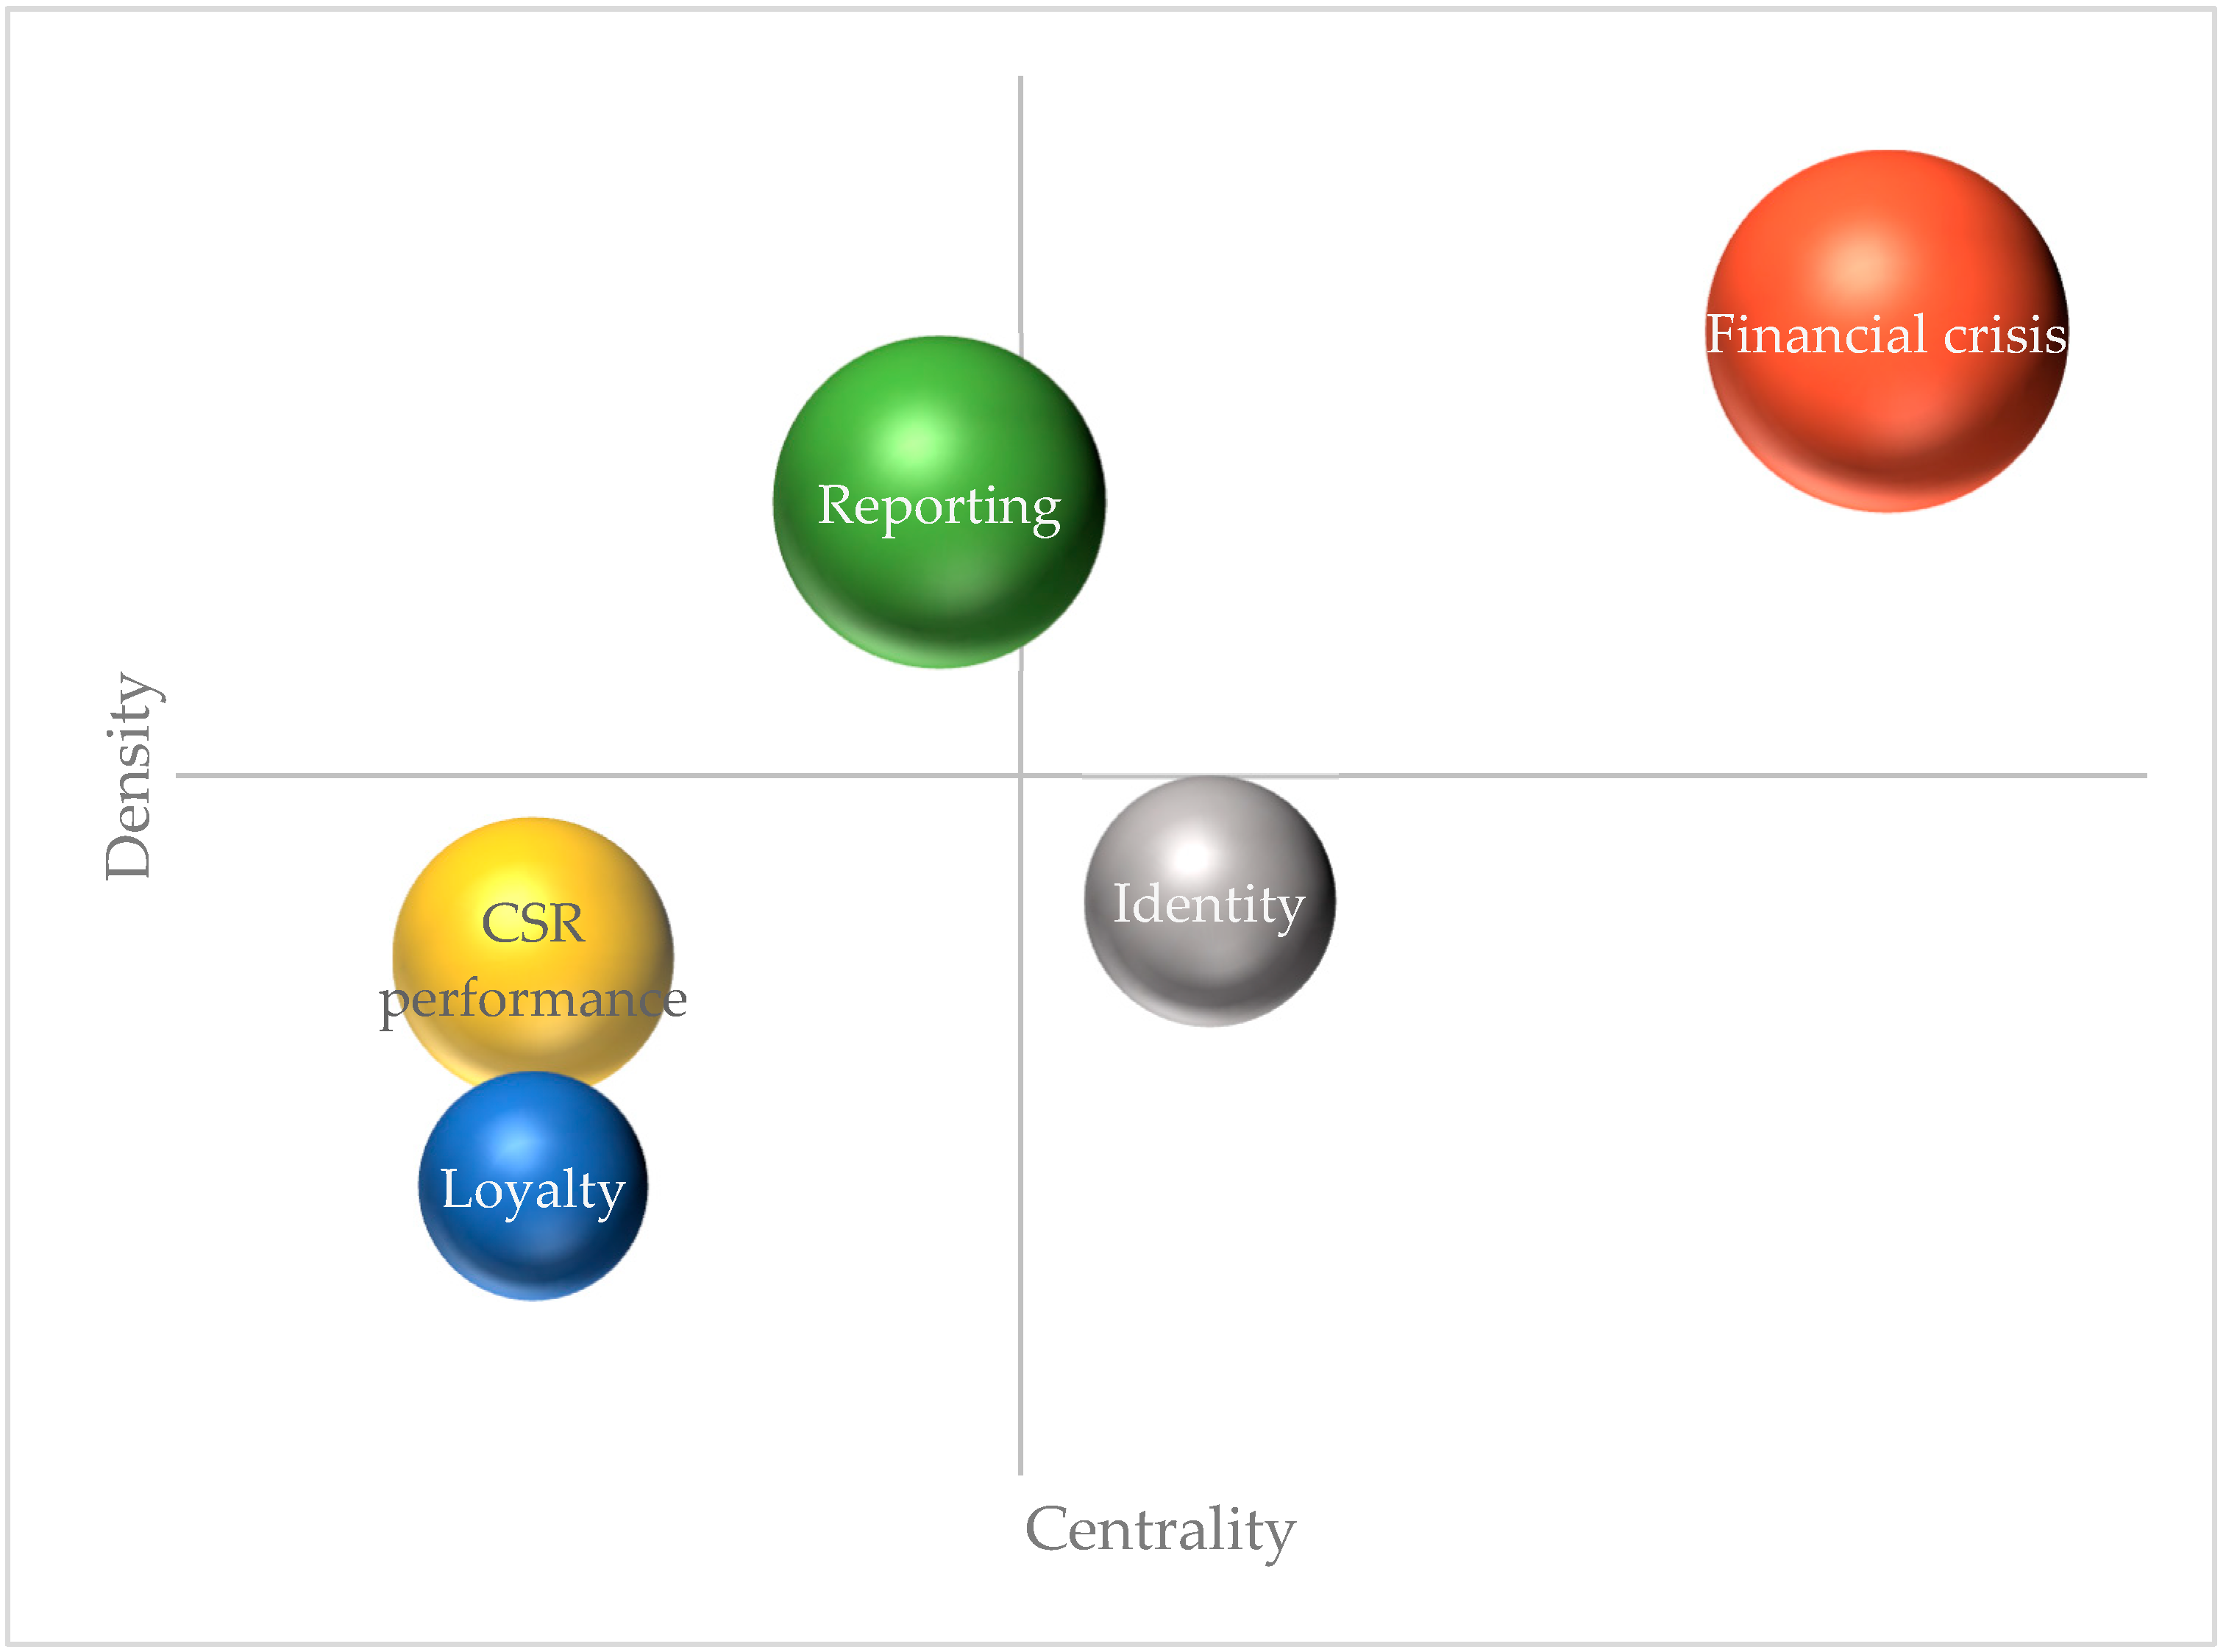
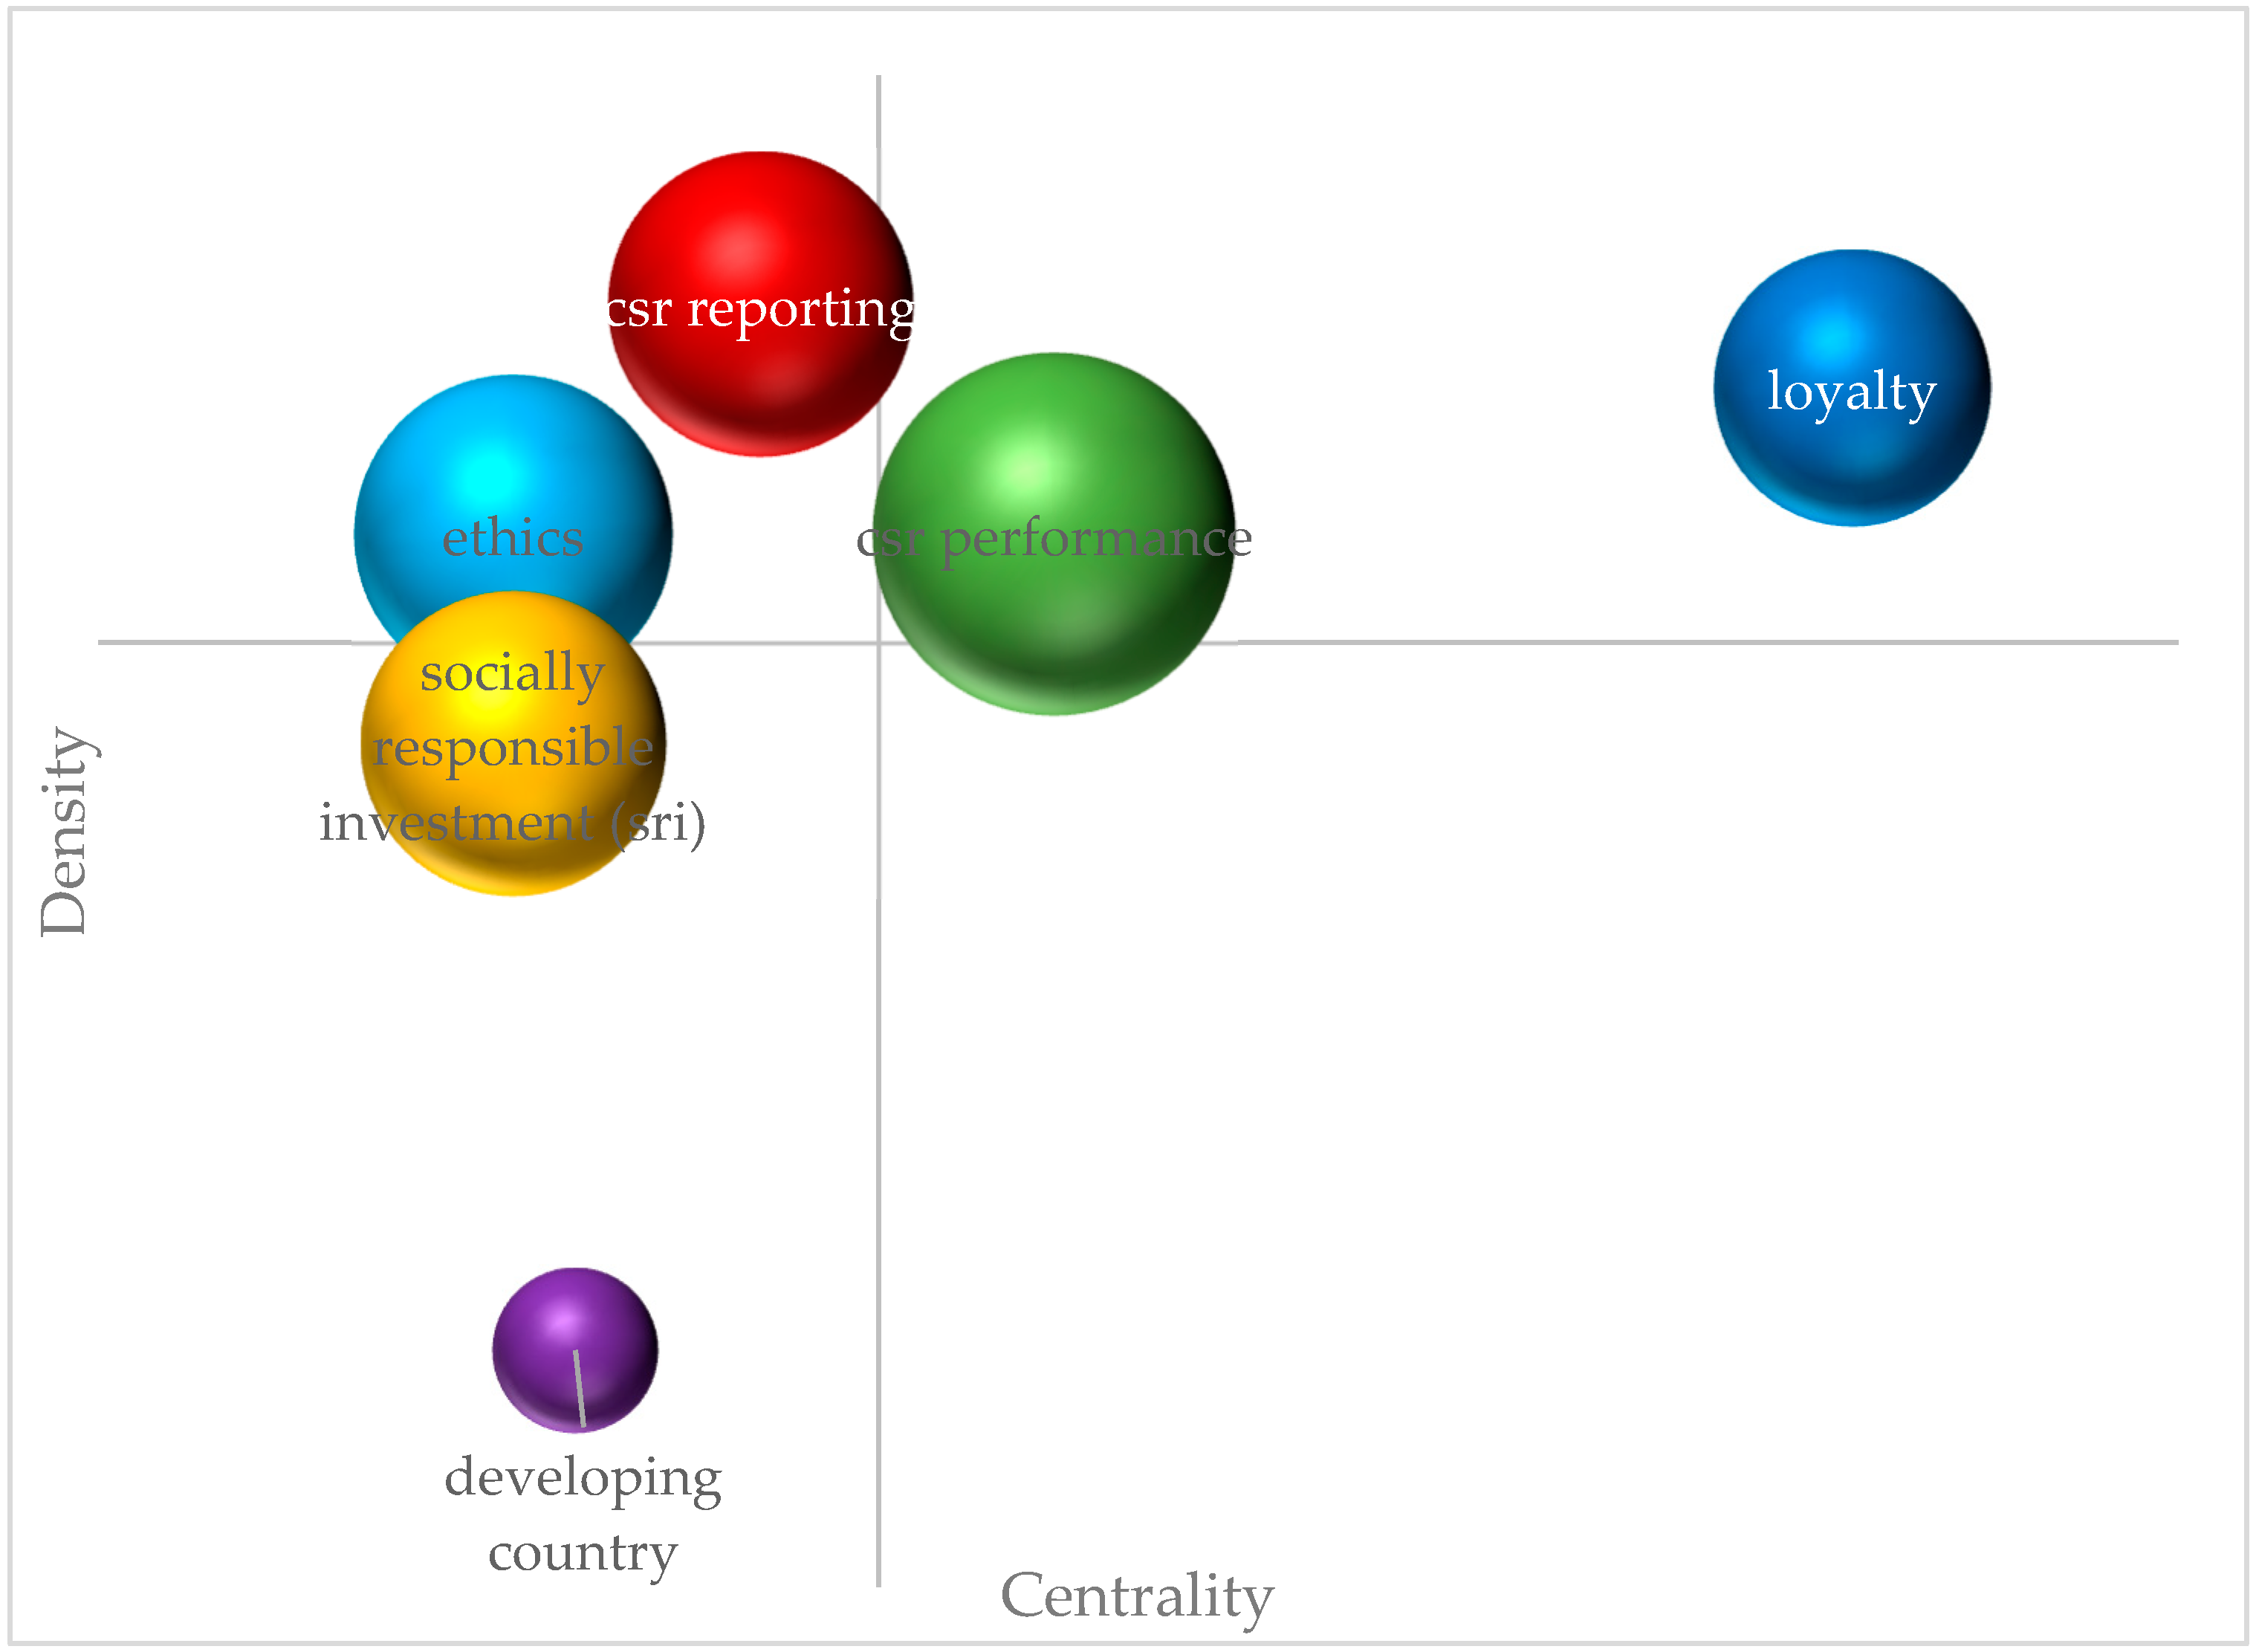
Figure 5 and
Figure 6 present strategic diagrams for the selected periods of time. In both cases, the size of the circles represents the number of main documents in which terms from each thematic group appear.
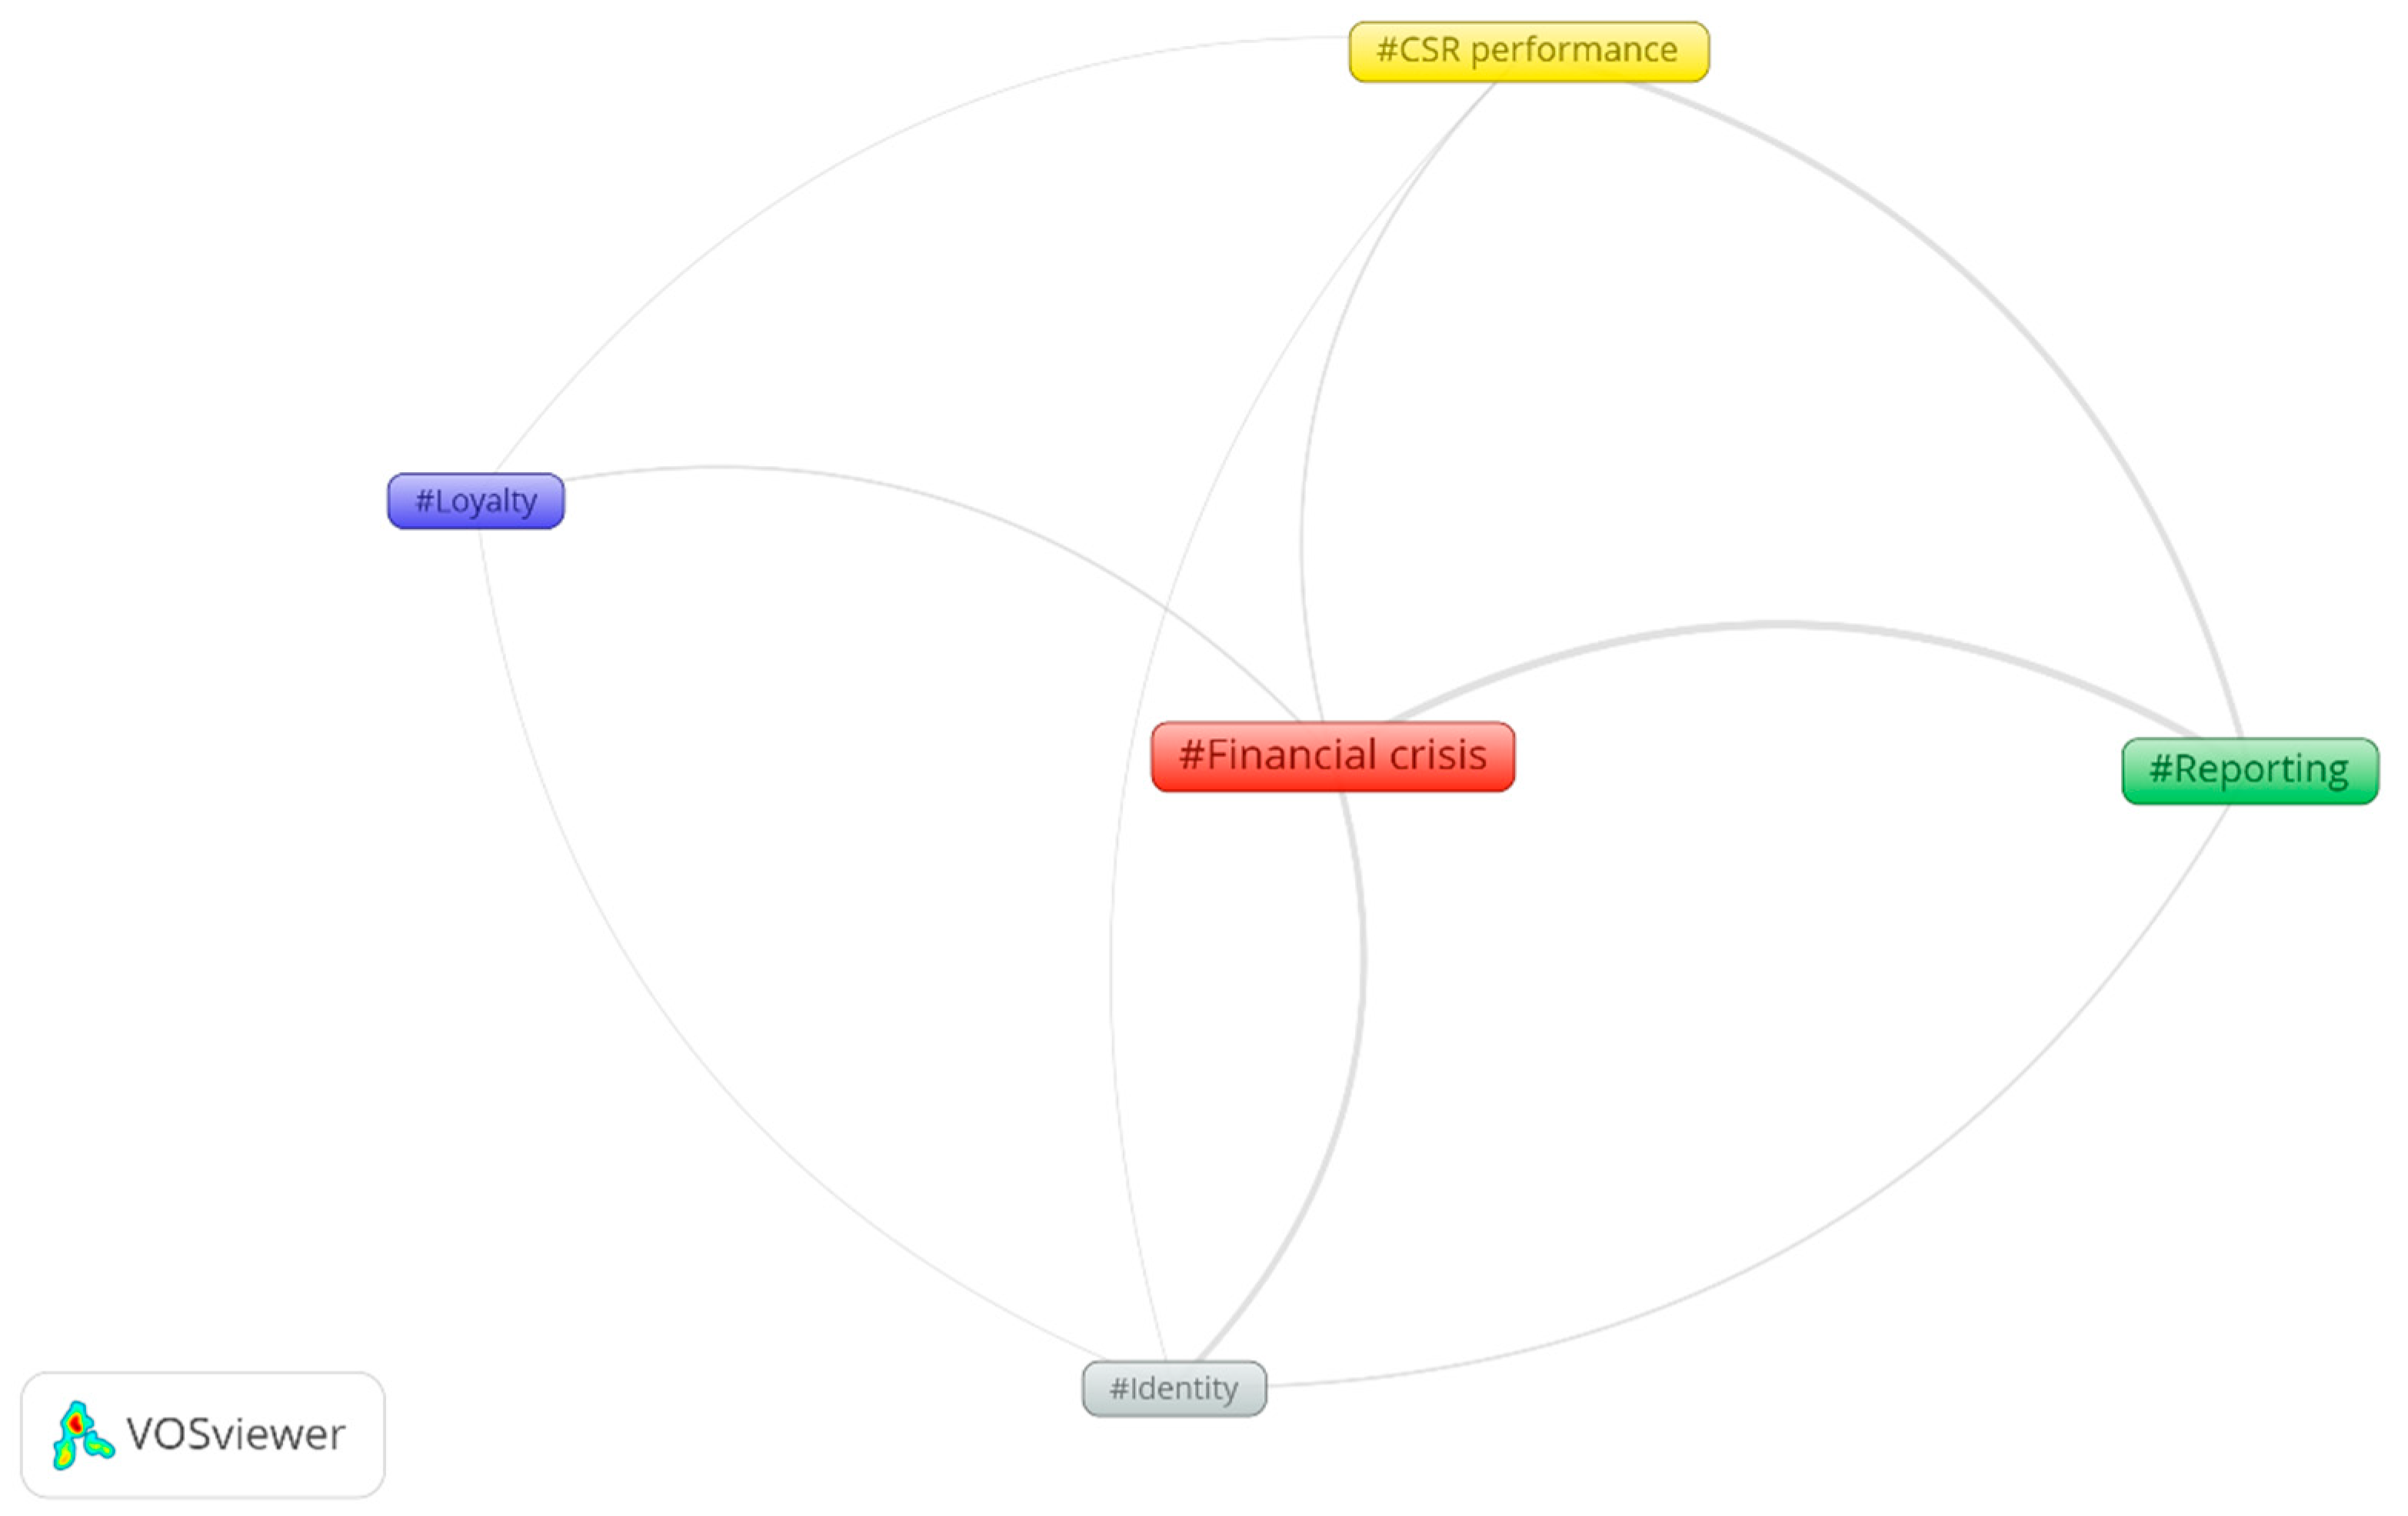
Figure 7 and
Figure 8 represent networks of networks, that is, how thematic groups are interconnected. In these graphs, the thickness of the lines connecting the terms represents the intensity of the relationship between the two thematic networks. To calculate the centrality and density of each subnetwork, the weighted centrality of each node in
Figure 7 and
Figure 8 (centrality) and the average degree of each subnetwork (density) has been computed.
In the period 2009–2014, one can distinguish five thematic networks. The strategic matrix (
Figure 5) clearly shows “financial crisis” as a motor theme, and the network with the highest number of documents (24).
Figure 3 and
Figure 5 further demonstrate its critical role, as “financial crisis” appears in the center of these networks. One can observe stronger relationships between “financial crisis” and the themes of “reporting” and “identity”, even though its central position connects it to the rest of the themes. In addition to its central component (“Financial crisis”) this network, as can be seen in
Figure 3, contains themes related to “ethical banking”, “ethics”, “leadership”, “stakeholders” and “loans”. These types of themes are part of the literature focused on explaining the reasons behind the 2008 financial crisis and which, in large measure, attribute it to a lack of ethics. Themes like “socially responsible investment (SRI)” and “Dow Jones sustainability index” are also connected to the central theme of “financial crisis”, although more indirectly. These are the themes that establish a stronger relationship with the “reporting” network.
In the quadrant of emerging/declining themes for this first period, one finds two thematic networks: “loyalty” and “CSR performance”. “Loyalty” is the least developed of the themes in this period, with only nine documents and weak relationships with the rest of the themes. However, as one can notice in the complete network (
Figure 3), the relationships between its elements are strong and coherent. Terms like “commitment”, “satisfaction”, “financial services” and “corporate reputation” make up a group with a significant focus on the study of the client. Thus, the strongest links of this network are the ones it has with “identity” and “CSR performance”.
“CSR performance” contains themes addressed in 14 documents. As one can gather from
Figure 3, within this theme are grouped a number of questions related to performance (not only “social”, but also “financial performance”), “CSR reporting” and “CSR disclosure”. This last term is particularly linked to obtaining advantages derived from exterior communication of actions carried out in the field of corporate social responsibility. The connection between “CSR performance” and “reporting” is the strongest among its connections to the other thematic networks.
The “reporting” network occupies a position in the strategic matrix between the quadrant for “Highly developed and isolated themes” and that of “Motor themes”. One can observe as much in
Figure 3 as in
Figure 7 that the strongest relationships of this network are with the elements “financial crisis”, “reporting” and “identity”. The internal composition of this network mixes diverse themes like those highlighting “governance” and “corporate governance” together with “reporting”. This clearly relates this topic to the analysis of corporate governance as a cause of the aforementioned financial crisis, and to the call for banks to implement measures to establish better controls.
Finally, the “identity” network aggregates themes linked to communication: “public relations” and “corporate image”. Its location close to the “loyalty” network clearly demonstrates a line of investigation centered in communication and linked to the necessity to rebuild the client trust lost as a result of the financial crisis. In various works of this period, one observes how banks used CSR as a tool to carry out this task.
With respect to the period 2015–2019 (
Figure 4,
Figure 6 and
Figure 8), six different thematic networks have been identified. One notes in the strategic matrix (
Figure 6) that there are two motor themes: “Loyalty” and “CSR Performance”. Twenty-eight documents in this period deal with “Loyalty”. Its internal composition, in line with the group of the same name from the prior period, integrates different terms related to the client: “customer”, “identification” and “emotions”. It also includes aspects linked to the use of CSR as a competitive weapon: “CSR image” and “CSR perceptions” are clear examples. The connections of this group are stronger in this period, as can be seen as much in
Figure 4 as in
Figure 8. The most directly related groups are “CSR performance” (by way of “corporate reputation”) and “developing country”.
“CSR performance” is the other motor theme in this period. It has the highest number of documents dealing with it (48 documents). Internally, terms linked to corporate governance (“governance”, “board of directors”, “reporting” and “CSR disclosure”) stand out, as well as its relationship with “corporate reputation”. This links the theme to more competitive aspects. This double identity explains the relationships with “Loyalty” on the one hand, and with “Ethics” and “CSR reporting” on the other.
“CSR reporting” is a large group, made up of 10 different terms. Thirty-four documents in the period 2015–2019 deal with “CSR reporting”. Terms linked to reporting (“Global Report Initiative” and “CSR reporting”) and ethics (“legitimacy”) appear in this group. However, its terms are also linked to aspects directly related to sustainable behavior (“sustainable development goals (SDGs)” and “social efficiency”). This makes it into a fairly general group that includes diverse themes trending in this moment. It occupies a relatively central position in the graphs, although its strongest relationships are with the subnetworks “CSR performance” and “socially responsible investment (SRI)”.
The rest of the themes are located, more or less clearly, in the “emerging or declining themes” quadrant. The first of these themes, “Ethics” (37 documents), has a double nature: on one hand, aspects linked to ethics (“morality” and “financial inclusion”) and on the other hand, terms linked to results (“financial performance” and “profitability”), inheriting the principal theme of the prior period (“financial crisis”), which creates a catalyst for these two groups. Its connections are fewer than in prior cases, but even so, the connections with “CSR reporting” and “CSR performance” are strong.
Thirty-four documents deal with the theme of “socially responsible investment (SRI)” and the number of terms that make up this subnetwork is less, only six. It is a diverse group, with significant integration of the term “ethical banking”, a topic closely related to “socially responsible investment (SRI)”. Its connection groups are “Ethics” and “CSR reporting”.
Finally, “developing country” is a small group, probably an emerging one, which includes terms addressed in a total of 10 documents. Its connections are strongest with “CSR performance” and “loyalty”.
3.3. Third Phase
The purpose of this stage is to observe the evolution of themes. To analyze the full set of themes, the so-called stability index was used to measure overlap between two periods, i.e., the continuity or discontinuity between terms.
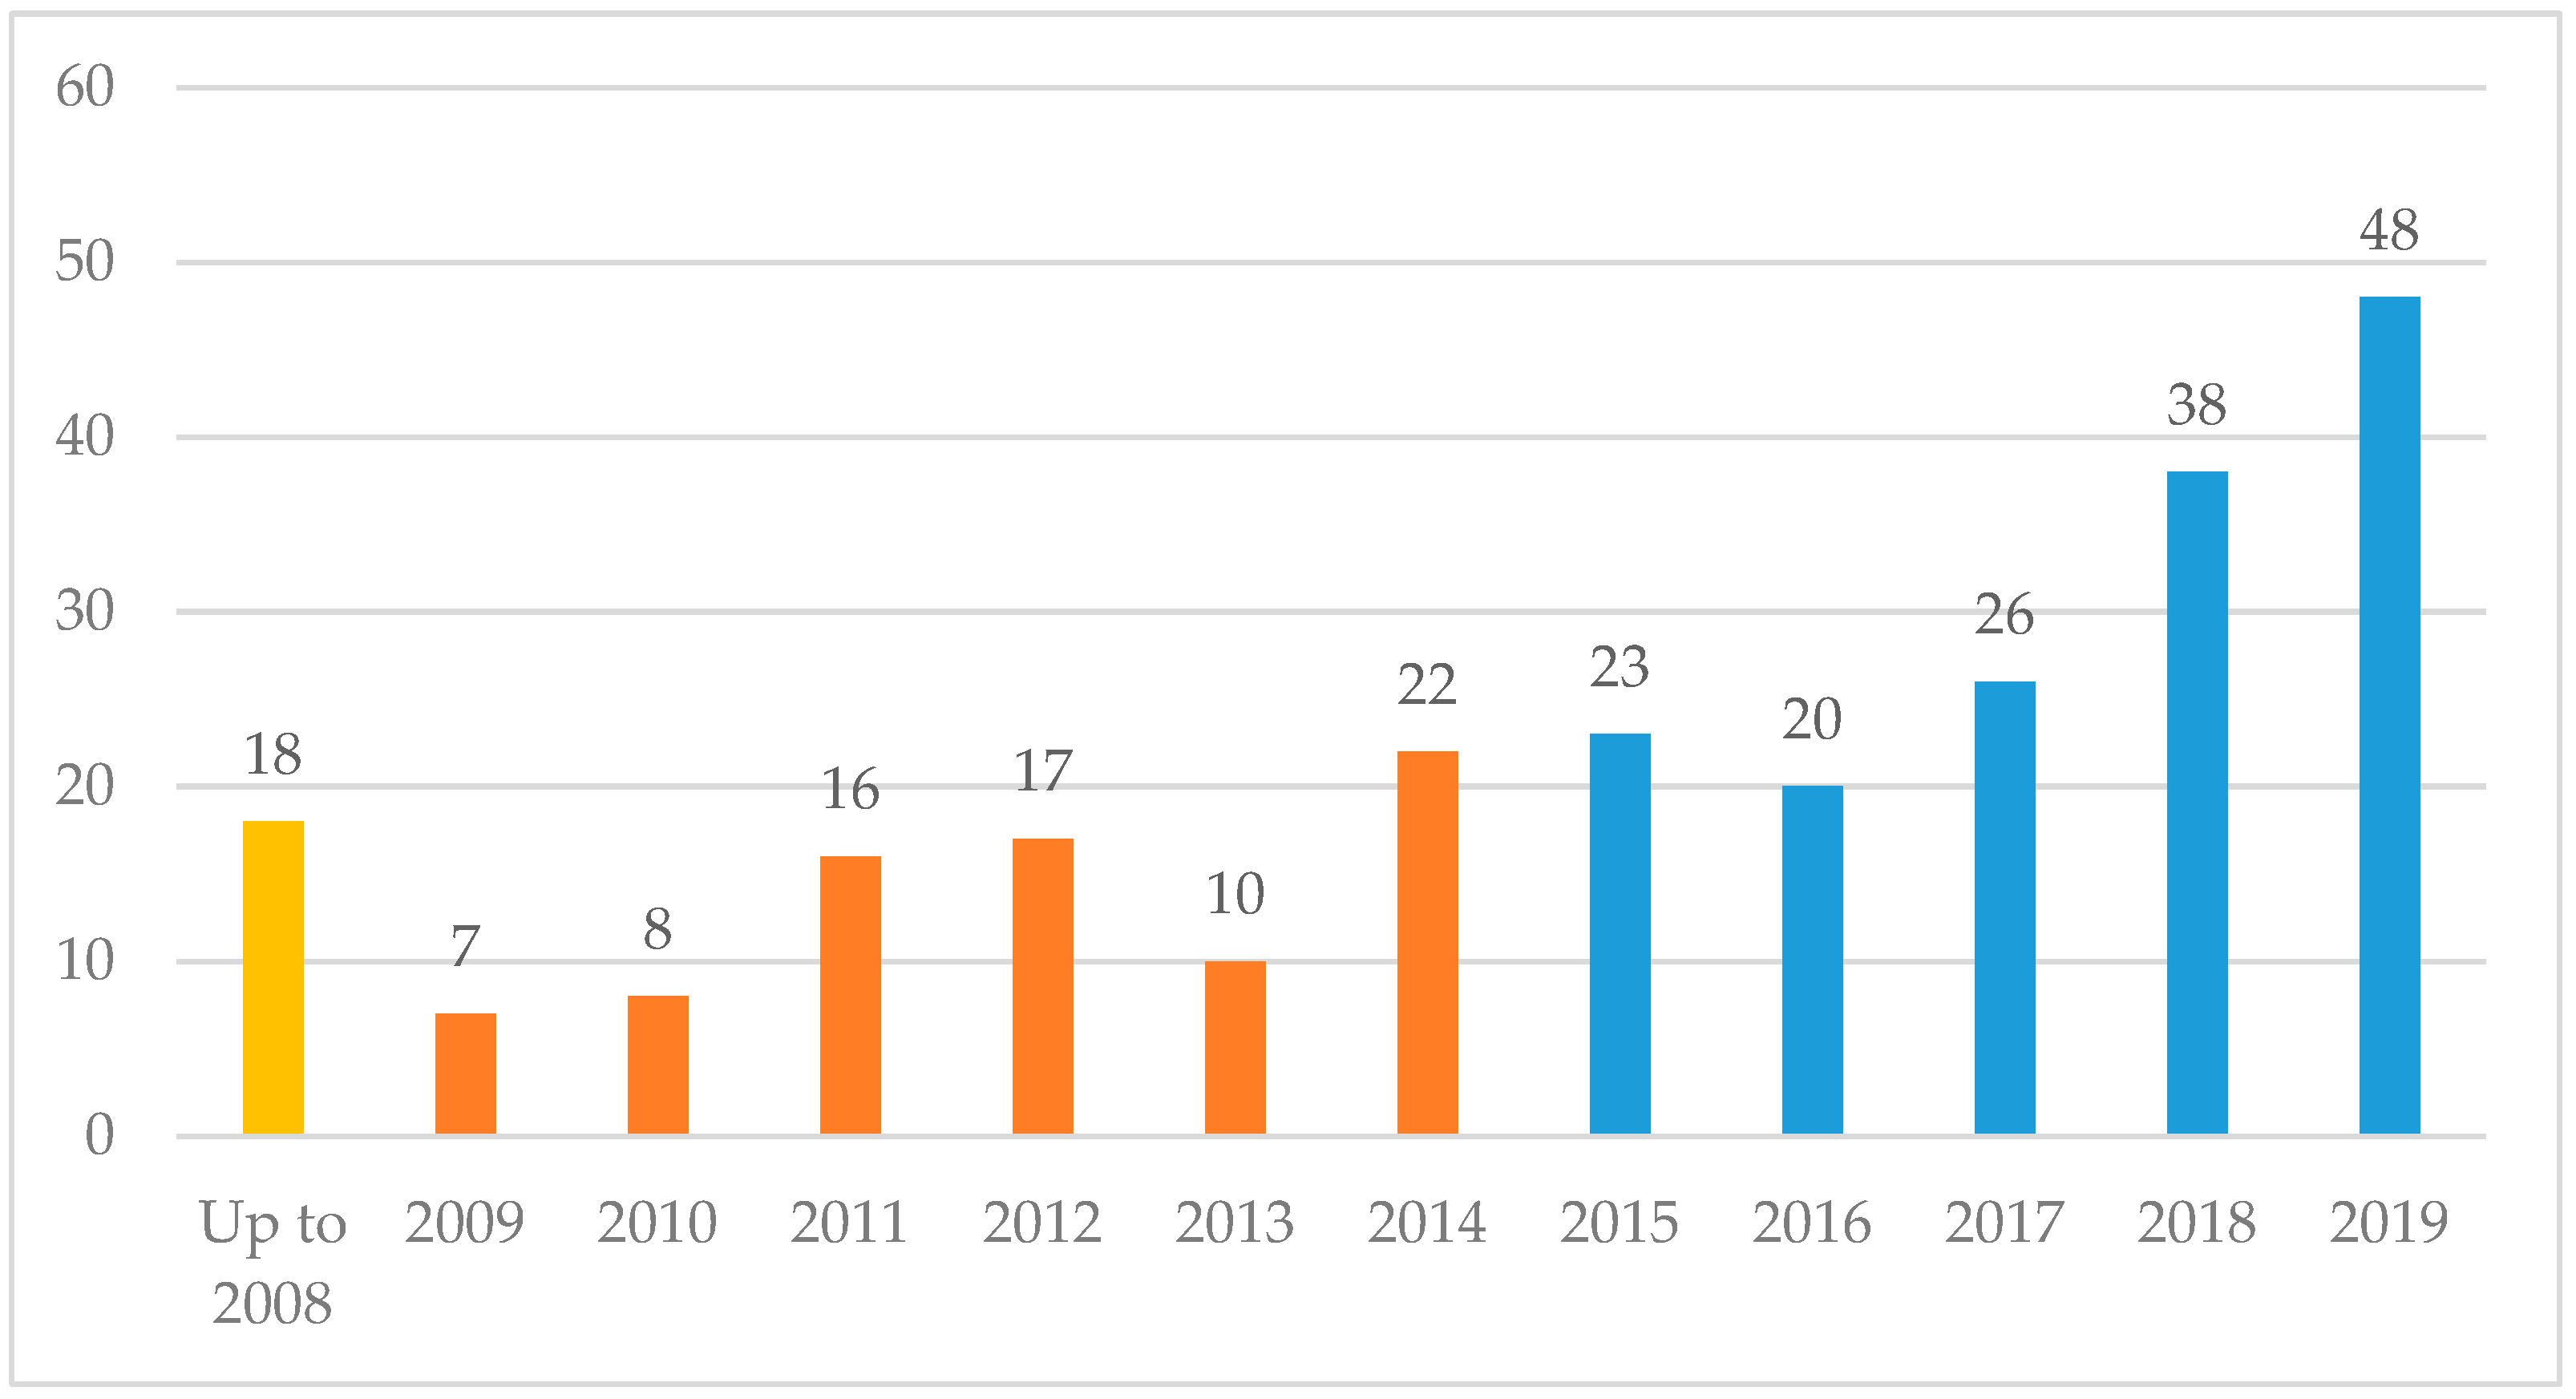
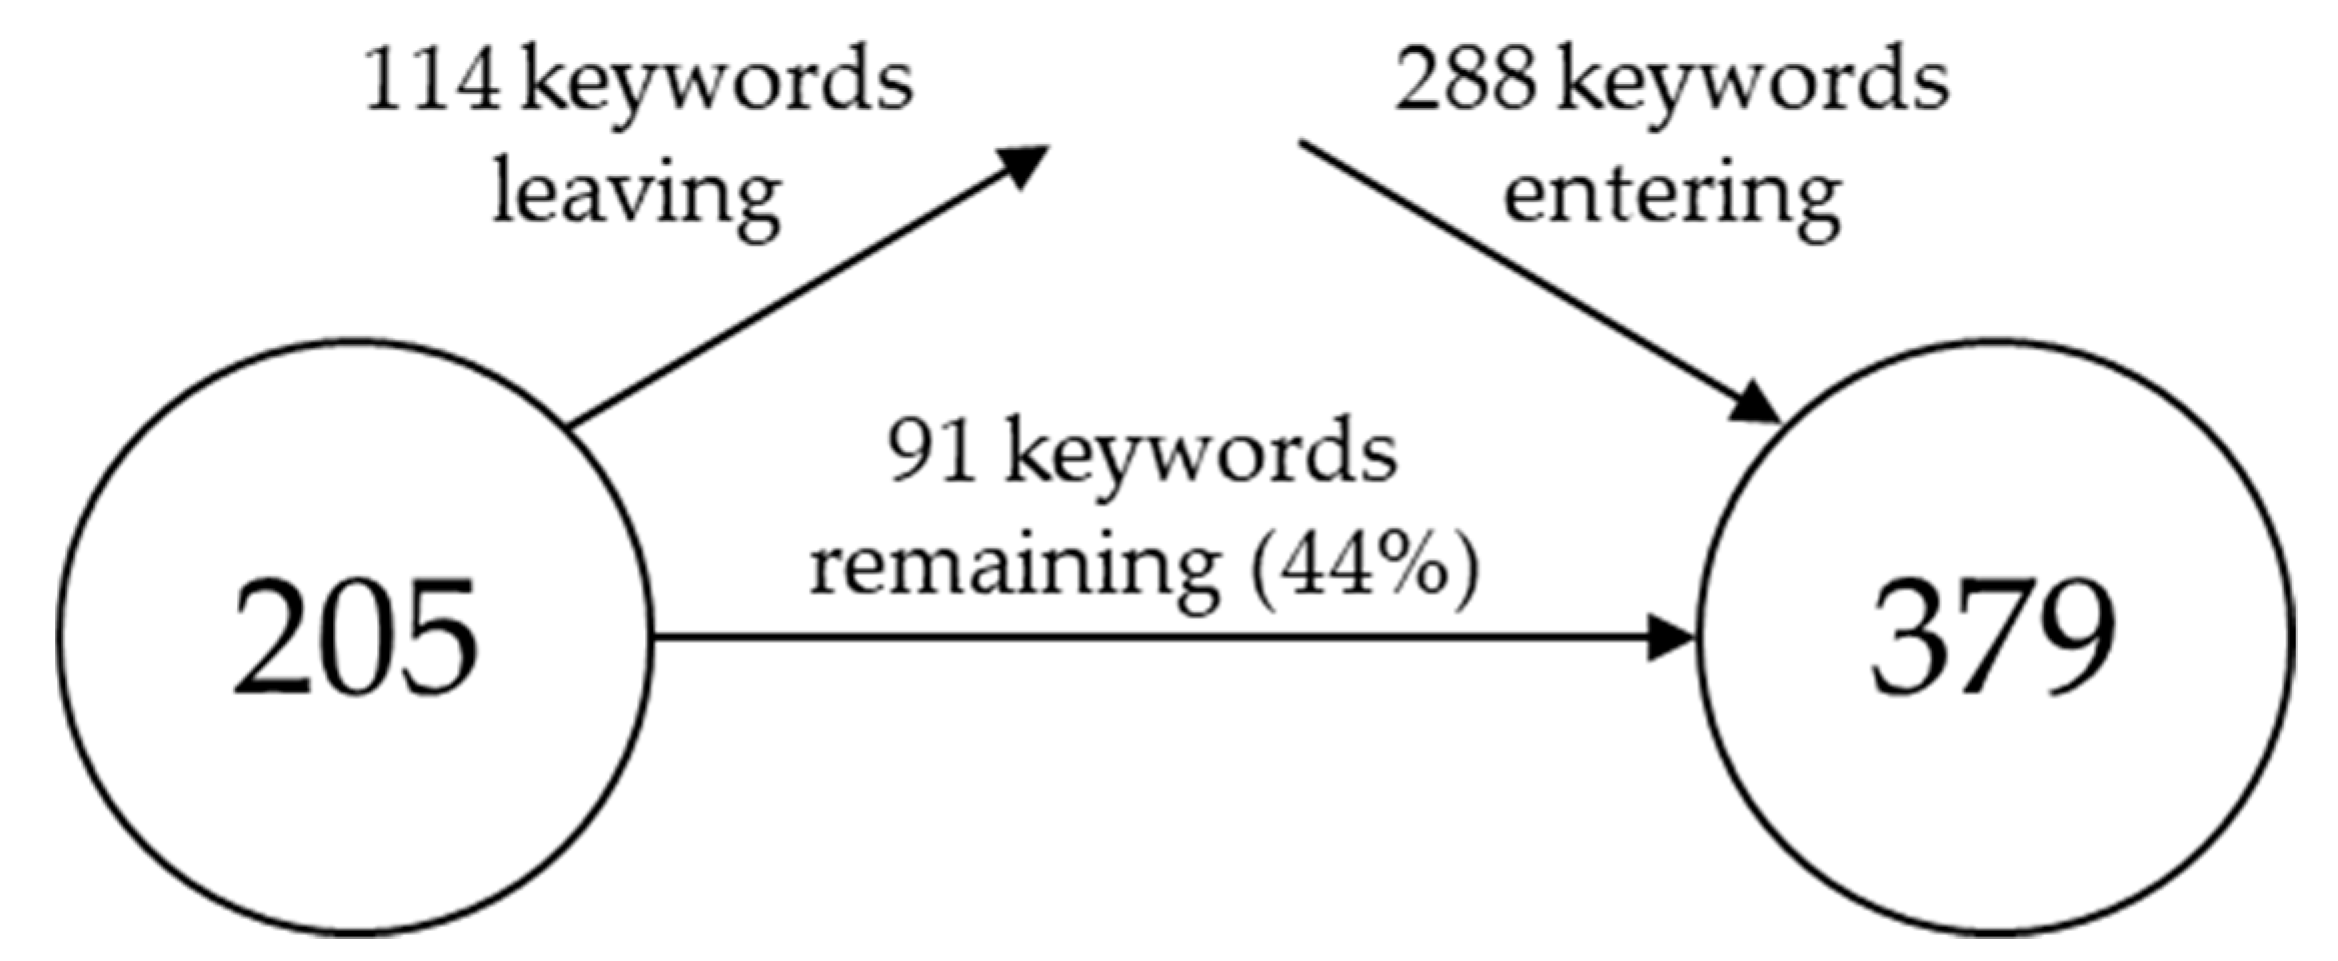
Figure 9 illustrates the stability of the area of research and shows that the field was still nascent with a low rate of similarity and with a relatively high increase in different keywords. For the first period considered, there were 205 different keywords of which 91 remained in the following period and 114 left. In contrast, along with the 91 that remain, 288 new words were incorporated. This increase was explained in part by the growth in the number of articles published, as is shown in
Figure 1, and partly by the change in themes, which is characteristic of a dynamic area of knowledge.
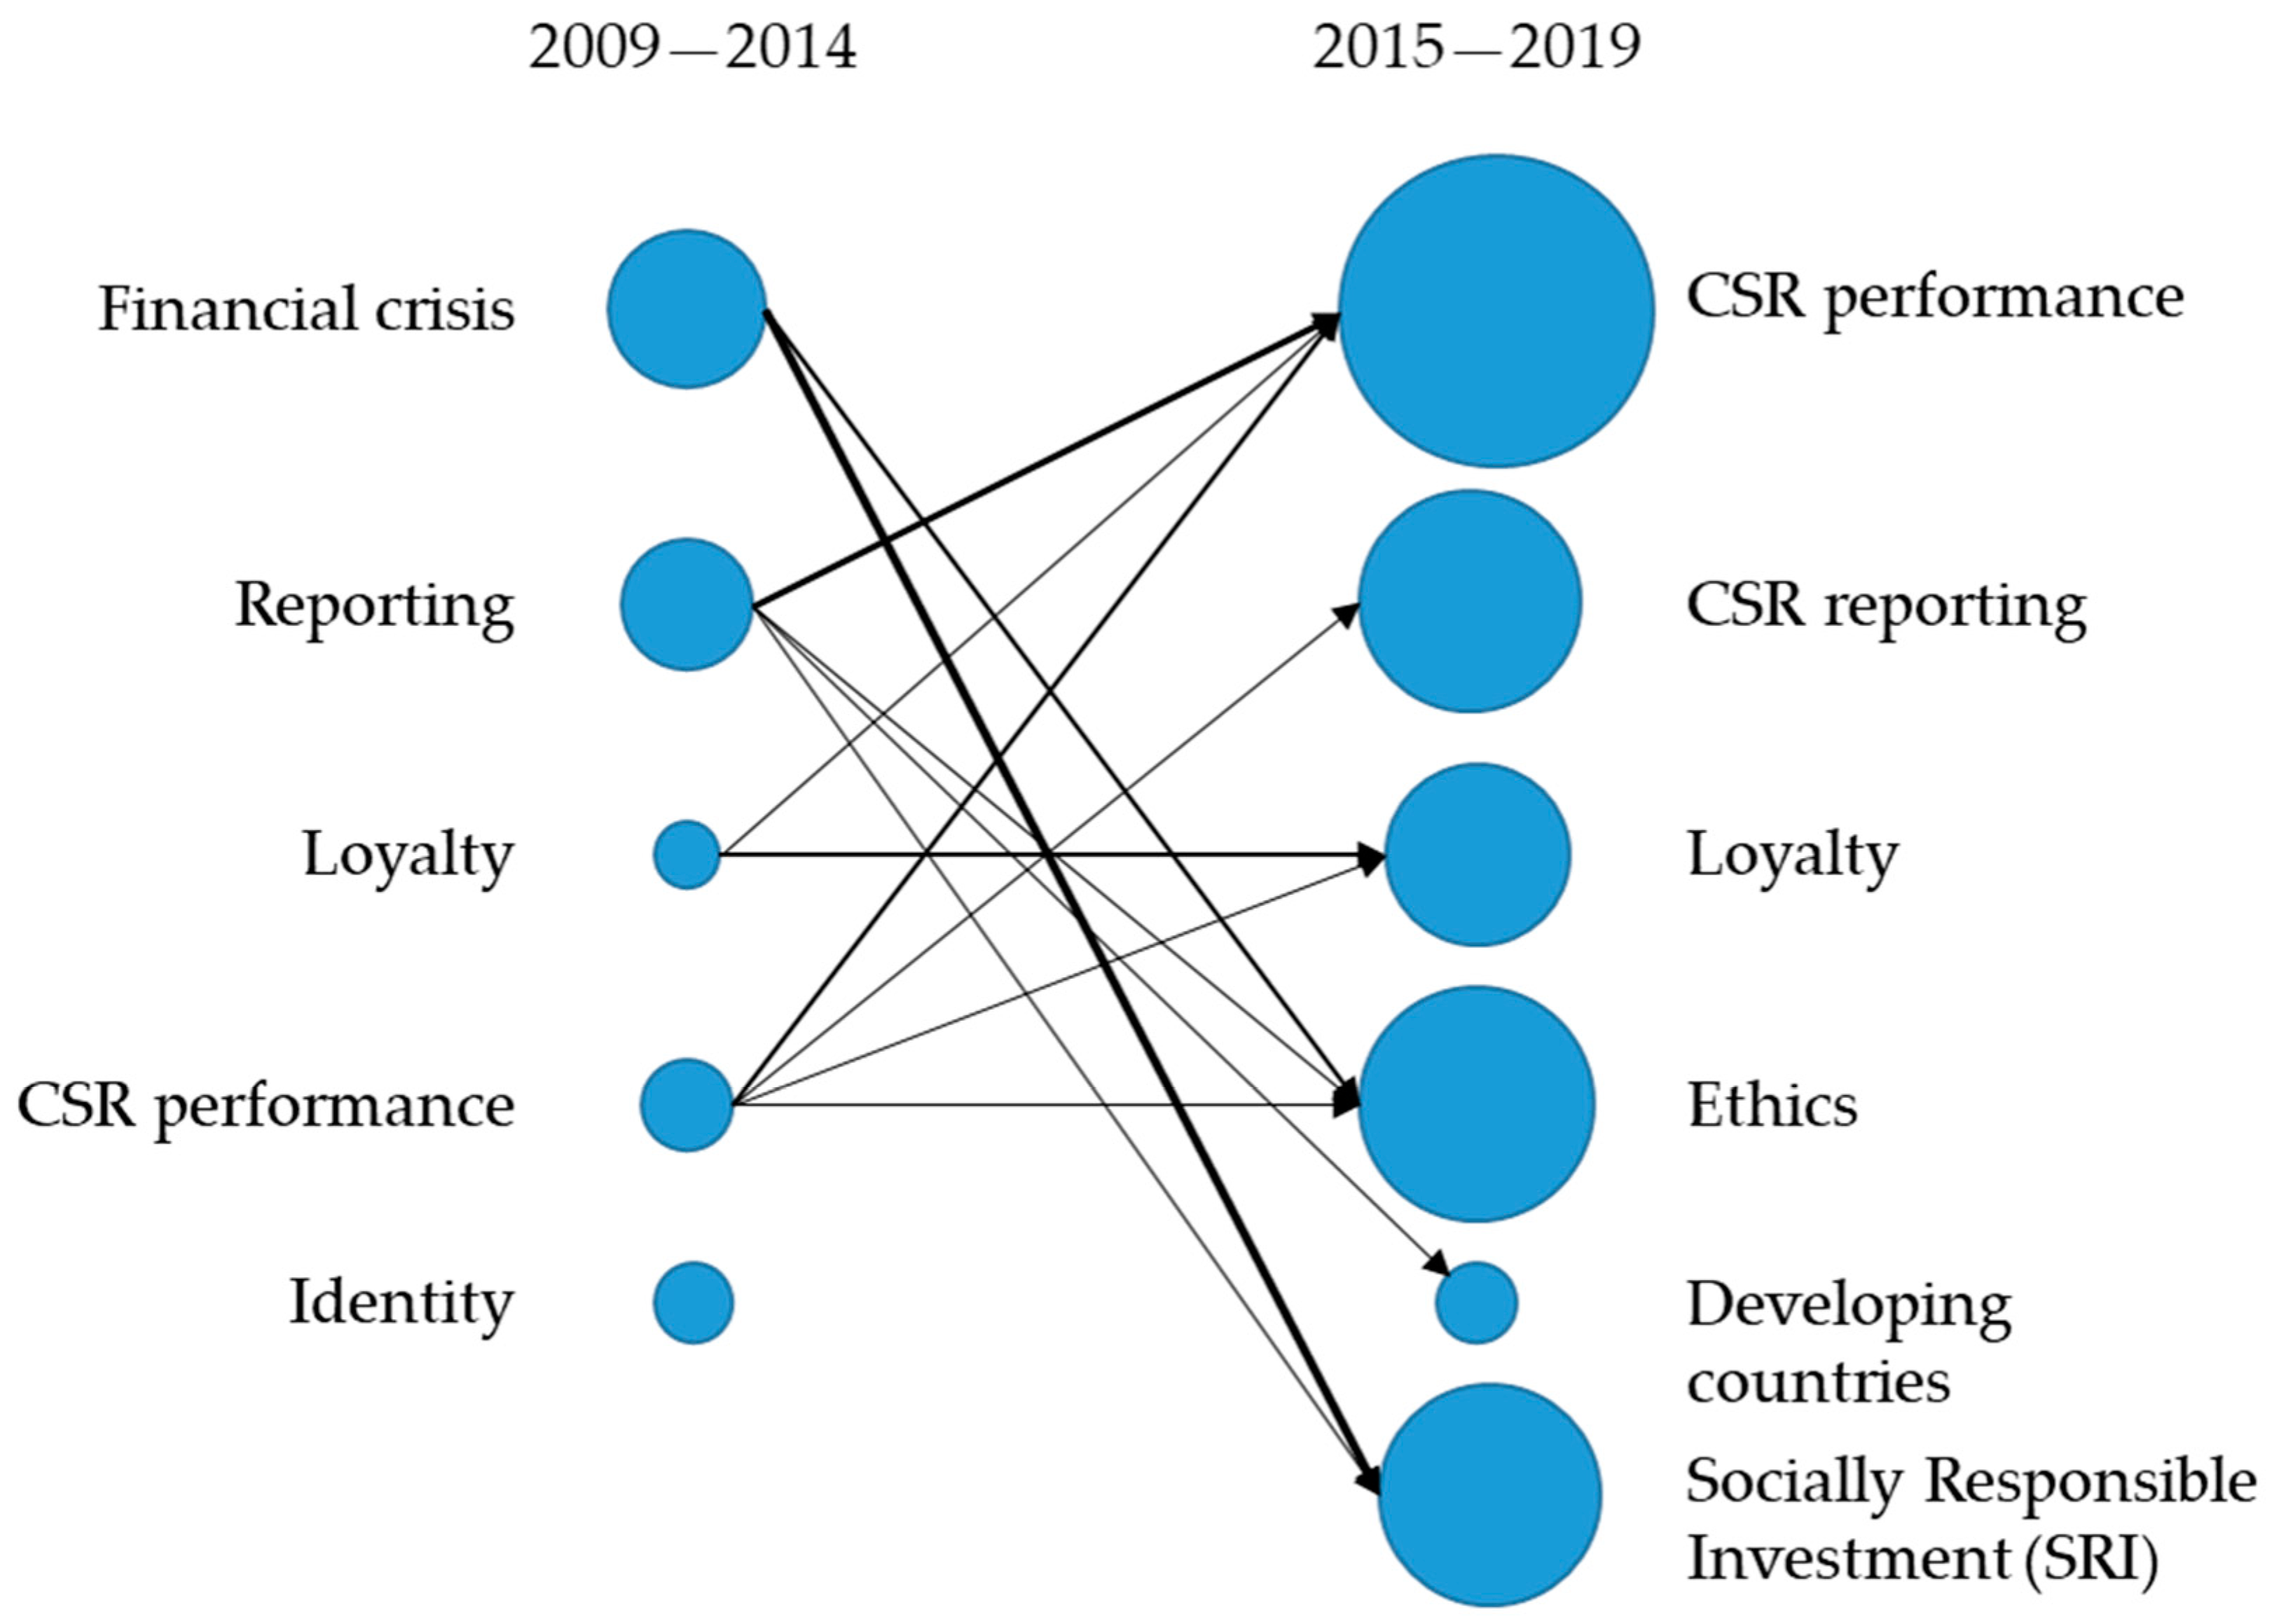
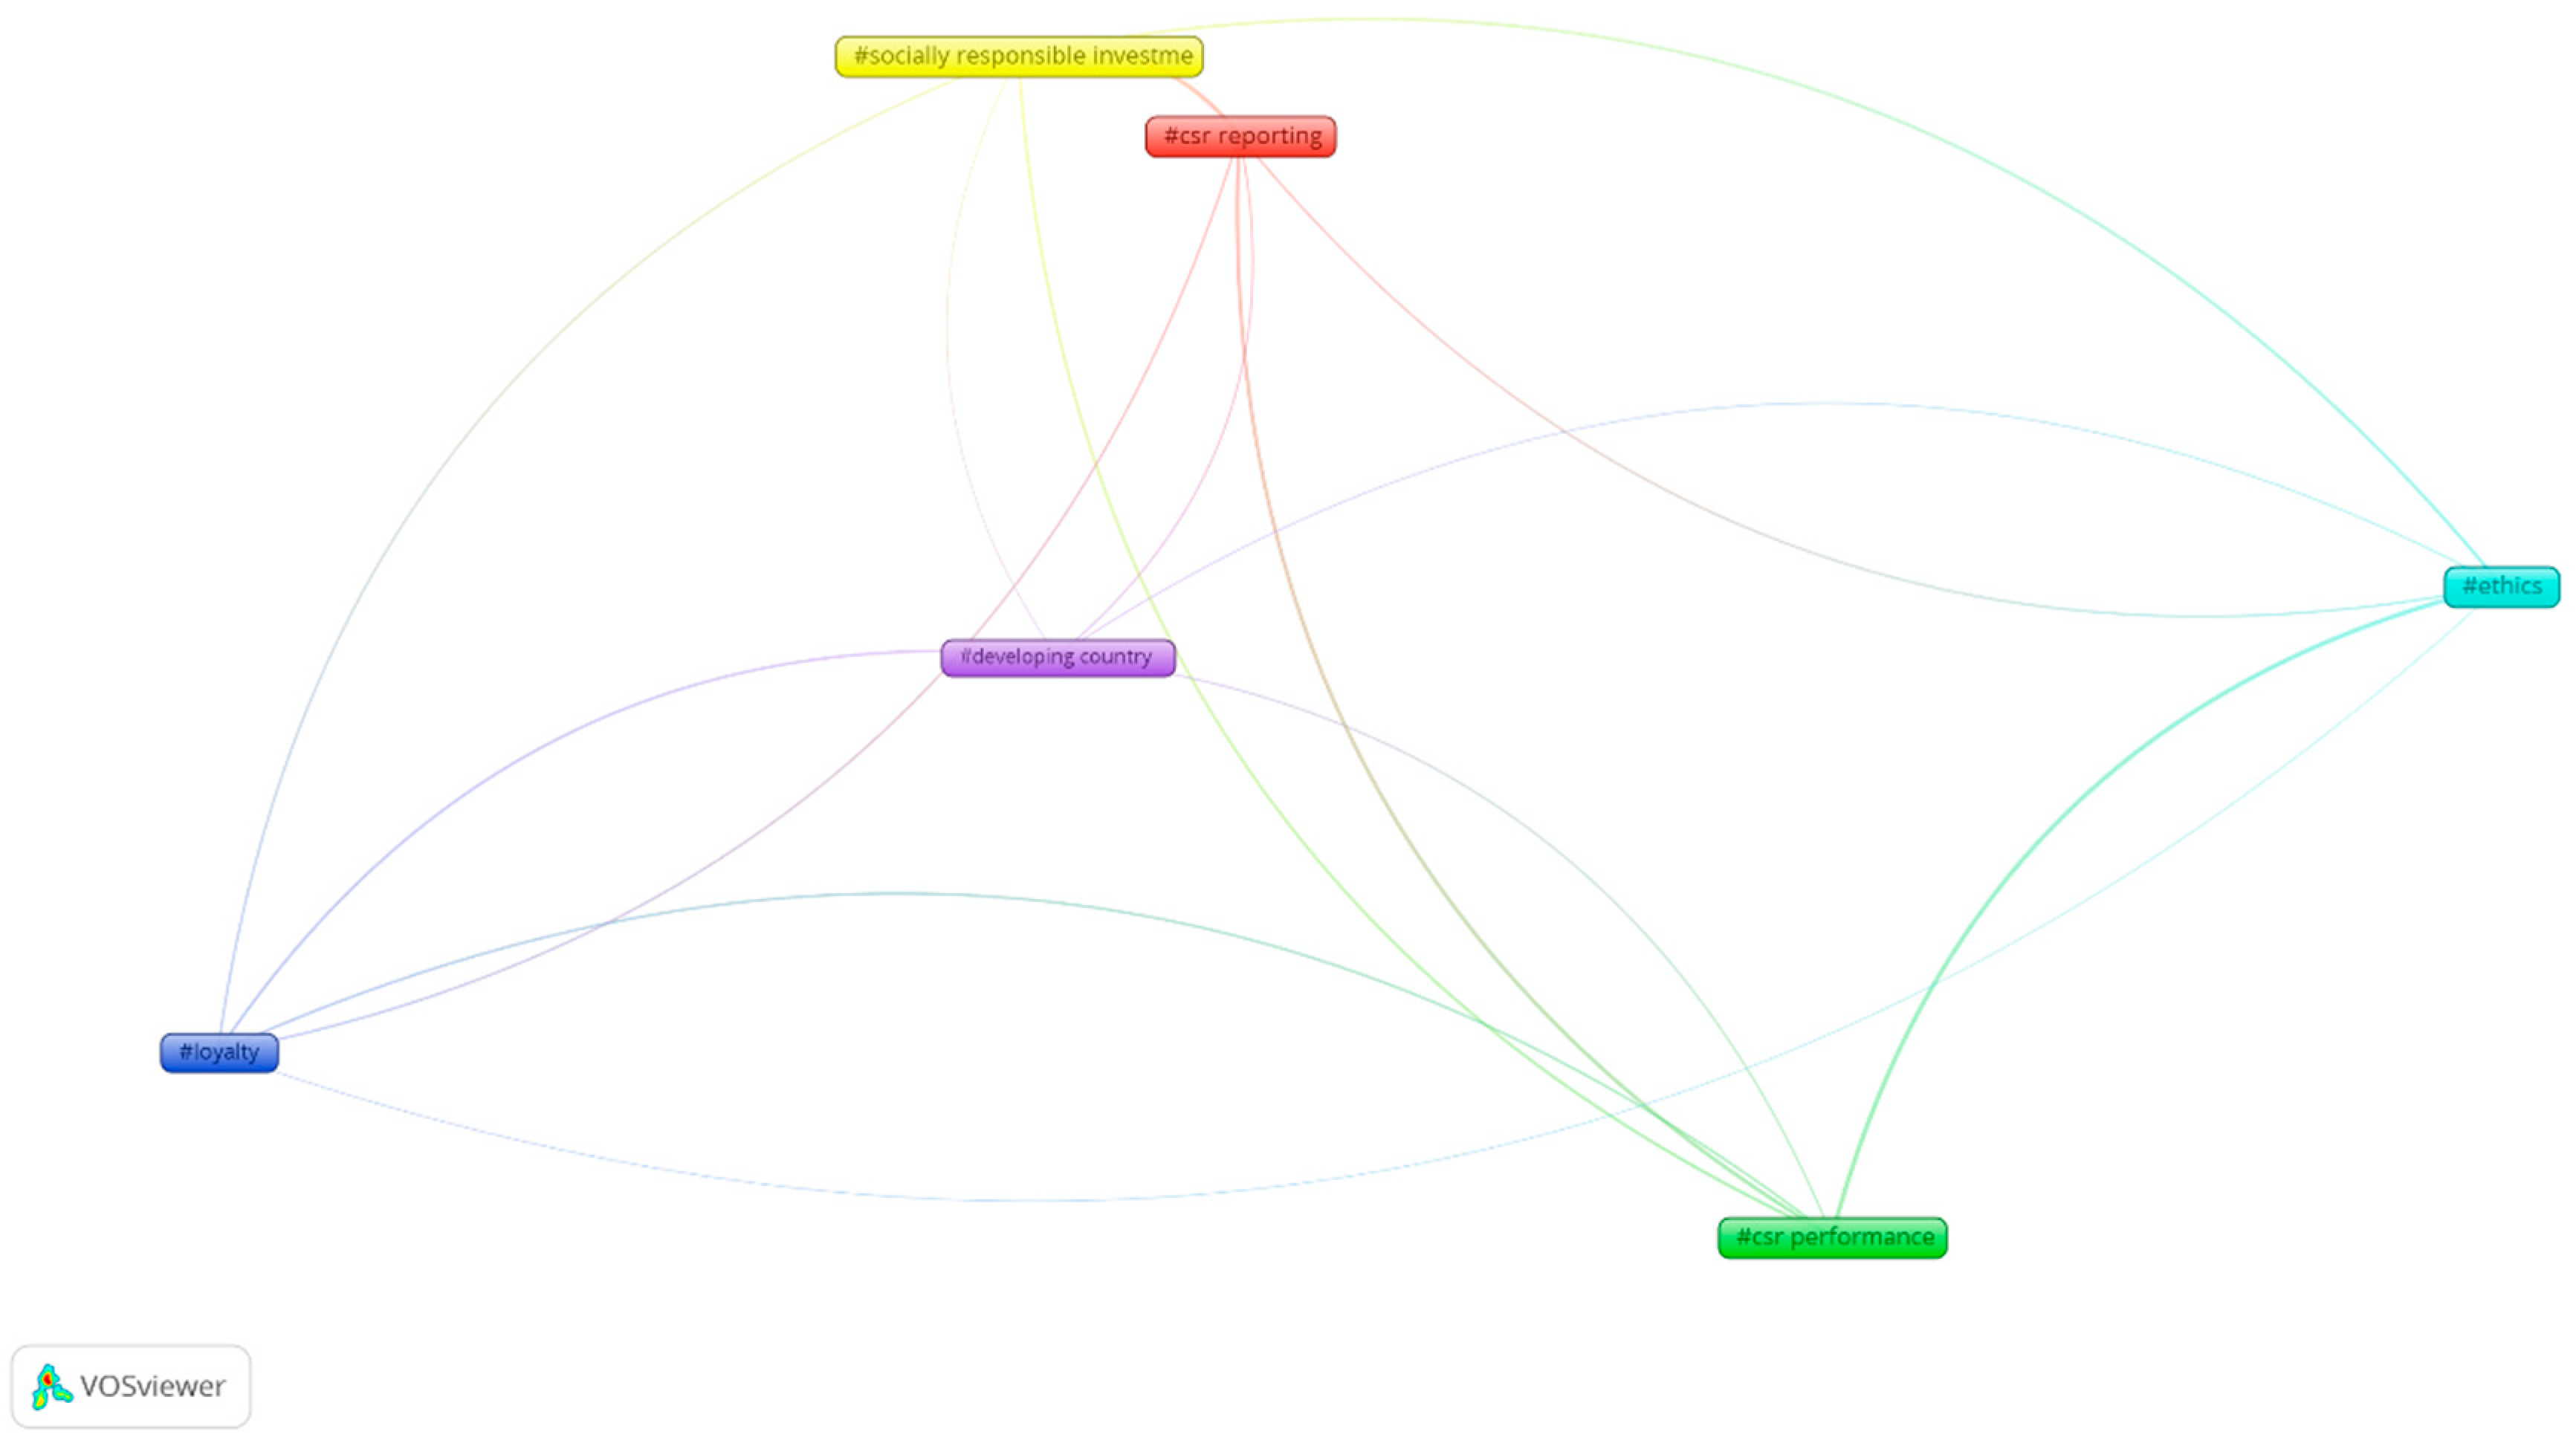
Another interesting aspect is the relationship among themes in different periods. All the relationships among thematic groups in different periods are summed up in
Figure 10, in which the thickness of the lines represents the intensity of the relationship.
“Financial crisis”, a motor theme in the first period, has evolved in 2015–2019 to become two different thematic subnetworks: “socially responsible investment (SRI)”, becoming a declining/emerging theme, and “Ethics”, a highly developed and isolated theme. It is obvious that, with the passage of time, crisis became a less interesting theme, but CSR is now (in this last period), a competitive necessity in the financial industry.
“Reporting” had evolved toward different topics, although its most intense relationship was with the theme “CSR performance”. In fact, “CSR performance” in the first period, was disseminated into four different themes in 2015–2019. “Loyalty” was the most continuous theme, as much in the terms included as in the focus of the theme. “Identity” did not continue in 2015–2019.


