Article

Comparison of Electric Power Output Observed and Estimated from Floating Photovoltaic Systems: A Case Study on the Hapcheon Dam, Korea

1
Department of Energy and Mineral Resources Engineering, Kangwon National University, Samcheok 25913, Korea
2
Korea Water Resources Corporation (K-Water), Daejeon 34045, Korea
3
Department of Energy Resources Engineering, Pukyong National University, Busan 48513, Korea
*
Author to whom correspondence should be addressed.
Sustainability 2020, 12(1), 276; https://doi.org/10.3390/su12010276
Submission received: 5 December 2019 / Revised: 24 December 2019 / Accepted: 26 December 2019 / Published: 30 December 2019
(This article belongs to the Section Energy Sustainability)

Abstract

:
An interest in floating photovoltaic (PV) is growing drastically worldwide. To evaluate the feasibility of floating PV projects, an accurate estimation of electric power output (EPO) is a crucial first step. This study estimates the EPO of a floating PV system and compares it with the actual EPO observed at the Hapcheon Dam, Korea. Typical meteorological year data and system design parameters were entered into System Advisor Model (SAM) software to estimate the hourly and monthly EPOs. The monthly estimated EPOs were lower than the monthly observed EPOs. This result is ascribed to the cooling effect of the water environment on the floating PV module, which makes the floating PV efficiency higher than overland PV efficiency. Unfortunately, most commercial PV software, including the SAM, was unable to consider this effect in estimating EPO. The error results showed it was possible to estimate the monthly EPOs with an error of less than 15% (simply by simulation) and 9% (when considering the cooling effect: 110% of the estimated monthly EPOs). This indicates that the approach of using empirical results can provide more reliable estimation of EPO in the feasibility assessment stage of floating PV projects. Furthermore, it is necessary to develop simulation software dedicated to the floating PV system.

1. Introduction

Floating photovoltaic (PV) systems are PV systems that float on the surface of dam reservoirs, quarry lakes, irrigation canals, or tailing ponds [1]. Recently, the market for floating PV systems has drastically expanded worldwide because of their several strengths compared with PV systems installed on land. First, floating PV systems obtain higher electric power output (EPO) than PV systems on land because relatively low temperature water cools the PV panels. Second, because floating PV arrays are installed on water, national land can be conserved and used for other purposes that enable its efficient use [2]. Third, unlike most PV systems on land, floating PV systems are less obtrusive since they are generally hidden from public view. Fourth, there are fewer rules and regulations for structures built on bodies of water. Fifth, this approach helps to control algae and create fish-spawning environments.
Floating PV systems as eco-friendly electricity generators also have attracted interest from the South Korean (henceforth, Korean) government and energy providers. The Korean government initiated a renewable portfolio standards (RPS) program beginning in 2012 that requires electricity providers to gradually increase their renewable energy EPO [2,3]. To meet the RPS program standard, various renewable energies, including PV, were investigated. However, the Korean peninsula is a small area and numerous existing PV systems in forest areas have caused slope failure of steep terrain and environmental degradation [2,4]. Conversely, the impact caused by a floating PV system has mostly been environmentally benign compared with land PV systems. Furthermore, because there are thousands of dam reservoirs and irrigation canals in South Korea that are appropriate for installing floating PV systems [5], the Korean government made a plan to install floating PV systems on more than 30 dam reservoirs (550 MW) step by step until 2022 [2]. Moreover, the Korean government applied a renewable energy certificate (REC) value of 1.5 to floating PV systems beginning in 2013, while the REC value for overland PV systems was set at 1.0.
In Korea, there have not been many long-term observations of EPO value (henceforth, EPO) data for different floating PV sites throughout the country; however, in order to select proper sites for systems or design floating PV projects in their early stages, an accurate estimation of EPO from a floating PV system, taking into account in situ conditions, is an essential first step.
Various researchers have studied feasibility assessments that have focused on EPOs from floating PV systems. Sahu et al. [6] investigated the status and various design options (e.g., types, concepts, and commercial design) of floating PV power plants worldwide. Cazzaniga et al. [1] reviewed performance analyses and design solutions for floating PV plants. Some work [7,8] has been done to estimate EPOs from floating PV systems by simulation, taking into account local meteorological data, physical characteristics of modules and inverter, and system design. However, these studies have aimed at predicting EPOs without any validation using observational data (i.e., actual EPO values), thus it is hard to interpret or accept the resulting EPOs. On the other hand, a few studies [4,9] have been carried out that have observed and analyzed the characteristics and patterns of monthly EPOs from floating PV systems on site. However, these studies have only analyzed the data obtained from the floating PV systems and lack the scientific estimation step in designing a floating PV project. Most previous studies have been limited in their discussion of feasibility studies for floating systems. Therefore, for a feasibility assessment, it is necessary to estimate EPOs from a floating system using existing meteorological data at an adequate level of confidence and then to interpret and validate EPOs using real EPOs observed on site.
The objective of this study is to analyze the estimation of EPOs from a floating PV system and to validate the results by comparing them with observed EPOs. In order to achieve this, a region for which observed EPO data are available was selected because reference values (i.e., actual EPOs) are necessary for error analysis in order to compare with estimation results. This study differs from previous studies in that it considers both estimation and validation to evaluate the feasibility of a floating PV project. This study did not consider economic assessment by electricity generation for the feasibility study of a floating PV system.

2. Study Area

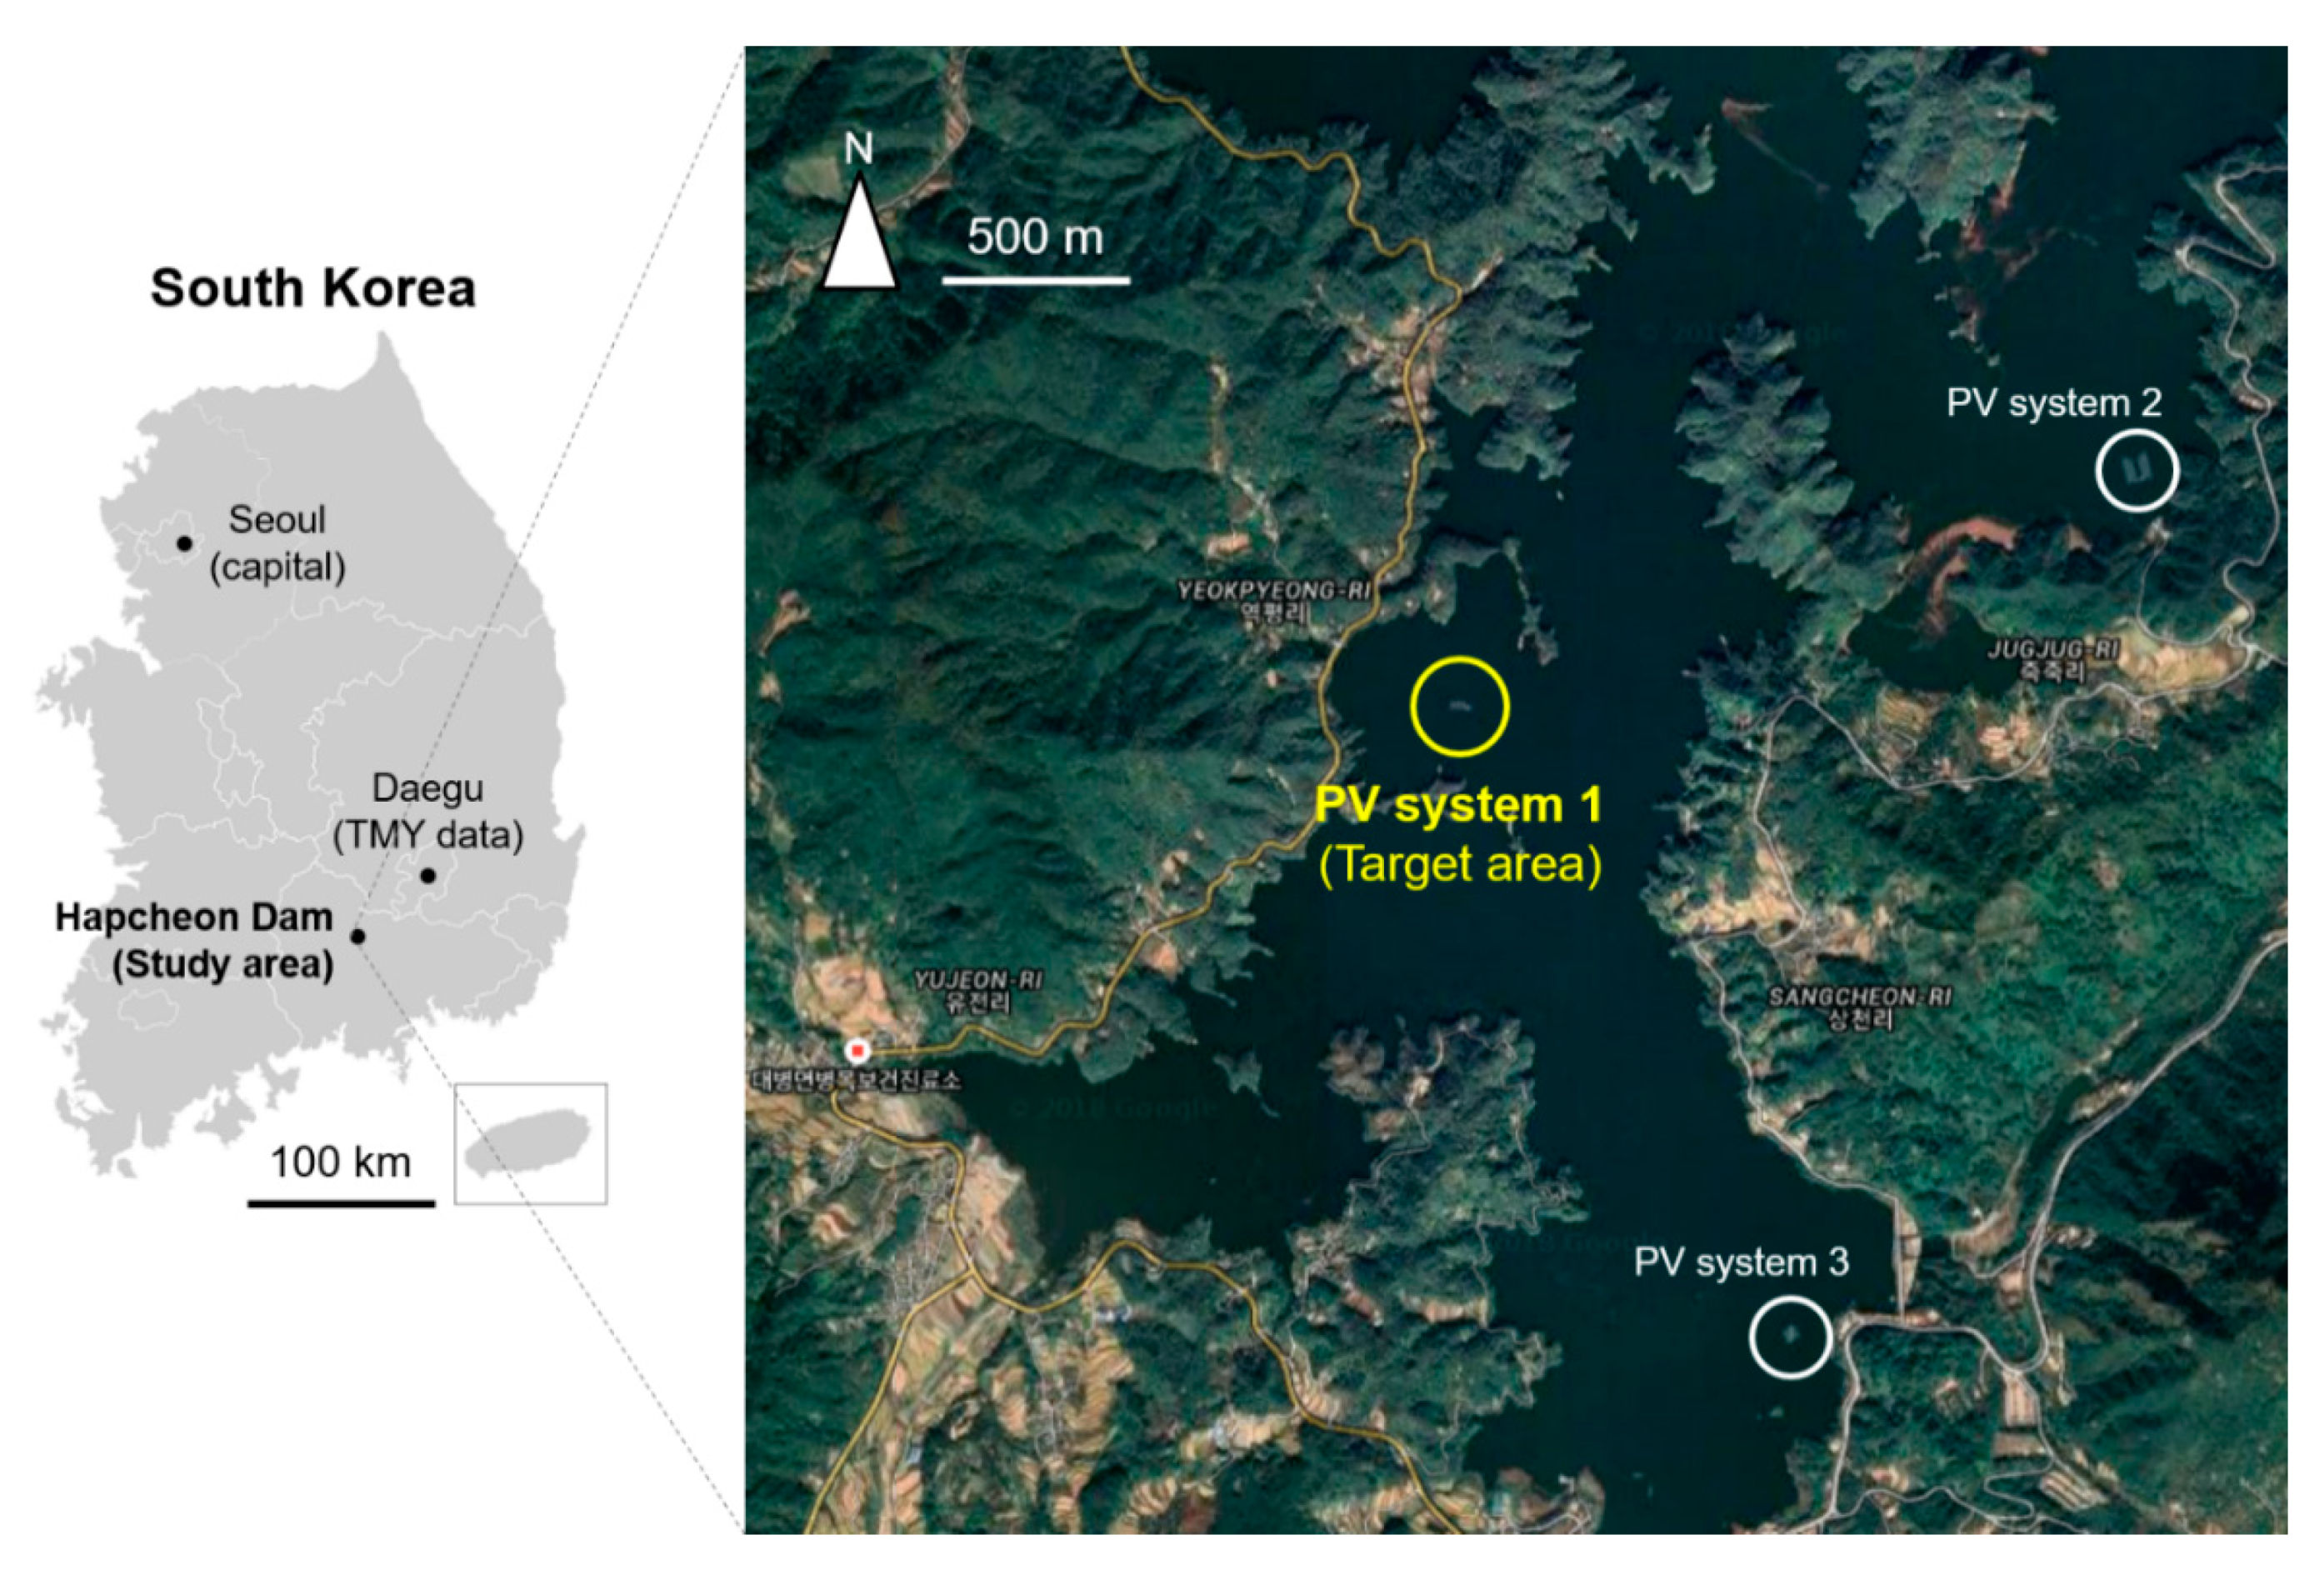
In this study, the Hapcheon Dam, Hapcheon-gun, Korea, was selected as a study area for the analysis and validation of EPOs (Figure 1). This dam is located in the Hwang River, a tributary to the Nakdong River. It is a multi-purpose dam with a height of 96 m, a length of 472 m, a total storage volume of 790 m3, and a basin area of 925 km2.
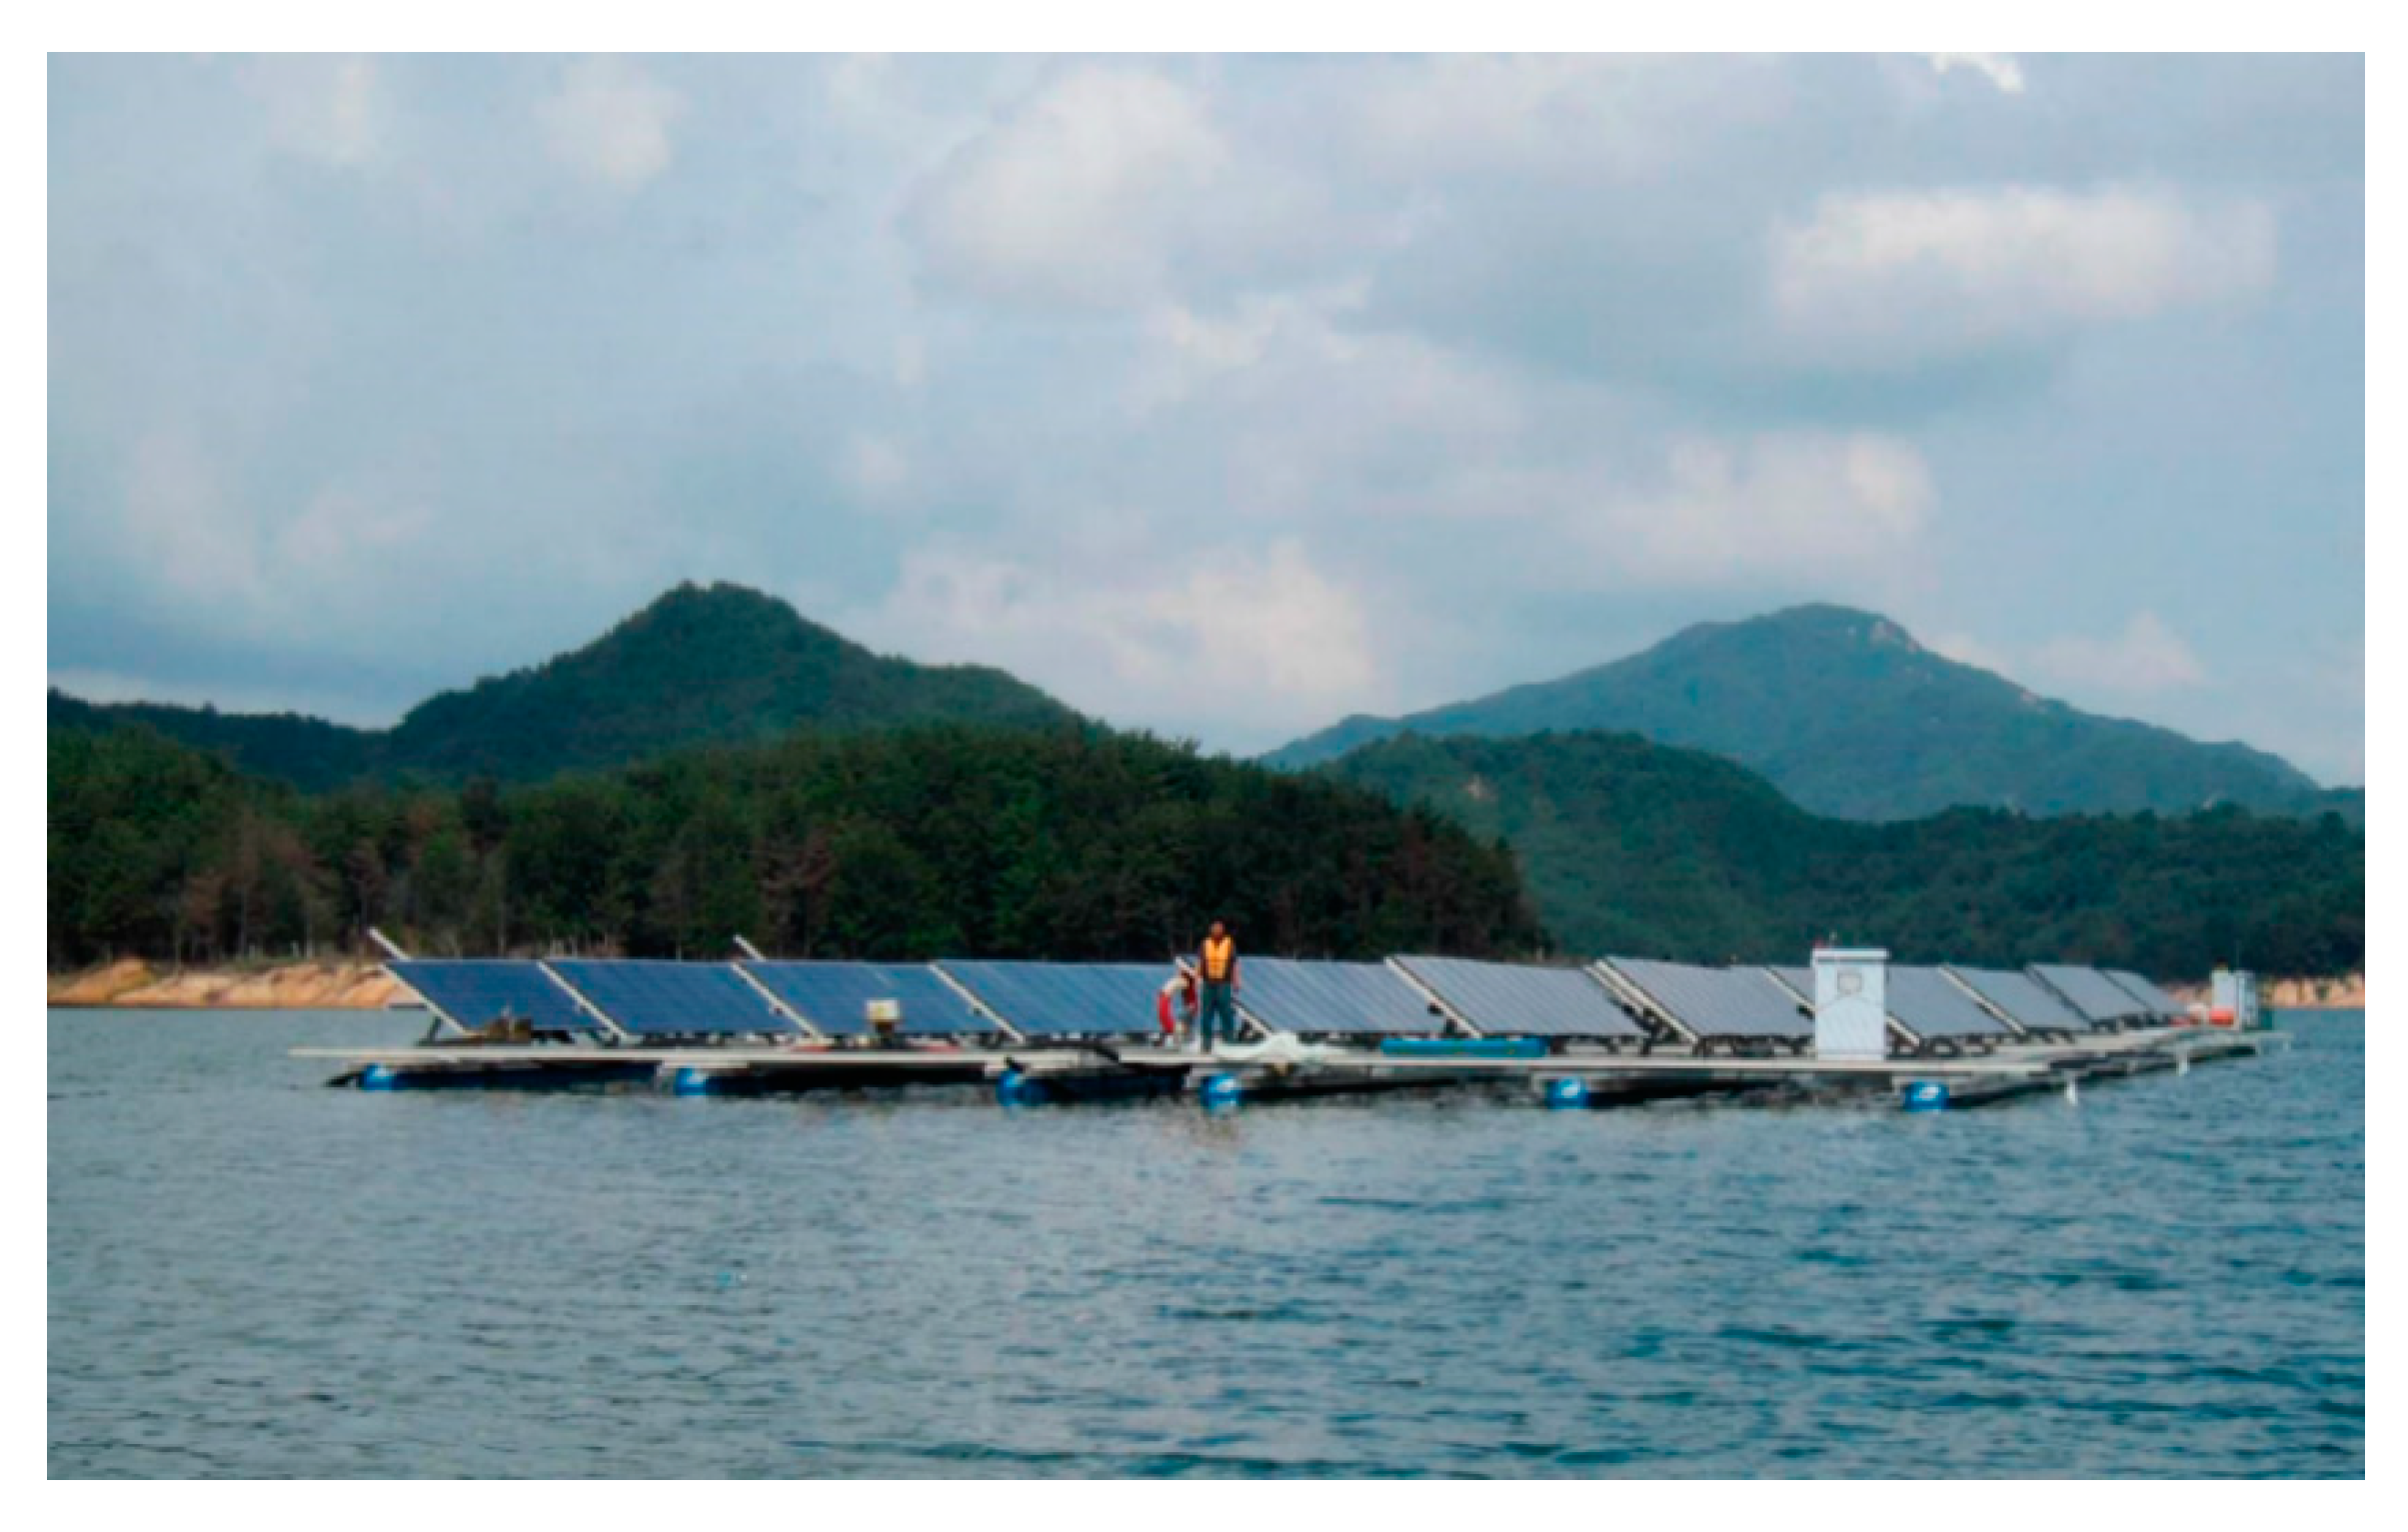
Floating PV system No. 1 (originally three systems existed) is present in Hapcheon Dam (Figure 2), and details of the systems are summarized in Table 1. The system was installed by the Korean public corporation K-water, which constructs, operates, and manages facilities for the comprehensive use and development of water resources in Korea. A fixed-type 99.36 kWp floating PV system, No. 1, installed in October 2011, was selected as a target area to acquire and analyze the longest observed abundant data. System No. 1 was the first floating PV system demonstration plant on a dam reservoir in the world. It was installed in an area that is more than 200 m from land to ensure adequate water depth and avoid the shadow effects of the surrounding mountains.

3. Methods

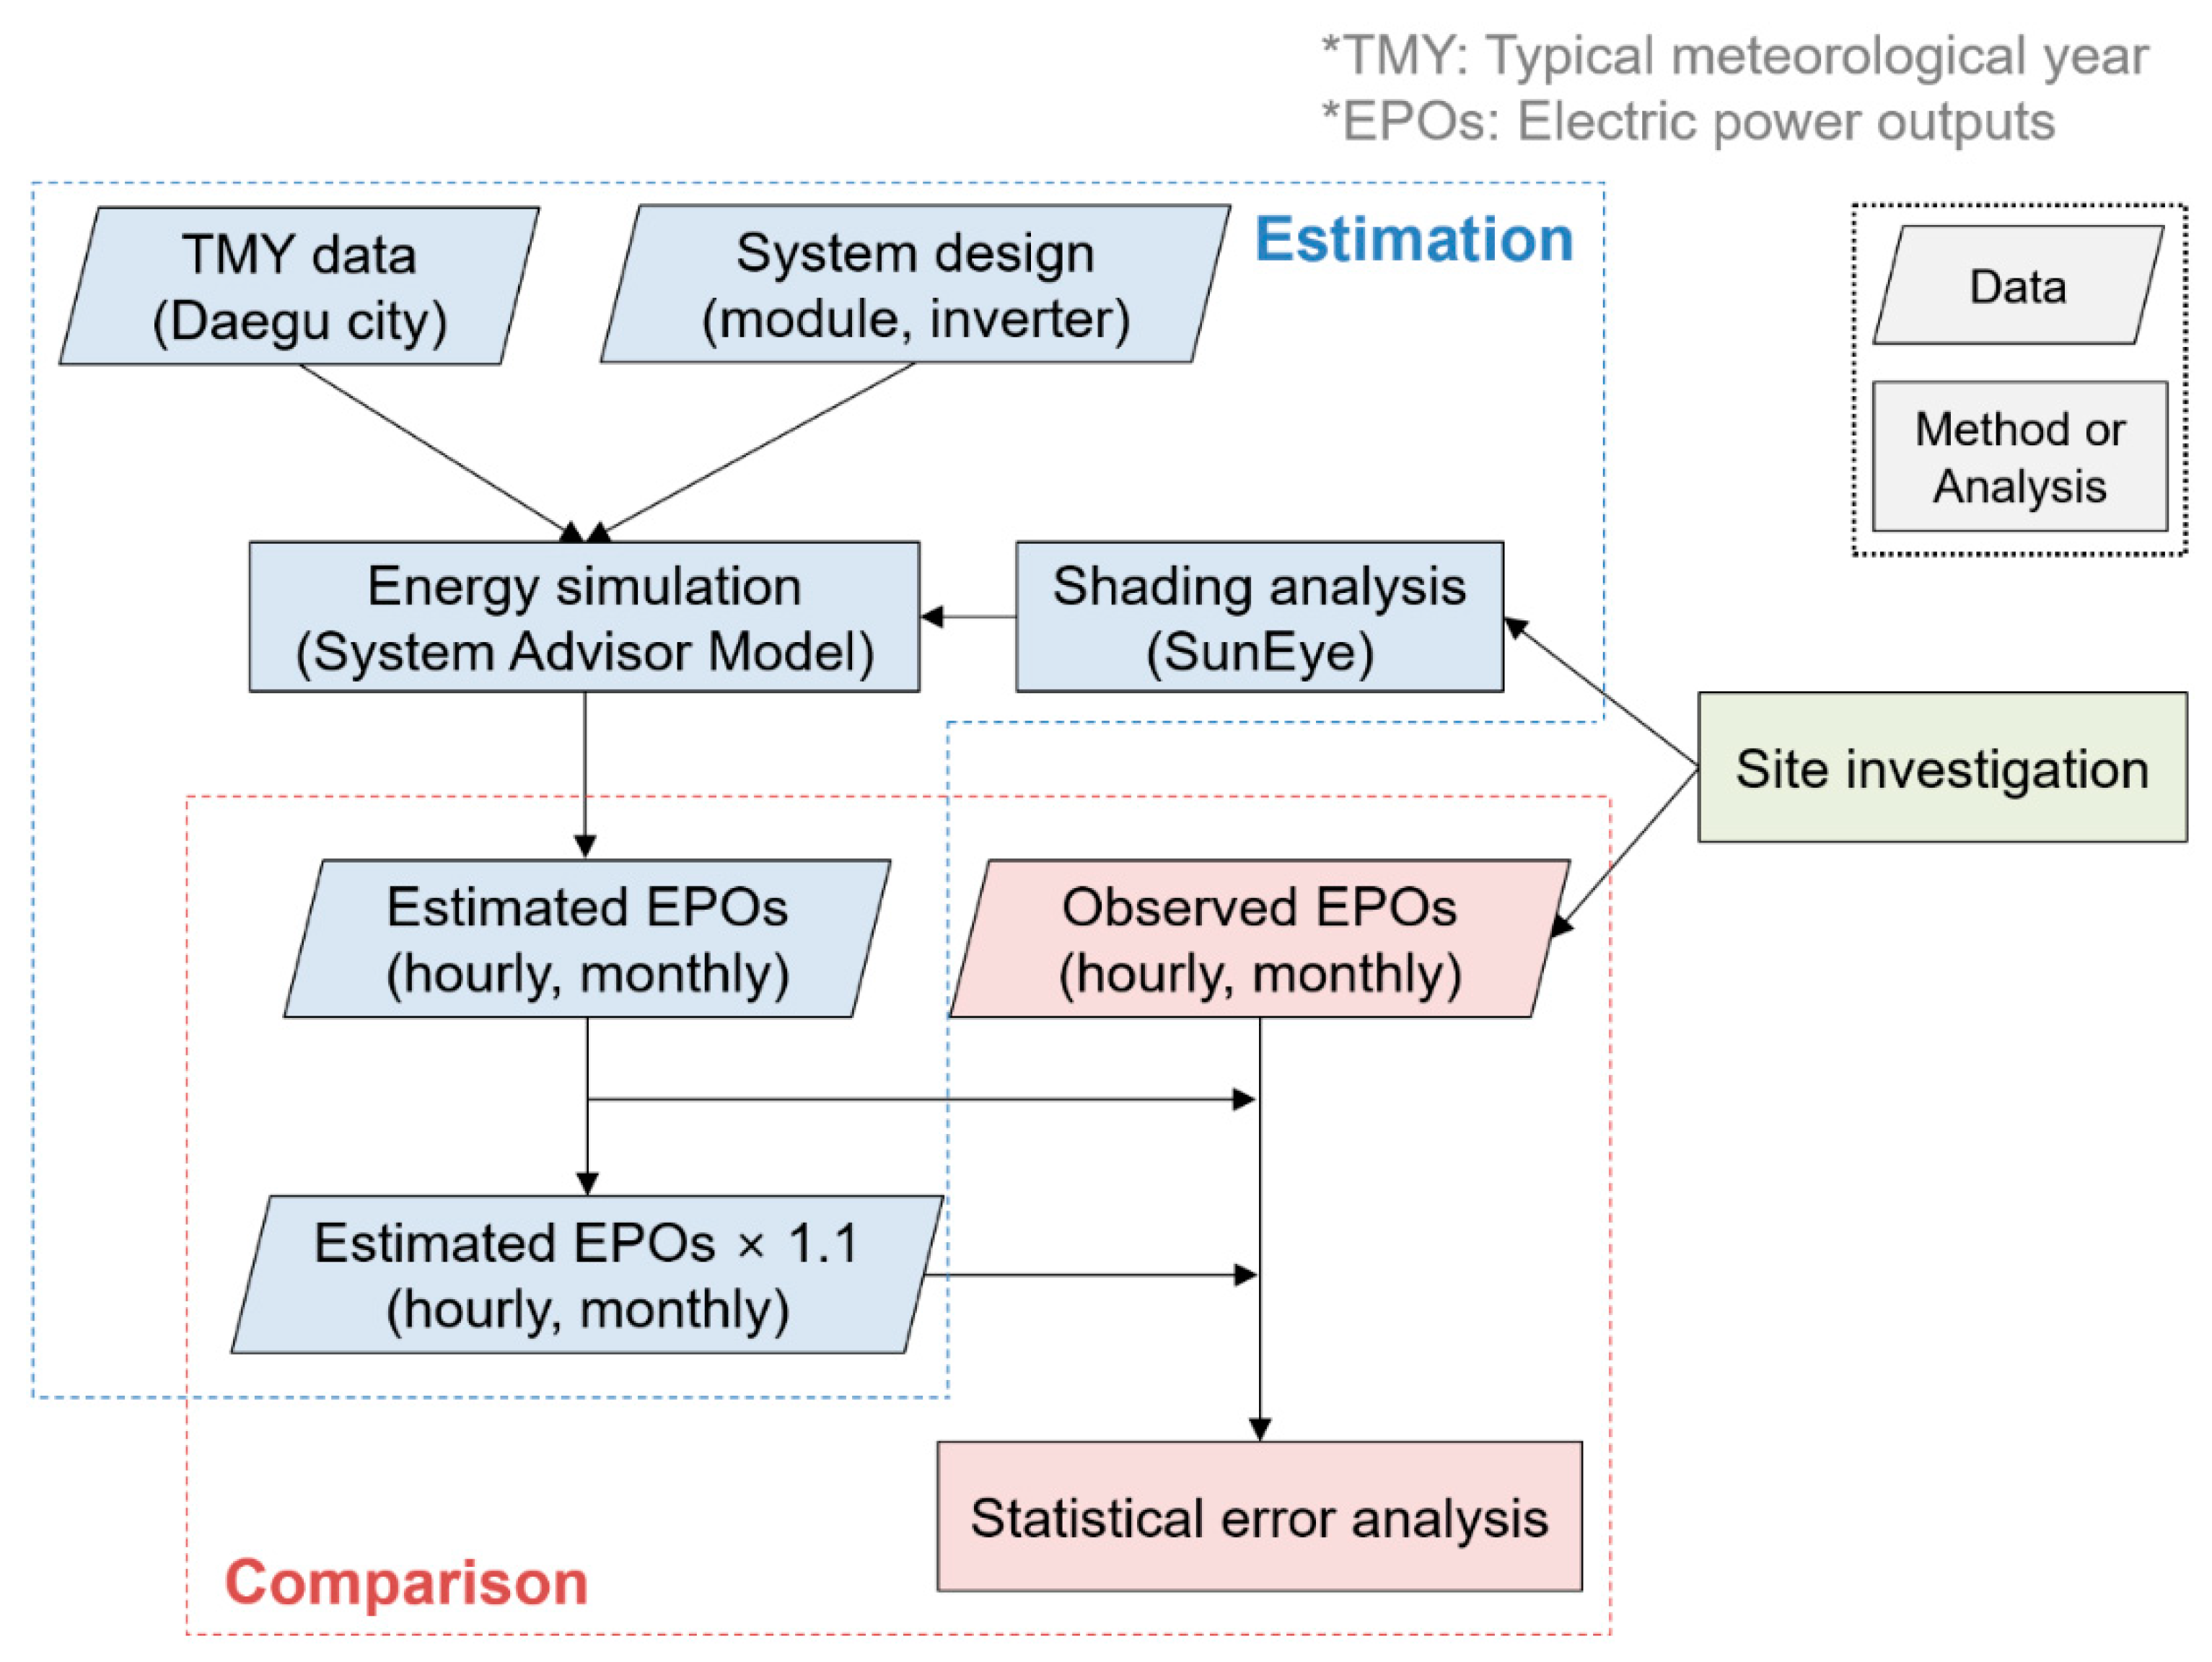
The flowchart employed to estimate and validate the EPOs from the floating PV system in Hapcheon Dam, Korea, is shown in Figure 3. In the first step, hourly typical meteorological year (TMY) data from Daegu city, physical characteristics of module and inverter, and the system design of the Hapcheon Dam were input into System Advisor Model (SAM) software to estimate EPOs from the floating PV system. In this step, the shadow effect of nearby small obstacles, analyzed by site investigation with SunEye equipment, was also entered into SAM software to conduct the energy simulation. Using three different sets of data, hourly EPOs were estimated using SAM software. In the second step, hourly EPO data from floating PV system No. 1, observed for more than four years, were obtained. These data were regarded as actual EPOs (reference values) for the validation in this study. In the third step, the hourly and monthly accumulated estimated EPOs, derived by SAM-based simulation, were quantitatively compared with the hourly and monthly accumulated observed EPO data in terms of statistical error.

3.1. Estimation of EPOs from a Floating PV Using SAM-Based Simulation

SAM software, developed by the United States National Renewable Energy Laboratory (NREL), was used to simulate the performance of the floating PV system in this study. This free software enables simulation of hourly EPO of PV systems and other renewable energy systems. The SAM software calculates the possible electrical power production capacity of the floating PV system by entering the hourly meteorological data (e.g., TMY data) and system design parameters (module and inverter models listed in Table 2) into the SAM software. It requires module and inverter specifications along with information about the number of modules and inverters in the system. Module and inverter specifications can be input from a manufacturer’s data sheet, or from in-built libraries. The photovoltaic model of the SAM software adopts a couple of models, such as the empirical model, the physical model, and the hybrid model (e.g., Sandia model for module and inverter). Moreover, the SAM estimates losses caused by the effect of temperature on the module performance, and has options for calculating shading and other losses in the system. Based on the estimated power output, the economic feasibility and reduction of greenhouse gas emissions can also be assessed. Detailed models and equations to calculate power output of modules in the SAM software can be found in work by Song and Choi [8] and Gilman [10].
Unfortunately, the current version of SAM has no separate feature for floating PV systems. In seeking to address this problem, Song and Choi [8] added 11% to the SAM output value by taking into account previously published experimental results that had shown that floating PV systems yielded 11% greater power output than their terrestrial counterparts. Several studies adopted a model that considers experimental expressions for cell temperature and related environmental characteristics to estimate EPOs by reflecting the natural cooling effect of the water environment to the PV module [11,12]. It is clear that the natural cooling effect does not occur at all electricity generation periods and occurs under relative temperature difference conditions. However, in practice, it is difficult to predict the exact time and degree of the natural cooling effect. Thus, general PV simulation functions in the SAM software were adopted in this study. Moreover, to consider efficiency improvement caused by the natural cooling effect on floating PV modules, 10% was added to the SAM output value. The evidence for multiplying 1.1 (110%) of the EPO values of floating PV is presented in Section 4.3. This software requires three inputs, TMY data, the physical characteristics of the floating PV system, and shading matrix data, to estimate EPOs from the floating PV system.
TMY data are essential input parameters used to estimate EPOs from a floating PV system using SAM-based simulation. The TMY data are statistical hourly data for the specific site (e.g., global horizontal irradiance, direct normal irradiance, temperature, wind speed, wind direction, albedo, and other meteorological characteristics observed for 30 years, from 1981 to 2010) collected as part of the TMY weather data of the NREL National Solar Radiation Database. The Korean TMY data were processed by the Korea Institute of Energy Research, taking into account local meteorological characteristics. The reason why we used TMY data (observed from 1981 to 2010) is to secure the reliability of the meteorological data in predicting EPOs from a long-term perspective at a reliable level.
Although various meteorological characteristics were observed at the target area by the K-water corporation, these were insufficient to be used as hourly TMY data. Therefore, TMY data from Daegu city, which, among the 16 TMY data measurement points in Korea, is nearest to the target area and is approximately 45 km from the Hapcheon Dam (see Figure 1), were adopted to estimate EPOs. As the SAM PV module employs hourly TMY data, it enables an hourly simulation of EPOs.
The physical characteristics of the PV module and inverter and the system-design parameters employed for the floating PV are listed in Table 2. The PVM S240 model of the LSIS module and the DSP-3350k model of the Dasstech inverter were utilized at the target area. The system was composed of 414 modules (240 Wp for each). Details of the module technologies employed in this study can be found in [13]. It was found that the fixed-tilt PV arrays of system No. 1 were installed at an installation angle of 33°, considering the local latitude.
Shading on a PV module hinders generation of electricity. To measure the shadow effects caused by nearby obstacles such as vegetation, the skyline was recorded and analyzed using a fish-eye lens camera (SunEye210). Detailed instructions for the fish-eye lens camera can be found in the work of Song and Choi [14]. This enabled field analysis of the skyline at the PV site. The results of shadow-effect analysis were stored in the form of a shading matrix consisting of month-by-hour shading data for shading elements surrounding the PV site, as expressed by values between 0.0 (complete shielding of direct radiation reaching the PV system) and 1.0 (no shading effects) [15].

3.2. Validation of Simulated EPOs from a Sloating PV

To validate the estimated EPOs from the floating PV system, they were compared with the actual EPOs observed at the target area in terms of three statistical errors in this study. In addition, the estimated EPOs were also multiplied by 1.1 and compared with the observed EPOs to reflect the higher efficiency of the floating PV system compared with that of the overland system.
At the target area, various electrical data and meteorological data, including hourly EPOs, water temperature, wind speed, and other meteorological data were observed for more than four years (from December 2011 to February 2016) by the K-water corporation. However, in the process of exploratory data analysis it was found that there were problems such as missing data and data errors in the 2011, 2014, and 2016 data. Thus, these data were excluded, with only the data from the other three years, 2012, 2013, and 2015, being considered for the validation of EPOs in this study. Inevitably, the EPOs vary from year to year according to the local meteorological conditions and the influence of the surrounding environment. As such, three-year average observed hourly EPOs were used as actual EPOs (reference values) to be compared with the estimated EPOs in this study.
A statistical error test was conducted to quantitatively validate the estimated EPOs. Errors were calculated by subtracting the actual EPOs (i.e., the three-year average observed hourly EPOs at the target area) from the EPOs estimated from the SAM-based simulation. Twenty-four values (12 EPOs estimated and corresponding 12 EPOs observed) and 17,520 values (8760 EPOs estimated and corresponding 8760 EPOs observed) were utilized to calculate statistical errors for hourly data and monthly data, respectively. Smaller errors indicate that the estimated hourly EPOs are accurate and the prediction approach is appropriate. The study employed the root mean square error (RMSE), mean bias error (MBE), and mean absolute percentage error (MAPE) statistical test methods using the following equations:
RMSE = 1 n t = 1 n e t 2
MBE =   1 n t = 1 n e t
MAPE   ( % ) =   100 n t = 1 n | e t y t |
where n indicates the number of data used and et indicates the difference between the EPOs estimated from the SAM-based simulation (xt) and the three-year average observed EPOs (henceforth, observed EPOs) (yt).

4. Results and Discussion

4.1. Results of Monthly EPOs

4.1.1. Comparison Analysis between Average Observed and Estimated Monthly EPOs

The skyline image of the floating PV system was captured using a fish-eye lens camera (SunEye 210). However, the result showed that there were no on-site barriers to light reception present in any direction because the system was located in an area that was more than 200 m from land. Thus, the shading matrix was not input to the SAM simulation in this study.
Table 3 lists the results of monthly accumulated EPOs observed for three years, their seasonal sum, and the estimated monthly accumulated EPOs of the floating PV system No. 1. Monthly accumulated EPOs were computed by summation of hourly electric power output in that month. The three-year average observed yearly EPO from the floating PV system No. 1 was 129,860 kWh (1307 kWh/kWp/year), while the estimated EPO for a year using the SAM-based simulation was 110,108 kWh. That is, the annual observed EPO was higher than the annual estimated EPO.
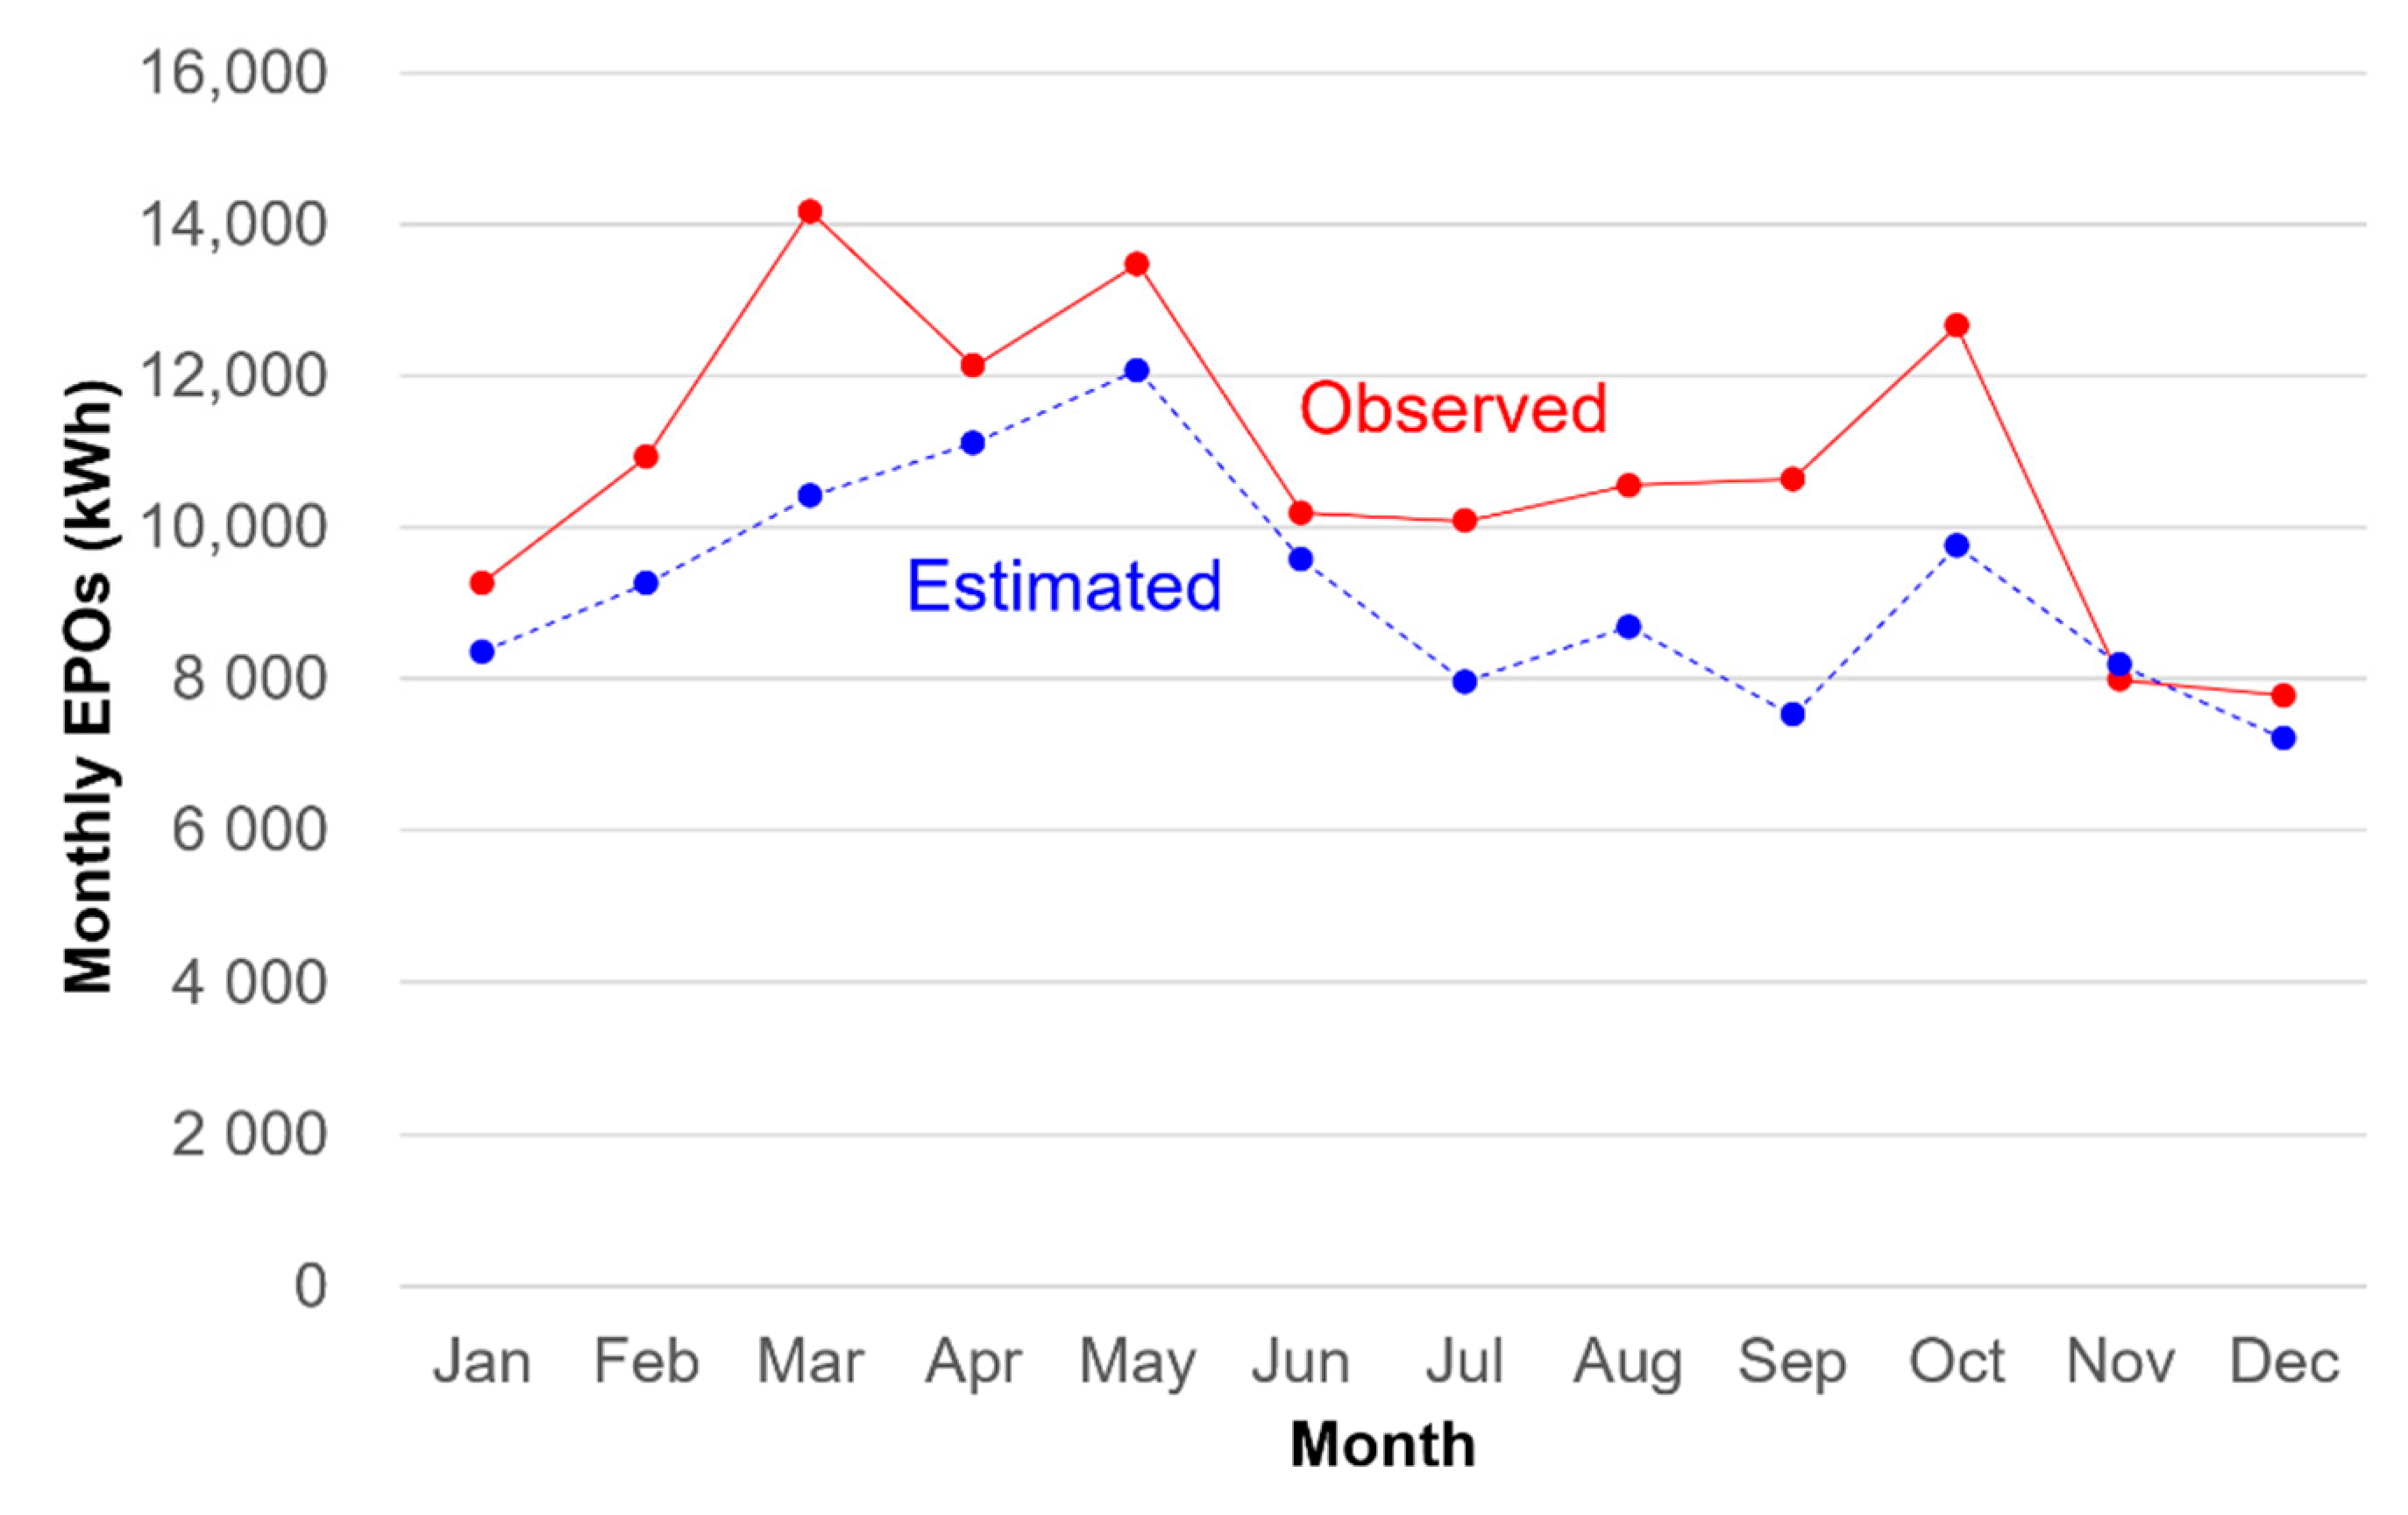
Based on the seasonal sum of Table 3, the observed monthly EPOs were found to be highest in the spring season (March–May) in Korea, although the altitude of the sun and the number of sunshine hours are higher in summer [16], followed by autumn (September–November), summer (June–August), and winter (December–February). This result can be ascribed to Korea generally having long rainy spells and typhoons in July and August (the summer months). In the same way, the estimated monthly EPOs were found to be high in the spring season, followed by summer, autumn, and winter. The maximum observed monthly EPO was 14,170 kWh in March, and the minimum observed monthly EPO was 7780 kWh in December, while the maximum estimated monthly EPO was 12,072 kWh in May, and the minimum estimated monthly EPO was 7205 kWh in December.
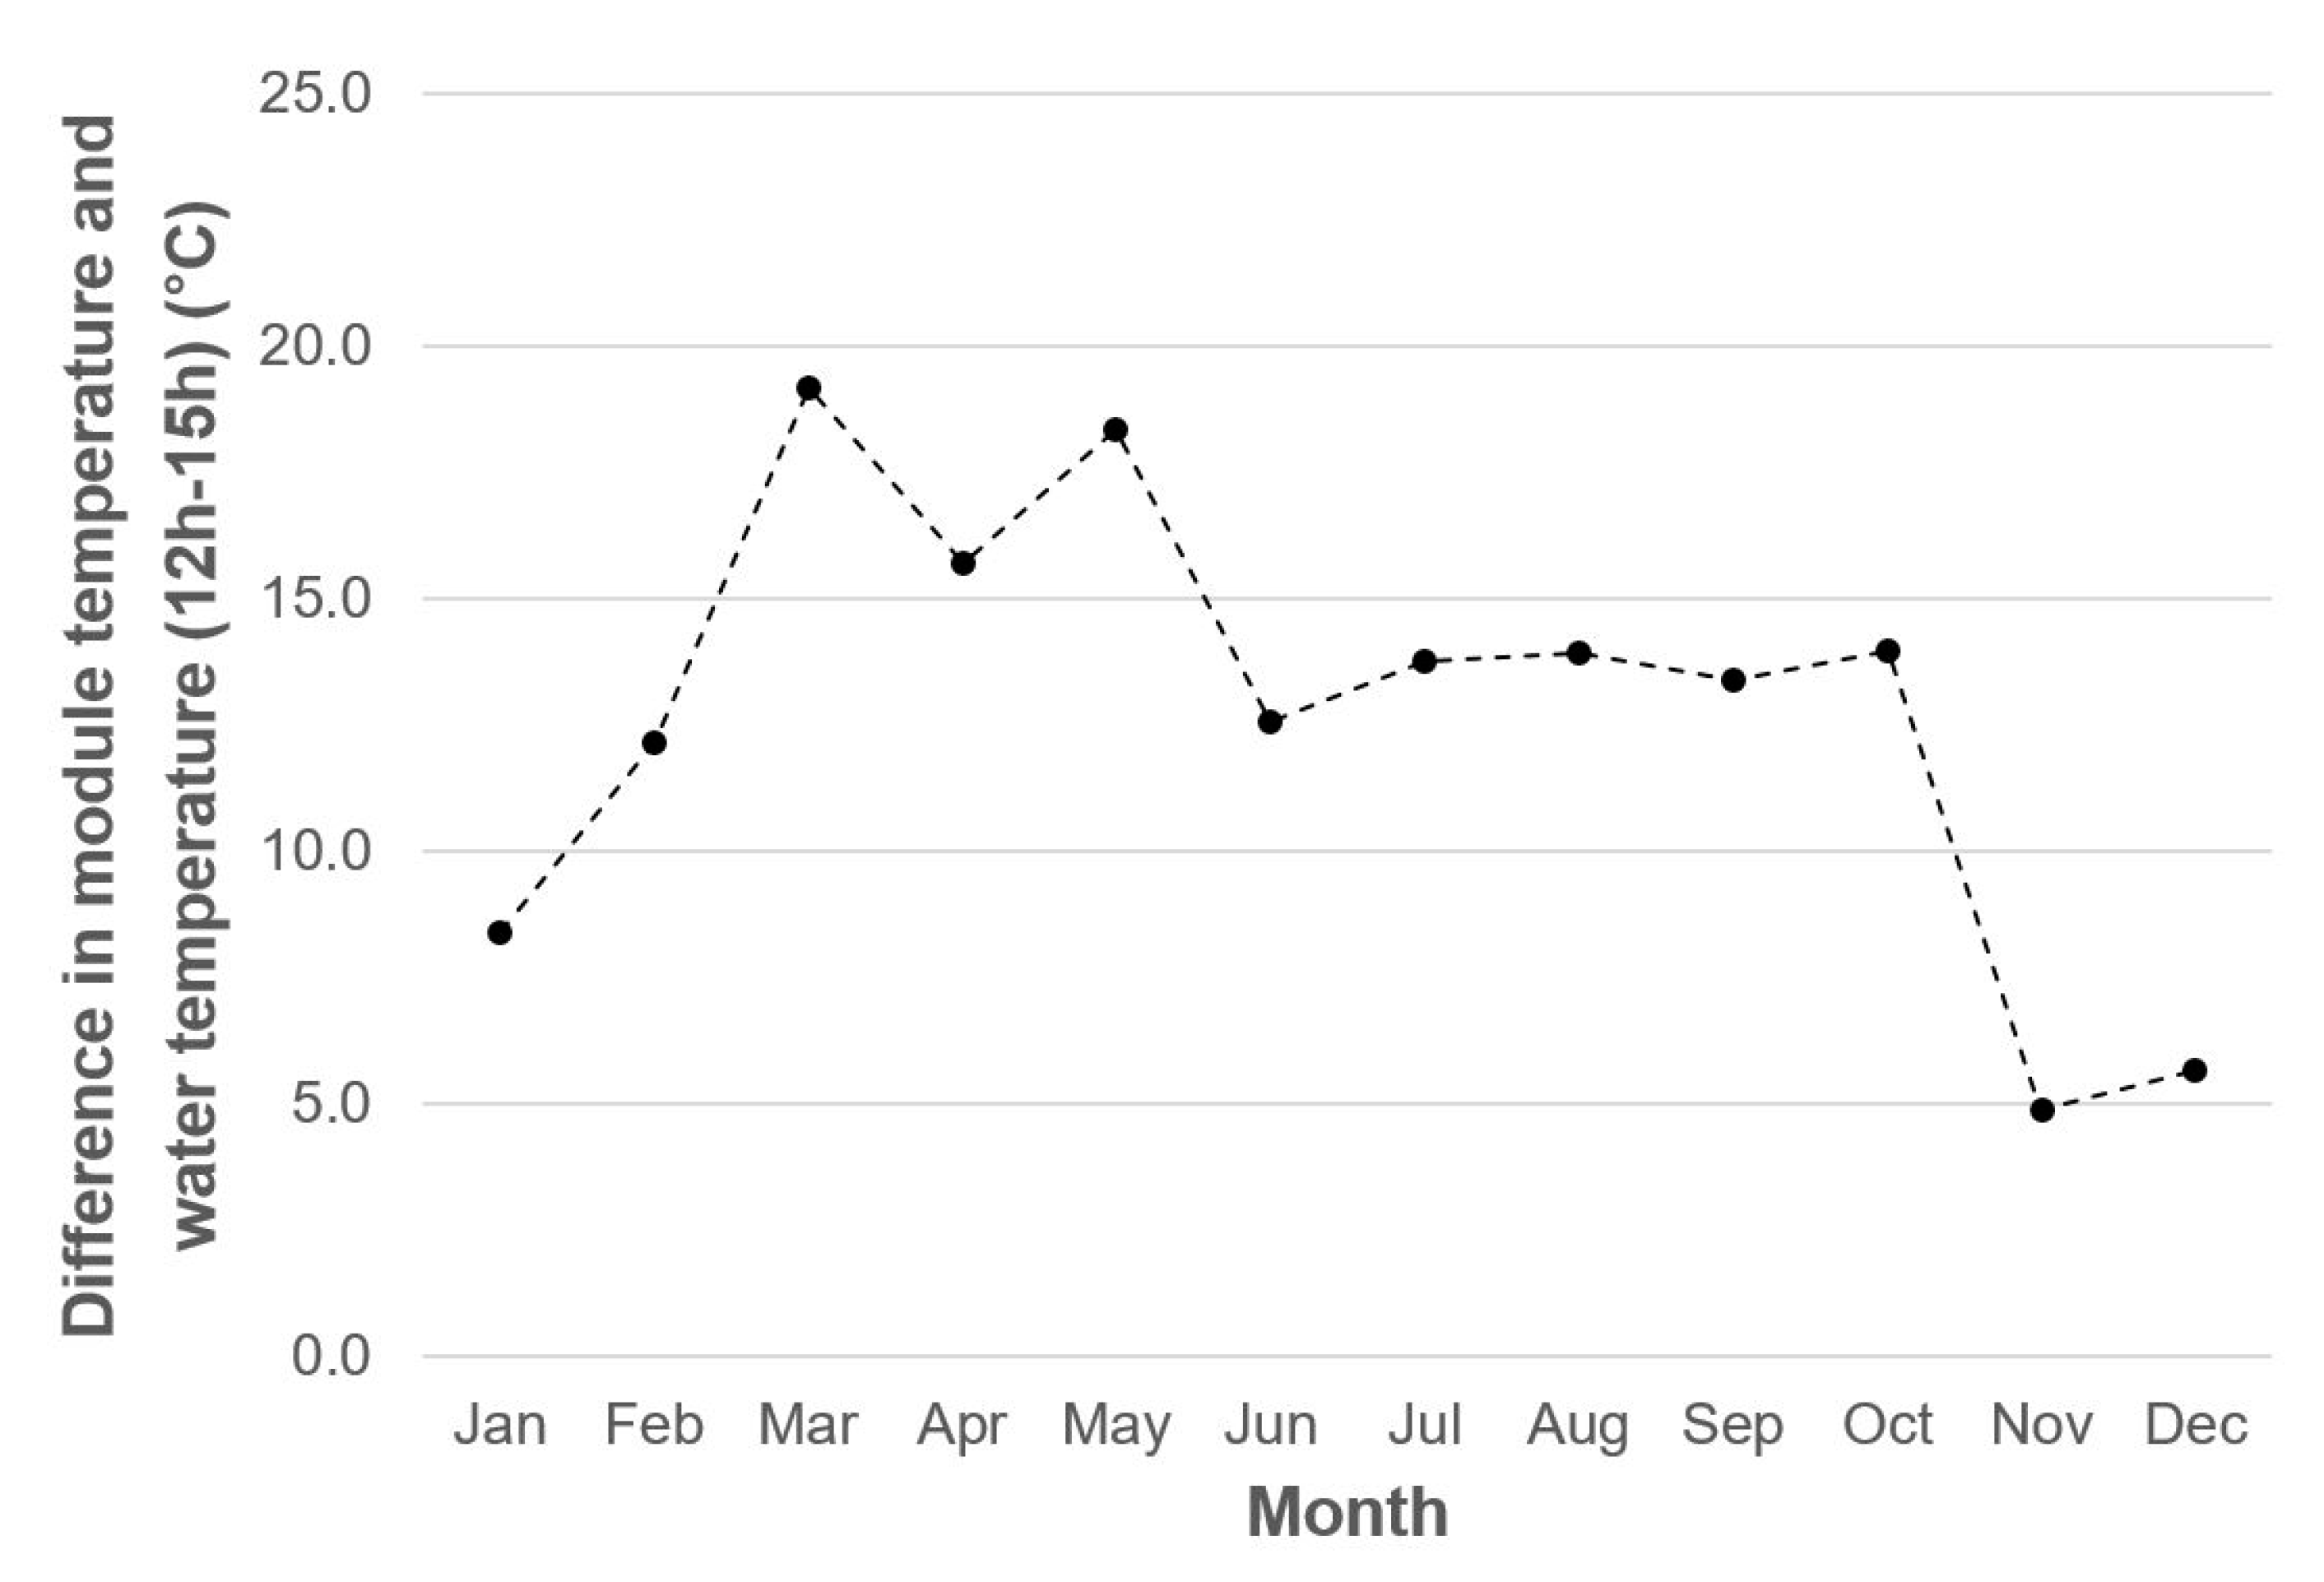
Similar to the results of the yearly data, the three-year average observed monthly EPOs were higher than the estimated monthly EPOs obtained using SAM-based simulation for all months except November (Figure 4). This result can be ascribed to the fact that the natural cooling effect of the water environment on the PV module was not considered when simulating EPOs using the SAM software. As mentioned in the Method section, the current version of the SAM software has no separate feature for floating PV systems. Furthermore, it was found that the differences between observed EPOs and estimated EPOs from November to January were smaller than those of other months. The rationale for the difference between the two EPOs is the difference between the meteorological conditions of the Hapcheon Dam (target area) and Daegu city (TMY data measurement point). Moreover, this result can also be supported by the scientific deduction that the natural cooling effect occurred in the spring and summer season because a high difference in module temperature and water temperature exist, as seen in Figure 5. Conversely, in general, the natural cooling effect rarely occurs in the winter season because the temperature difference between the water and the module is small, as seen in Figure 5. That is, assuming that there is no natural cooling effect, estimated EPOs will be similar to the observed EPOs.

4.1.2. Errors in Estimated Monthly EPOs

The calculation results of the RMSE, MBE, and MAPE for the estimated monthly EPOs are summarized in Table 4. The MBE value herein indicates the mean of the sum of the difference between the observed EPO and the estimated EPO over 12 months (for a year). The calculated MAPE values indicate that it was possible to estimate the monthly EPOs with an error of less than 15% using the SAM-based simulation without the observed EPOs data. In practice, a MAPE of 15% might be a reliable level of estimation. However, the natural cooling effect was not considered in the estimation using the SAM software.
According to the published literature [4,6,8,9], empirical data show that floating PV efficiency is approximately 10% higher that overland PV efficiency. As such, the estimated monthly EPOs simply multiplied by 1.1 are summarized in Table 5. Consequently, the average estimated monthly EPO was increased from 9176 kWh to 10,093 kWh. This shows that it may be possible to estimate the monthly EPOs with an error of approximately 9%. In addition, the sum of the difference between the observed EPO and the estimated EPO for a year was reduced considerably from 19,752 kWh/month to 8741 kWh/month. The RMSE value for a year was reduced from 1991 kWh/month to 1329 kWh/month. However, it should be noted that this simple multiplication is not the best option to take into account the natural cooling effect. This effect occurs under specific temperature conditions (e.g., lower water temperature with higher module temperature). Thus, multiplication by 1.1 can be applied when more detailed local conditions are established.

4.2. Results of Hourly EPOs

4.2.1. Comparison Analysis between Average Observed and Estimated Hourly EPOs

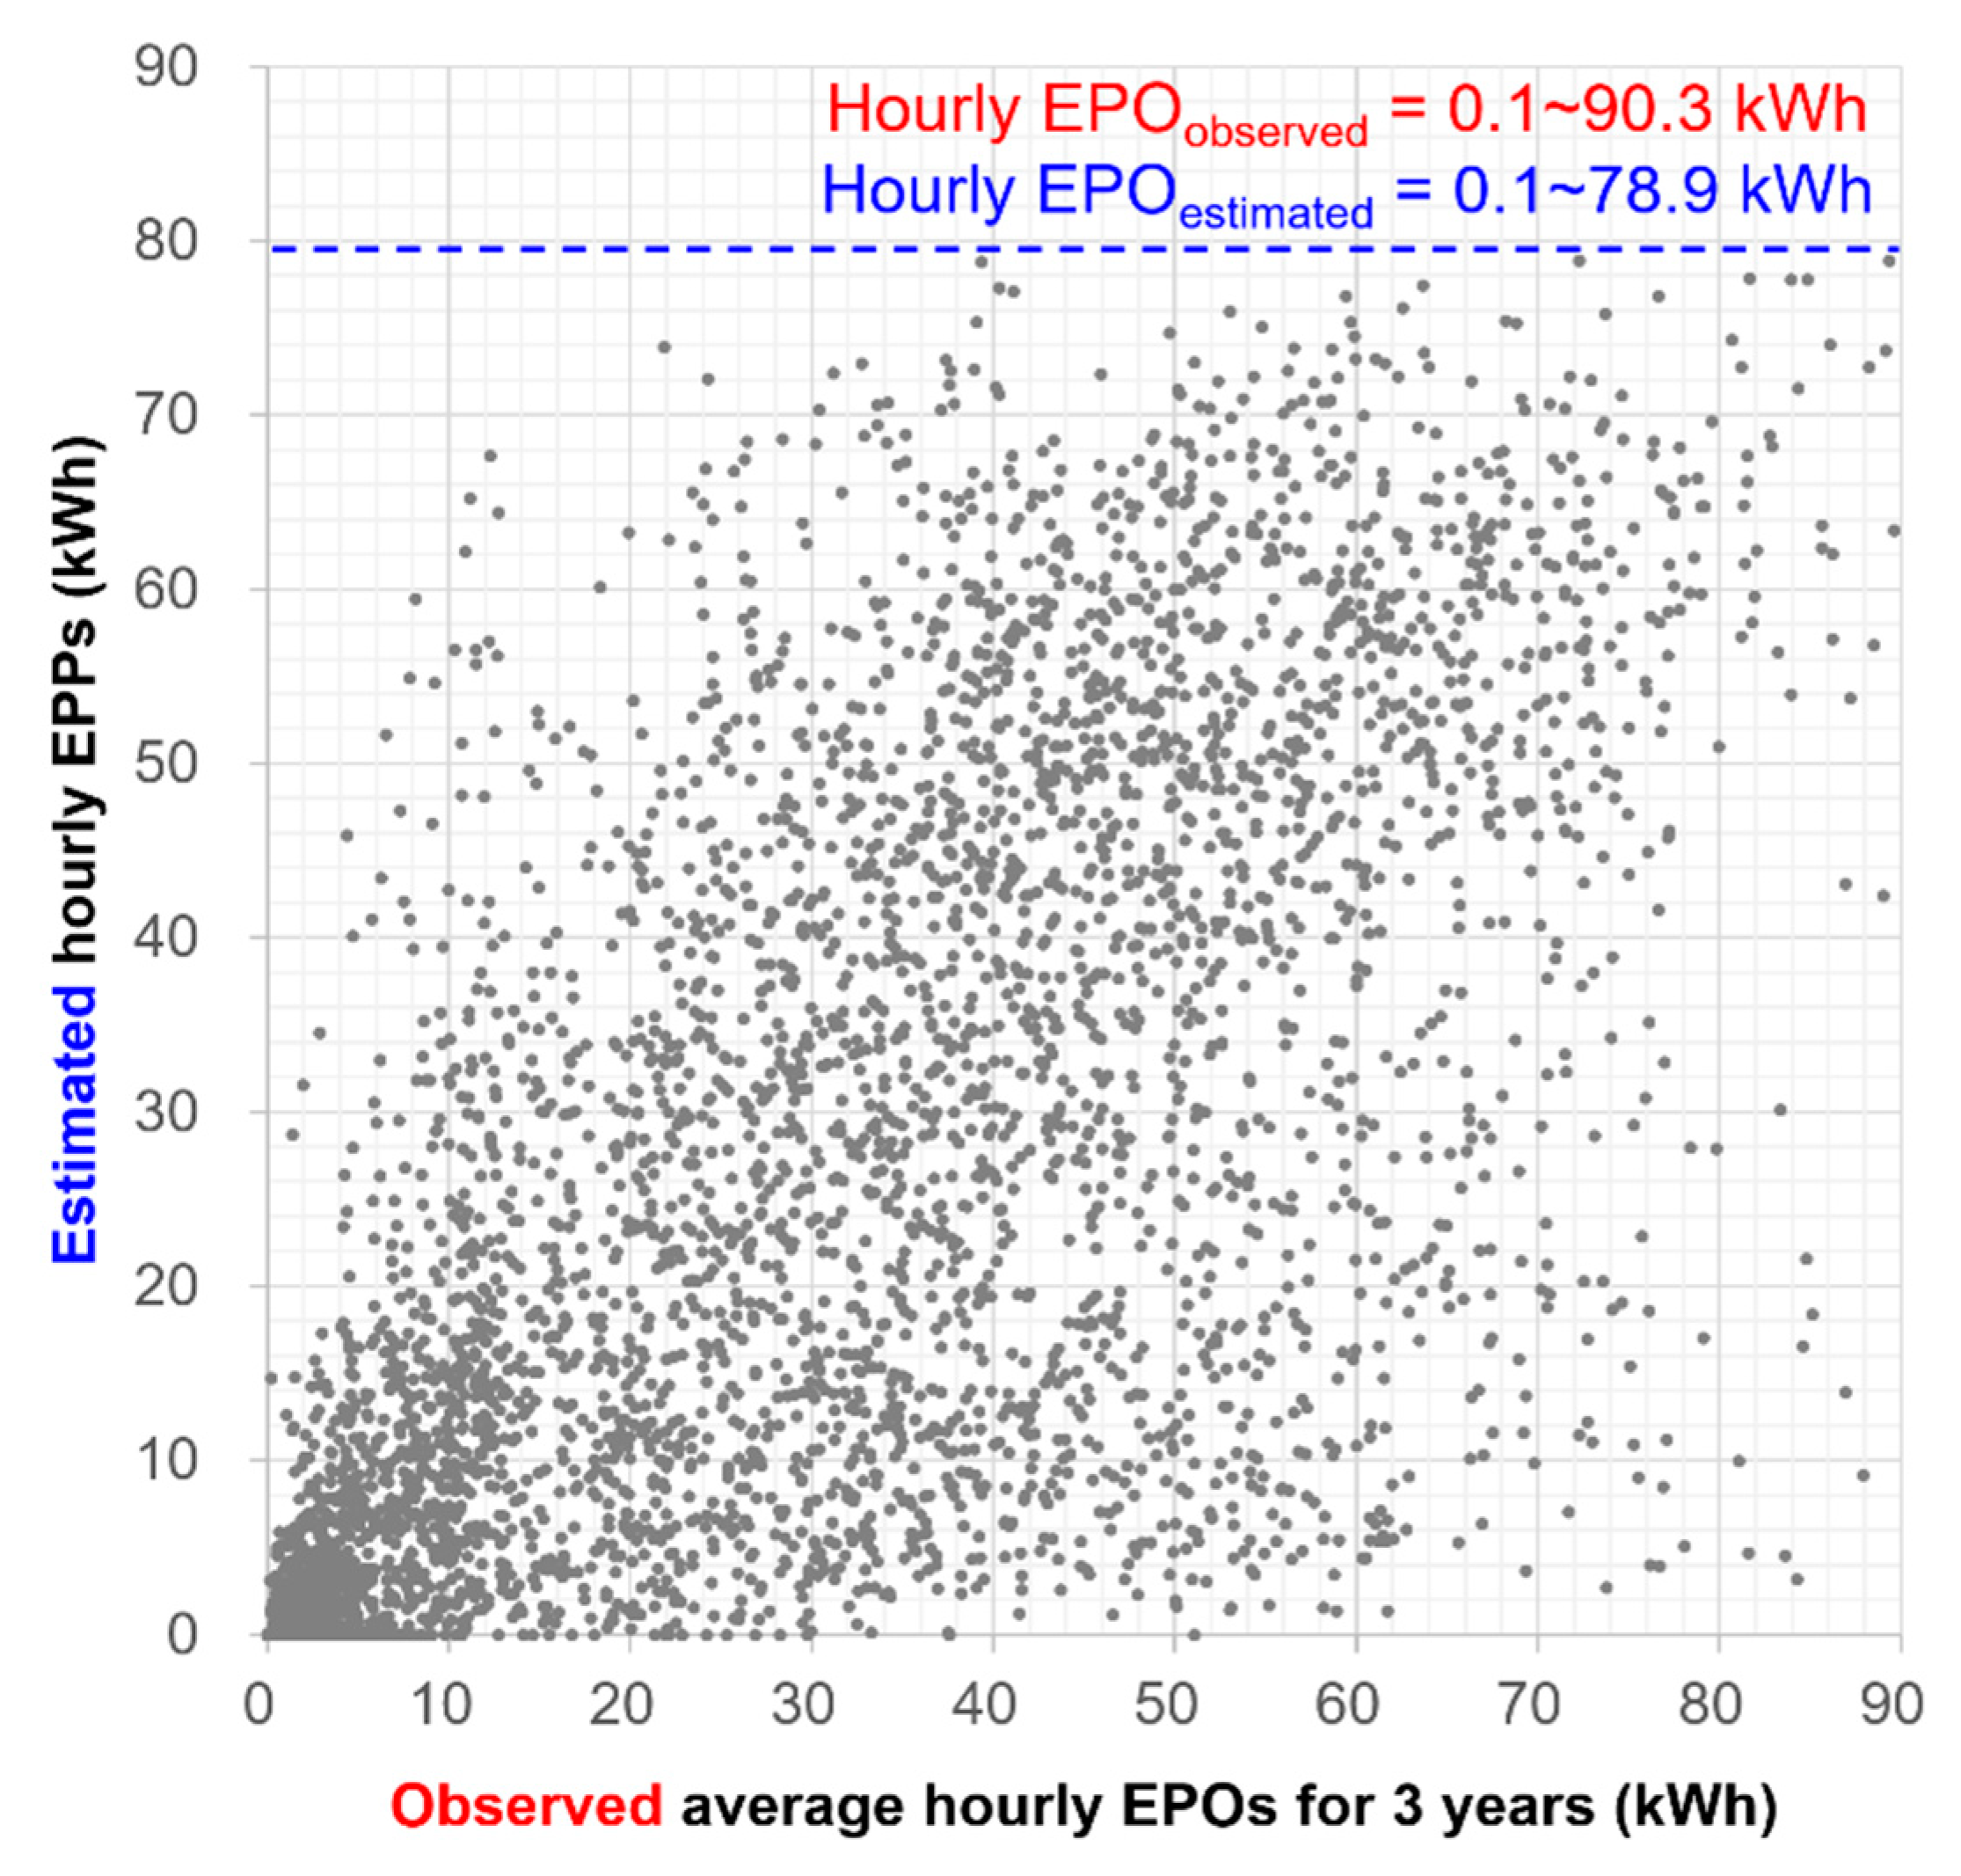
Figure 6 shows the three-year average observed hourly EPOs and the estimated hourly EPOs obtained using the SAM-based simulation. Originally, raw data of the three-year average observed hourly EPOs included two error values. One was EPO datum of 235.3 kWh observed in 2012 (not a three-year average value) and the other was 872.2 kWh in 2012. Since the capacity of the floating PV system No. 1 was 99.36 kWp, an hourly EPO generally has a range of 0 to 99.36 kWh. Accordingly, the two error values greater than 100 kWh were excluded in the error analysis.
From the modified data, the observed hourly EPOs have a range of 0 to 90.3 kWh (mean 15 kWh/h) while the estimated hourly EPOs have a range of 0 to 78.9 kWh (mean 13 kWh/h). Even so, it is evident that the observed hourly EPOs were higher than the estimated hourly EPOs in the higher value part of the graph.
Similar to the monthly data, both the observed hourly EPOs and estimated hourly EPOs were higher in spring than in summer. Both the highest observed hourly EPO of 90.3 kWh and the highest estimated hourly EPO of 78.9 kWh were in March. The reason the observed data are also higher than the estimated data is because the natural cooling effect enhanced the PV module efficiency.

4.2.2. Errors in Estimated Hourly EPOs

The calculation results of the RMSE, MBE, and MAPE for the estimated hourly EPOs are summarized in Table 6. In Table 6, a value of 0 (observed or estimated) corresponding to Hour 1 indicates the hourly EPO at 1 am, January. A value of 14.3 (observed or estimated) corresponding to Hour 9 indicates the hourly EPO at 9 am, January. The average MBE values below indicate that the observed hourly EPOs yielded 2 kWh/h more than the estimated hourly EPOs on average. The calculated MAPE values indicate that it was possible to estimate the hourly EPOs with an error less than 75% using SAM-based simulation without the observed EPOs data. However, a MAPE of 75% is not a reliable level of estimation, although the natural cooling effect was not considered in this estimation.
Table 7 summarizes the values of the estimated hourly EPOs multiplied by 1.1 in order to take into account the natural cooling effect. This showed an average estimated hourly EPO of 13.6 kWh/h. The MBE value for a year was considerably reduced, from 2.4 kWh/h to 1.2 kWh/h. The RMSE value for a year was similar to that of the case without simple multiplication of the EPOs value. Conversely, in the case of the MAPE, the value was increased from 75% to 79%.
It is evident that the main cause of the high MAPE is due to the difference between the meteorological hourly conditions of the Hapcheon Dam (target area) and Daegu city (TMY data measurement point). The hourly meteorological value, including irradiance, temperature, wind, and other parameters, can vary continuously. Thus, unlike monthly characteristics, it is hard to accurately predict hourly meteorological characteristics even though the hourly TMY data were used as input data. Therefore, further study will be required to conduct the hourly-based EPO estimation with high precision.
Moreover, the high MAPE result can also be ascribed to the fact that most hourly EPOs are small, which caused the high MAPE value. In other words, to calculate the MAPE value, the difference between the observed value and the estimated value (numerator) is divided into the observed value (denominator) (see Equation (3)). In this case, the observed hourly EPO as denominator was generally small (compared with the observed monthly EPO), thus the MAPE value is generally high.

4.3. Comparison of the EPOs between the Floating PV System and the Nearby Overland PV System

In order to determine that the floating PV system efficiency is 1.1 times that of the overland PV system, the results of a comparative analysis by Choi [4] were investigated and adopted in this study. The EPO of the 100 kWp floating PV system was compared with the EPO of the 1 MWp overland PV system installed in Haman-gun (comparison area). Haman-gun is located 60 km southeast of the target area (Hapcheon Dam). The meteorological conditions, including the irradiance and temperature of Haman-gun, are similar to those of the target area. The overland PV systems, with a capacity of 935.9 kWp and composed of 4000 modules (250 Wp for each), were installed in 2012 [4].
From February 2012 to January 2013, data from only 185 days of this period were used for the comparative analysis of EPOs because of missing data. The results showed that the 99.36 kWp floating PV system of the Hapcheon Dam generated 421 kWh/day (1547 kWh/kWp/year), while the 1 MWp overland PV system generated 3486 kWh/day (1272 kWh/kWp/year). Since the capacities of the two PV systems were different, the EPO from the overland PV system was converted to 99.36 kWp, the capacity of the floating PV system. This showed that that the Hapcheon Dam floating PV system yielded 13.5% higher EPOs than did the overland system of Haman-gun. Under similar meteorological conditions and after adjusting for similar system capacities, this result indicates that the floating PV system efficiency is higher than the overland PV system because of the natural cooling effects on the floating system. Consequently, this result can support the application of the natural cooling effect on estimating EPOs of the floating system in this study.

5. Conclusions

In this study, hourly and monthly EPOs from the 99.36 kWp fixed-type floating PV system at the Hapcheon Dam, Korea, were estimated using SAM software, and the results were compared with three-year average observed (actual) EPOs. The results showed that both the observed and estimated monthly EPOs were higher in spring than in summer. Both the hourly and monthly estimated EPOs were lower than corresponding observed EPOs. These underestimations can be ascribed to the fact that the natural cooling effect of a water environment on the improvement of PV module efficiency was not considered in the SAM-based simulation. The difference in errors before and after multiplication by 1.1 (110%) in both the monthly and the hourly approach were examined. The error estimation results showed that the SAM simulation approach enables estimation of monthly EPOs with an error of approximately 15% (the MAPE value). Moreover, based on the empirical results showing that floating PV efficiency is approximately 110% of overland PV efficiency, 10% was added to the SAM-based estimated EPO results. Consequently, it was possible to estimate the monthly EPOs with an error of approximately 9% when taking into account the efficiency improvement caused by the natural cooling effect of water. Hourly EPOs were shown to have reduced MBE values when the efficiency enhancement was applied. With only overland PV software, these results show that the suggested SAM-based approach can provide relatively more reliable monthly EPOs in the feasibility assessment step of designing floating PV projects. The results obtained in this study can be used as basic data to design and manage floating PV systems. Furthermore, the suggested simulation approach can be applicable to other floating PV sites.
It should be noted that the natural cooling effect does not occur during all electricity generation periods. Thus, simply multiplying all of the estimated PV output is not the best option to take into account efficiency improvement caused by the natural cooling effect of water, as this effect occurs only during specific temperature conditions (i.e., lower water temperature, higher air ambient temperature, and higher PV cell temperature). Therefore, further research is necessary to identify when natural cooling effects occur and to examine the degree of influence of environmental conditions on PV module efficiency. In addition, to date, no PV software has a separate feature for floating PV systems. Thus, it is necessary to develop a simulation algorithm appropriate for floating PV systems that takes into account the environmental effects of a water environment, such as the natural cooling effect, wave effects caused by high wind speed, reflected irradiance, and other characteristics.
This study employed TMY data from Daegu city as input data for the SAM-based simulation because of insufficient meteorological data available for the target area. In future, if data are available, it would be useful to compare local meteorological data from the Hapcheon Dam with TMY data from Daegu city to identify the parameters that may have caused a large difference between the observation data and the estimation data. This could also determine whether the use of TMY data from Daegu city is appropriate or not in the simulation of EPOs from the PV system at the Hapcheon Dam. In future work, it would be interesting to examine the multi-criteria effects that the investments in question can generate because investments in solar energy generate not only financial but also social and environmental impacts [17,18].

Author Contributions

Y.C. and J.S. conceived and designed the simulation; Y.J. gathered data; J.S. and Y.C. performed the simulation and analyzed the data; J.S. and Y.C. wrote the paper. All authors have read and agreed to the published version of the manuscript.

Funding

This research was supported by the Basic Science Research Program through the National Research Foundation of Korea (NRF) funded by the Ministry of Education (2019R1I1A3A01062541).

Conflicts of Interest

The authors declare no conflict of interest.

Abbreviations

The following abbreviations are used in this manuscript:
PVPhotovoltaic
EPOsElectric power outputs
SAMSystem Advisor Model
RPFRenewable portfolio standards
RECRenewable energy certificate
TMYTypical meteorological year
NRELNational Renewable Energy Laboratory
RMSERoot mean square error
MBEMean bias error
MAPEMean absolute percentage error

References

  1. Cazzaniga, R.; Cicu, M.; Rosa-Clot, M.; Rosa-Clot, P.; Tina, G.M.; Ventura, C. Floating photovoltaic plants: Performance analysis and design solutions. Renew. Sustain. Energy Rev. 2018, 81, 1730–1741. [Google Scholar] [CrossRef]
  2. Kim, S.H.; Yoon, S.J.; Choi, W.; Choi, K.B. Application of floating photovoltaic energy generation systems in South Korea. Sustainability 2016, 8, 1333. [Google Scholar] [CrossRef] [Green Version]
  3. Nematollahi, O.; Kim, K.C. A feasibility study of solar energy in South Korea. Renew. Sustain. Energy Rev. 2017, 77, 566–579. [Google Scholar] [CrossRef]
  4. Choi, Y.K. A study on power generation analysis of floating PV system considering environmental impact. Int. J. Softw. Eng. Its Appl. 2014, 8, 75–84. [Google Scholar] [CrossRef]
  5. Choi, Y.; Song, J. Sustainable Development of Abandoned Mine Areas Using Renewable Energy Systems: A Case Study of the Photovoltaic Potential Assessment at the Tailings Dam of Abandoned Sangdong Mine, Korea. Sustainability 2016, 8, 1320. [Google Scholar] [CrossRef] [Green Version]
  6. Sahu, A.; Yadav, N.; Sudhakar, K. Floating photovoltaic power plant: A review. Renew. Sustain. Energy Rev. 2016, 66, 815–824. [Google Scholar] [CrossRef]
  7. Choi, Y. A Case Study on Suitable Area and Resource for Development of Floating Photovoltaic System. Int. J. Electr. Comput. Energetic Electron. Commun. Eng. 2014, 8, 828–832. [Google Scholar]
  8. Song, J.; Choi, Y. Analysis of the Potential for Use of Floating Photovoltaic Systems on Mine Pit Lakes: Case Study at the Ssangyong Open-Pit Limestone Mine in Korea. Energies 2016, 9, 102. [Google Scholar] [CrossRef]
  9. Choi, Y.K.; Choi, W.S.; Lee, J.H. Empirical Research on the Efficiency of Floating PV Systems. Sci. Adv. Mater. 2016, 8, 681–685. [Google Scholar] [CrossRef] [Green Version]
  10. Gilman, P. SAM Photovoltaic Model Technical Reference; National Renewable Energy Laboratory: Golden, CO, USA, 2015.
  11. Wei, C.C. Evaluation of Photovoltaic Power Generation by Using Deep Learning in Solar Panels Installed in Buildings. Energies 2019, 12, 3564. [Google Scholar] [CrossRef] [Green Version]
  12. Umoette, A.T.; Ubom, E.A.; Festus, M.U. Design of stand alone floating PV system for Ibeno health centre. Sci. J. Energy Eng. 2016, 4, 56–61. [Google Scholar] [CrossRef] [Green Version]
  13. Marshal Electrical and Metal Products Co. Ltd. Available online: http://www.marshalmetal.com/product/photovoltaic-module/ (accessed on 23 December 2019).
  14. Song, J.; Choi, Y. Design of photovoltaic systems to power aerators for natural purification of acid mine drainage. Renew. Energy 2015, 83, 759–766. [Google Scholar] [CrossRef]
  15. Melo, E.G.; Almeida, M.P.; Zilles, R.; Grimoni, J.A.B. Using a shading matrix to estimate the shading factor and the irradiation in a three-dimensional model of a receiving surface in an urban environment. Sol. Energy 2013, 92, 15–25. [Google Scholar] [CrossRef]
  16. Suh, J.; Choi, Y. Methods for converting monthly total irradiance data into hourly data to estimate electric power output from photovoltaic systems: A comparative study. Sustainability 2017, 9, 1234. [Google Scholar] [CrossRef] [Green Version]
  17. Nesticò, A.; Sica, F. The sustainability of urban renewal projects: A model for economic multi-criteria analysis. J. Prop. Invest. Financ. 2017, 35, 397–409. [Google Scholar] [CrossRef]
  18. Nesticò, A.; Somma, P. Comparative Analysis of Multi-Criteria Methods for the Enhancement of Historical Buildings. Sustainability 2019, 11, 4526. [Google Scholar] [CrossRef] [Green Version]
Figure 1. Location map of floating photovoltaic (PV) systems in the Hapcheon Dam, Korea. (source: Google Maps, http://www.google.com/maps).
Sustainability 12 00276 g001
Figure 2. Photos of floating PV system in the Hapcheon Dam, Korea [2].
Sustainability 12 00276 g002
Figure 3. Overall procedure to estimate and compare the EPOs from the floating PV system in the Hapcheon Dam, Korea.
Sustainability 12 00276 g003
Figure 4. Plot of the three-year average observed monthly EPOs and the estimated monthly EPOs obtained using the System Advisor Model (SAM)-based simulation.
Sustainability 12 00276 g004
Figure 5. Mean difference in hourly module temperature and hourly water temperature between 12 h and −15 h in each month.
Sustainability 12 00276 g005
Figure 6. Plots showing the three-year average observed hourly EPOs and the estimated hourly EPOs produced using simulation (modified data excluding error values).
Sustainability 12 00276 g006
Table 1. Summary of floating PV systems in the Hapcheon Dam, Korea.
SystemOperationTypeCapacityPurposeCompany
No. 1October 2011–presentFixed99.36 kWpFor demonstrationK-water
Table 2. Physical characteristics of module and inverter, and parameters of PV system design.
ModulePVM S240 (LSIS)
Nominal efficiency14.932%
Maximum power240.704 Wdc
Temperature coefficients−0.512%/°C (−1.232 W/°C)
Maximum power voltage29.4 Vdc
Open circuit voltage37.7 Vdc
Short circuit current8.8 Adc
InverterDSP-3350 k (53 kW) (Dasstech)
Efficiency98%
Maximum AC power4000 Wac
Nominal AC voltage380 Vac
Maximum DC voltage900 Vdc
Maximum DC current155 Adc
Maximum MPPT DC800 Vdc
Nominal DC voltage620 Vdc
Minimum MPPT DC200 Vdc
System DesignModule capacity99.36 kW
Inverter capacity500 kW
DC to AC ratio1.23
Tilt33° (fixed)
Azimuth180° (South)
TrackingFixed
Table 3. Results of observed and estimated monthly accumulated EPOs at the Hapcheon Dam (unit: kWh).
MonthObservedEstimated
201220132015Average for 3 YearsSeasonal SumSAM SimulationSeasonal Sum
Jan859897849406926327,969
(winter)
836024,822
(winter)
Feb10,68111,05111,04510,9269257
Mar12,09715,18215,23214,17039,777
(spring)
10,41433,603
(spring)
Apr13,25613,179995412,13011,117
May12,44413,35214,63513,47712,072
Jun10,18210,14010,25610,19330,832
(summer)
957126,222
(summer)
Jul10,6009811983810,0837963
Aug918611,97110,51310,5578688
Sep10,47311,15010,27410,63231,282
(autumn)
752125,460
(autumn)
Oct13,63811,40112,94712,6629755
Nov96129981436979878184
Dec8091853067207780 7205
Sum128,858135,532125,189129,860 110,108
Energy yield
(kWh/kWp)
1297136412601307
Table 4. Error estimation between the three-year average observed monthly EPOs and the estimated monthly EPOs.
MonthObserved (kWh)Estimated (kWh)Difference (kWh)RMSE (kWh/month)MBE (kWh/month)MAPE (%)
Jan926383609021991164615
Feb10,92692571668
Mar14,17010,4143757
Apr12,13011,1171013
May13,47712,0721405
Jun10,1939571622
Jul10,08379632120
Aug10,55786881869
Sep10,63275213111
Oct12,66297552907
Nov79878184−197
Dec77807205575
Sum129,860110,10819,752
Average10,82291761646
Table 5. Error estimation between the three-year average observed monthly EPOs and the estimated monthly EPOs multiplied by a factor of 1.1, considering the natural cooling effect.
MonthObserved (kWh)Estimated × 1.1 (kWh)Difference (kWh)RMSE (kWh/month)MBE (kWh/month)MAPE (%)
Jan926391966613297289
Feb10,92610,183743
Mar14,17011,4552715
Apr12,13012,229−99
May13,47713,279198
Jun10,19310,528−336
Jul10,08387591324
Aug10,55795561000
Sep10,63282732359
Oct12,66210,7311931
Nov79879002−1015
Dec77807926−145
Sum129,860121,1198741
Average10,82210,093728
Table 6. Error estimation between the three-year average observed and the estimated hourly EPOs.
HourObserved (kWh)Estimated (kWh)RMSE (kWh/h)MBE (kWh/h)MAPE (&)
10013.32.475
200
92.814.3
1012.336.9
87533.84.6
875900
876000
Sum129,860110,108
Average14.812.6
Table 7. Error estimation between the three-year average observed hourly EPOs and the hourly EPOs multiplied by a factor of 1.1, considering the natural cooling effect.
HourObserved (kWh)Estimated (kWh)RMSE (kWh/h)MBE (kWh/h)MAPE (&)
10013.61.279
200
92.815.8
1012.340.6
87533.85.0
875900
876000
Sum129,860121,119
Average14.813.8