Abstract
This study investigates the potential of different stages of the bioethanol production process (pretreatment, hydrolysis, and distillation) for bioethanol and biomethane production, and studies the critical steps for the liquid and the solid fractions to be separated and discarded to improve the efficiency of the production chain. For this, Napier grass (a fast-growing grass) from Effurun town of Delta State in Nigeria was used and the novel pretreatment method, nitrogen explosive decompression (NED), was applied at different temperatures. The results show that the lowest glucose (13.7 g/L) and ethanol titers (8.4 g/L) were gained at 150 °C. The highest glucose recovery (31.3 g/L) was obtained at 200 °C and the maximum ethanol production (10.3 g/L) at 170 °C. Methane yields are higher in samples pretreated at lower temperatures. The maximum methane yields were reported in samples from the solid fraction of post-pretreatment (pretreated at 150 °C, 1.13 mol CH4/100 g) and solid fraction of the post-hydrolysis stage (pretreated at 150 °C, 1.00 mol CH4/100 g). The lowest biomethane production was noted in samples from the liquid fraction of post-pretreatment broth (between 0.14 mol CH4/100 g and 0.24 mol CH4/100 g). From the process point of view, samples from liquid fraction of post-pretreatment broth should be separated and discarded from the bioethanol production process, since they do not add value to the production chain. The results suggest that bioethanol and biomethane concentrations are influenced by the pretreatment temperature. Napier grass has potential for bioethanol and further biomethane production and it can be used as an alternative source of energy for the transportation sector in Nigeria and other countries rich in grasses and provide energy security to their population.
1. Introduction
The worldwide economic advancements and population growth have been contributing to the increased demand for the electricity generation capacity. About 82% of the gross inland energy consumption in the world still derives from petroleum (32%), coal (28%), and natural gas (22%) [1]. The same trend is evident in different continents and countries around the world, including Nigeria which is one of the major economies in Sub-Saharan Africa and the largest oil producer in Africa. Its total primary energy consumption comes from traditional solid biomass and waste (80%) [2]. The fossil fuels utilised in Nigeria are mainly being consumed in the transportation sector (100% oil), productive (17% gas and 16% oil), and residential uses (3% oil). Nigerian power generation comes mainly from gas (62%), oil (33%), and hydro (5%) [3]. Therefore, there is a need for affordable alternative sources of energy that will decrease the share of fossil fuels utilised in the transportation sector and productive uses, reduce environmental concerns caused by the extensive utilization of these resources (e.g., climate change and global warming), increase energy security, and improve the access of the population to electricity. Renewable energy sources from lignocellulosic biomass have been reported as promising solutions to these problems [4]. Nowadays, biomass itself is responsible for 10% primary energy consumption worldwide [5] and it can be used as a promising feedstock for biofuel production. The sustainability of wastes and by-products as a biofuel for the transportation sector in a circular economy has been studied in the literature, in order to make the biogas–biomethane chain more sustainable [6,7,8]. These studies show the positive impact of biofuels in the transportation section in Europe. However, further research needs to be done in order to apply circular economy models to emerging economies.
Sub-Saharan Africa has great potential to develop renewable energy sources, such as wind, biomass, solar, and hydro. Just in Nigeria, the biomass potential is about 144 million tonnes per year and the potential of its lignocellulosic agricultural waste varies between 0.4 and 2.3 t/ha, as reported in previous publications [9]. However, the utilisation of biomass resources for electricity, biofuel, or biogas generation has not been extensively utilised or studied in most African countries [9,10,11]. From the different lignocellulosic materials currently available in Nigeria, Napier grass has been reported to be a particularly attractive feedstock for production of biofuels and bio-based products mainly due to its high cellulose content (34.2–40%), high yields per unit area, tolerance to drought, and a good water use efficiency (ratio of water used by the crop to water lost by evapotranspiration) [12,13,14,15,16,17].
Napier grass is a perennial C4 plant endemic to Sub-Saharan Africa with a high heating value biomass (16.58 MJ/kg) [18]. This crop is mainly used to feed cattle, but it can also be used for grazing, silage, or hay production or fish food [15]. In moderate climates, it can be harvested up to four times per year [19,20]. However, in most of the cases, Napier grass is a neglected crop that exists in the wild and that does not need to be cultivated [21,22], making it a particularly attractive feedstock for biogas and bioethanol production. Sawasdee and Pisutpaisal [23] studied the potential of Napier grass for biogas production. At 5% total solids, the authors obtained the highest kinetics rate for biogas production and concluded that this feedstock can be grown for this purpose. Narinthorn et al. [13] also investigated the biomethane potential of Napier grass. For this, the authors applied combined alkaline and biological pretreatment methods as a strategy to enhance biomethane yields from Napier grass. The results reveal that alkaline pretreatment method increased the anaerobic digestibility from 49% (untreated grass) to 77% and improved the biomethane yields by about 34%. Janejadkarn and Chavalparit [24] quantified biogas production from Napier grass. The results indicated that with a 2% volatile solids content and an organic load rate of 0.57 kg VS/m3, it is possible to achieve the maximum biogas yield (0.529 m3/kg VS). Under the same conditions, the methane production was 0.242 m3/kg VS added. All this suggests that Napier grass can be successfully converted into biogas by means of anaerobic digestion.
Liu et al. [25] investigated the potential of Napier grass for bioethanol production by using dilute-alkali and dilute-acid pretreatment methods. The results show that, for a feeding concentration of 10 g/L, the theoretical conversion rate of this feedstock is about 12.6%, and for a feeding concentration of 15 g/L its conversion rate increased to 23%. The authors concluded that agricultural waste had potential for bioethanol production. Wongwatanapaiboon et al. [26] analysed the potential of Napier grass as feedstock for lignocellulosic bioethanol production by using alkaline peroxide as a pretreatment method. The ethanol yields from Napier grass produced by simultaneous saccharification and cofermentation (SSCF) are 1171.69 L/ha/year, indicating that Napier grass has potential for cellulosic ethanol production.
Although bioethanol production from lignocellulosic materials has been widely studied, its production still has environmental, economic, and energetic constraints. From the environmental perspective, the sidestream generated after the distillation stage has a high pollutant potential and the best handling options still need to be studied. Economically, the energy costs required in the pretreatment stage are still high, making biofuel production less competitive compared to fossil fuels. Energetically, ethanol from biomass has a low-energy return on energy invested (ERoEI) when compared to coal, oil, and gas. Therefore, solutions to add value to the bioethanol production chain to make its production more competitive are needed. Having this in mind, anaerobic digestion (AD) has been proposed as a handling option for waste recovery from biodegradable waste and bioethanol sidestreams [4,8,27].
As the Nigerian biofuel sector is in a developing stage, this paper aims at evaluating the potential of Nigerian Napier grass for bioethanol and biogas production and at investigating its reliability as an alternative source of energy for the transportation sector in Nigeria and other African countries with high availability of this grass. For this, samples taken from different stages of bioethanol production (pretreatment, hydrolysis, and distillation) and bioethanol sidestream were used. These samples went through a separation process (solid and liquid fractions) and different production pathways in order to enhance bioenergy yields, improve the efficiency of the production chain, decrease the energy and water requirements, and reduce the sidestream volume generated at the end of process.
2. Materials and Methods
2.1. Bioethanol Production
2.1.1. Biomass
The Penisetum purpurum (Napier grass) grew in the wild and was harvested near Effurun town of Delta State in Nigeria. It was harvested in the Harmattan period in early January of 2019 and allowed to dry naturally in the sun. After drying, the biomass was shipped to Estonia where all the experiments were carried out. The samples were milled and sieved to the size of 3 mm or smaller in the Cutting Mill SM 100 Comfort (from Retsch GmbH).
2.1.2. Pretreatment
The Napier grass was pretreated with the nitrogen explosive decompression (NED) method. For pretreatment, 100 g of raw material were added into the 2 L non-stirred pressure vessel and soaked in 800 g of distilled water. The vessel was closed, and the samples were heated up from room temperature (23 °C) up to 150 °C, 170 °C, 190 °C, or 200 °C, under constant pressure (30 bar), for the retention time of one minute. Once the desired temperature was reached, the reactor was cooled down to approximately 80 °C and the pressure was released in an explosive manner using the pressure release valve. Figure 1 illustrates the pretreatment system utilised in these experiments. After the pretreatment process, the samples were cooled down to 50 °C for the following enzymatic hydrolysis.
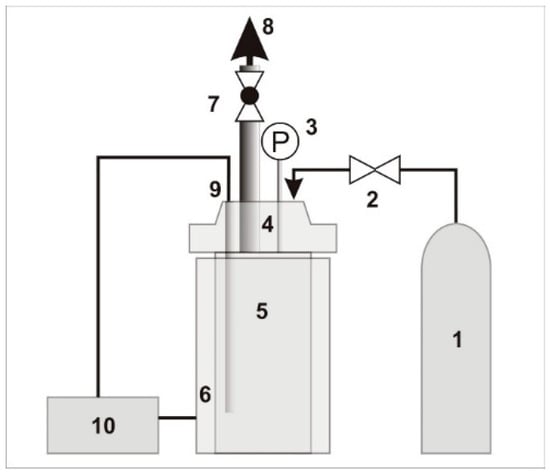
Figure 1.
Schematic diagram of the 2 L pressure vessel system (series 4600) for NED pretreatment: 1—nitrogen tank; 2—pressure control valve; 3—manometer; 4—modified pressure vessel cap; 5—Parr instruments pressure vessel; 6—ceramic contact heater; 7—pressure release valve; 8—ventilation system; 9—thermocouple; 10—temperature controller unit [28].
2.1.3. Hydrolysis
The material obtained from the pretreatment process was added into a 1000 mL shake flask for enzymatic hydrolysis. For this, 30 FPU g/cellulose of the cellulase complex Accelerase 1500 (DuPont de Nemours) was added into the suspension, and the flask was filled up with distilled water to 1000 mL (working volume). The process was carried out in an orbital shaker (IKA®-Werke GmbH & Co. KG, Staufen im Breisgau, Germany) (KS 4000 I control) during a 24 h period, at temperature of 50 °C and rotation speed of 250 rpm.
2.1.4. Fermentation
Glucose in the hydrolysate was converted into ethanol in the following fermentation step. The fermentation process was performed in glass bottles with a working volume of 1000 mL, using 2.5 g of the commercial yeast Saccharomyces cerevisiae (Turbo yeast T3). After adding the yeast, the glass bottles were closed with an airlock and the fermentation process was carried through for seven days, at room temperature.
2.1.5. Distillation
After the fermentation, the samples went through a distillation process at 175 mbar using a rotating evaporation system designed for ethanol separation, Buchi R-210 Rotavapor System from BÜCHI Labortechnik (Flavil, Switzerland). The material obtained after the distillation process (bioethanol production sidestream) was analysed in terms of its potential for biomethane production in the biomethane potential assay (BMP).
2.2. Biomethane Potential (BMP)
Samples from the solid and liquid fractions of different stages of bioethanol production process (pretreatment, hydrolysis, and distillation) were used as a feedstock. Figure 2 illustrates the different production pathways utilised in this study. The BMP was measured in untreated Napier grass (pathway 1), samples from the solid fraction of post-pretreatment broth (pathway 2) and post-hydrolysis broth (pathway 4), and samples from the liquid fraction of post-pretreatment broth (pathway 3), post-hydrolysis broth (pathway 5) and post-distillation broth (pathway 6).
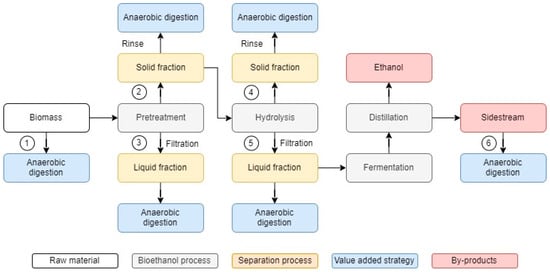
Figure 2.
Different production pathways utilised in this study to evaluate the potential of Pennisetum purpureum for bioethanol and biogas production by means of solid–liquid separation. 1—untreated Napier grass; 2—samples from the solid fraction of post-pretreatment broth; 3—samples from the liquid fraction of post-pretreatment broth; 4—samples from the solid fraction of post-hydrolysis broth; 5—samples from the liquid fraction of post-hydrolysis broth; 6—samples from post-distillation broth.
The BMP assay utilised in these experiments is based on a modified version of the methods reported by Owen et al. [29] and Angelidaki et al. [30]. The inoculum sludge utilised in this study was obtained from the local wastewater treatment plant (Tartu, Estonia). Prior to use, the inoculum was stabilized for four days in an incubator at 36 °C, so the residual organic matter would be consumed, and the dissolved gases would be removed by a process of degasification. The assays were performed in 575 mL glass bottles, with a working volume of 200 mL, headspace volume of 375 mL and VS substrate/VS inoculum ratio of 0.25 (based on the volatile solids content that characterizes the quantity of organic material available in the solid). Before sealing the bottles, nitrogen gas was purged into the headspace of the flasks for approximately three minutes to ensure anaerobic conditions. The bottles were further sealed with rubber stoppers and aluminium caps, mixed, and incubated for 42 days, under mesophilic conditions (37 °C ± 1 °C) until the methane production was less than 1% of the total amount produced. The bottles were mixed daily by shaking. The experiments were performed in triplicates and a blank test with inoculum sludge only was also prepared in order to determine the methane production from the inoculum sludge itself, which was later utilised in the calculations of methane gas produced.
The biogas production was evaluated by measuring the increase of the total headspace pressure in the test flasks before and after the gas chromatograph (GC) analysis with a pressure meter WAL BMP-Testsystem (from WAL Mess-und Regelsysteme GmbH, Germany).
The pH of all the samples was measured at the end of the experiments with a SevenMulti™ S47-dual pH/conductivity meter to ensure that the anaerobic digestion was performed under optimum conditions (pH of 6.8–7.2) from the beginning until the end of the process [31]. The biomethane results are reported in moles of methane per 100 g of raw material using standard conditions to understand the amount of methane that can be obtained from the original raw material, and in L CH4/kg VS.
2.3. Analytical Methods
The composition of the samples in terms of cellulose, hemicellulose, and lignin (fibre analysis) was determined using an ANKOM 2000 analyzer (ANKOM Technology, Macedon, NY, USA). The percentage of moisture in the samples was analysed in the Kern MLS-50-3D moisture analyser from Kern & Sohn GmbH.
The active volume of substrate and inoculum was determined from the analysis of the total solids (TS) and volatile solids (VS) content, which were determined according to the method 1684 from the U.S. Environmental Protection Agency (EPA). The methane content in the biogas was measured chromatographically using the GC (CP-4900 Micro-GC, Varian Inc., Palo Alto, CA, USA). The gas chromatograph was equipped with a thermal conductivity detector, a Molsieve 5A Backflush heated column (20 m × 0.53 mm) and a PoraPLOT U heated column (10 m × 0.53 mm). Argon was used as a carrier gas in column 1, and the operational conditions of this column were as follows: injection temperature 110 °C, column temperature 120 °C, and column pressure 50 Psi. In column 2, the carrier gas was helium and the injection temperature, column temperature, and column pressure were set to 110 °C, 150 °C, and 22 Psi, respectively.
The samples of solid and liquid fractions investigated in this study were obtained from different stages of the bioethanol production process (pretreatment, hydrolysis, and distillation) with a separation process using the pathway illustrated in Figure 2. For this, post-pretreatment broth and post-hydrolysis broth were collected and centrifuged using Thermo Scientific Heraeus Megafuge at a rotational speed of 10,000 rpm for 20 min until the solid and liquid fractions were fully separated. To ensure a full separation of the supernatant (liquid fraction) and the retentate (solid fraction), the samples were separated using vacuum filtration. After that, samples from the solid fraction were rinsed with distilled water to remove residual solubles and dried at 40 °C to a moisture content of 4.5% (or less). Both fractions were analysed for BMP.
Glucose, xylose, galactose, arabinose, mannose, glycerol, acetic acid, and ethanol were quantified with a high pressure liquid chromatography [32] using fractions after hydrolysis and fermentation steps.
2.4. Calculations
The quantity of methane gas (initial) produced in the test flask (mol CH4) is given by Equation (1):
where PI (Pa) is the total pressure at the headspace determined prior to the GC analysis, VHS (m3) is the volume of the headspace of the bottle, MF is the methane fraction determined by the GC in the current period of time, R is the ideal gas constant (8314 Jmol−1 K−1), and T is the temperature in the incubator (°C).
The quantity of methane gas (final) in the headspace of the test flask (mol CH4) is determined by Equation (2):
where PF (Pa) is the total pressure at the headspace determined following the GC analysis.
The cumulative methane produced in the current period of time (mol CH4) is defined by Equation (3):
where (mol CH4) is the quantity of methane in the headspace of the flask (initial) in the current period of time, (mol CH4) is the quantity methane in the headspace of the test bottle (final) in the prior period of time, and (mol CH4) is the quantity of cumulative methane gas produced in the prior period of time.
The results of methane gas produced were modelled in the statistics software GraphPad Prism 5.0 using a nonlinear regression model that was further fitted in an exponential first-order association model (Equation (4) [19,20]:
where B is the cumulative methane produced (mol CH4/100 g) at time interval (t), Bmax is the maximum methane yield (mol CH4/100 g), k is the kinetics rate constant (d−1).
2.5. Statistics
The statistical analysis was performed with the software GraphPad Prism 5. The Shapiro-Wilk’s normality test was utilised to determine the normal distribution of the variables. The Kruskal–Wallis test and the post hoc test Dunn’s multiple comparison test were used to investigate the differences between the variables. The results are represented with the respective error bars and intervals that denote one standard deviation. The results were considered significantly different when the p-value was inferior to p < 0.05.
2.6. Napier Grass Availability, Production, and Growth
The estimated biomass yields (of all the feedstocks with exception of Napier grass) were obtained from FAO (Food and Agriculture Organisation of UN) bioenergy and food security rapid appraisal tool (Excel-based tools) and represent a ten-years average of annual production at country level [33]. The different Napier grass yields were obtained from the literature [34,35,36].
3. Results
3.1. Napier Grass Availability, Production and Growth
Although Nigeria has been reported as an emerging economy for biofuel production [37], a study by Rocha-Meneses et al. [38] shows that the country is only 19th out of 27 in the equatorial Africa with more potential available for bioenergy production. The study reported the utilization of agricultural waste as barley, wheat, millet, oat, rice, rye, sorghum, and maize for bioenergy production. Besides agricultural residues, Nigeria has a large quantity of neglected feedstocks that can be further utilised for bioenergy production. Napier grass is one of these substrates.
Napier grass is a perennial crop native to Africa with low input requirements (e.g., low nutrient, fertilizer, and water requirements) and fast-growing characteristics. Its heating value is relatively high, varying between 16.21 MJ/kg (leaves) and 18.12 MJ/kg (stems). The heating value of the full plant is about 16.58 MJ/kg [39]. In addition, Napier grass has a great soil carbon sequestration potential, it can grow in marginal lands, but it is largely available in the wild, decreasing the competition with arable lands and therefore reducing the food versus fuel competition [40]. These unique characteristics make Napier grass one of the most prospective renewable energy sources for biofuel production in this region [36]. Under suitable conditions, Napier grass can grow up to 2–4.5 m tall and has a production of 40–60 t/DM/ha. In temperate climates, it can be harvested up to four times per year. Napier grass can be harvested as soon as three to four months after planting and it can continue in periods of six to eight weeks for up to five years [35,36]. From unfertilized stands, the dry matter yields of Napier grass are between 2 and 10 t/ha. Its dry matter production varies between 4.6 and 20.5 t/ha/year in Ethiopia, 12.1 and 19 t/ha/year in Kenya and 90 t/ha/year in Zimbawe [34].
Figure 3 and Figure 4 represent the distribution of Napier grass in the different countries of Sub-Saharan Africa, and the land suitability for Napier grass production in Nigeria, respectively. As it can be seen from the figures, the majority of the Nigerian territory is highly suitable for Napier grass production. Particularly, the South East zone (SE) and the North central (NC) have the highest land suitability in the country. In the south of Nigeria, South West (SW) is the zone with more potential for Napier grass cultivation. Regarding the productivity of this grass in Nigeria, research has shown that the NC zone is the most productive zone of the country, followed by the North East (NE), and North West (NW) [41]. In terms of bioethanol production, Chukwu (2018) [41] predicted that the NC zone has the highest potential for cellulosic bioethanol production, followed by the NE zone.
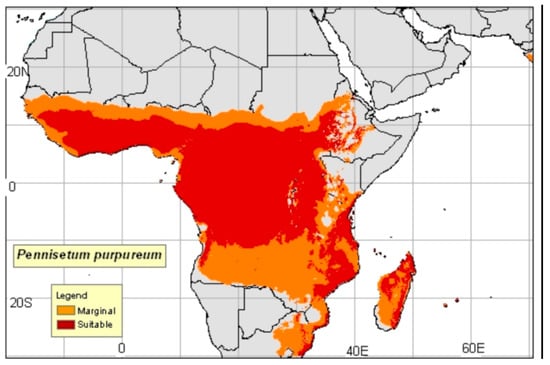
Figure 3.
Napier grass distribution in Sub-Saharan Africa (inclusive Nigeria) [42].
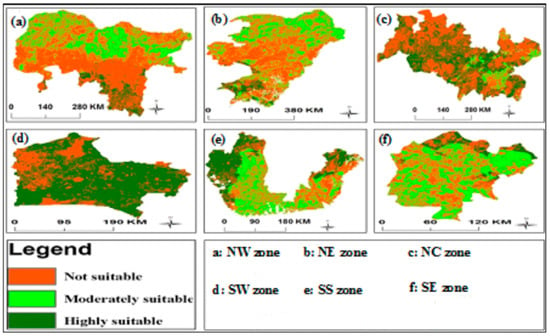
Figure 4.
Land suitability for Napier grass production in Nigeria (by geopolitical zone) [41].
Table 1 represents the energy output from Napier grass at different production rates (2 t/ha, 10 t/ha, 20 t/ha, 30 t/ha, 40 t/ha, and 60 t/ha) in comparison with other feedstocks currently available in Nigeria. The results show that even at low production yield (2 t/ha), Napier grass has higher energy yields than some well-known crops such as maize, rice, groundnut, wheat, coffee, sorghum, soybean, and millet. At high production yields, Napier grass has the highest energy yields, followed by sugarcane (bagasse and leaves), coconut (shells and husk), and oil palm (straw/pods). These results show that independent of the production yields, Napier grass is among the top 10 crops in Nigeria with higher energy yields, indicating the potential of this feedstock for further bioenergy production.

Table 1.
Estimated energy yield from Napier grass and different agricultural residues available in Nigeria.
3.2. Chemical Composition
The structural composition of the Napier grass is presented in Table 2. The Napier grass contains 35.69% of cellulose, 26.9% of hemicellulose, 5.2% of lignin, and 9.6% of ash. The proportion of cellulose is relatively low, being 8.5% to 17% lower than the values that were described in the literature, while the hemicellulose content is 25% to 35% higher. The percentage of lignin is particularly low (81% lower) in comparison with the values reported in the available bibliography [43,48]. The ash content is 79% lower than the values reported in the literature [43,48]. These differences in the proportions of cellulose, hemicellulose, and lignin may be due to the growing, harvesting, and drying conditions of the samples. The Napier grass used in this study grew in the wild, it was harvested in early January (possibly the plant was not fully matured) and dried naturally in the sun, while in the studies of Mohammed et al. [43] and Nascimento and Rezende [48] the growing, harvesting, and drying conditions were closely monitored, ensuring the maximum growth and the optimal composition of the substrate. Although the cellulose content was lower than the values reported in the literature, the lignin percentage is also very low, making the delignification process easier. This means that less energy input should be required to break the plant cell wall, and thus making the cellulose easily accessible, degradable, and convertible into sugars. Research has shown that high lignin content leads to low digestibility of the biomass. Therefore, low lignin content is a desirable condition for bioethanol and biomethane production [4,49].

Table 2.
Composition of untreated Napier grass.
Table 3 represents the total solids (TS) and volatile solids (VS) content for untreated Napier grass, samples from the solid and liquid fraction from different steps of bioethanol production chain, pretreated with NED at different temperatures. The TS content of untreated material was 956 g/kg. For samples of the solid fraction the TS content varied between 966 g/kg and 987 g/kg, and for samples from the liquid fraction between 13.4 g/kg and 37.4 g/kg. Statistically significant differences were found between TS content of samples from the solid and liquid fractions pretreated at different temperatures. These results show that the solid fraction had higher TS content than liquid fraction. High TS content is particularly important since it indicates there is more substrate available for the anaerobic digestion process, leading to higher methane and biogas yields [50].

Table 3.
Total solids and volatile solids content of untreated material, samples from different fractions and stages pretreated at 150 °C, 170 °C, 190 °C, and 200 °C.
The VS content of untreated Napier grass was 889 g/kg. For samples of the solid fraction the TS content varied between 929 g/kg and 975 g/kg, and for samples from the liquid fraction between 994 g/kg and 1000 g/kg. Statistically significant differences were found between VS content of samples from the solid and liquid fractions pretreated at different temperatures. The VS content is an indicator of the biodegradability of the samples and represents the portion of substrate that can be converted into biogas and biomethane. Research has shown that high VS content is a desirable condition in the anaerobic digestion process since it leads to higher biogas and biomethane yields [51,52].
3.3. Sugar Composition from Different Stages of the Liquid Fraction and Ethanol Production from Hydrolysates
Monosaccharide concentrations present in all the post-treatment broths were low (>1.0 g/L, Table 4) indicating that sugars were in the form of oligomers non-detected by the methodology employed. Higher temperatures during pretreatment resulted in higher concentrations of glucose after hydrolysis, reaching up to 31.56 g/L when 200 °C was used (Table 4). Regarding the fermentation step, at least 98.9% of all glucose was consumed (as glucose was detected, but the concentration was below the limit of quantification, 0.25 g/L) in all hydrolysates as substrates. The highest ethanol titer was 10.3 g/L (Table 5), 90% of theoretical yield (0.51 g ethanol/g glucose) from the fermentation using the hydrolysate from the pretreatment at 170 °C. The post fermentation broth from the pretreatment at 150 °C contained 8.45 g/L of ethanol, indicating that the cellulases continued the hydrolysis process during the fermentation process as the yield was 28% over the theoretical one (0.66 g ethanol/g glucose). Using temperatures over 170 °C for the pretreatment resulted in decrease in ethanol yields, 0.33 g ethanol/g glucose (190 °C) and 0.18 g ethanol/g glucose (200 °C), probably due to the presence of inhibitors such as acetic acid and furfurals coming from the degradation of hemicellulose.

Table 4.
Concentrations of sugars (g/L) for samples from the liquid fraction post-pretreatment and post-hydrolysis broth pretreated at 150 °C, 170 °C, 190 °C, and 200 °C.

Table 5.
Concentration of glucose, xylose, glycerol, acetic acid, and ethanol (g/L) for samples from the liquid fraction of post-fermentation broth pretreated at 150 °C, 170 °C, 190 °C, and 200 °C.
3.4. Methane Recovery
Figure 5, Figure 6, Figure 7, Figure 8, Figure 9 and Figure 10 represent the maximum methane yield (Bmax) of untreated Napier grass and samples from different fractions of bioethanol production process pretreated at 150 °C, 170 °C, 190 °C, and 200 °C. The methane yield of untreated material was 1.18 mol CH4/100 g. For samples from the solid fraction of post-pretreatment broth, the methane yields were highest at 150 °C (1.13 mol CH4/100 g), followed by samples pretreated at 170 °C (1.04 mol CH4/100 g), 190 °C (1.00 mol CH4/100 g), and 200 °C (0.90 mol CH4/100 g). A similar trend was seen in samples from the solid fraction of post-hydrolysis broth. The samples pretreated at 150 °C had the highest methane yields (1.00 mol CH4/100 g) while samples pretreated at 200 °C had the lowest methane yields (0.70 mol CH4/100 g). For samples from the liquid fraction of post-pretreatment broth, the methane yields were highest for samples pretreated at 190 °C (0.27 mol CH4/100 g), followed by samples pretreated at 170 °C (0.24 mol CH4/100 g), 150 °C (0.17 mol CH4/100 g), and 200 °C (0.14 mol CH4/100 g). The methane yields for samples from the liquid fraction of post-hydrolysis broth varied between 0.41 CH4/100 g (150 °C) and 0.57 CH4/100 g (200 °C), and for samples from the liquid fraction of post-distillation broth between 0.25 CH4/100 g (200 °C) and 0.41 CH4/100 g (190 °C).
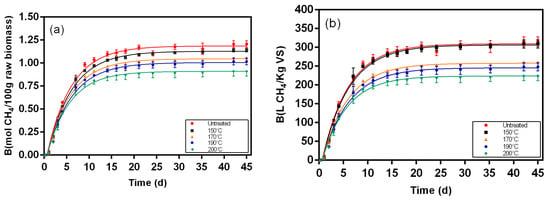
Figure 5.
Biochemical methane results and respective fitting curves for samples from the solid fraction of post-pretreatment broth pretreated at 150 °C, 170 °C, 190 °C, and 200 °C. (a) results in mol CH4/100 g raw biomass; (b) results in L CH4/Kg VS.
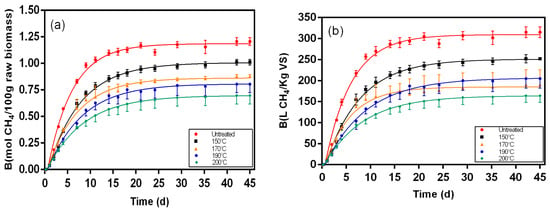
Figure 6.
Biochemical methane results and respective fitting curves for samples from solid fraction of post-hydrolysis broth pretreated at 150 °C, 170 °C, 190 °C, and 200 °C. (a) results in mol CH4/100 g raw biomass; (b) results in L CH4/Kg VS.
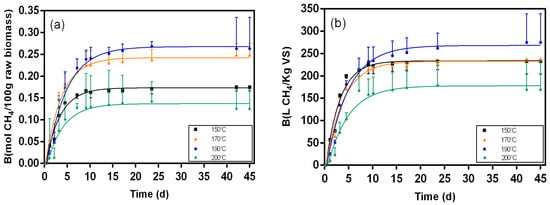
Figure 7.
Biochemical methane results and respective fitting curves for samples from the liquid fraction of post-pretreatment broth pretreated at different temperatures (150 °C, 170 °C, 190 °C, and 200 °C). (a) results in mol CH4/100 g raw biomass; (b) results in L CH4/Kg VS.
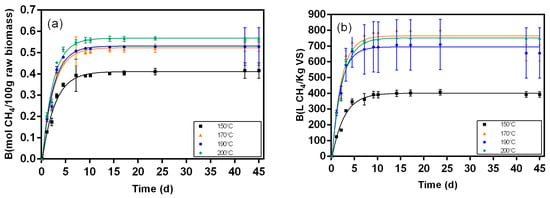
Figure 8.
Biochemical methane results and respective fitting curves for samples from the liquid fraction post-hydrolysis broth pretreated at different temperatures (150 °C, 170 °C, 190 °C, and 200 °C). (a) results in mol CH4/100 g raw biomass; (b) results in L CH4/Kg VS.
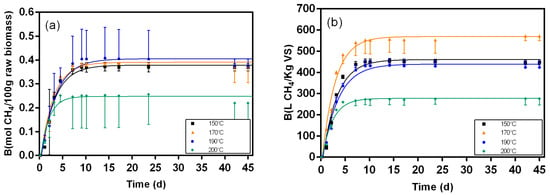
Figure 9.
Biochemical methane results and respective fitting curves for samples from the liquid fraction post-distillation broth pretreated at different temperatures (150 °C, 170 °C, 190 °C, and 200 °C). (a) results in mol CH4/100 g raw biomass; (b) results in L CH4/Kg VS.
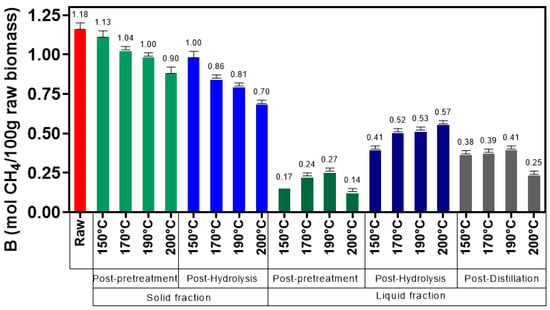
Figure 10.
Maximum methane yield (Bmax) of the fitting curves of samples from the solid and liquid fractions.
Statistically significant differences were found between methane yields of samples from the solid and liquid fractions and between samples pretreated with different temperatures (Table 6).

Table 6.
Statistically significant results between the variables investigated in the methane recovery analysis.
As it can be seen from Figure 10 (for samples from the solid fraction), higher pretreatment temperatures tend to decrease the biomethane yields. This may be because higher pretreatment temperatures can reduce the amount of VS available in the solid material, thus leading to lower biomethane yields [53]. Also, research has shown that higher temperatures can produce inhibitory components (such as furan derivatives) that can inhibit the microbial process and lead to lower biomethane yields [54,55].
Overall, samples from the solid and liquid fractions have distinct biomethane yields, mainly due to the composition of the biomaterial. Samples from the solid fraction have higher methane yields than samples from the liquid fraction mainly due to its composition in terms of cellulose and lignin. Samples from the liquid fraction have mainly hemicellulose in its composition, therefore the reaction speed will be faster (as there is no lignin) than in samples from the solid fraction, but the sugar release will be lower (since the amount of cellulose is negligible). From the process point of view, the performance of the solid and liquid fractions in different stages of the bioethanol production chain is also distinct. Samples from the liquid fraction from the post-pretreatment broth have the lowest methane yields, followed by samples from the post-distillation broth and post-hydrolysis broth. Due to its low potential, samples from the liquid fraction from the post-pretreatment broth that contains inhibitory component of the anaerobic digestion process and reduces the efficiency of the process, should be separated and discarded from the bioethanol production process. Sidestream from bioethanol production brings added costs to the production chain since it has a high BOD and COD and needs to be properly handled [4]. When compared with samples from the liquid fraction of post-pretreatment broth, samples from the liquid fraction of post-hydrolysis broth have higher biomethane yields. This is due to the glucose produced during the hydrolysis stage. Biomethane yields in samples from the liquid fraction of post-distillation broth tend to decrease because most of the glucose was fermented during the process or due to the presence of inhibitory compounds such as lignin degradation products generated after the hydrolysis stage [56]. However, this stage still presents some potential for biomethane production mainly due to cellulose, hemicellulose, enzymes, and yeast left in the broth at the end of the process and that creates additional sources for biogas production.
The biomethane yields obtained in this study were improved when compared with the methane yields from samples that have not been through the optimization process [57]. However, further research needs to be done and mass balances should be performed in order to quantify gains from the optimized process.
The results suggest that samples from the liquid fraction still have potential for biomethane production, it is of interest to add further steps to the pathway proposed in this study and investigate new strategies to improve the digestibility of the samples by the anaerobic microorganisms.
3.5. Kinetic Evaluation of Biomass Bioconversion and Digestion Time
Figure 11 represents the kinetic rate constant (k) and the goodness-of-fit (R2) for samples from different fractions of bioethanol production process pretreated at 150 °C, 170 °C, 190 °C, and 200 °C. As it can be seen from the figure, the kinetic rate of untreated material was 0.185 (d−1), while for samples from the solid fraction of post-pretreatment broth it varied between 0.181 (d−1) (samples pretreated at 150 °C) and 0.196 (d−1) (samples pretreated at 200 °C). For samples from the solid fraction of post-hydrolysis, the kinetic rate constant of the bioconversion was higher for samples pretreated at 170 °C (0.150 d−1), followed by samples pretreated at 150 °C (0.138 d−1), 190 °C (0.130 d−1), and 200 °C (0.123 d−1). Regarding samples from the liquid fraction of post-pretreatment broth, the kinetic rate constant varied between 0.224 d−1 (samples pretreated at 190 °C) and 0.314 d−1 (samples pretreated at 150 °C). For samples from the liquid fraction of post-hydrolysis broth, the kinetic rate constant was higher for samples pretreated at 200 °C (0.444 d−1), followed by samples pretreated at 190 °C (0.437 d−1), 170 °C (0.422 d−1), and 150 °C (0.380 d−1). Concerning samples from the liquid fraction of post-distillation broth the kinetic rate constant was lower for samples pretreated at 190 °C (0.302 d−1), and higher for samples pretreated at 200 °C (0.532 d−1). The goodness of the fitting curves varied between 0.9517 and 0.9984.
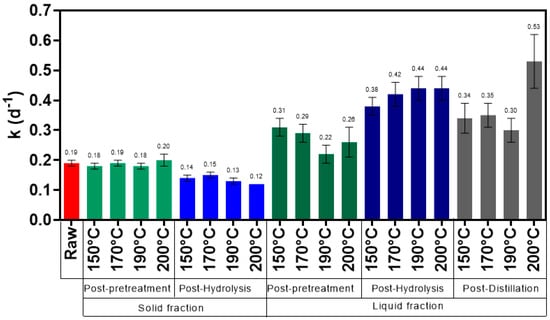
Figure 11.
Kinetic constant and correlation coefficient of the fitting curves of samples from solid and liquid fraction.
As it can be seen from Figure 11, the kinetic rate is slower in samples from the solid fraction, and faster in samples from the liquid fraction. The digestion time (85% Bmax and 95% Bmax) of the biomaterial is represented in Table 7. The time needed for untreated Napier grass to achieve 85% Bmax and 95% Bmax is ~11 days (1.00 CH4/100 g) and ~17 days (1.12 CH4/100 g), respectively. Samples from the solid fraction of post-pretreatment broth pretreated at 200 °C had the shortest digestion time. It achieved 85% Bmax 7 days, and 95% Bmax 5 days before samples from raw Napier grass. Samples from the solid fraction of post-pretreatment broth pretreated at 170 °C also achieved 85% Bmax and 95% Bmax before untreated samples (1 day). On the other hand, the digestion time (85% Bmax and 95% Bmax) of samples from the solid fraction of post-hydrolysis broth was 2.2 to 7.6 days longer than untreated Napier grass. Considering the different temperatures, it can be seen that samples pretreated at 170 °C had the shortest digestion time (t = 13.1 days), followed by samples pretreated at 150 °C (t = 14.4 days), 190 °C (t = 15.1 days) and 200 °C (t = 15.7 days). Samples from the liquid fraction of post-pretreatment broth reached 85% Bmax and 95% Bmax 1.9 to 7 days before untreated material. As it can be seen from Table 7, samples pretreated at 150 °C had the shortest digestion time (t = 6.3 days), followed by 170 °C (t = 6.9 days), 190 °C (t = 9.0 days), and 200 °C (t = 7.9 days). The opposite trend was noted in samples from the liquid fraction of the post-hydrolysis broth, where pretreated material at 200 °C had the shortest digestion time (t = 4.5 days), followed by samples pretreated at 190 °C (t = 4.6 days), 170 °C (t = 4.7 days), and 150 °C (t = 5.2 days). The samples from this stage had a digestion times 5.7 to 9.9 days shorter than that of untreated Napier grass. Finally, samples from the liquid fraction of post-distillation broth had digestion times 4.2 to 10.9 days shorter than those of the raw material. Samples pretreated at 200 °C had the shortest digestion time (t = 3.9 days), while samples pretreated at 190 °C had the longest digestion time (6.7 days).

Table 7.
Digestion time (85% Bmax and 95% Bmax) for samples from different fractions of bioethanol production process pretreated at 150 °C, 170 °C, 190 °C, and 200 °C.
These results show that when compared to samples from the solid fraction, samples from the liquid fraction had a better performance in terms of time needed to degrade the biomaterial. This is due to the composition of the samples (solid vs. liquid fractions). On the other hand, samples from the solid fraction had higher methane production. Samples that were pretreated at 200 °C had shorter digestion times. This may be due to the effect of the pretreatment method. High pretreatment temperatures will be more effective in disrupting the biomass, removing lignin, and making the cellulose more accessible for the hydrolysis [58]. When the cellulose is easily accessible, the microbial degradation starts faster, and the overall efficiency of the hydrolysis and fermentation processes is improved.
Production of energy in the form of biogas–methane can contribute to the reduction of greenhouse gas emissions and be utilised as a replacement for fossil fuels, especially in the transportation sector [8]. These green gases (biogas–biomethane) can help developed societies to achieve decarbonisation from fossil fuels, and support emerging societies to achieve their energetic independence.
4. Conclusions
This study investigated the effect of NED pretreatment method (physio-chemical pretreatment) on bioethanol and biomethane yields from Nigerian Napier grass (Pennisetum purpureum) by means of solid–liquid separation. For this, different pretreatment temperatures were applied (150 °C, 170 °C, 190 °C, and 200 °C) and samples from different stages (pretreatment, hydrolysis, and sidestream) and fractions (solid and liquid) of the bioethanol production process were used. The results show that the lowest glucose yields (13.7 g/L) and the lowest ethanol yields (8.4 g/L) were gained at 150 °C. Samples that were pretreated at 200 °C had the highest glucose titer (31.3 g/L), while samples that were pretreated at 170 °C had the highest bioethanol concentration (10.3 g/L). The kinetic rate constant of the anaerobic digestion process was higher in samples from the liquid fractions (between 0.22 d−1 and 0.53 d−1) and lower in samples from the solid fractions (between 0.12 d−1 and 0.20 d−1). The maximum methane yields were reported in samples from the solid fraction of post-pretreatment broth at 150 °C (1.13 mol CH4/100 g) and samples from the solid fraction of post-hydrolysis broth pretreated at 150 °C (1.00 mol CH4/100 g). The lowest methane yields were reported in samples from the liquid fraction of post-pretreatment broth at 200 °C (0.14 mol CH4/100 g). Nigerian Pennisetum purpureum is a promising feedstock for bioethanol and biomethane production. The bioethanol and biomethane productions are influenced by the pretreatment temperatures. From the different stages and fractions of the bioethanol production process, samples from the post-pretreatment stage (liquid fraction) have the lowest methane yields. From the process point of view, the results suggest that the liquid fraction after the pretreatment stage should be separated and discarded from the bioethanol production process, since it has inhibitory compounds in its composition and does not add value to the production chain. Further research needs to be done and additional strategies weighed in order to further optimise the mass flow and maximise the added value to the process. Further research needs to be done in order to apply circular economy models to emerging economies especially because environmentally friendly fuel sources are not on the agenda of developing economies. It is not reasonable to wait for emerging countries to fully develop and only then invest in their decarbonisation. There is an urge to accelerate the worldwide bioeconomy.
Author Contributions
Conceptualization, L.R.-M. and T.K.; methodology, L.R.-M., O.F.O. and N.B.; software, L.R.-M.; validation, L.R.-M.; formal analysis, L.R.-M. and N.B.; investigation, L.R.-M., O.F.O. and N.B.; resources, L.R.-M., O.F.O., N.B., K.O. and T.K.; data curation, L.R.-M. and N.B.; writing—original draft preparation, L.R.-M. and N.B.; writing—review and editing, L.R.-M., N.B., K.O. and T.K.; visualization, L.R.-M. and T.K.; supervision, K.O. and T.K.; project administration, T.K.; funding acquisition, T.K. All authors have read and agreed to the published version of the manuscript.
Funding
The authors gratefully acknowledge the financial support of the European Regional Development Fund via the Mobilitas Pluss (project MOBERA1) of the Estonian Research Council and base financed project of EULS PM180260 TIBT. NB would like to acknowledge the European Union’s Horizon 2020 research and innovation program under grant agreement No 668997.

Acknowledgments
We would like to acknowledge Vahur Rooni for determining the composition of the raw Napier grass (fiber analysis).
Conflicts of Interest
The authors declare no conflict of interest.
References
- OECD/IEA. Key World Energy Statistics; IEA Publishing: Paris, France, 2017; pp. 1–97. Available online: www.iea.org/t&c (accessed on 6 August 2019).
- U.S. Energy Information Administration. IEA Country Analysis Brief; IEA: Washington, DC, USA, 2016.
- OECD/IEA. Africa Energy Outlook: A Focus on Energy Prospects in Sub-Saharan Africa; IEA: Paris, France, 2014; Volume 242. [Google Scholar]
- Rocha-Meneses, L.; Raud, M.; Orupõld, K.; Kikas, T. Second-generation bioethanol production: A review of strategies for waste valorisation. Agron. Res. 2017, 15, 830–847. [Google Scholar]
- Roj-Rojewski, S.; Wysocka-Czubaszek, A.; Czubaszek, R.; Kamocki, A.; Banaszuk, P. Anaerobic digestion of wetland biomass from conservation management for biogas production. Biomass Bioenergy 2019, 122, 126–132. [Google Scholar] [CrossRef]
- Lazarevic, D.; Martin, M. Life cycle assessment calculative practices in the Swedish biofuel sector: Governing biofuel sustainability by standards and numbers. Bus. Strategy Environ. 2018, 27, 1558–1568. [Google Scholar] [CrossRef]
- Sassanelli, C.; Rosa, P.; Rocca, R.; Terzi, S. Circular economy performance assessment methods: A systematic literature review. J. Clean. Prod. 2019, 229, 440–453. [Google Scholar] [CrossRef]
- D’Adamo, I.; Falcone, P.M.; Ferella, F. A socio-economic analysis of biomethane in the transport sector: The case of Italy. Waste Manag. 2019, 95, 102–115. [Google Scholar] [CrossRef] [PubMed]
- Ben-Iwo, J.; Manovic, V.; Longhurst, P. Biomass resources and biofuels potential for the production of transportation fuels in Nigeria. Renew. Sustain. Energy Rev. 2016, 63, 172–192. [Google Scholar] [CrossRef]
- Da Silva, P.P.; Cerqueira, P.A.; Ogbe, W. Determinants of renewable energy growth in Sub-Saharan Africa: Evidence from panel ARDL. Energy 2018, 156, 45–54. [Google Scholar] [CrossRef]
- Kemausuor, F.; Adaramola, M.S.; Morken, J. A Review of Commercial Biogas Systems and Lessons for Africa. Energies 2018, 11, 2984. [Google Scholar] [CrossRef]
- Mohammed, I.Y.; Abakr, Y.A.; Mokaya, R. Biofuel and valuable products recovery from Napier grass pre-processing: Process design and economic analysis. J. Environ. Chem. Eng. 2019, 7, 102962. [Google Scholar] [CrossRef]
- Narinthorn, R.; Choorit, W.; Chisti, Y. Alkaline and fungal pretreatments for improving methane potential of Napier grass. Biomass Bioenergy 2019, 127, 105262. [Google Scholar] [CrossRef]
- Anderson, W.F.; Dien, B.S.; Masterson, S.D.; Mitchell, R.B. Development of Near-Infrared Reflectance Spectroscopy (NIRS) Calibrations for Traits Related to Ethanol Conversion from Genetically Variable Napier Grass (Pennisetum purpureum Schum.). BioEnergy Res. 2019, 12, 34–42. [Google Scholar] [CrossRef]
- Negawo, A.T.; Teshome, A.; Kumar, A.; Hanson, J.; Jones, C.S. Opportunities for Napier Grass (Pennisetum purpureum) Improvement Using Molecular Genetics. Agronomy 2017, 7, 28. [Google Scholar] [CrossRef]
- Meiramkulova, K.; Bayanov, A.; Ivanova, T.; Havrland, B.; Kára, J.; Hanzlíková, I. Effect of different compositions on anaerobic co-digestion of cattle manure and agro-industrial by-products. Agron. Res. 2018, 16, 176–187. [Google Scholar] [CrossRef]
- Tsai, M.-H.; Lee, W.-C.; Kuan, W.-C.; Sirisansaneeyakul, S.; Savarajara, A. Evaluation of different pretreatments of Napier grass for enzymatic saccharification and ethanol production. Energy Sci. Eng. 2018, 6, 683–692. [Google Scholar] [CrossRef]
- Suntivarakorn, R.; Treedet, W.; Singbua, P.; Teeramaetawat, N. Fast pyrolysis from Napier grass for pyrolysis oil production by using circulating Fluidized Bed Reactor: Improvement of pyrolysis system and production cost. Energy Rep. 2018, 4, 565–575. [Google Scholar] [CrossRef]
- Wang, Q.; Sun, J.; Zhang, C.; Xie, G.-J.; Zhou, X.; Qian, J.; Yang, G.; Zeng, G.; Liu, Y.; Wang, D. Polyhydroxyalkanoates in waste activated sludge enhances anaerobic methane production through improving biochemical methane potential instead of hydrolysis rate. Nature 2016, 6, 19713. [Google Scholar] [CrossRef]
- Zeng, S.; Yuan, X.; Shi, X.; Qiu, Y. Effect of inoculum/substrate ratio on methane yield and orthophosphate release from anaerobic digestion of Microcystis spp. J. Hazard. Mater. 2010, 178, 89–93. [Google Scholar] [CrossRef]
- Wanjala, B.W.; Obonyo, M.; Wachira, F.N.; Muchugi, A.; Mulaa, M.; Harvey, J.; Skilton, R.A.; Proud, J.; Hanson, J. Genetic diversity in Napier grass (Pennisetum purpureum) cultivars: Implications for breeding and conservation. AoB Plants 2013, 5, plt022. [Google Scholar] [CrossRef]
- Singh, B.P.; Singh, H.P.; Obeng, E. Elephantgrass. In Biofuel Crops: Production, Physiology and Genetics; Singh, B.P., Ed.; CABI: Wallingford, UK, 2013. [Google Scholar]
- Sawasdee, V.; Pisutpaisal, N. Feasibility of Biogas Production from Napier Grass. Energy Procedia 2014, 61, 1229–1233. [Google Scholar] [CrossRef]
- Janejadkarn, A.; Chavalparit, O. Biogas production from Napier grass (Pak Chong 1) (Pennisetum purpureum × Pennisetum americanum). In Proceedings of the 2013 2nd International Conference on Material Science and Engineering Technology, London, UK, 16–17 November 2013; Volume 856, pp. 327–332. [Google Scholar]
- Liu, Y.-K.; Chen, W.-C.; Huang, Y.-C.; Chang, Y.-K.; Chu, I.M.; Tsai, S.-L.; Wei, Y.-H. Production of bioethanol from Napier grass via simultaneous saccharification and co-fermentation in a modified bioreactor. J. Biosci. Bioeng. 2017, 124, 184–188. [Google Scholar] [CrossRef]
- Wongwatanapaiboon, J.; Kangvansaichol, K.; Burapatana, V.; Inochanon, R.; Winayanuwattikun, P.; Yongvanich, T.; Chulalaksananukul, W. The Potential of Cellulosic Ethanol Production from Grasses in Thailand. J. Biomed. Biotechnol. 2012, 2012, 1–10. [Google Scholar] [CrossRef] [PubMed]
- Ferella, F.; Cucchiella, F.; D’Adamo, I.; Gallucci, K. A techno-economic assessment of biogas upgrading in a developed market. J. Clean. Prod. 2019, 210, 945–957. [Google Scholar] [CrossRef]
- Raud, M.; Olt, J.; Kikas, T. N2 explosive decompression pretreatment of biomass for lignocellulosic ethanol production. Biomass Bioenergy 2016, 90, 1–6. [Google Scholar] [CrossRef]
- Owen, W.F.; Stuckey, D.C.; Healy, J.B.; Young, L.Y.; McCarty, P.L. Bioassay for monitoring biochemical methane potential and anaerobic toxicity. Water Res. 1979, 13, 485–492. [Google Scholar] [CrossRef]
- Angelidaki, I.; Alves, M.; Bolzonella, D.; Borzacconi, L.; Campos, J.L.; Guwy, A.J.; Kalyuzhnyi, S.; Jenicek, P.; van Lier, J.B. Defining the biomethane potential (BMP) of solid organic wastes and energy crops: A proposed protocol for batch assays. Water Sci. Technol. 2009, 59, 927–934. [Google Scholar] [CrossRef]
- Cioabla, A.E.; Ionel, I.; Dumitrel, G.-A.; Popescu, F. Comparative study on factors affecting anaerobic digestion of agricultural vegetal residues. Biotechnol. Biofuels 2012, 5, 39. [Google Scholar] [CrossRef]
- Rocha-Meneses, L.; Ferreira, J.A.; Bonturi, N.; Orupõld, K.; Kikas, T. Enhancing Bioenergy Yields from Sequential Bioethanol and Biomethane Production by Means of Solid–Liquid Separation of the Substrates. Energies 2019, 12, 3683. [Google Scholar] [CrossRef]
- FAO. Natural Resources—Biomass Potential Assessment: BEFS RA Tool. Available online: http://www.fao.org/energy/bioenergy/bioenergy-and-food-security/assessment/befs-ra/natural-resources/en/ (accessed on 29 September 2019).
- FAO. Food and Agriculture Organization of the UN. Pennisetum purpureum. Available online: http://ecocrop.fao.org/ecocrop/srv/en/home (accessed on 29 September 2019).
- Pereira, L.E.T.; Paiva, A.J.; Geremia, E.V.; da Silva, S.C. Regrowth patterns of elephant grass (Pennisetum purpureum Schum) subjected to strategies of intermittent stocking management. Grass Forage Sci. 2015, 70, 195–204. [Google Scholar] [CrossRef]
- Sawanon, S.; Sangsri, P.; Leungprasert, S.; Sinbuathong, N. Methane Production from Napier Grass by Co-digestion with Cow Dung. In Energy Solutions to Combat Global Warming; Zhang, X., Dincer, I., Eds.; Springer International Publishing: Cham, Switzerland, 2017; pp. 169–180. [Google Scholar] [CrossRef]
- Abila, N. Biofuels Adoption in Nigeria: Analysis of Sustainability and Policy Issues; University of Vaasa: Vaasa, Finland, 2014. [Google Scholar]
- Rocha-Meneses, L.; Bergamo, T.S.F.; Kikas, T. Potential of cereal-based agricultural residues available for bioenergy production. Data Brief 2019, 23, 103829. [Google Scholar] [CrossRef]
- Haegele, M.T.; Arjharn, W. The effects of cultivation methods and planting season on biomass yield of Napier grass (Pennisetum purpureum Schumach.) under rainfed conditions in the northeast region of Thailand. Field Crops Res. 2017, 214, 359–364. [Google Scholar] [CrossRef]
- Manouchehrinejad, M.; Yue, Y.; de Morais, R.A.L.; Souza, L.M.O.; Singh, H.; Mani, S. Densification of Thermally Treated Energy Cane and Napier Grass. BioEnergy Res. 2018, 11, 538–550. [Google Scholar] [CrossRef]
- Chukwu, M.A. A GIS Based Approach to Investigating the Potential of Herbaceous Bioenergy Feedstocks for Cellulosic Bioethanol Production in Nigeria; Newcastle University: Newcastle Upon Tyne, UK, 2018. [Google Scholar]
- Cook, B.G.; Pengelly, B.C.; Brown, S.D.; Donnelly, J.L.; Eagles, D.A.; Franco, M.A.; Schultze-Kraft, R. Tropical Forages: An Interactive Selection Tool. Web Tool; CSIRO: Canberra, Australia; DPI&F(Qld): Queensland, Australia; CIAT: Cali, Colombia; ILRI: Nairobi, Kenya, 2005. [Google Scholar]
- Mohammed, I.Y.; Abakr, Y.A.; Kazi, F.K.; Yusup, S.; Alshareef, I.; Chin, S.A. Comprehensive Characterization of Napier Grass as a Feedstock for Thermochemical Conversion. Energies 2015, 8, 3403–3417. [Google Scholar] [CrossRef]
- ECN. TNO Biomass & Energy Efficiency. Phyllis2, Database for Biomass and Waste: Sugarcane Bagasse. Available online: https://phyllis.nl/ (accessed on 29 September 2019).
- Sturm, A.; Müller, K.; Upasena, S. A Manual for the Preparers and Users of Eco-efficiency Indicators; United Nations Conference on Trade and Development: Geneva, Switzerland, 2004. [Google Scholar]
- Hamzah, N.; Tokimatsu, K.; Yoshikawa, K. Solid Fuel from Oil Palm Biomass Residues and Municipal Solid Waste by Hydrothermal Treatment for Electrical Power Generation in Malaysia: A Review. Sustainability 2019, 11, 1060. [Google Scholar] [CrossRef]
- Bappah, M.; Bradna, J.; Velebil, J.; Malatak, J. The potential of energy recovery from by–products of small agricultural farms in Nigeria. Agron. Res. 2019, 17. [Google Scholar] [CrossRef]
- Nascimento, S.A.; Rezende, C.A. Combined approaches to obtain cellulose nanocrystals, nanofibrils and fermentable sugars from elephant grass. Carbohydr. Polym. 2018, 180, 38–45. [Google Scholar] [CrossRef]
- Rocha-Meneses, L.; Ivanova, A.; Atouguia, G.; Ávila, I.; Raud, M.; Orupõld, K.; Kikas, T. The effect of flue gas explosive decompression pretreatment on methane recovery from bioethanol production waste. Ind. Crops Prod. 2019, 127, 66–72. [Google Scholar] [CrossRef]
- Yi, J.; Dong, B.; Jin, J.; Dai, X. Effect of increasing total solids contents on anaerobic digestion of food waste under mesophilic conditions: Performance and microbial characteristics analysis. PLoS ONE 2014, 9, e102548. [Google Scholar] [CrossRef]
- Agrawal, R.; Bhadana, B.; Mathur, A.S.; Kumar, R.; Gupta, R.P.; Satlewal, A. Improved Enzymatic Hydrolysis of Pilot Scale Pretreated Rice Straw at High Total Solids Loading. Energy Res. 2018, 6. [Google Scholar] [CrossRef]
- Luna-delRisco, M.; Normak, A.; Orupõld, K. Biochemical methane potential of different organic wastes and energy crops from Estonia. Agron. Res. 2011, 9, 331–342. [Google Scholar]
- Meegoda, J.N.; Li, B.; Patel, K.; Wang, L.B. A Review of the Processes, Parameters, and Optimization of Anaerobic Digestion. Int. J. Environ. Res. Public Health 2018, 15, 222. [Google Scholar] [CrossRef]
- Montgomery, L.F.R.; Bochmann, G. Pretreatment of Feedstock for Enhanced Biogas Production; Baxter, D., Ed.; IEA Bioenergy Task 37—Energy from Biogas; IEA Bioenergy: Paris, France, 2014; ISBN 978-1-910154-05-2. [Google Scholar]
- Phuttaro, C.; Sawatdeenarunat, C.; Surendra, K.C.; Boonsawang, P.; Chaiprapat, S.; Khanal, S.K. Anaerobic digestion of hydrothermally-pretreated lignocellulosic biomass: Influence of pretreatment temperatures, inhibitors and soluble organics on methane yield. Bioresour. Technol. 2019, 284, 128–138. [Google Scholar] [CrossRef] [PubMed]
- Pessoa, A., Jr.; Mancilha, I.M.; Sato, S. Acid hydrolysis of hemicellulose from sugarcane bagasse. Braz. J. Chem. Eng. 1997, 14, 291–297. [Google Scholar] [CrossRef]
- Rocha-Meneses, L.; Raud, M.; Orupõld, K.; Kikas, T. Potential of bioethanol production waste for methane recovery. Energy 2019, 173, 133–139. [Google Scholar] [CrossRef]
- Binod, P.; Kuttiraja, M.; Archana, M.; Janu, K.U.; Sindhu, R.; Sukumaran, R.K.; Pandey, A. High temperature pretreatment and hydrolysis of cotton stalk for producing sugars for bioethanol production. Fuel 2012, 92, 340–345. [Google Scholar] [CrossRef]
© 2019 by the authors. Licensee MDPI, Basel, Switzerland. This article is an open access article distributed under the terms and conditions of the Creative Commons Attribution (CC BY) license (http://creativecommons.org/licenses/by/4.0/).