3.1. Camera Settings Optimisation
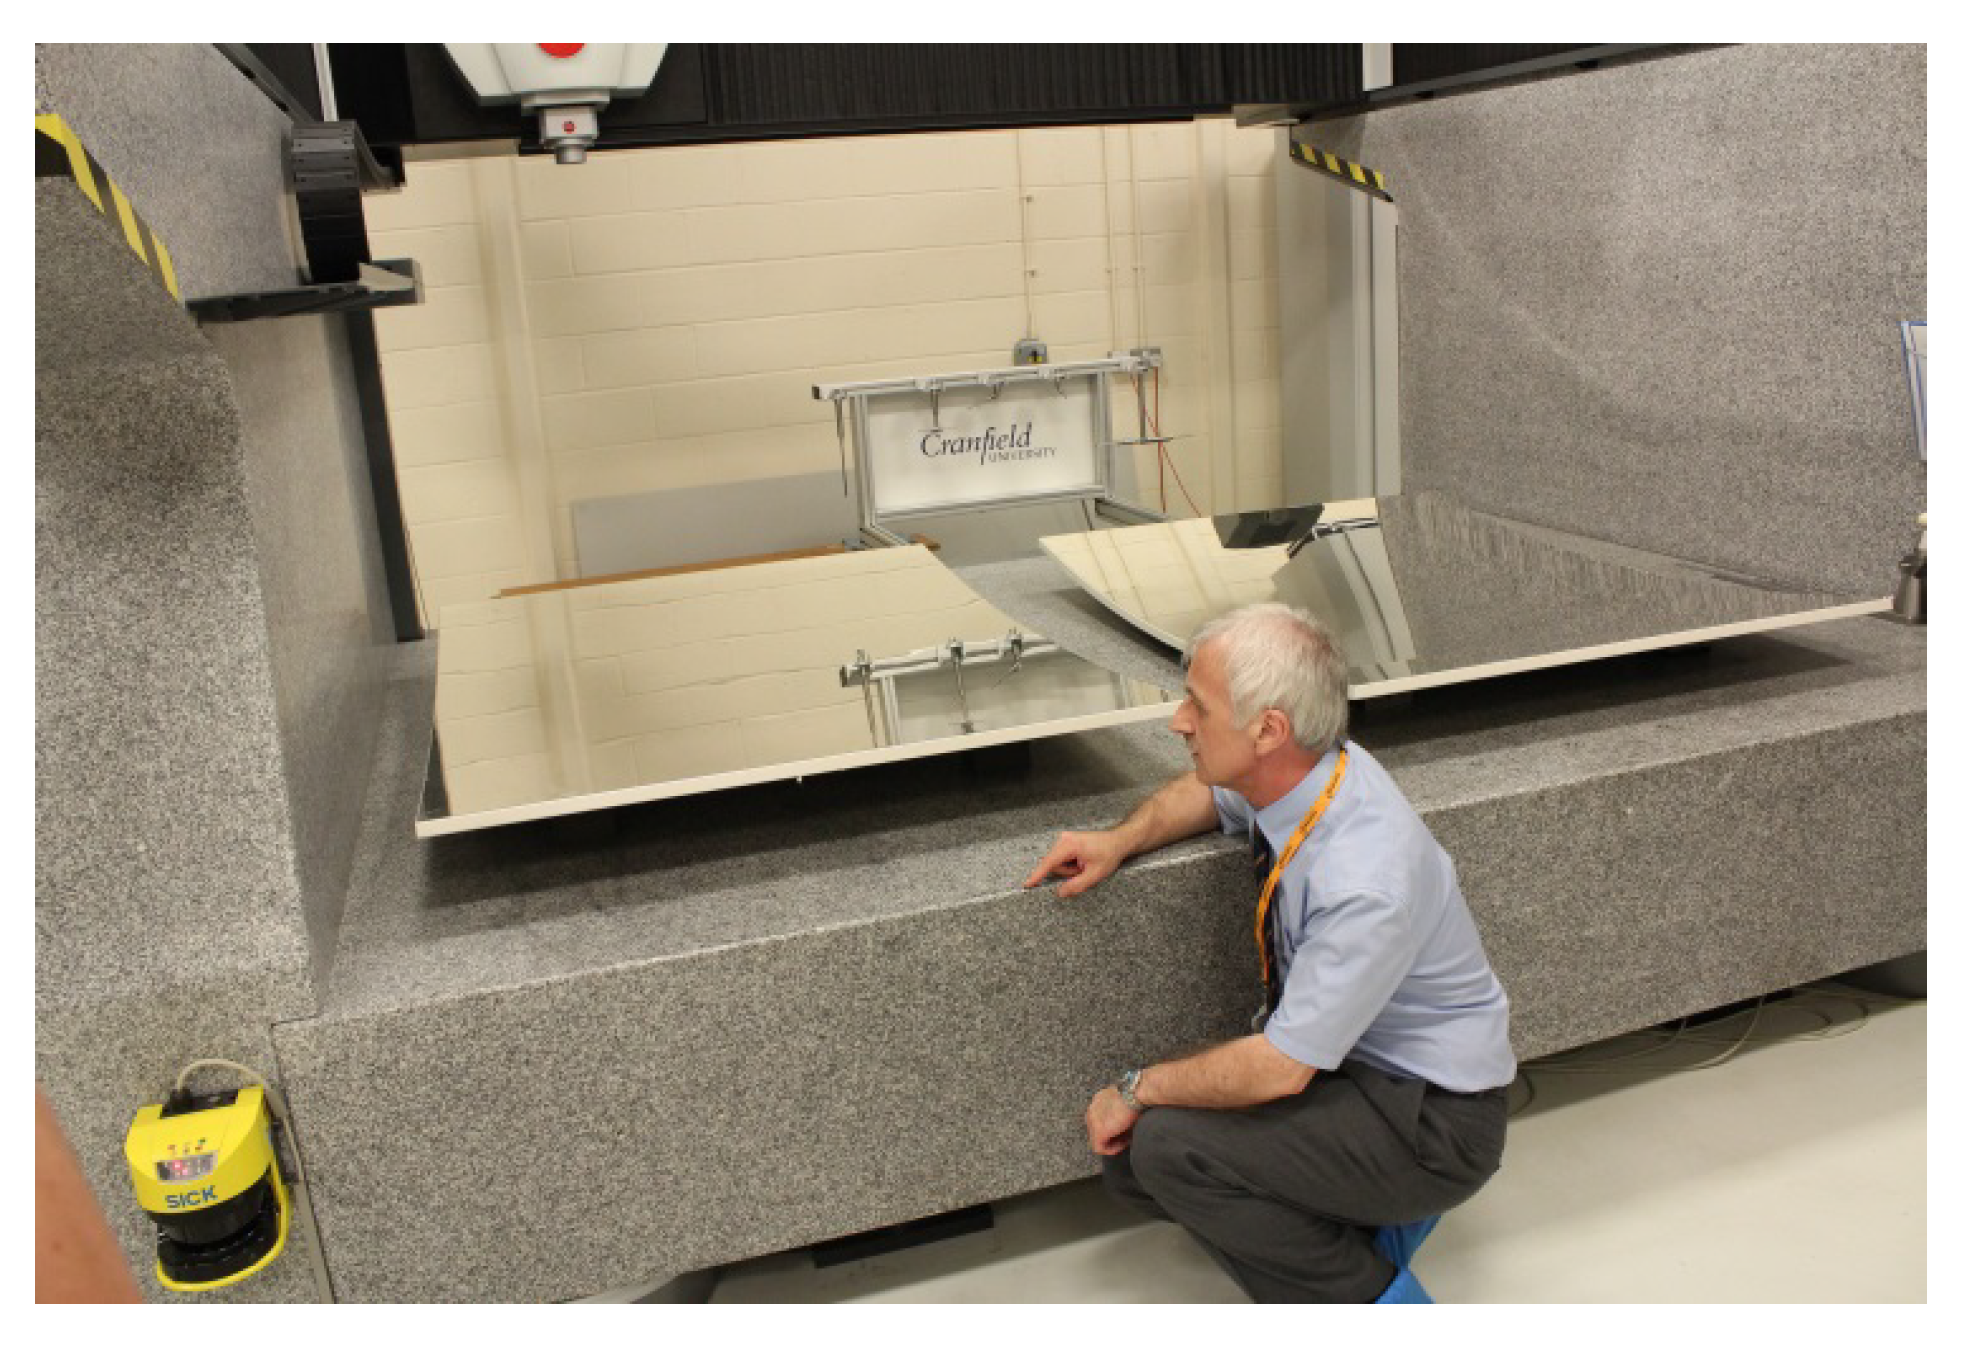
The optimal camera settings were established by photogrammetry tests using a set of 25 white ceramic spheres attached to the granite bed of the CMM, a highly stable structure that does not change significantly over the course of the measurements. By using these spheres, many of the camera settings and elements of the procedure were determined.
Changing the aperture size affects the depth of focus of the image, which is essential in maintaining a sharp image across the whole surface. It is possible to predict the approximate aperture size by calculating this depth of focus and also the amount of “blur” a point will have depending on its distance from the camera. For instance, a point that is entirely within the depth of focus will be sharp; however, a point near the edge or outside the depth of focus will have a certain amount of blur associated with it. The size of the sphere grid is 800 m × 800 m with the longest diagonal of 1100 mm. This distance must fit well within the field of view of the camera to reduce the image distortions around the outer edge of the lens. This sets the minimum distance at which the photographs must be taken from and depends on the focal length of the camera, which determines the field of view. The focal length of the camera has been set at its repeatable end stop of 18 mm, giving a minimum distance to the target of approximately 1600 mm. The distance between the camera and each sphere was calculated by using this distance and the positions of each sphere in the grid. For each of the 25 distances, it is possible to apply a blurring equation to calculate the size that a point source would appear on the camera sensor. This equation was applied for different aperture settings from to and was done for each of the 8 camera positions, and a total effective blur was found by adding the contribution from each position. The results show that the minimum total blur of mm occurs with an aperture of .
The second camera setting optimized was the shutter speed, which affects the contrast of the targets. The same method of comparison measurements against the CMM was done, this time changing the shutter speed. By increasing the shutter speed from 1/60 second to 1/125 second, a noticeable increase in the sphere position accuracy was seen from
to
RMS as shown in
Table 1. The faster shutter speed reduces the amount of light that the sensor receives from the dark background behind the spheres while having minimal effect on the light reflected from the spheres. This increases the contrast and leads a more accurate centering of the targets by the algorithm within the software. Faster shutter speeds will also reduce any blurring caused by the motion of the hand-held camera while the exposure is being taken. Though no motion blur is noticeable on the slower shutter speed, this may still have an effect at the pixel and sub-pixel level and must be taken care of in less than ideal lighting.
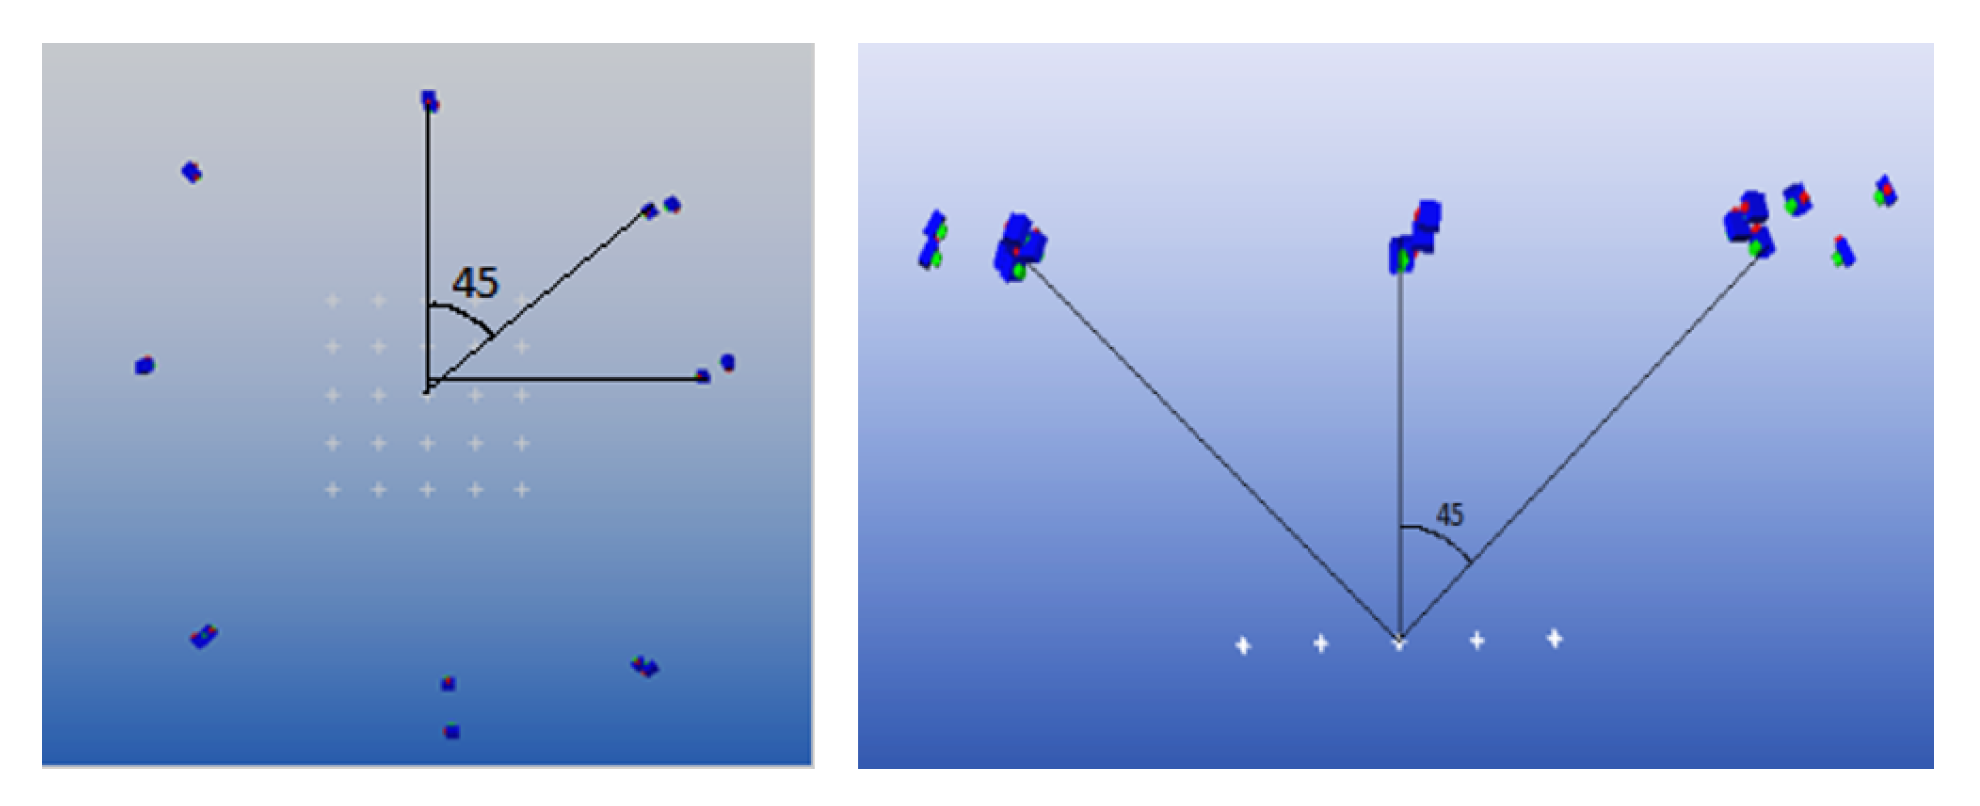
The photographs were taken so as to have the light rays connecting the camera and the points close to perpendicular. This is optimal for the intersection calculation within the software and so increases the accuracy of the points. To do this, the photographs were taken at an angle of approximately 45 degrees from the horizontal plane of the spheres and at eight positions equally spaced around the points, as seen in
Figure 4.
At each of these positions two photographs were taken, one with the camera held in a landscape orientation and the other rolled 90 degrees to portrait. This is an important step in the software camera calibration where lens distortions are calculated and corrected for. By implementing this camera roll, the accuracy was increased from 60 to 40 RMS.
The coordinate system set up is important in determining the accuracy of the final photogrammetry result. The coordinate system for the sphere measurements was set up using the CMM measured positions of three of the spheres. In all cases, the spheres were placed one at the origin and one along each of the
x and
y axes. The distance along the
x and
y axes was varied from 200 mm to 800 mm and the accuracy recorded in relation to the CMM.
Table 2 shows the results for each coordinate system (CSY) length for four repeat measurements, along with their averages and standard deviations.
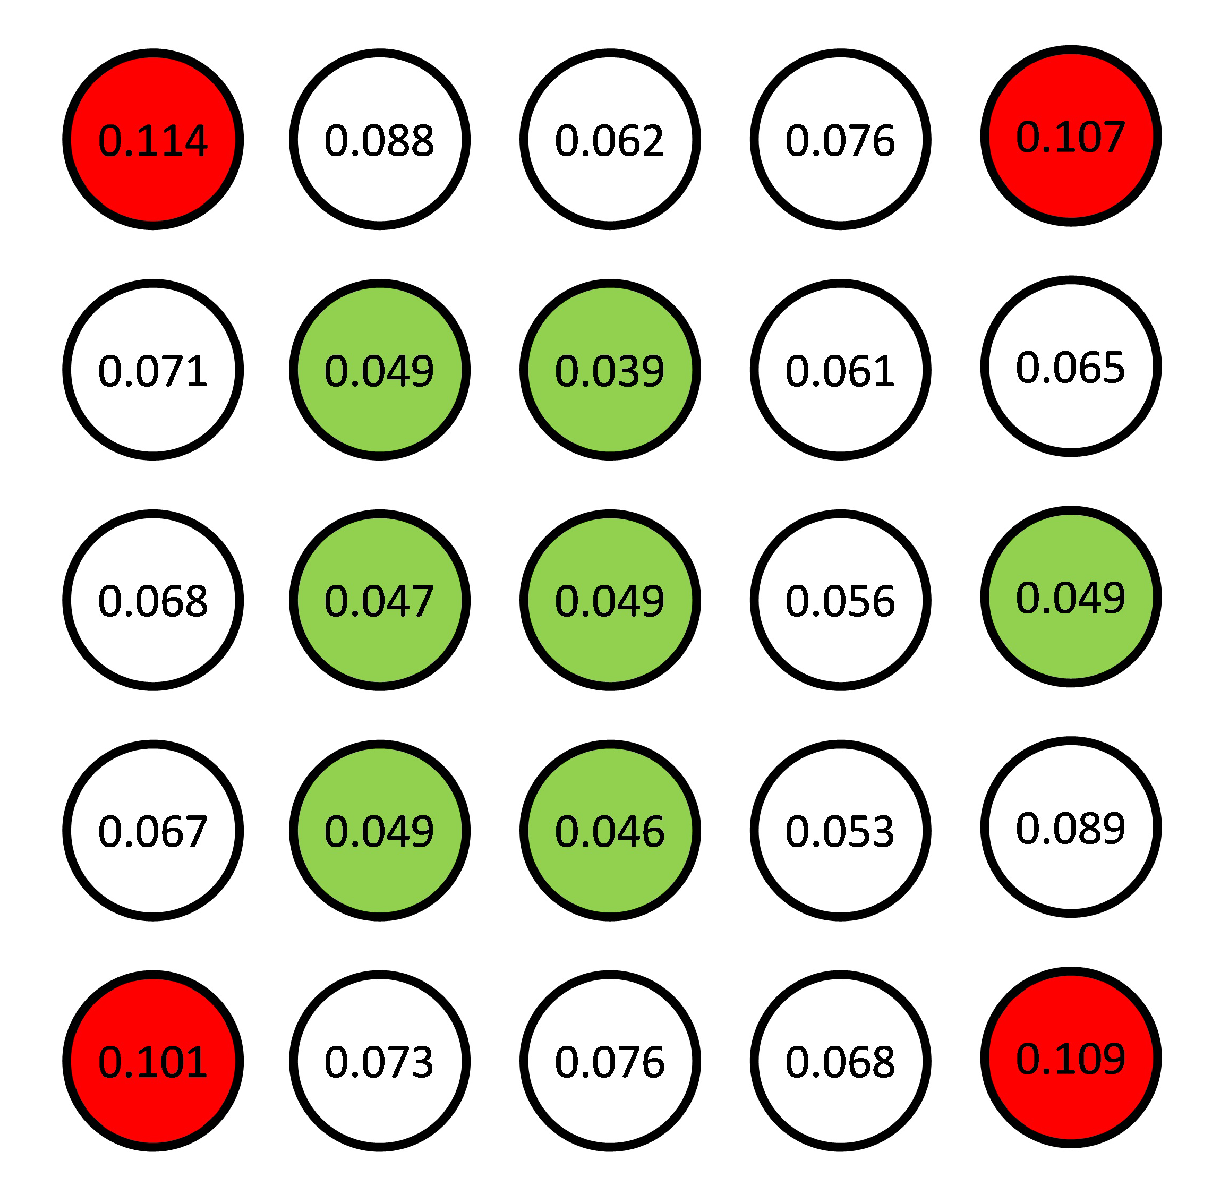
The accuracy increases with the CSY distance up to 600 mm and slightly decreases for the largest size. The length of the CSY determines the scale that is applied to the point cloud, so when using the 200 mm CSY, this length is multiplied by 4 to calculate the scale at the 800 mm points. Therefore any error in locating the 200 mm points will also multiply and have a large effect on the scaling of the grid. When using the 800 mm CSY, there is no scaling up of any errors, making these CSY points more accurate. The decrease in accuracy seen past 600 mm is due to the 800 mm spheres being at the corners of the sphere grid. These corner points are not as accurate as those closer to the center as the camera is focused at the center of the grid. Additionally, there is a larger camera lens distortion towards the outside of the field of view, where the corner points are located. This point quality is shown by the photogrammetry software RMS residual and is shown in
Figure 5. Each circle represents one of the spheres in its corresponding position in the 5 × 5 grid, contained within is the RMS residual in pixels. Highlighted in red are those spheres with residuals greater than 0.1 pixels and in green are those less than 0.05 pixels, showing the greater quality toward the center.
Placing a 200 mm CSY at the centre produced an RMS accuracy of 36 and a 400 mm CSY placed at the centre produced a 30 RMS accuracy. Based on these findings, the ideal position for the scale bar would be in the center of the image where the points have the highest accuracy. However, this is not practical for use on the large mirrors as there is no suitable mounting point in the center of the glass for any externally used scaling artifact.
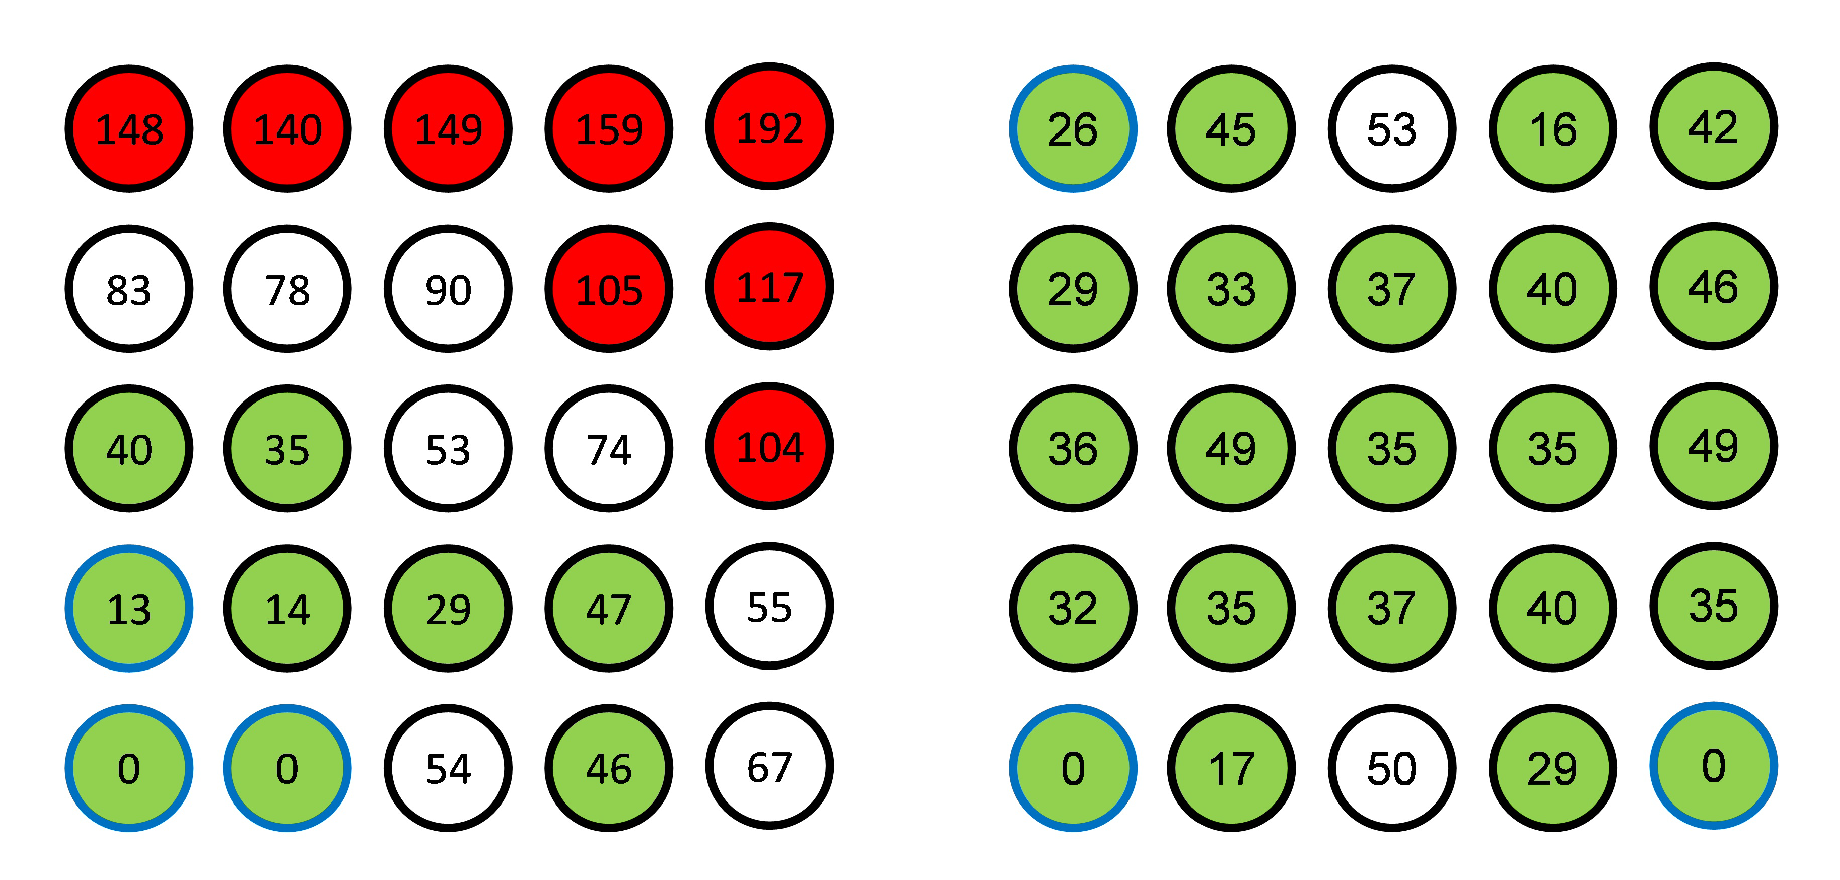
Figure 6 shows the individual sphere errors across the 5 × 5 grid for the 200 mm CSY and the 800 mm CSY. Highlighted in red are those points with an error greater than 100
and in green are those less than 50
. It is clear that when the smaller CSY is used, there is a large error at the opposite corner, whereas with the large CSY the error is reduced and evenly distributed. The spheres used as CSY points are outlined in blue. The measurements were done using the previously found camera settings and parameters of aperture
, shutter speed
, target size 10 mm, eight photograph positions with two roll angles at each. The results show that the accuracy of the photogrammetry measurement points is
RMS with a standard deviation of
over the 800 mm square grid. Such accuracy is well within the defined requirement for measuring the parabolic mirrors. It is clear from these results that a coordinate system should be set up using points separated as much as possible. Such points should be placed at the corners of the mirrors, or the corners themselves identified and used.
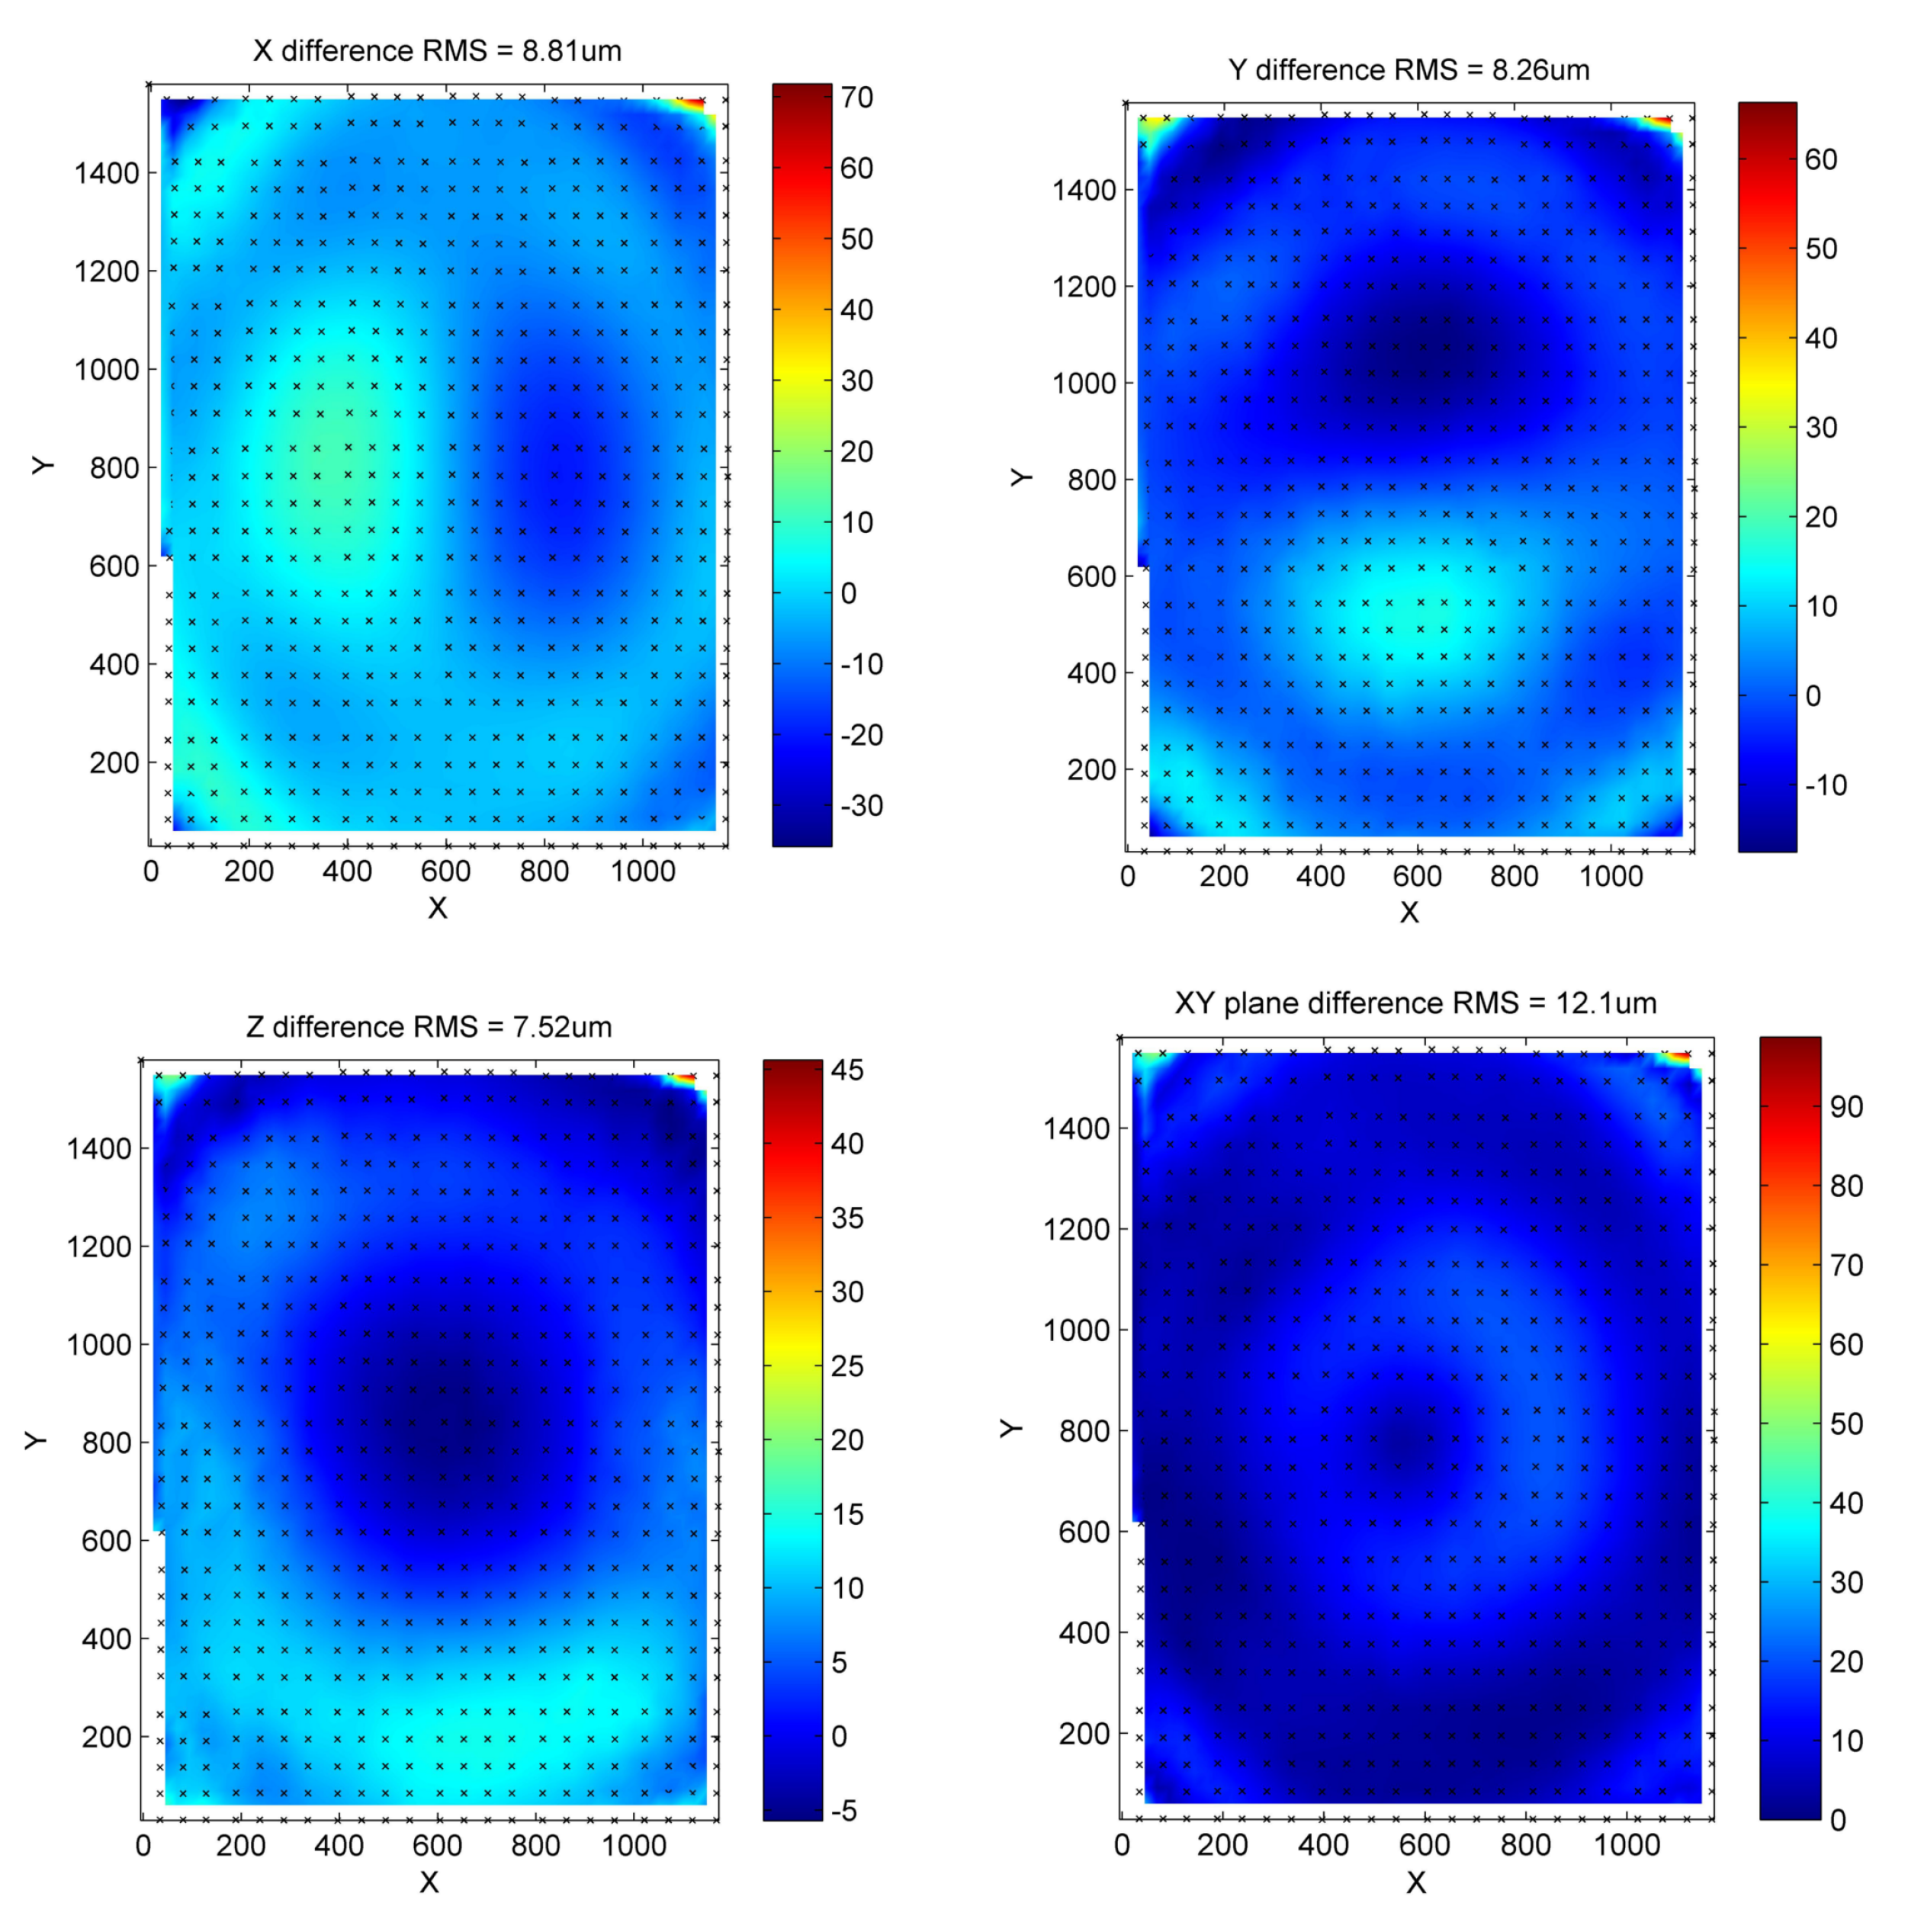
A comparison was made between the measurements both with and without camera calibration, and the results are shown in
Figure 7 demonstrate the importance of the effect of camera calibration on the error map. The RMS difference is
for the
position, which is at the level of accuracy of photogrammetry. This reinforces the result shown by the sphere targets measurements that it is therefore key to carefully consider the camera calibrations as they may cause systematic features in the error maps which are not an accurate representation of the surface.
3.2. Facet Measurements
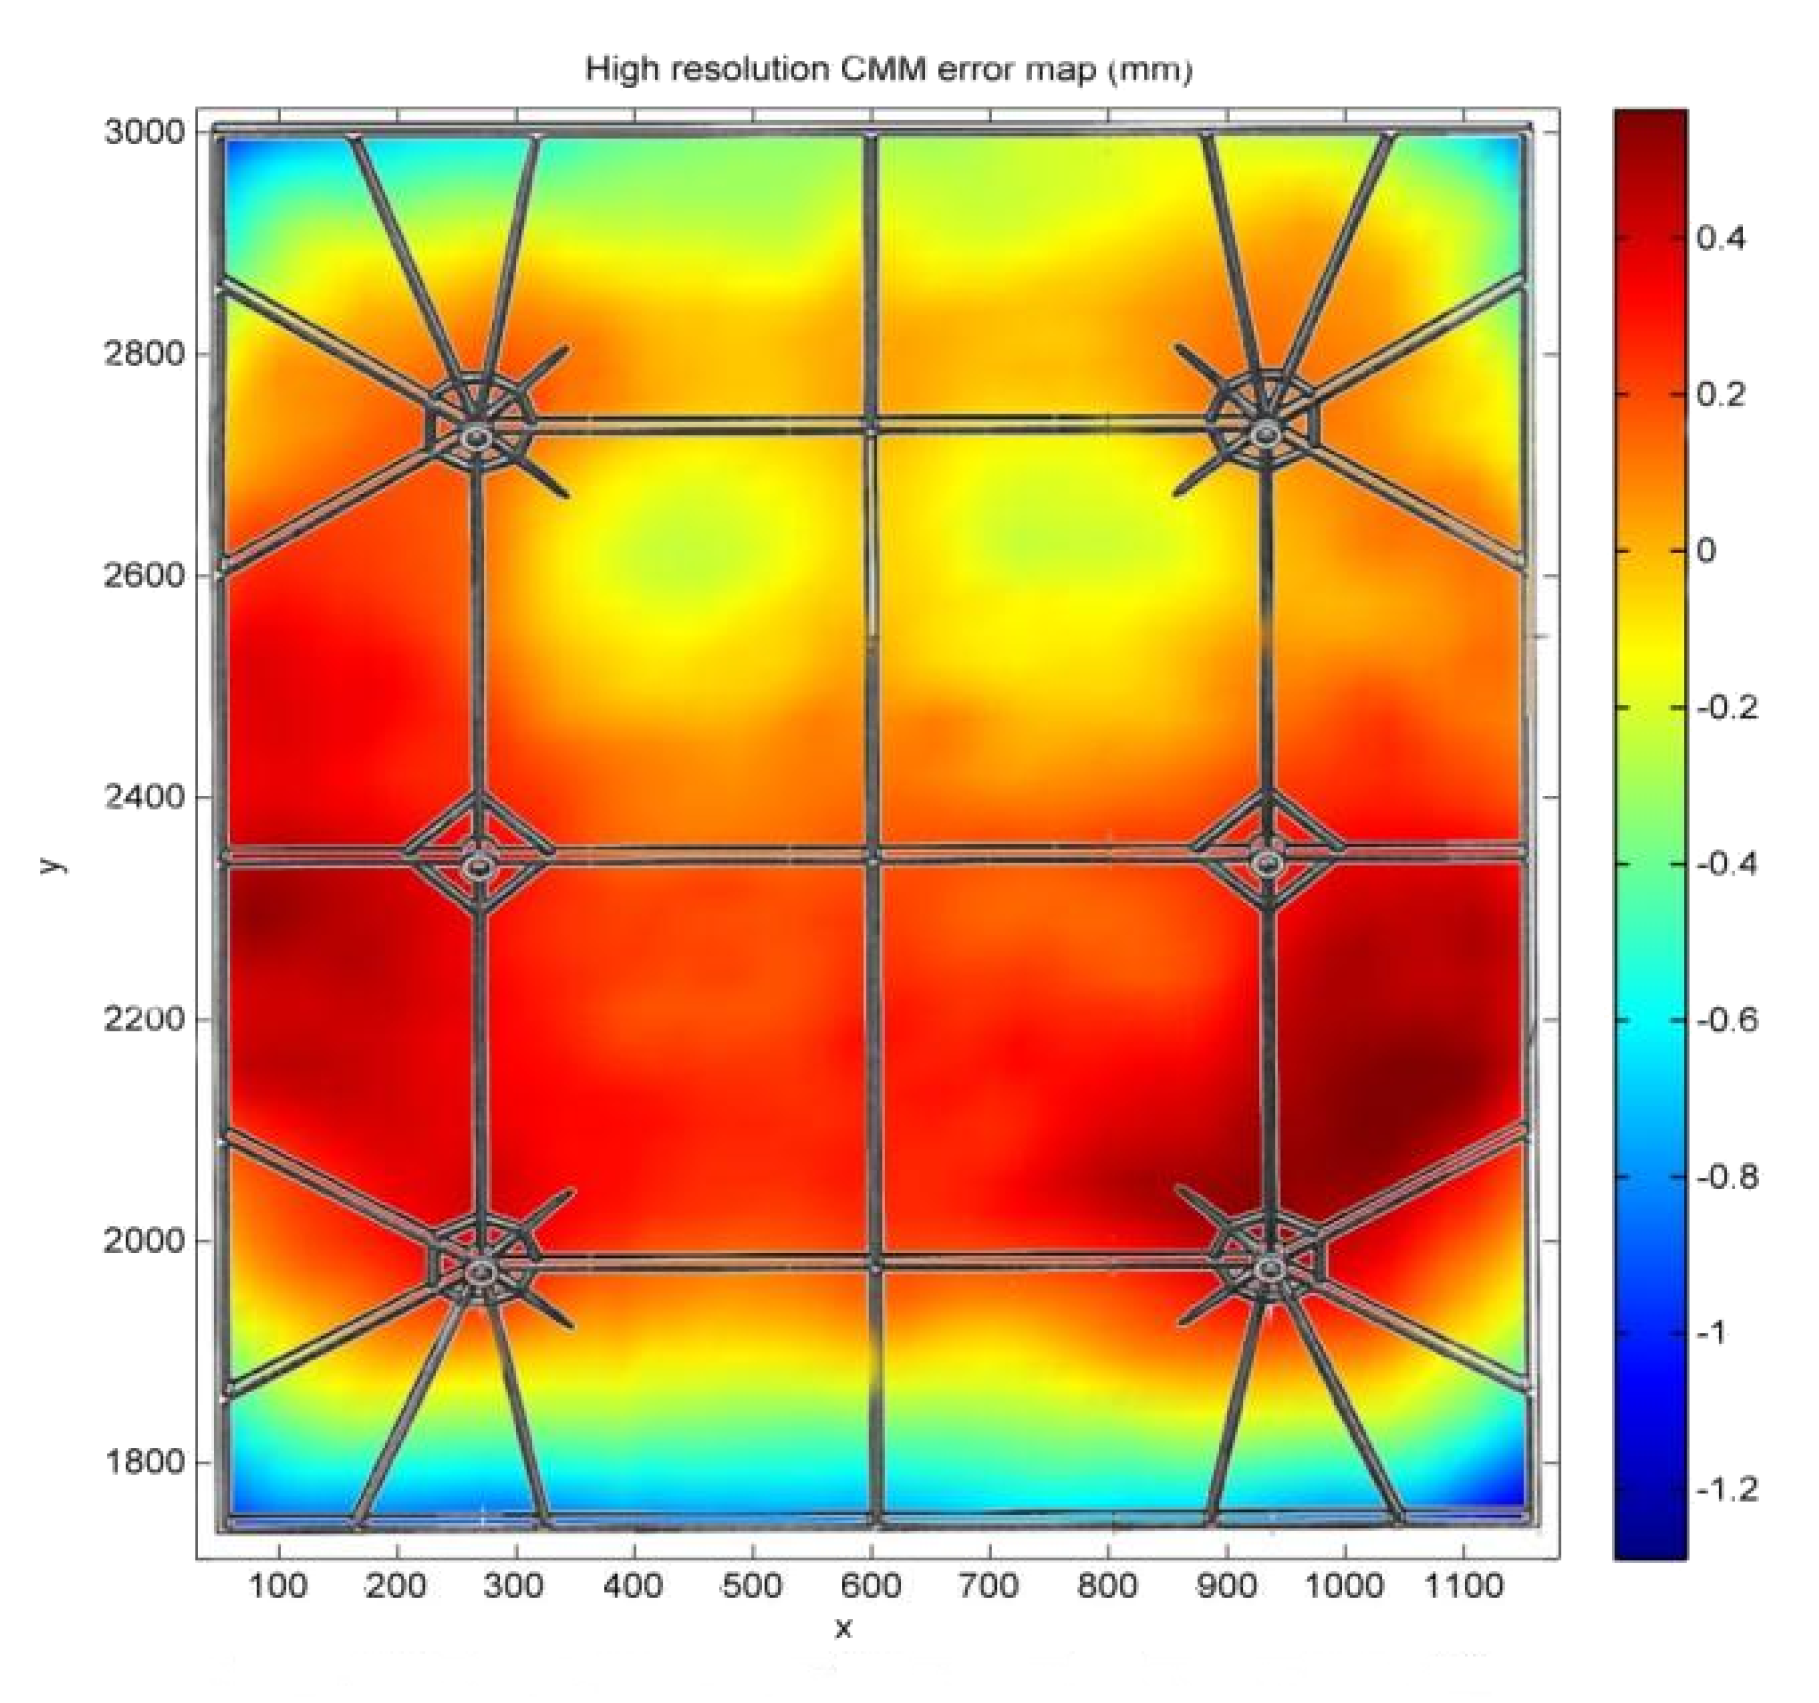
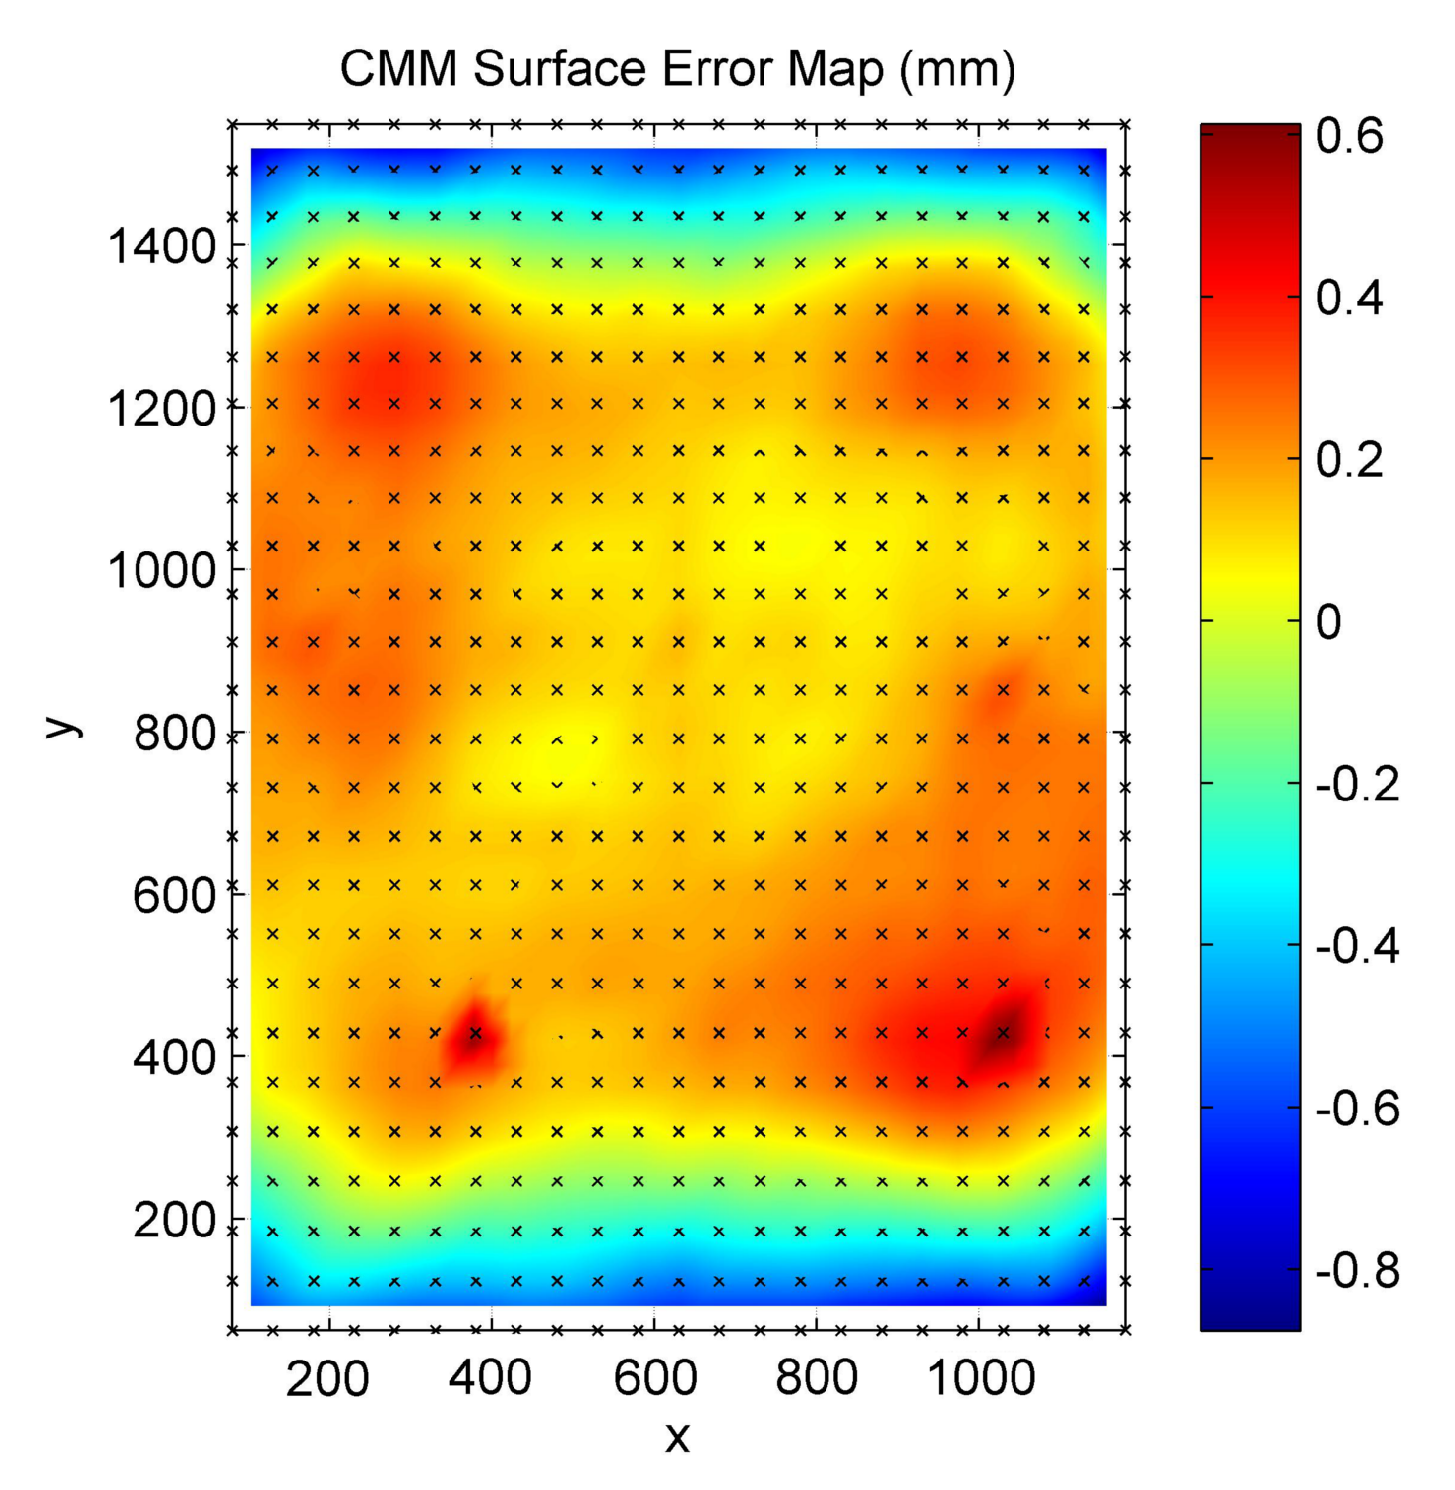
Figure 8 shows the high-resolution CMM error map, measured with a point spacing of 20 mm in
x and
y. This shows clearly the effect of the ribbed structure in the central vertical line and the variations around the support points.
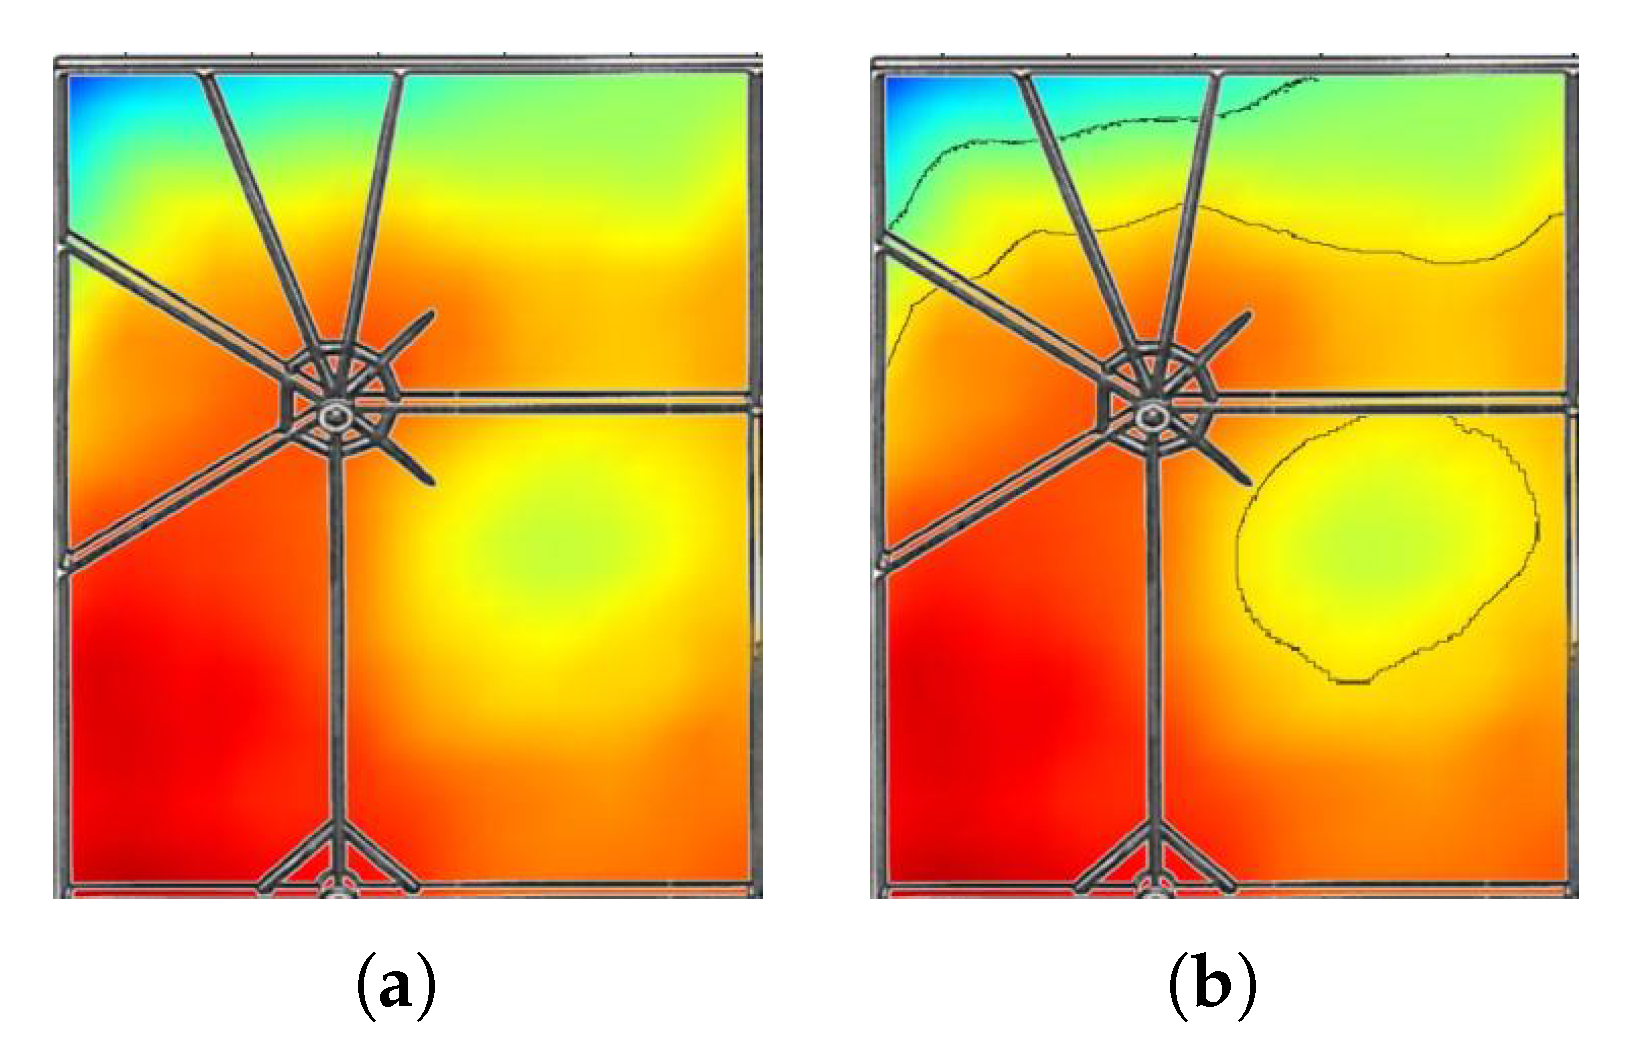
Figure 9a shows a close-up of the top left corner of
Figure 8, clearly showing the effect of the supporting rib structure on the shape of the mirror.
Figure 9b shows the results of an edge detection algorithm which displays more clearly the contours of the effect of the structure. The magnitudes of these variations are of the order of 50
to 100
in height with a length of approximately 50 mm to 100 mm, which are small when compared to the millimeter-scale distortions expected and so are likely not to be seen. They are also of the order of the accuracy of photogrammetry and would require a very dense target grid in order to be seen. As a result of these measurements, a point spacing of 50 mm was used for subsequent CMM measurements.
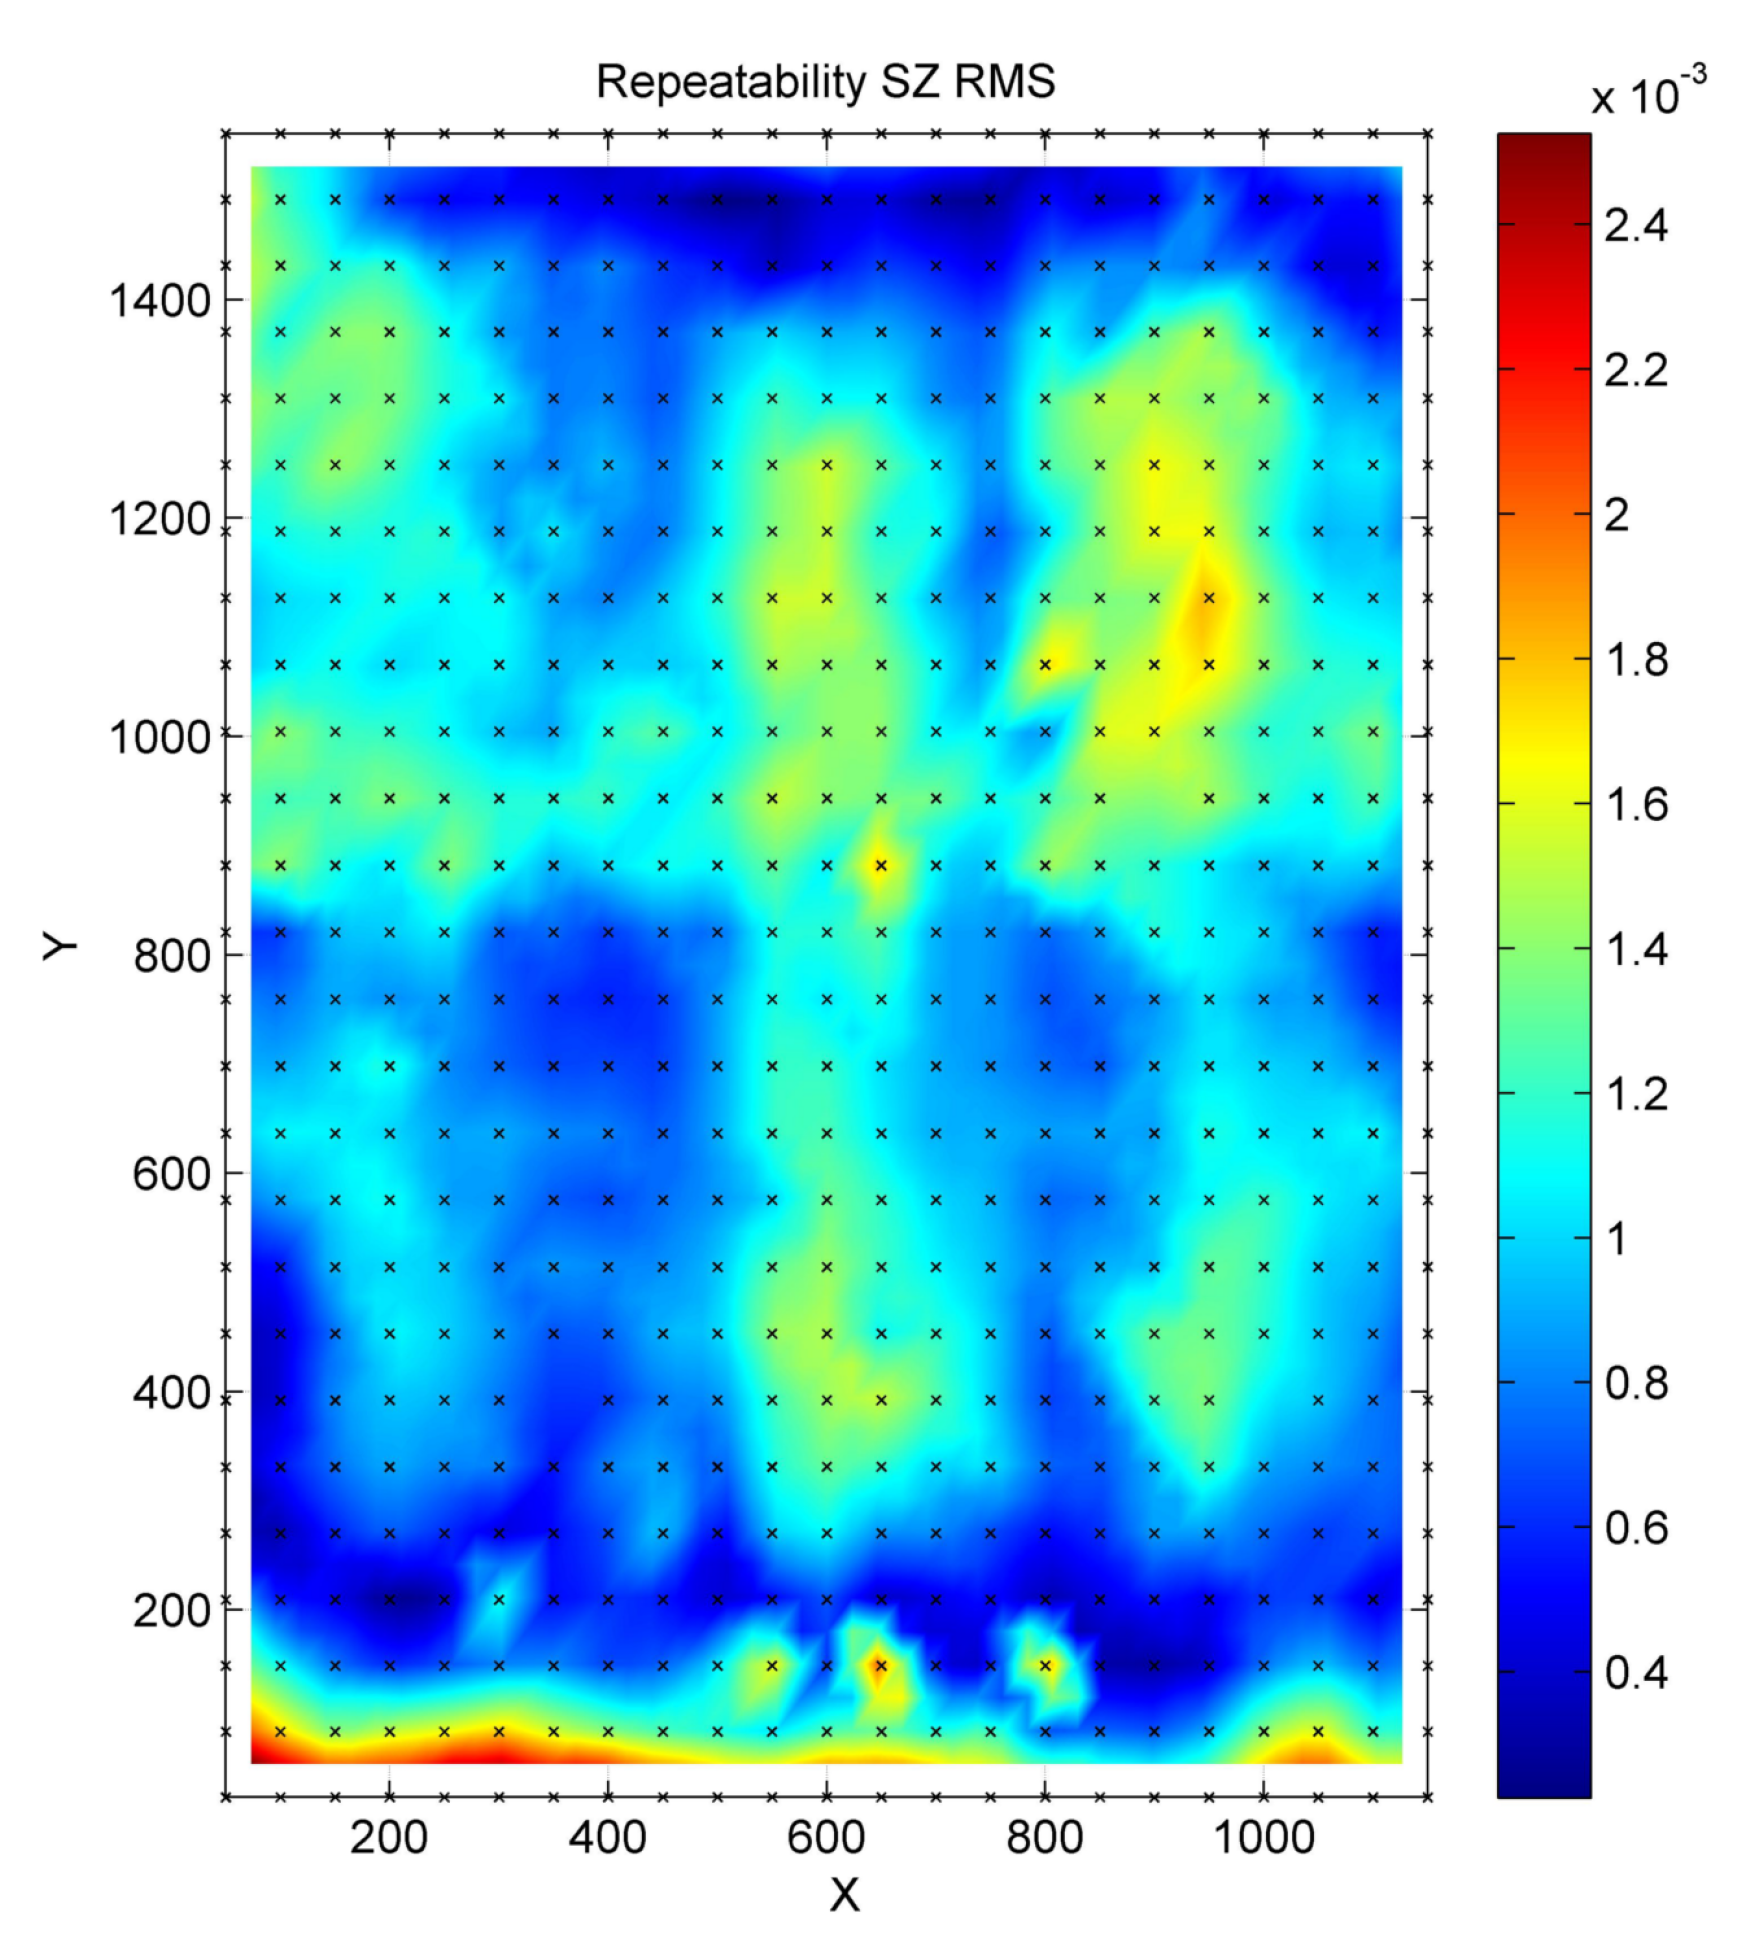
Eight repeat measurements of the mirror facet were taken with the CMM, and the averaged result is shown in
Figure 10. The RMS repeatability of the
z values is
.
These measurements were done with the target sheets already attached to the mirror surface. The thickness of the target sheets was 100
, and its compressive flexibility contributes to the increased variation in successive measurements, over the expected sub-micron level for the CMM. The
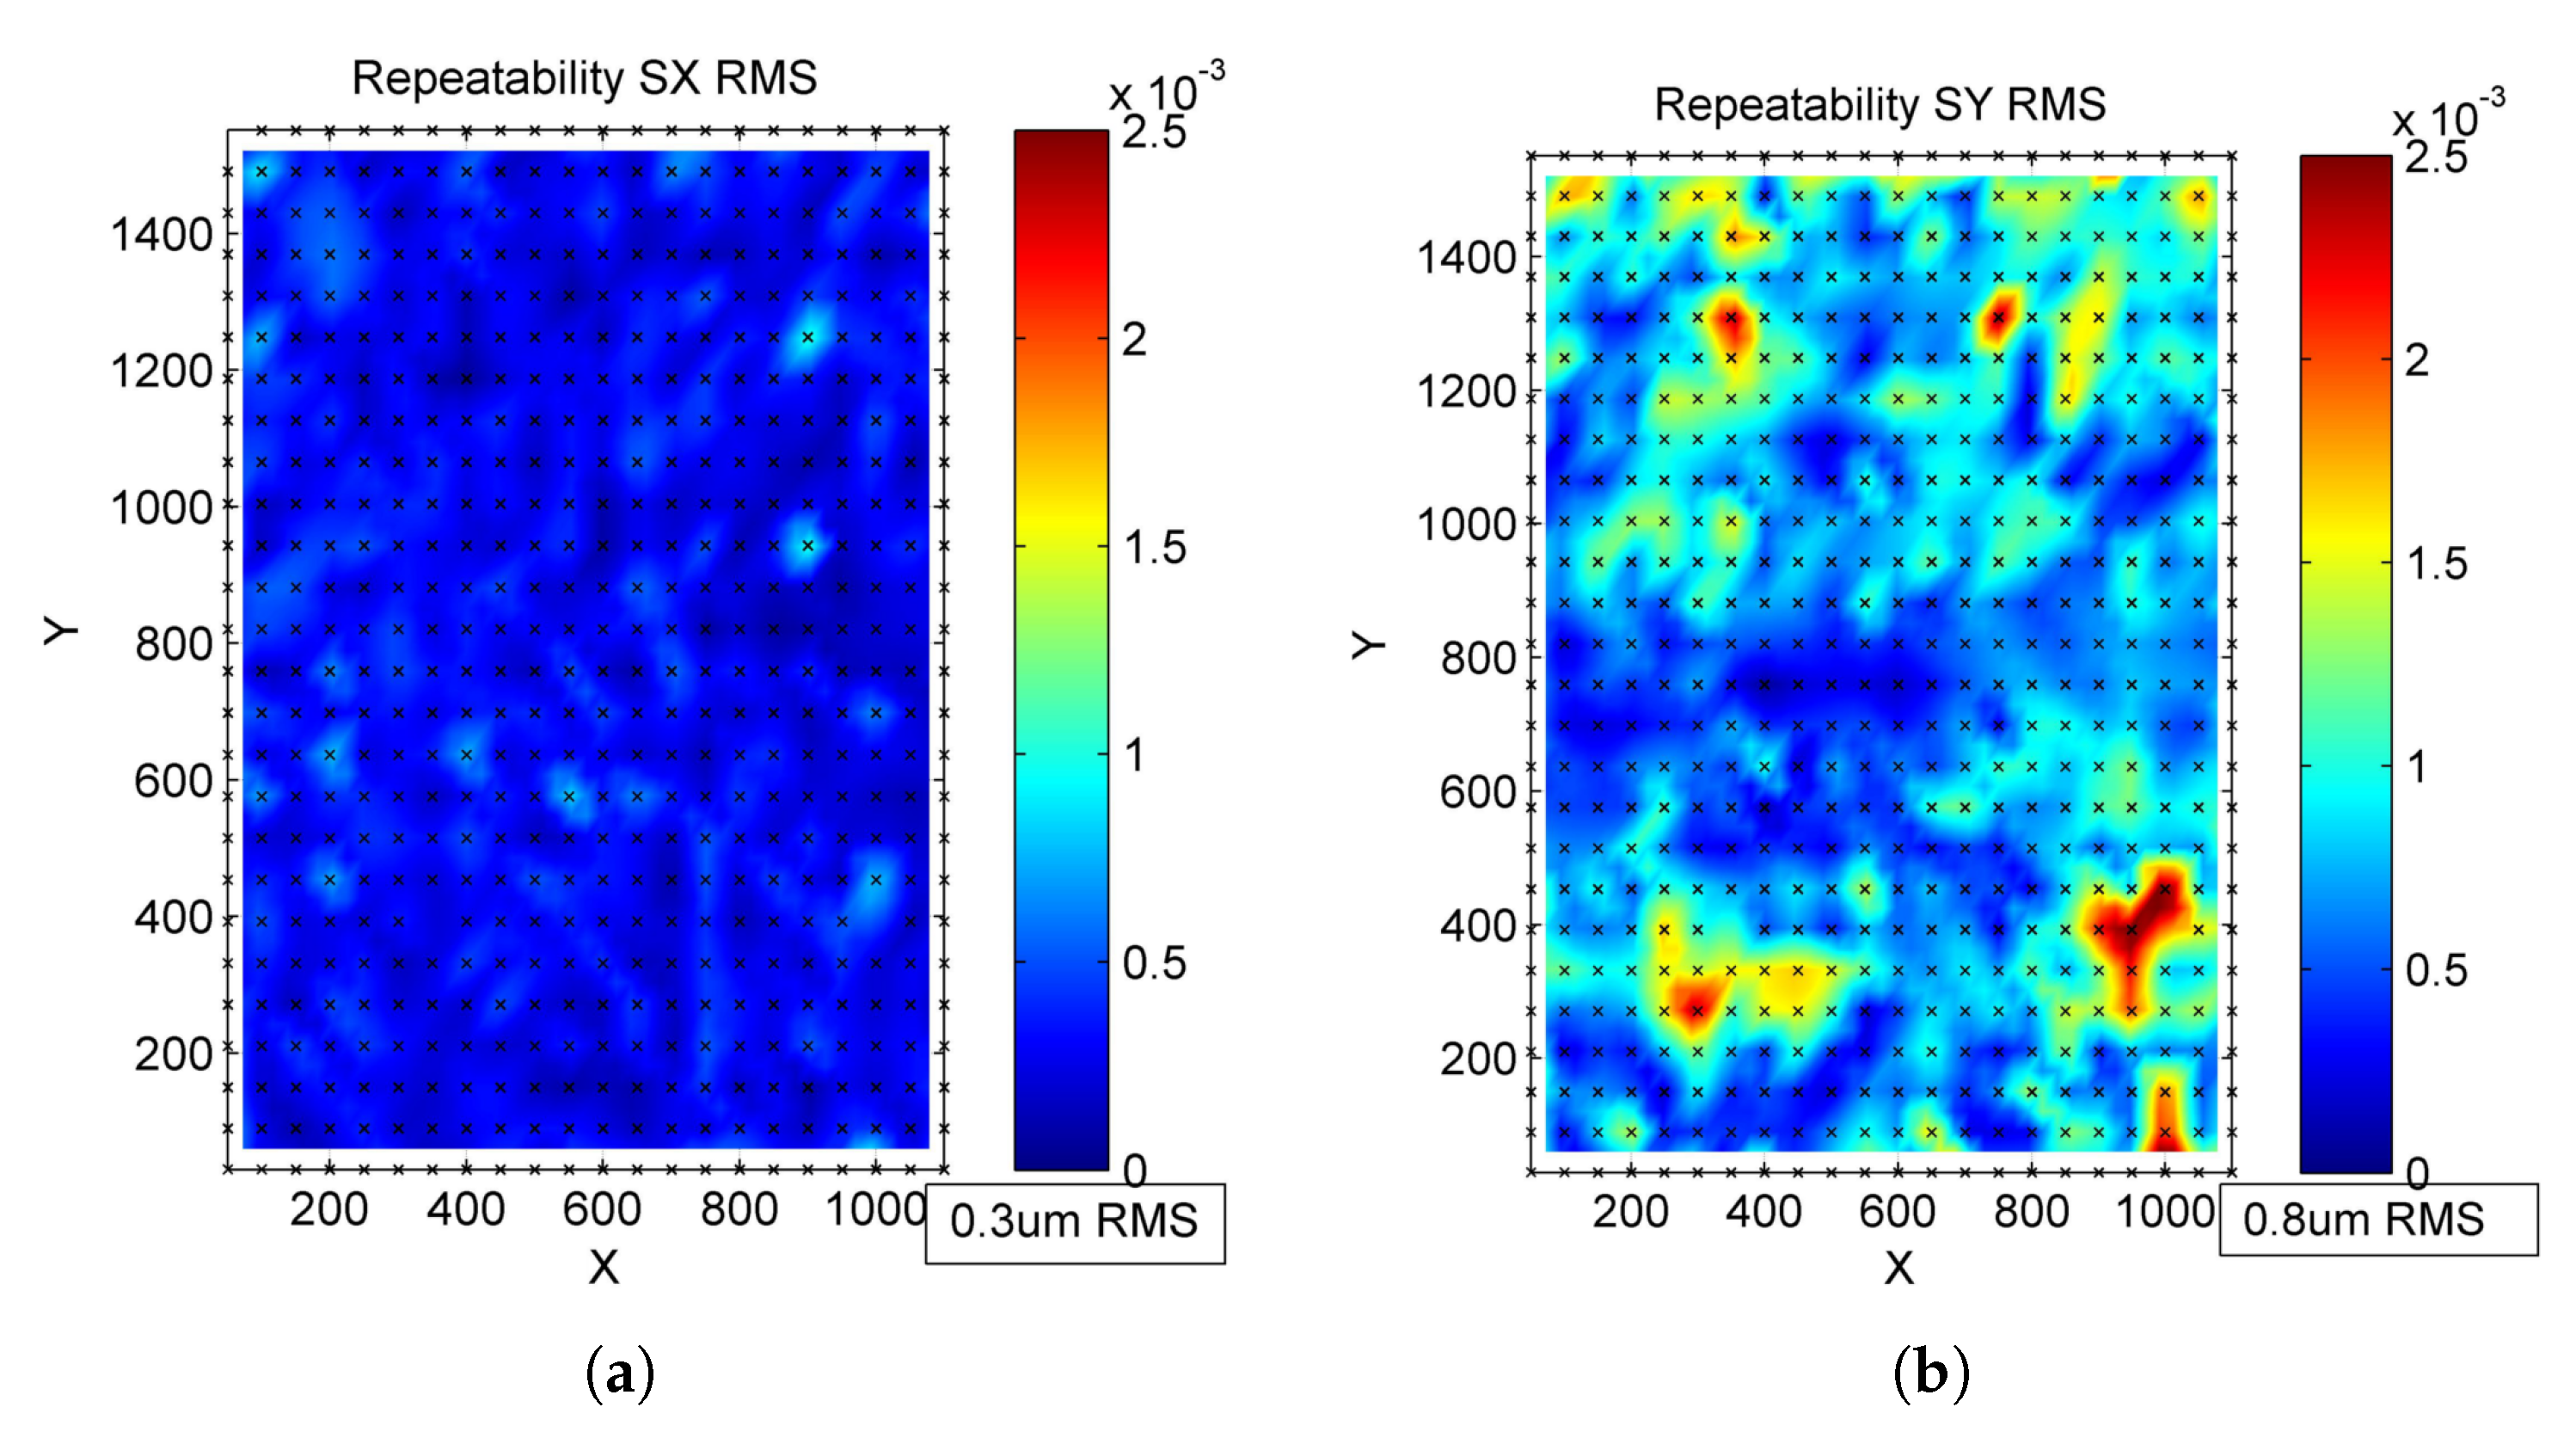
x and
y repeatability can be seen in
Figure 11, with RMS values of
and
respectively, at the expected level for the CMM.
Figure 12 shows the error map produced from the averaging over the 8 CMM measurements calculated as the departure from the ideal parabolic equation. The map is formed from a 23 × 26 grid with 50 mm spacing in
x and 60 mm in
y. The two anomalous points seen in
Figure 10 appear here as raised points, again indicating that these are caused by bubbling, which can be seen on further inspection as distortions in the elliptical appearance of the targets (as shown in
Figure 13).
Photogrammetry measurements were repeated 10 times on the undistorted mirror.
Figure 14a–c show the standard deviations in the
x,
y and
z-directions respectively. The maximum variation occurs at the corners at 40
with the overall RMS deviation at
. Each directional repeatability map shows higher variations away from the central area of the mirror, as does the vector deviation map (
Figure 14d), defined such that
. The
z deviations are much lower than those seen in the
x and
y directions. The variation seen moving away from the central area are most likely due to the lower residual present nearer the focal position of the camera and towards the central area of the lens, where the points are generally better.
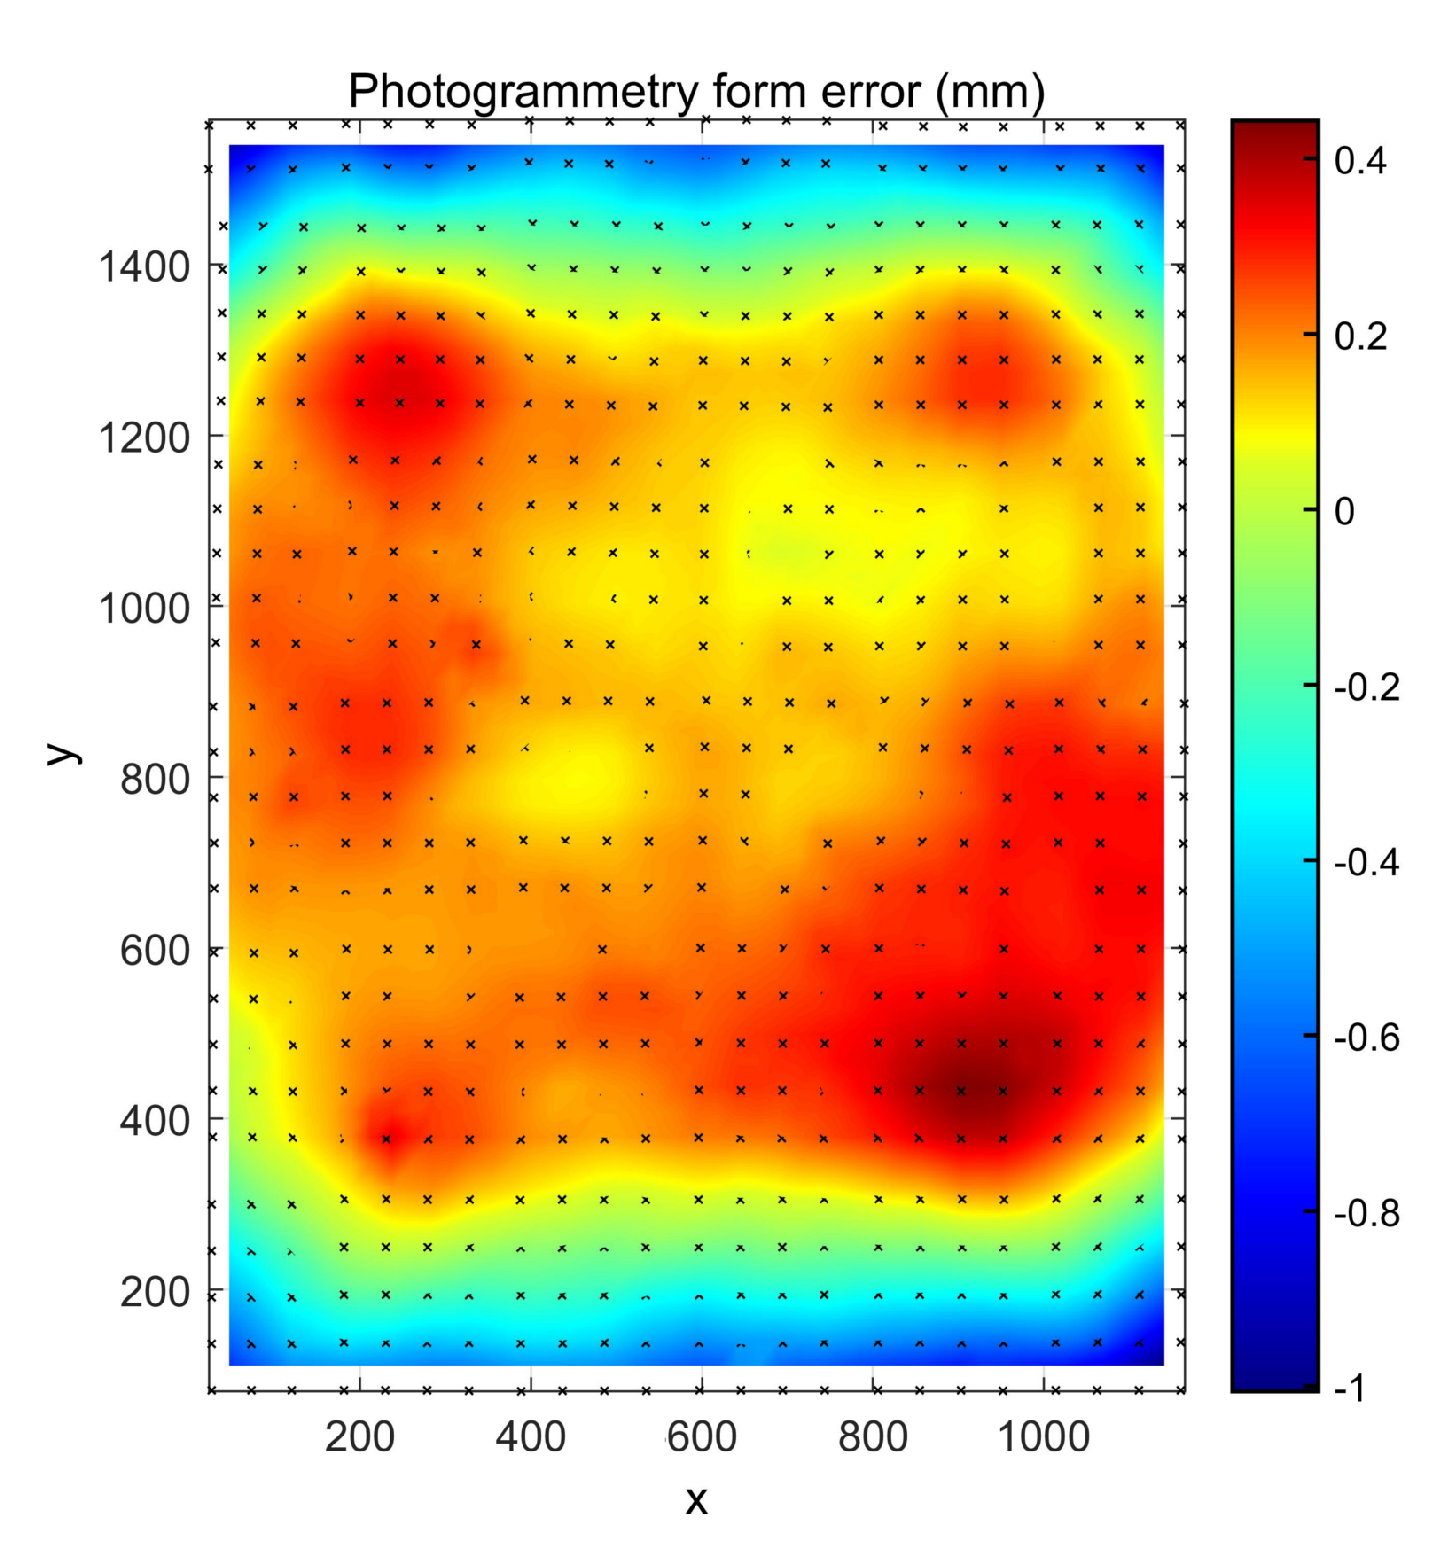
The averaged photogrammetry error map is shown in
Figure 15 This error map is clearly curved in the
y-direction, indicating an overall focal error on the mirror, shown in
Figure 16. The peak-valley error is
mm, with an RMS value of
mm overall.
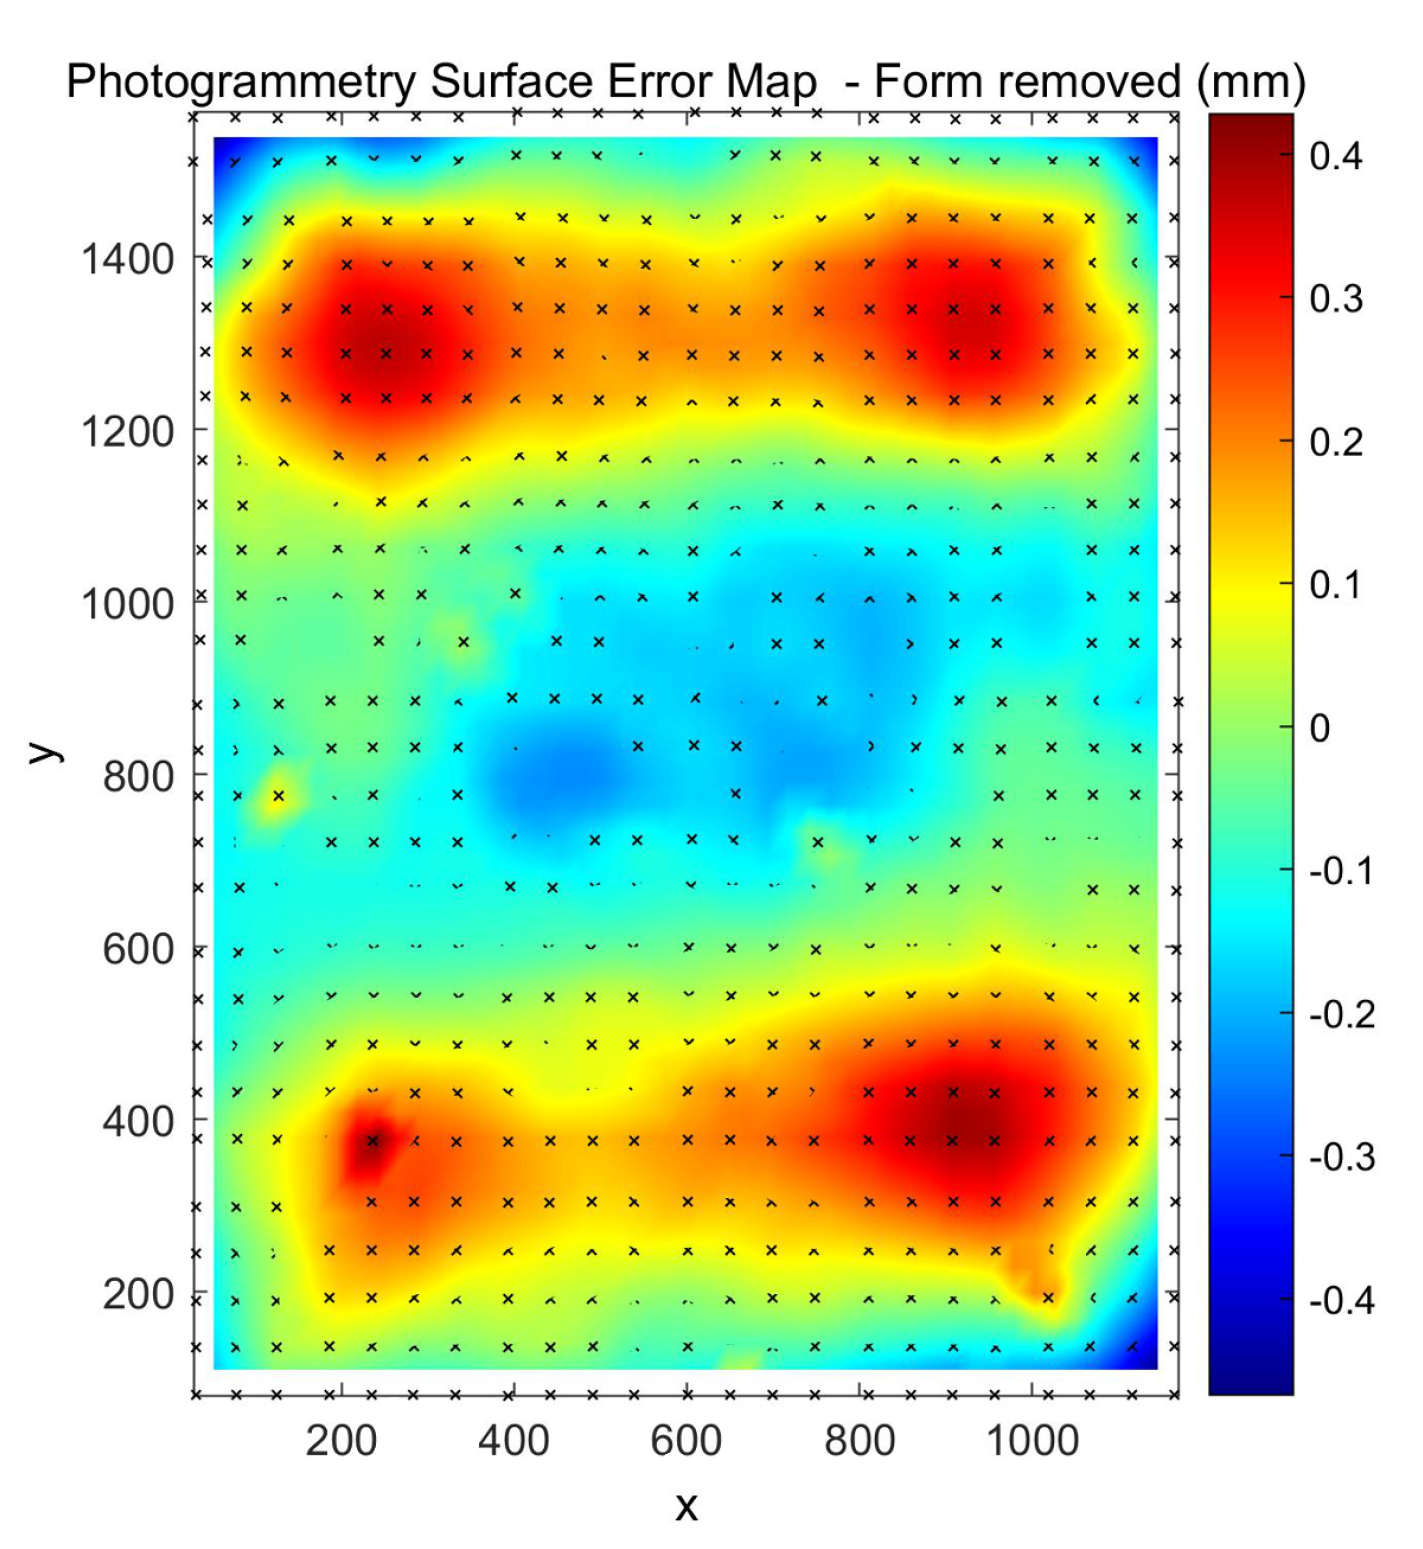
If the focal length is allowed to vary in the fitting algorithm, this curve error is removed, and the underlying waviness is revealed in more detail, as shown in
Figure 17. The high points which remain are in the positions of the four corner support points and are due to the weight of the mirror. The peak–valley error is now
mm, with an RMS of
mm.
3.3. Photogrammetry Validation
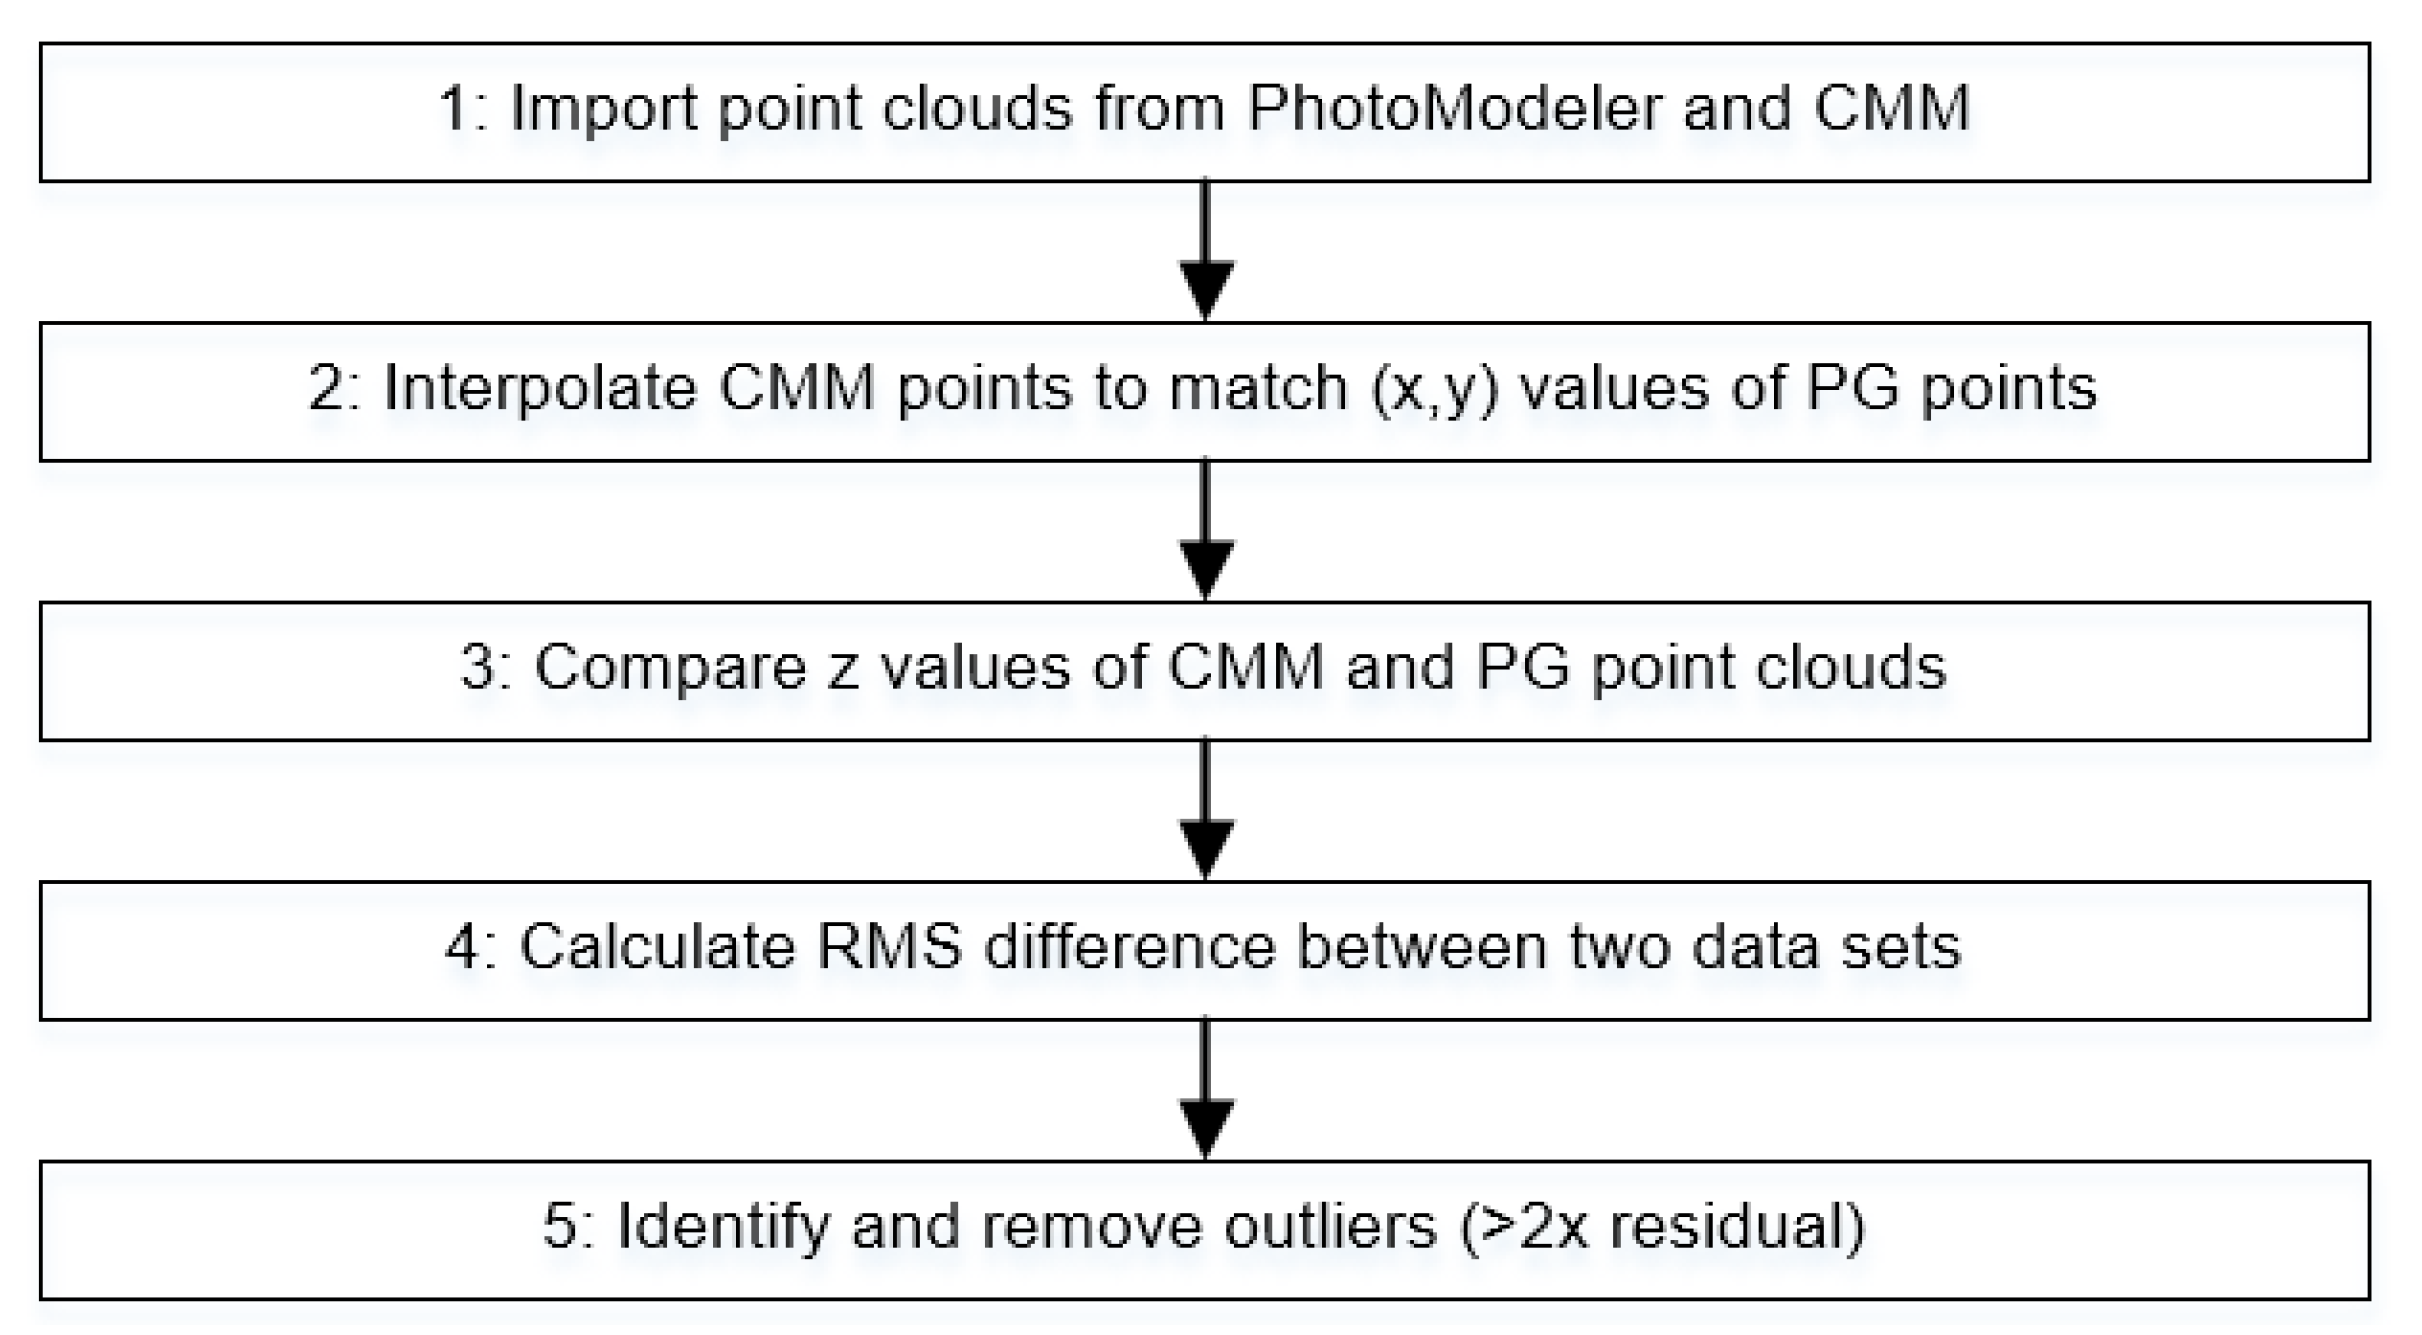
The photogrammetry and CMM results are compared against each other by using the generated error maps, which are averages over 10 repeats themselves. Due to the different positions and densities of measured points, each point cloud was interpolated to the same set of
x and
y coordinates. So as to only perform this interpolation once, the photogrammetry surface map is interpolated to the CMM
x and
y values. The corresponding
z values are then subtracted with the result shown in
Figure 18.
The peak to valley correlation is mm, with an RMS of 76 . There are a number of anomalous points that appear as either red or dark blue. These are likely caused by bubbles, where the photogrammetry and CMM results may differ by compression of the bubble by the probe. A bubble may also cause a distortion in the viewed target, which may cause the software to calculate its position incorrectly. Each point was identified using its unique coded number, checked on the mirror itself and then excluded from further calculations. The correlation is 20 times less than the peak–valley value observed in the form error maps, and 5.7 times less than the RMS value. There is some pattern in the correlation map, particularly some horizontal striping and a slight vertical variation. There is no radial dependence visible, which shows that the camera calibration was successful.
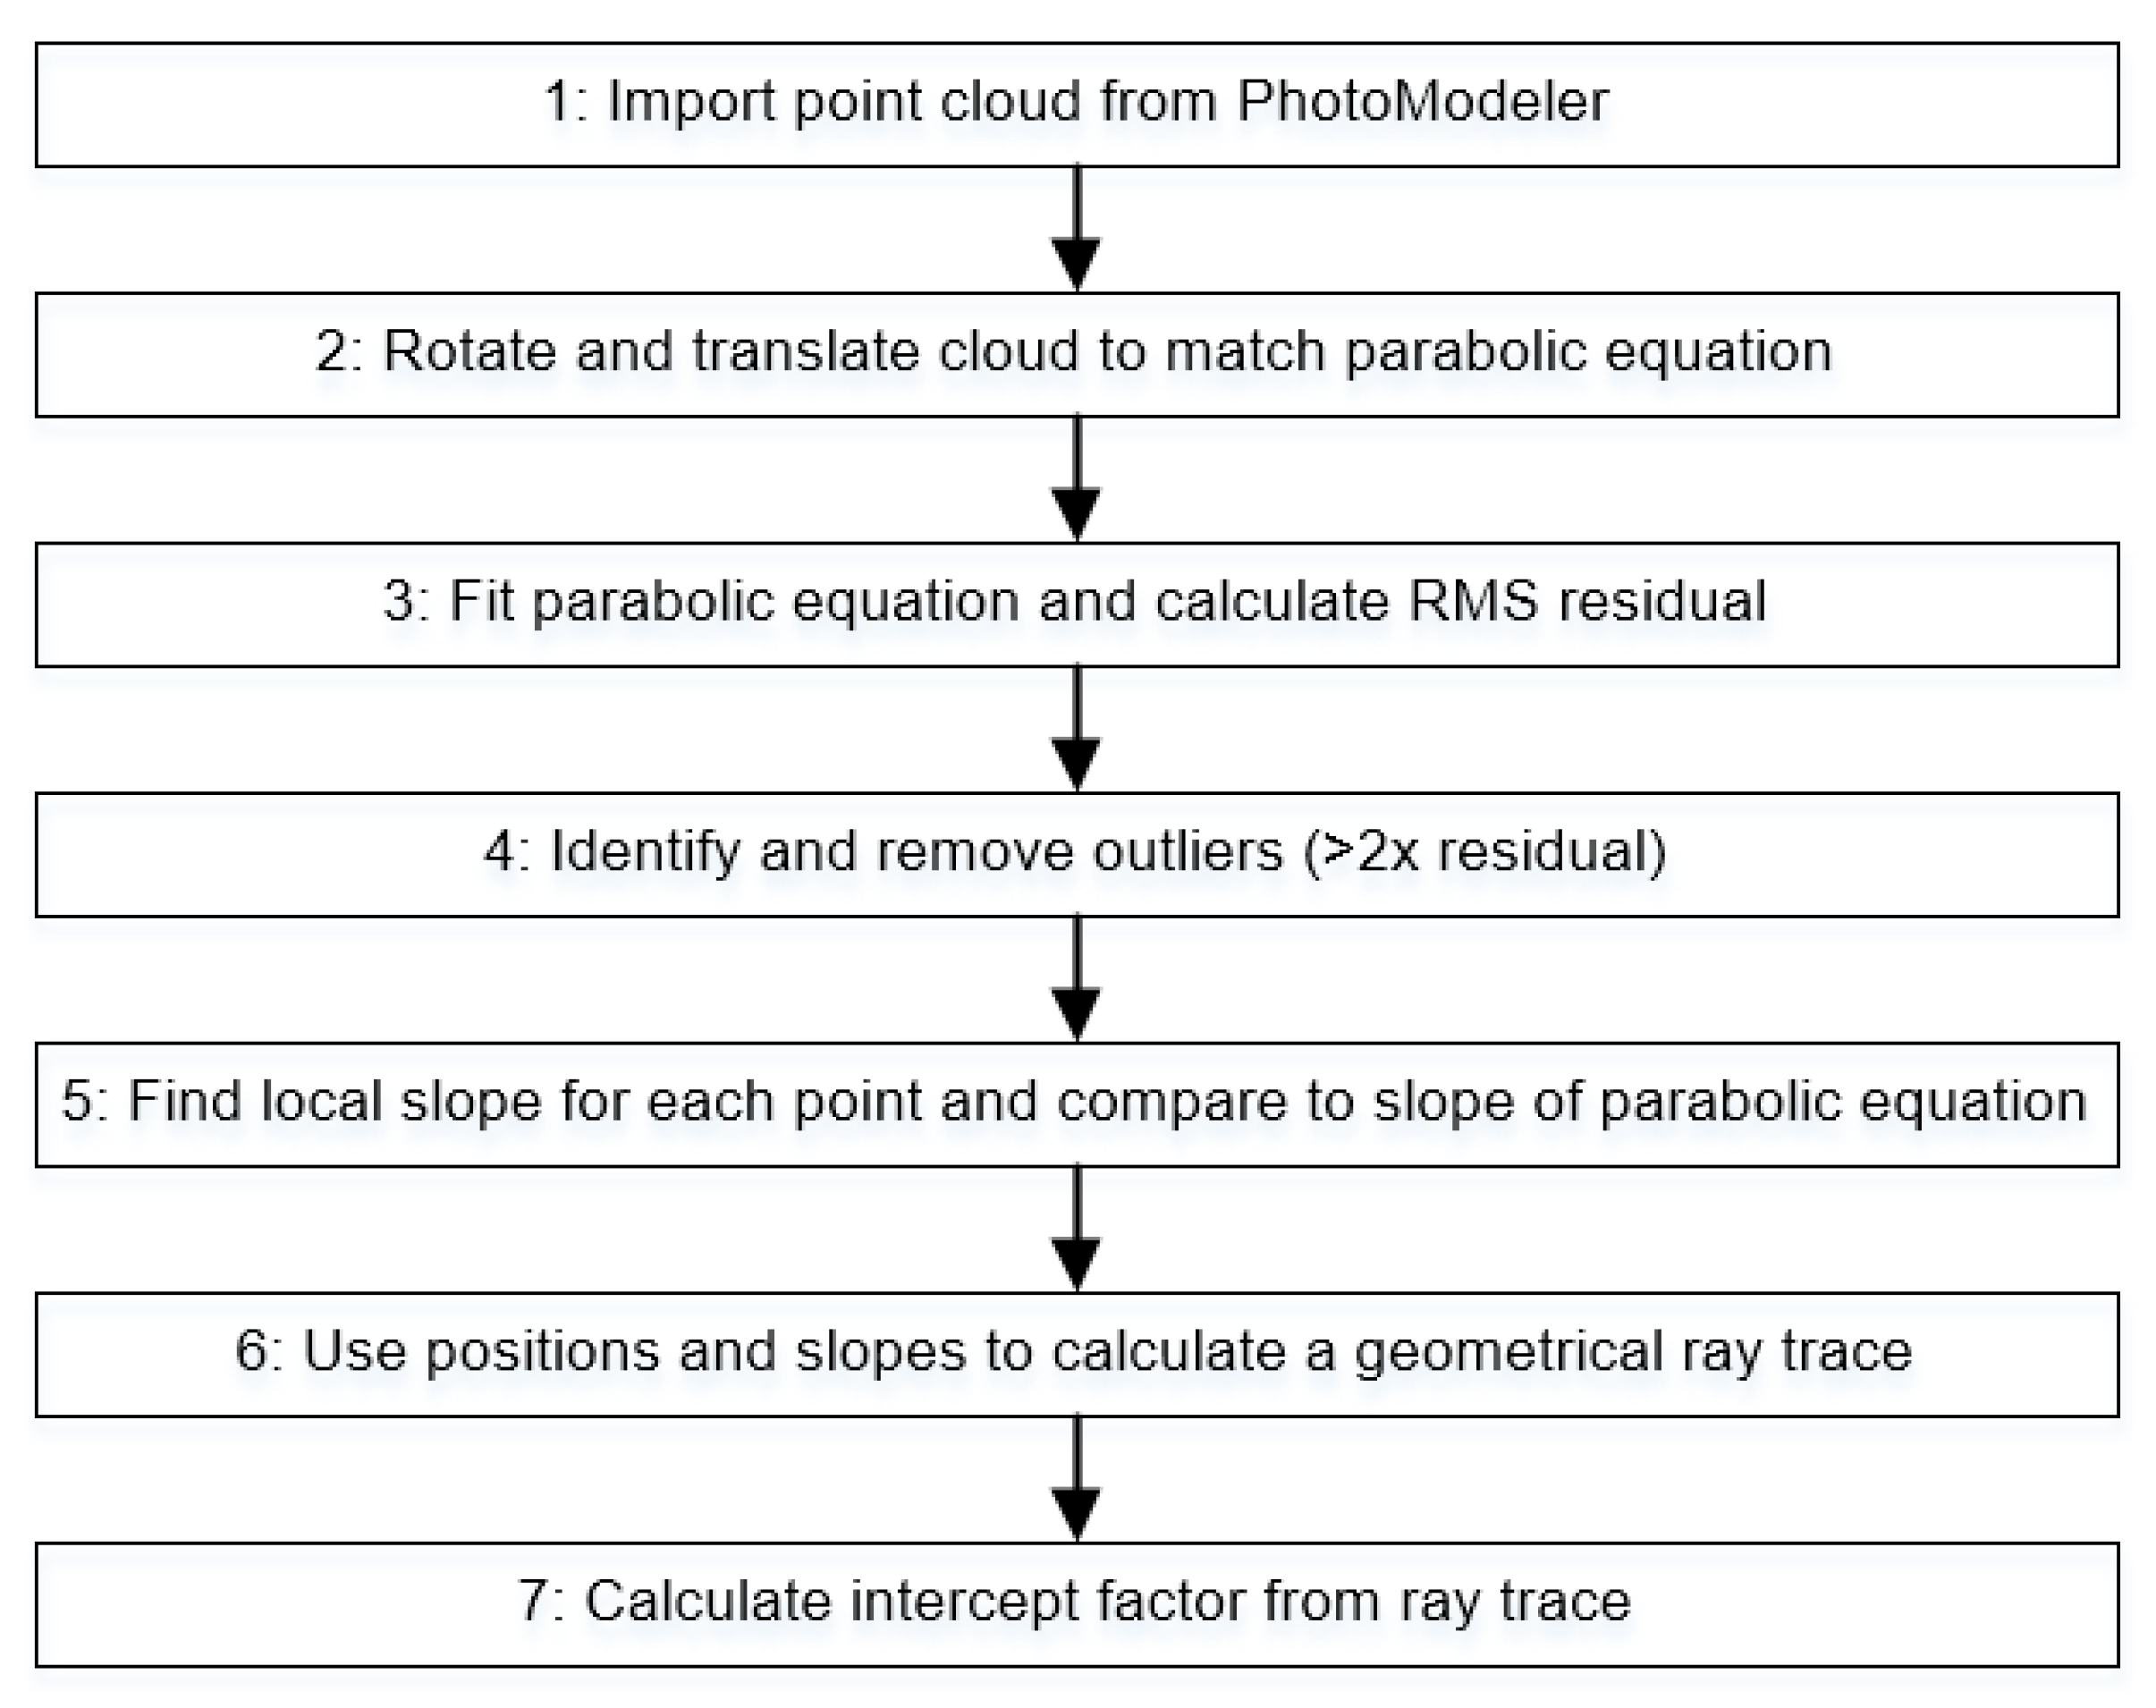
The local slope in the curved direction at each measured point was calculated from the photogrammetry point cloud data by interpolation between neighboring points. The deviation of this measured slope from the ideal slope calculated from the parabolic equation was then found to produce a slope error map for the photogrammetry measurement, which is shown in
Figure 19.
The peak to valley slope error is 12 mrad, with an RMS of 2.7 mrad. The largest slope errors occur at the top and bottom of the mirror and are due to the incorrect focal length seen in
Figure 20. This slope error causes defocus, and it is in these regions that most of the mirror efficiency would be lost.
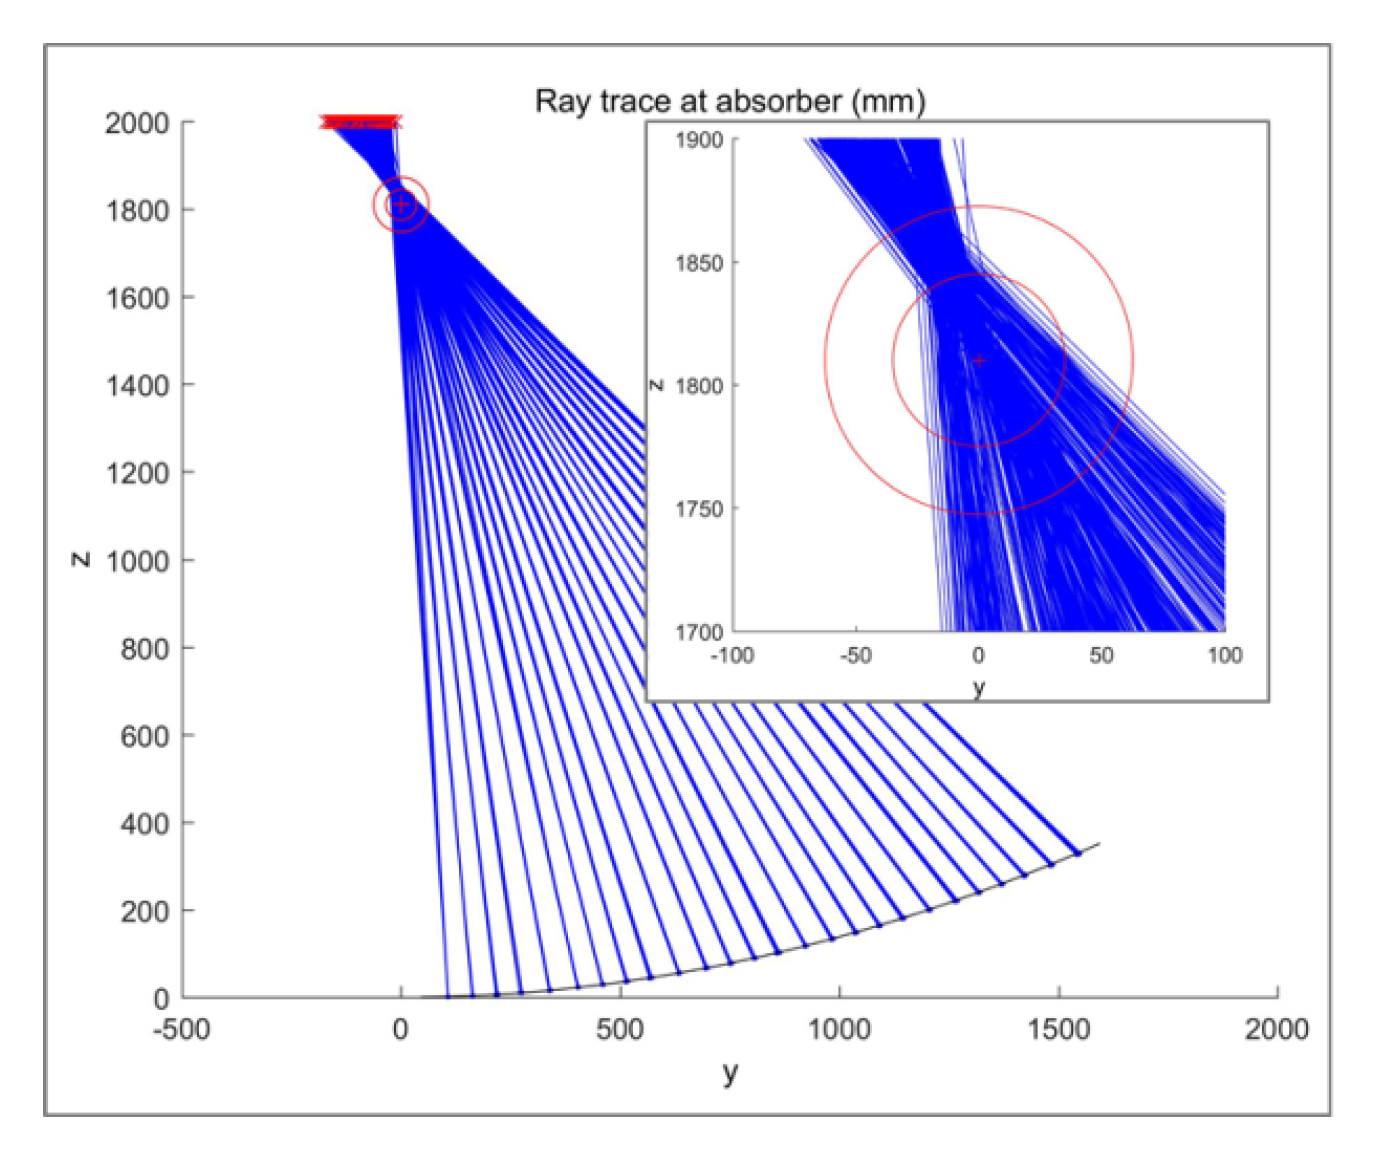
Performing a ray trace by using the calculated slopes of the point cloud produces the images shown in
Figure 20. The inset figure details the absorber tube ideal location and shows both the inner steel and outer glass tubes. All the light rays appear to hit the steel tube, with a 100% intercept factor, but there is a clear difference in the focal position from the center of the tube.
3.4. Onsite Measurements
A measurement campaign was performed at the MATS plant, Borg El Arab, Egypt. At the time of measurement, this plant was in the installation phase and photogrammetry was used to qualify the mirrors. The mirrors were of the same type previously used for laboratory validation.
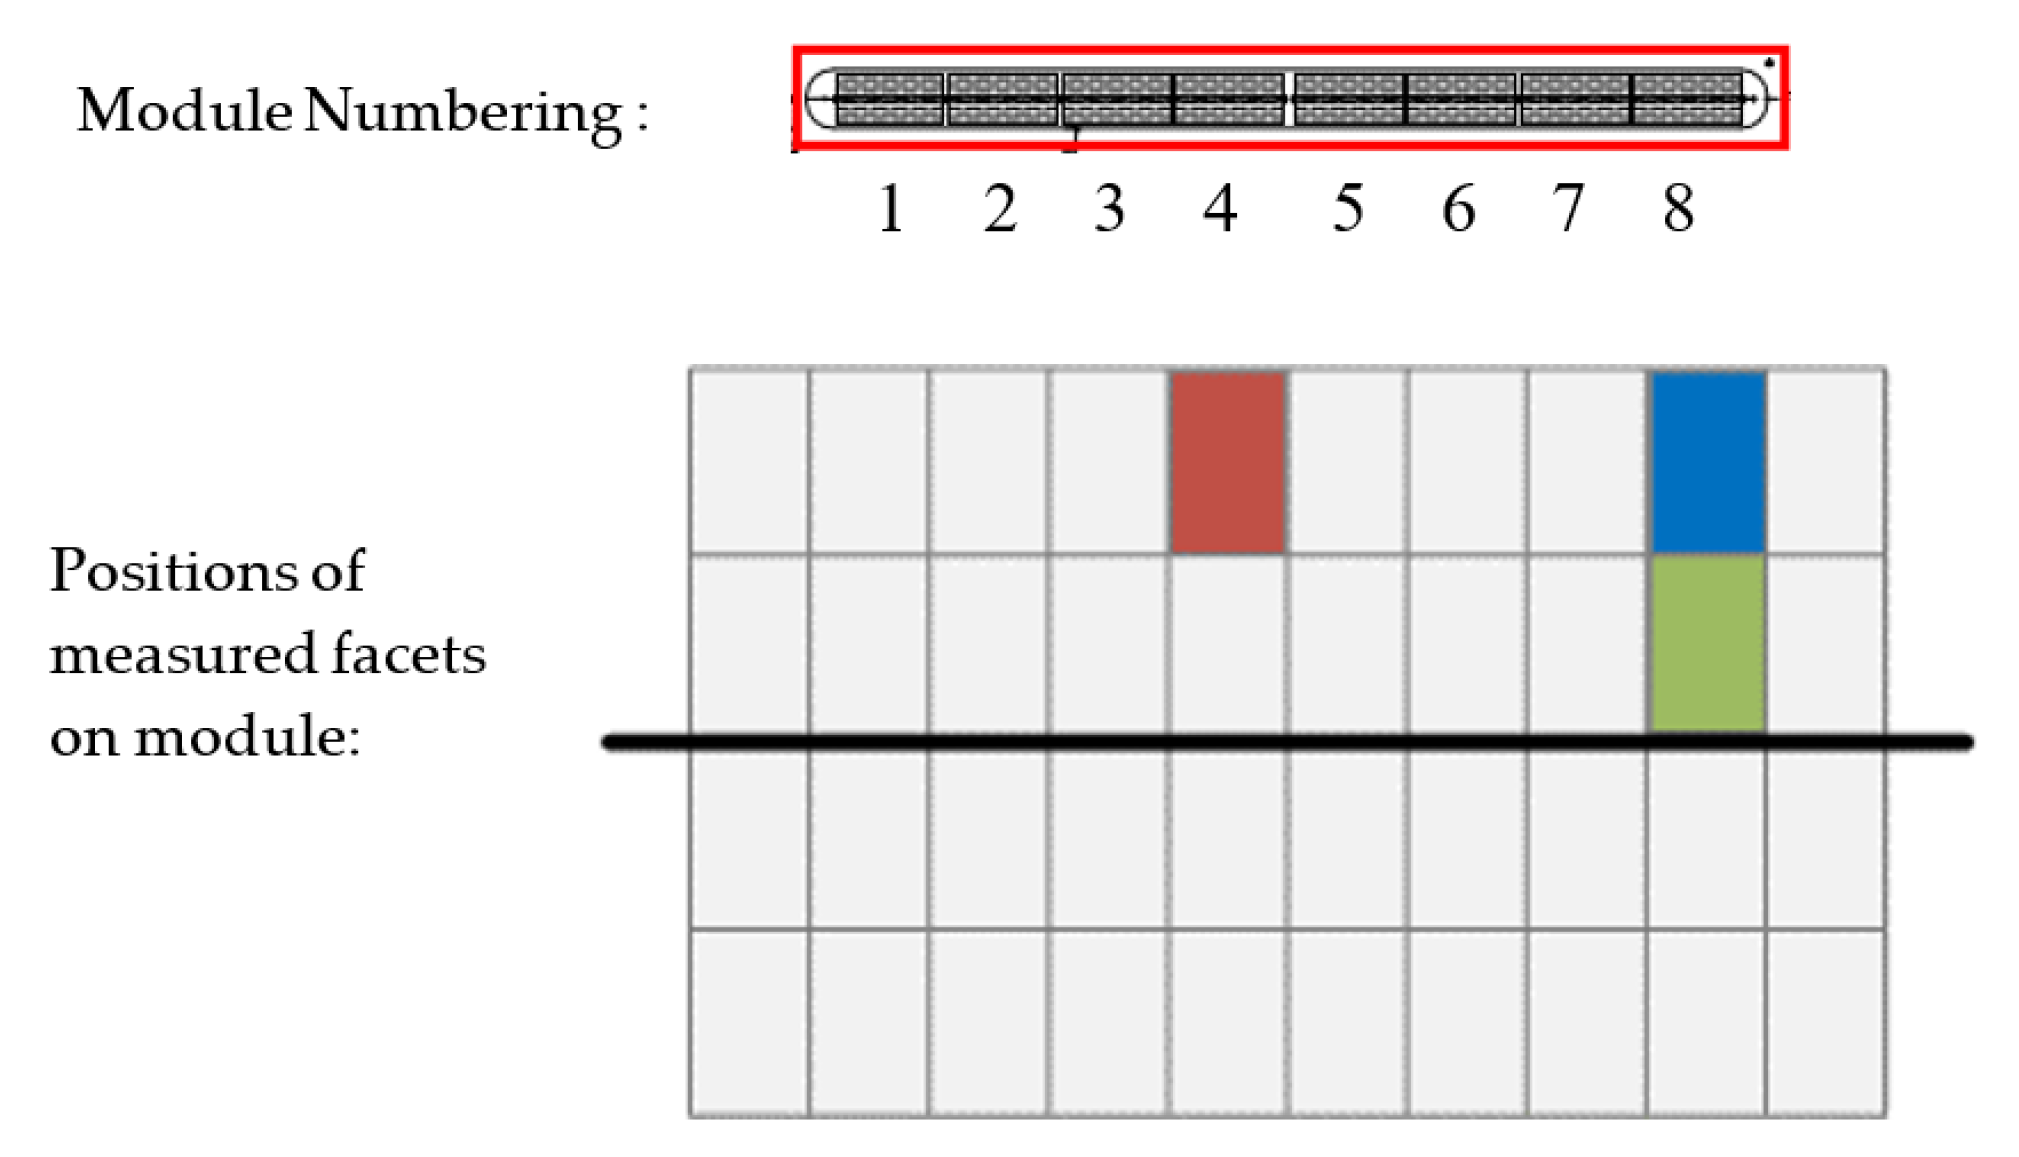
Measurements were done on four single facets, three outer facets and one inner facet across three collector modules in the same row. The facets measured are detailed in
Figure 21. Mirror 1 is located on module 4, and its position is shown in red, mirror 2 is located on module 3 and is in the same position as mirror 1 (red). Mirrors 3 and 4 are located on module 4 and are shown in blue and green respectively.
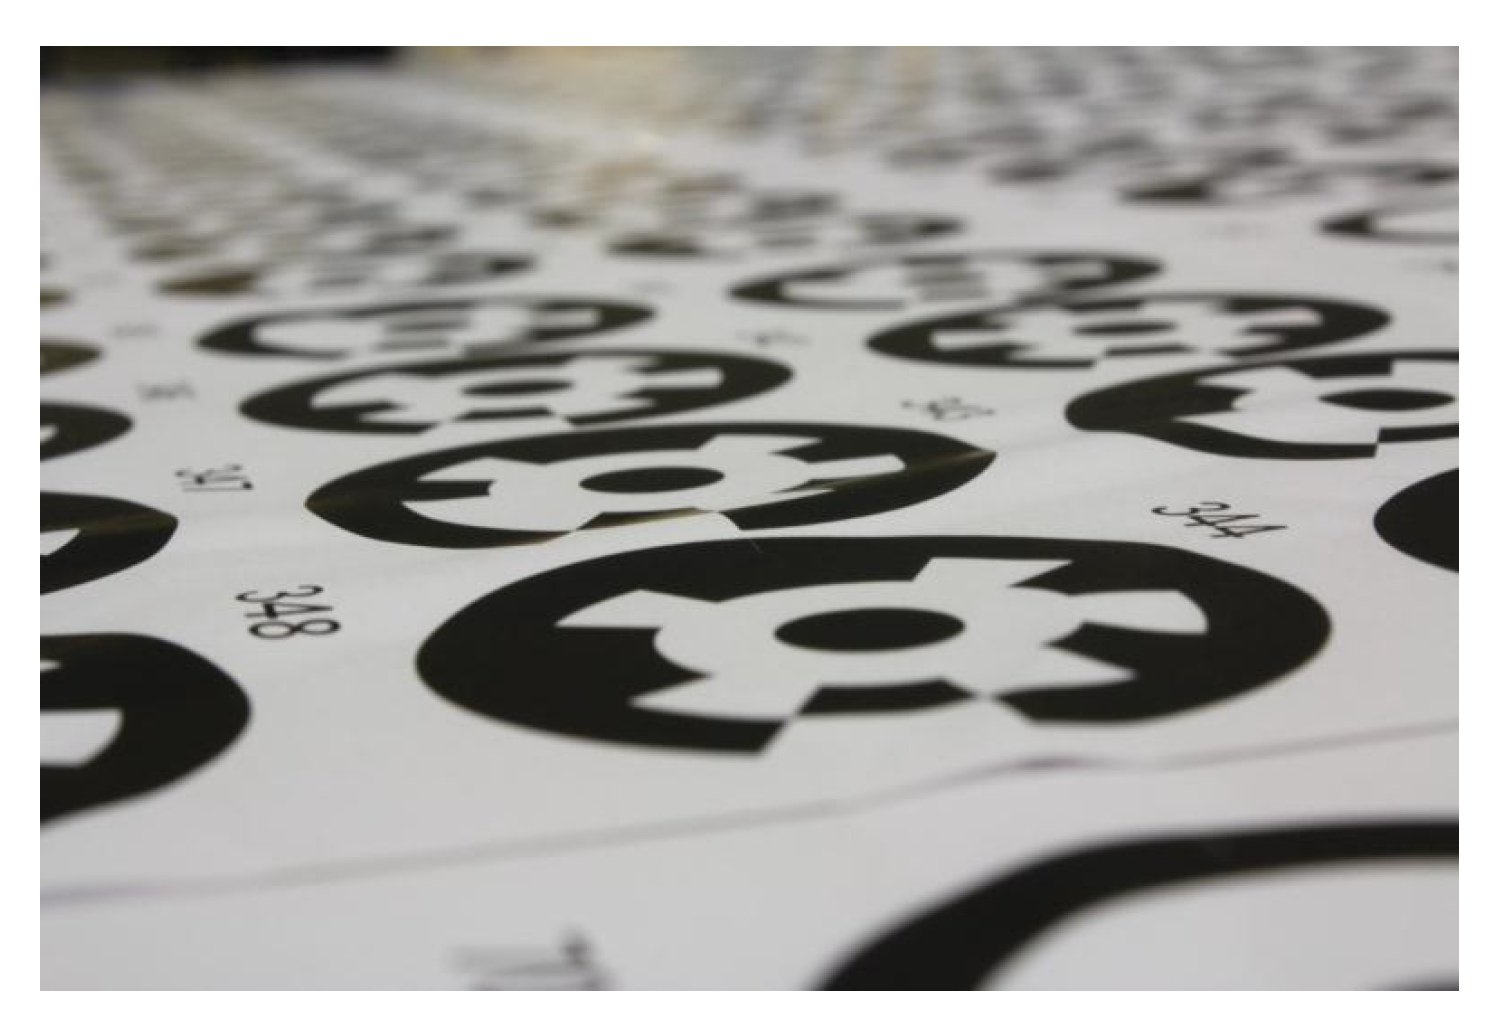
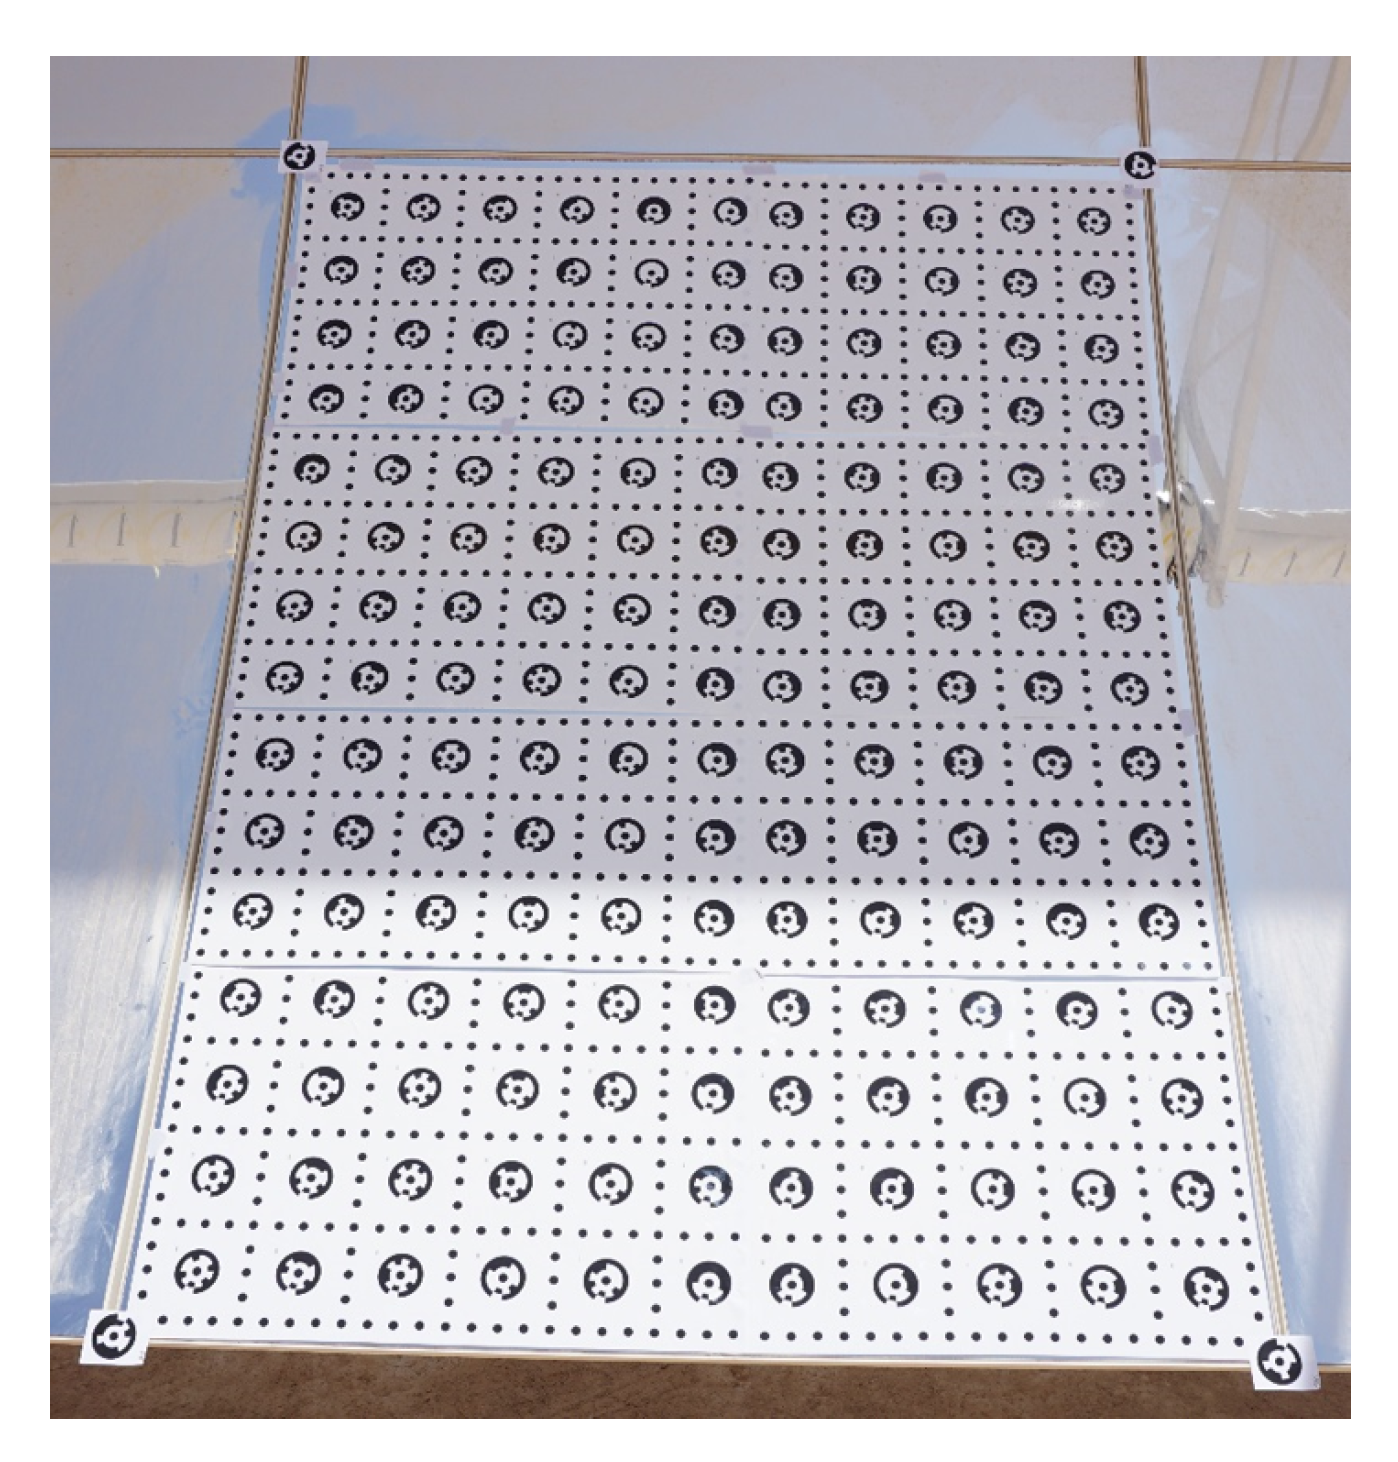
The facets were washed, dried, and photogrammetry target sheets with 10 mm diameter targets were attached to the surface. Additional targets were placed at the corners of the facets as reference points. The targets attached to the facet can be seen in
Figure 22.
Between 20 and 30 photographs were then taken from different positions around the facets and processed using the PhotoModeler software. The point cloud was imported into MATLAB and the parabolic equation with a focal length F of was fitted. The surface error map for each measurement was calculated by comparing the actual point position to the ideal surface. The point cloud was then interpolated to a 35 × 35 point grid to calculate the slope at each point. This was compared to the slopes of the ideal surface, and slope error maps were determined. The slope was then used in a ray-tracing algorithm to predict the path of light reflecting from the mirror towards the receiver tube. The distance of closest approach between the reflected light ray and the center of the ideally placed receiver was calculated as the defocus distance. The intercept factor was determined by counting the percentage of light rays with a defocus distance greater than the radius of the inner receiver tube.
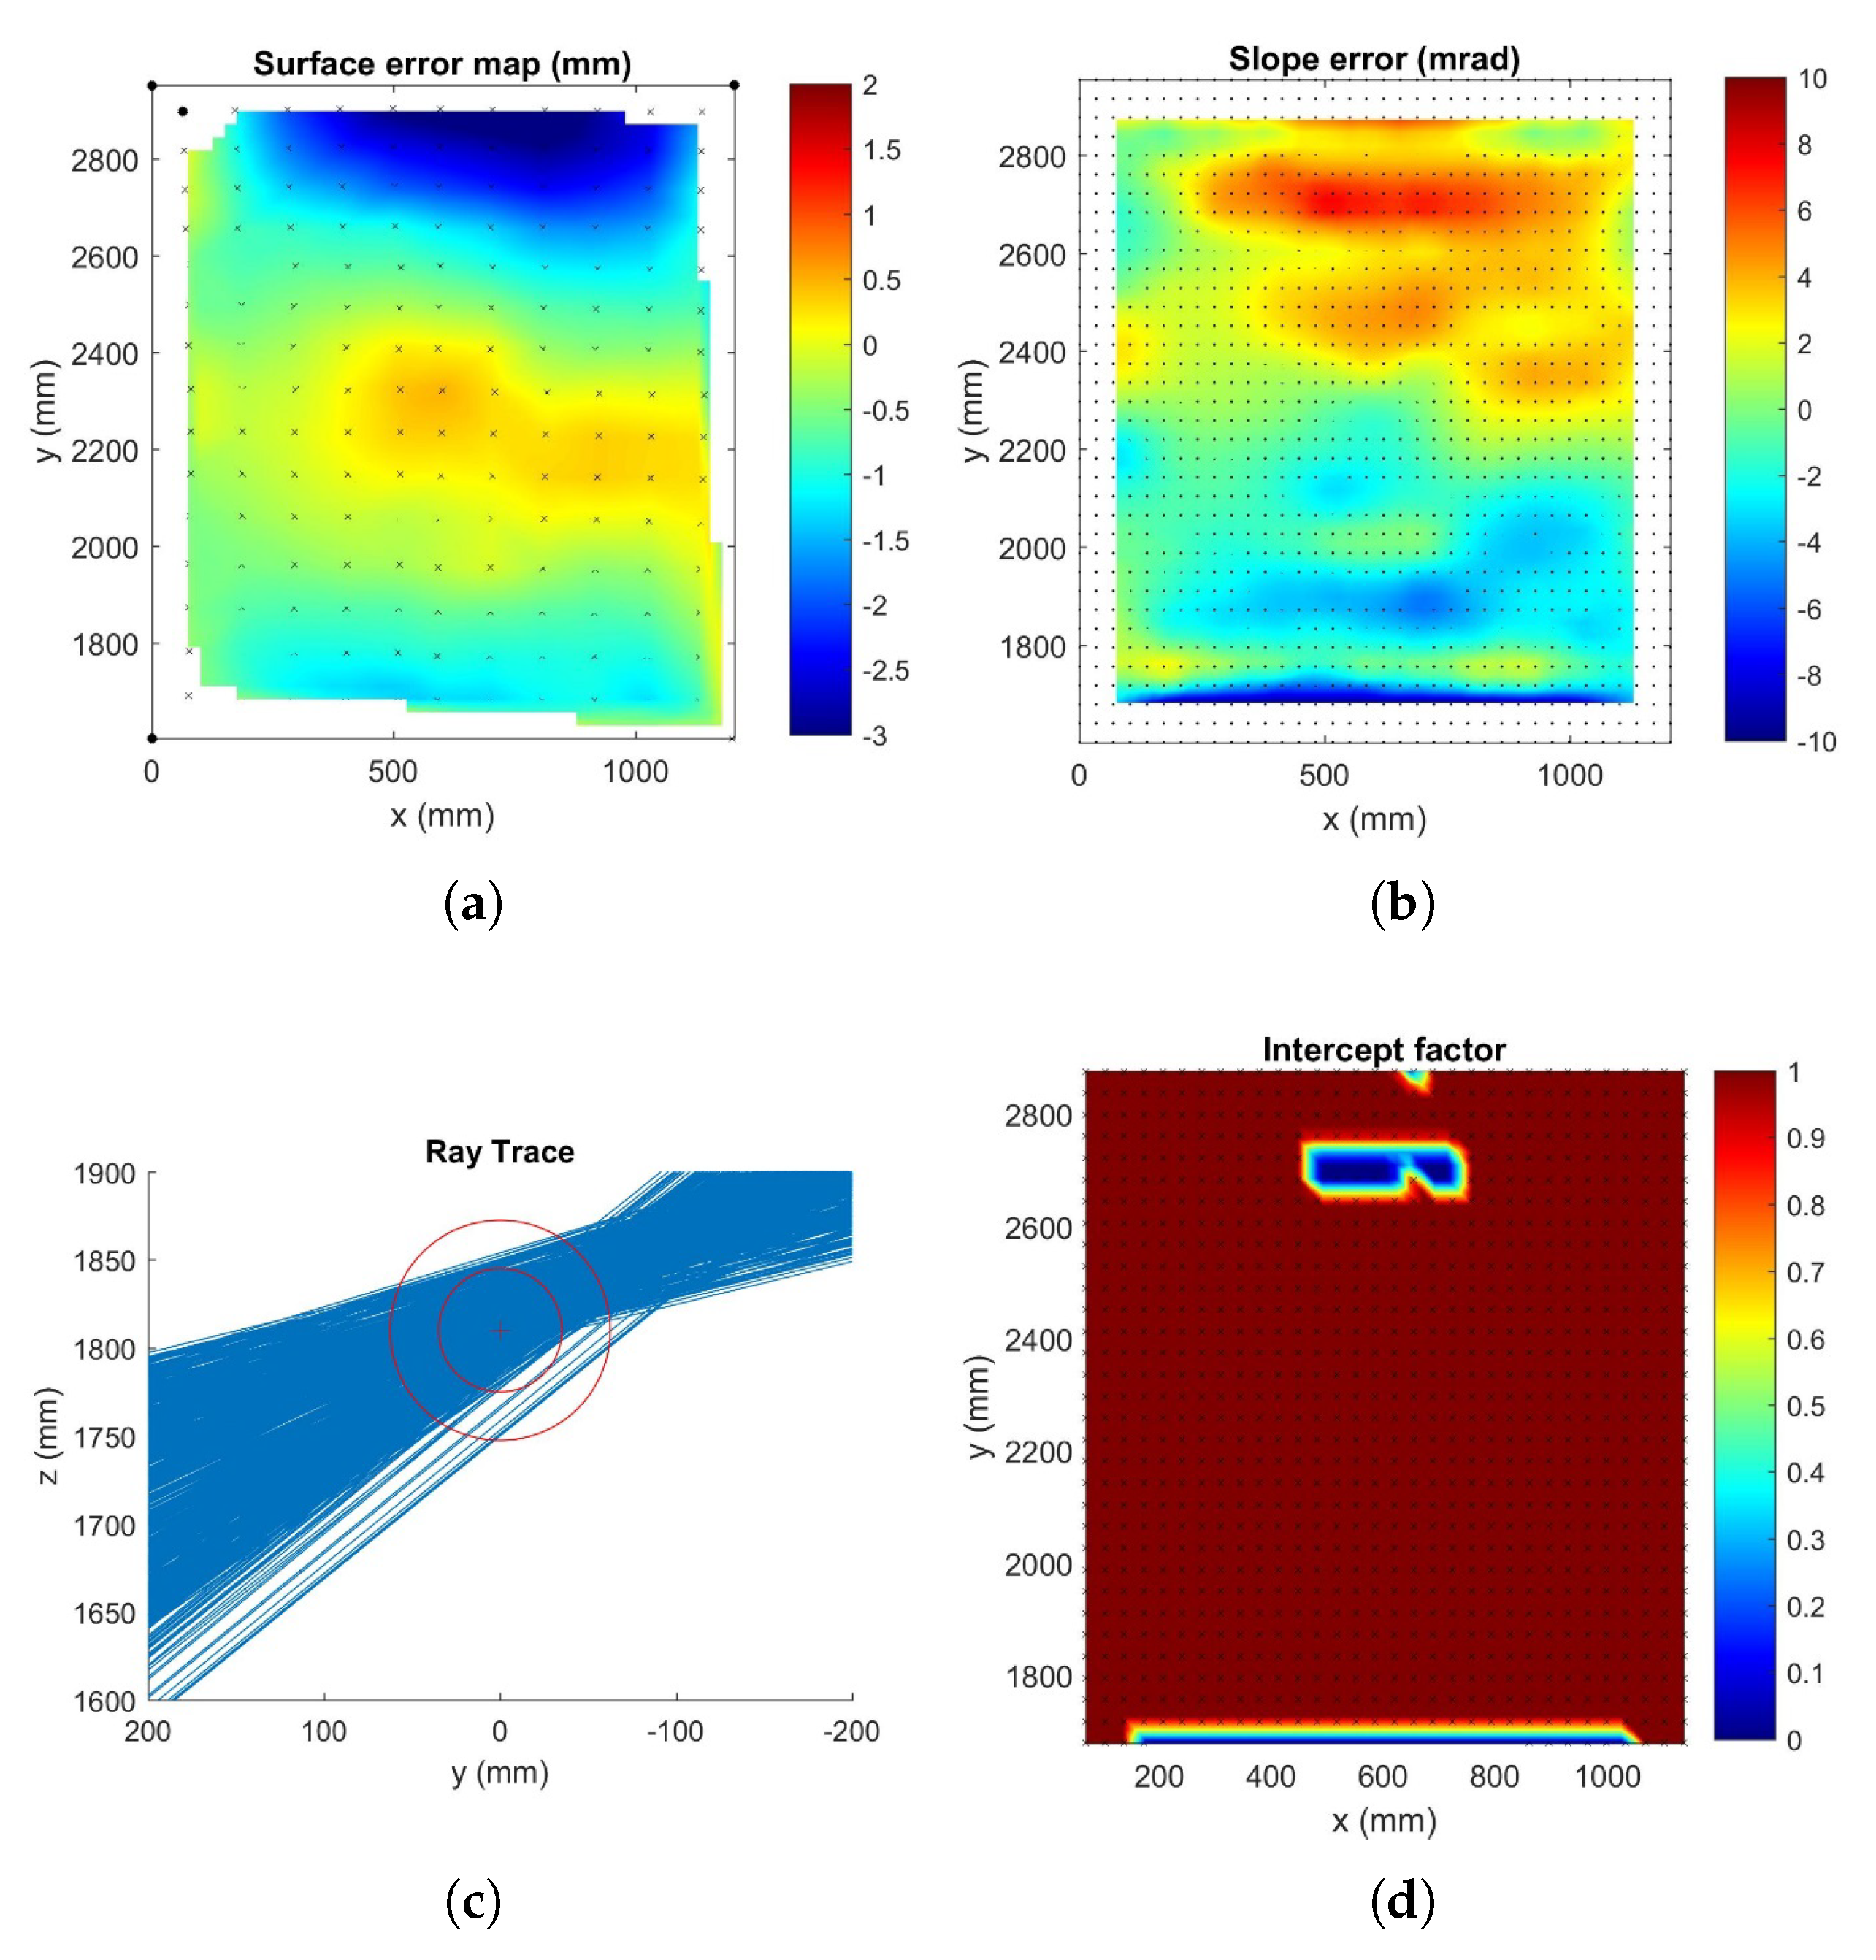
Outer mirrors 1, 2 and 3 had three repeat measurements each, and inner mirror 4 had two repeat measurements. The results of one of these measurements are shown in
Figure 23 below. The surface error map (
Figure 23a) shows the departure from the ideal shape. The slope error (
Figure 23b) was calculated by comparing the slope of the measured shape to the slope from the parabolic equation. The ray trace (
Figure 23c) was calculated using the slope of the measured shape. This ray trace includes the design position of the receiver tube, which was not measured. From this ray trace, the intercept factors were calculated including the shape of the sun, taken as a Gaussian with width 2.73 mrad. The variation of the intercept factor over the facet is shown in
Figure 23d. Finally the values for the RMS surface error, the RMS slope error, the RMS defocus (the distance away of each ray from the center of the tube), and RMS intercept factors were calculated.
The results show an average intercept factor of 92.5% for mirror 1, 85.6% for mirror 2, 92.0% for mirror 3 and 94.9% for mirror 4. The overall intercept factor across all mirrors is 91.3%. The detailed results for all measurements are shown in
Table 3.
