Article

A Reliability Check of Walkability Indices in Seoul, Korea

1
Department of Urban Planning, Keimyung University, 1095 Dalgubeol-daero, Dalseo-gu, Daegu 42601, Korea
2
Department of Forest Resources and Landscape Architecture, Yeungnam University, 280 Daehak-Ro, Gyeongsan, Gyeongbuk 38541, Korea
*
Author to whom correspondence should be addressed.
Sustainability 2020, 12(1), 176; https://doi.org/10.3390/su12010176
Submission received: 5 November 2019 / Revised: 10 December 2019 / Accepted: 20 December 2019 / Published: 24 December 2019
(This article belongs to the Special Issue Walkable living environments)

Abstract

:
The purpose of this study is to evaluate walkability levels using popular indices and check the measurement reliability between those indices. This study evaluates the city of Seoul, using 100 × 100 m grid points (N = 44,000) as spatial units of analysis. In this study, four types of indices were used to measure walkability levels: Walkability index (WI), Walk score (WS), Pedshed (Ps), and Movability index (MI). This study utilizes Pearson’s R, Brand–Altman plot with limit of agreement (LOA), and intraclass correlation coefficient (ICC) as reliability check methods. The measurement reliability among the four indices was found to be relatively high. The Pearson’s R values were between 0.308 and 0.645, and the range of inside LOA of Brand–Altman plots was 94.5% to 95.5%. The ICC value of the four indices was 0.544, indicating moderate reliability. The results reveal a relatively high level of measurement reliability between the four indices. On the basis of this study’s results, the level of walkability in other cities in Korea can be ascertained. The study may provide future direction for walkability index development that considers urban environmental characteristics. From the results, we expect that future urban planning and policies will aim to improve walkability.

1. Introduction

As health problems such as overweight and obesity become more serious, various studies and policies are being conducted and implemented in many countries to promote physical activity in urban environments [1,2]. Many studies showed that the structure of urban environments affects walking [3,4,5], physical activity [5,6,7,8,9,10,11,12], and obesity [9,10,13,14]. Improvements in the built environment can function to encourage people to walk and to be physically active in their daily lives, and could thus have a positive effect on residents’ health condition [15,16,17]. Korea is not free from this health issue, the Community Health Survey of Korea revealed that the rate of walking has decreased from 50.6% (’08) to 39.7% (’17), and the rate of obesity has increased from 21.6% (’08) to 28.6% (’17) over the past decade [18]. This increase in obesity and sedentary lifestyle patterns has emerged as a social problem in Korea, which has led to studies on pedestrian-friendly urban environments [19,20,21].
According to a sample survey of daily traffic logs using GPS, the total daily time spent in traffic by Seoul citizens is 91.0 min, walking traffic accounts for 42.5 min of this time (47.0%) [22]. This indicates that walking is an important part of Seoul citizens’ daily lives. Thus, creating a pedestrian-friendly environment has become a priority. The city of Seoul recently announced a mid- to long-term plan for promoting walking over the next five years. This plan was developed on the principle of creating an urban environment that prioritizes walkers throughout Seoul [23].
According to data from the 2017 Community Health Survey, the obesity rate in Seoul was the lowest of 17 metropolitan cities and provinces at 25.5%, while the rate of walking was the highest at 61.5% [18]. This indicates that Seoul citizens’ health behaviors are relatively good. Thus, it was determined that measuring the walkability of Seoul’s environment and utilizing these data in various research and policies would be useful. By measuring walkability to identify the spatial distribution characteristics of the walkability level, the city government will be equipped to establish urban planning and transportation policies to enhance citizens’ walking. For example, it is expected that various urban planning policies (e.g., the improvement of pavements on pedestrian roads, the installation of pedestrian-only streets, and improvements in the traffic signal system for pedestrians) could be developed to improve neighborhood environment of the area by identifying the vulnerable area of walking.
Among the studies on building pedestrian-friendly environments, some have attempted to develop walkability indices that measure pedestrian urban environments [24,25,26,27,28]. However, only a few studies of walkability have been conducted in Korea [28]. For example, the walk score, which is widely used as a walkability index in various fields in the US, such as real estate, urban planning, transportation engineering, and public health, provides data on cities in the United States, Canada, Australia, and New Zealand only. Walk score data are not available for Asian and European cities. Research on the development of a walkability index has only recently emerged in Korea.
One purpose of this study is to measure walkability levels in Seoul, Korea. This will help develop various policies within the fields of urban planning, urban design, and transportation to promote walking. It is important to select the appropriate index to measure walkability levels. Many previous studies have used several indices to measure walkability at the neighborhood, community, and city levels. Thus far, approximately 80 or more walkability indices have been used [29], and it is very important to choose an appropriate index to measure the walkability level of a specific area. Many studies have attempted to determine how urban forms affect walking, and these variables have been grouped into five categories, which are collectively referred to as the five Ds (density, diversity, design, destination accessibility, and distance to transit) [30].
One study suggested eight walkability indices that correlate with active transport: Walkability index (WI), walk score (WS), walk opportunity index (WOI), pedshed (Ps), extended walkability index (EWI), movability index (MI), neighborhood destination accessibility index (NDAI), and pedestrian index of the environment (PIE) [31]. These eight indices have different components, but some are similar. It is notably difficult to choose which of these is the most effective index to use. In recent walkability studies, WI, WS, Ps, and MI have been used often [5,26,31,32,33]. These four indices also relate to active transport behavior as well as the five Ds.
The WI was developed by Frank et al. [34] and is the most popular measure in urban planning and active living literature [5,35]. The WS was developed by a commercial company in Seattle, US [36] and is one of the most popular indices. It is based on a measure of access to nine types of destinations (e.g., grocery, coffee shop, restaurant, etc.). Pedshed is a commonly used index to represent accessibility and measures the area accessible through the street network as a percentage of the area [26,31]. The MI is developed on the basis of the existing WI but is intended to include movability in the WI. It includes accessibility to recreational facilities such as playgrounds and sports facilities [32]. Are these indices reliable? To answer this question, we must calculate the walkability of Seoul using popular indices including WI, WS, Ps, and MI and confirm the reliability of the indices. While a significant amount of research has been conducted on the development of walkability indices, little research has been conducted on their measurement reliability, which is what this study attempts to address.
Reliability is determined by consistency, stability, dependability, reproducibility, predictability, and lack of distortion. High reliability means that the same or comparable measuring instrument can produce the same or similar results if the same set of objects is measured repeatedly [37]. On applying the concept of high reliability in this study, regardless of the index used to measure the level of walkability of Seoul, the results should be the same or similar.
Reliability assessment is a general practice of conducting analyses such as test-retest, intra-rater, and interrater reliability on survey data. However, there are some studies to measure the inter-method reliability [38,39,40]. This research is also an inter-method reliability study of the walkability level. It examines the reliability among the indices that measure the level of walkability in Seoul and considers the possibility of applying them to measure the walkability in other cities in Korea. If there is no reliability between the indices, research methods can be examined on the direction of index development to suit the conditions in Korea.
As mentioned earlier, not only has the walking rate of the average Seoul citizen increased steadily over the past decade, but the city government has also continued to implement policy efforts to create a pedestrian-friendly urban environment. Thus, reliable measurement methods for examining the walkability of Seoul’s built environment are necessary. The purpose of this study is to calculate the level of walkability in Seoul, Korea, using WI, WS, Ps, and MI and to further check measurement reliability between those indices.

2. Materials and Methods
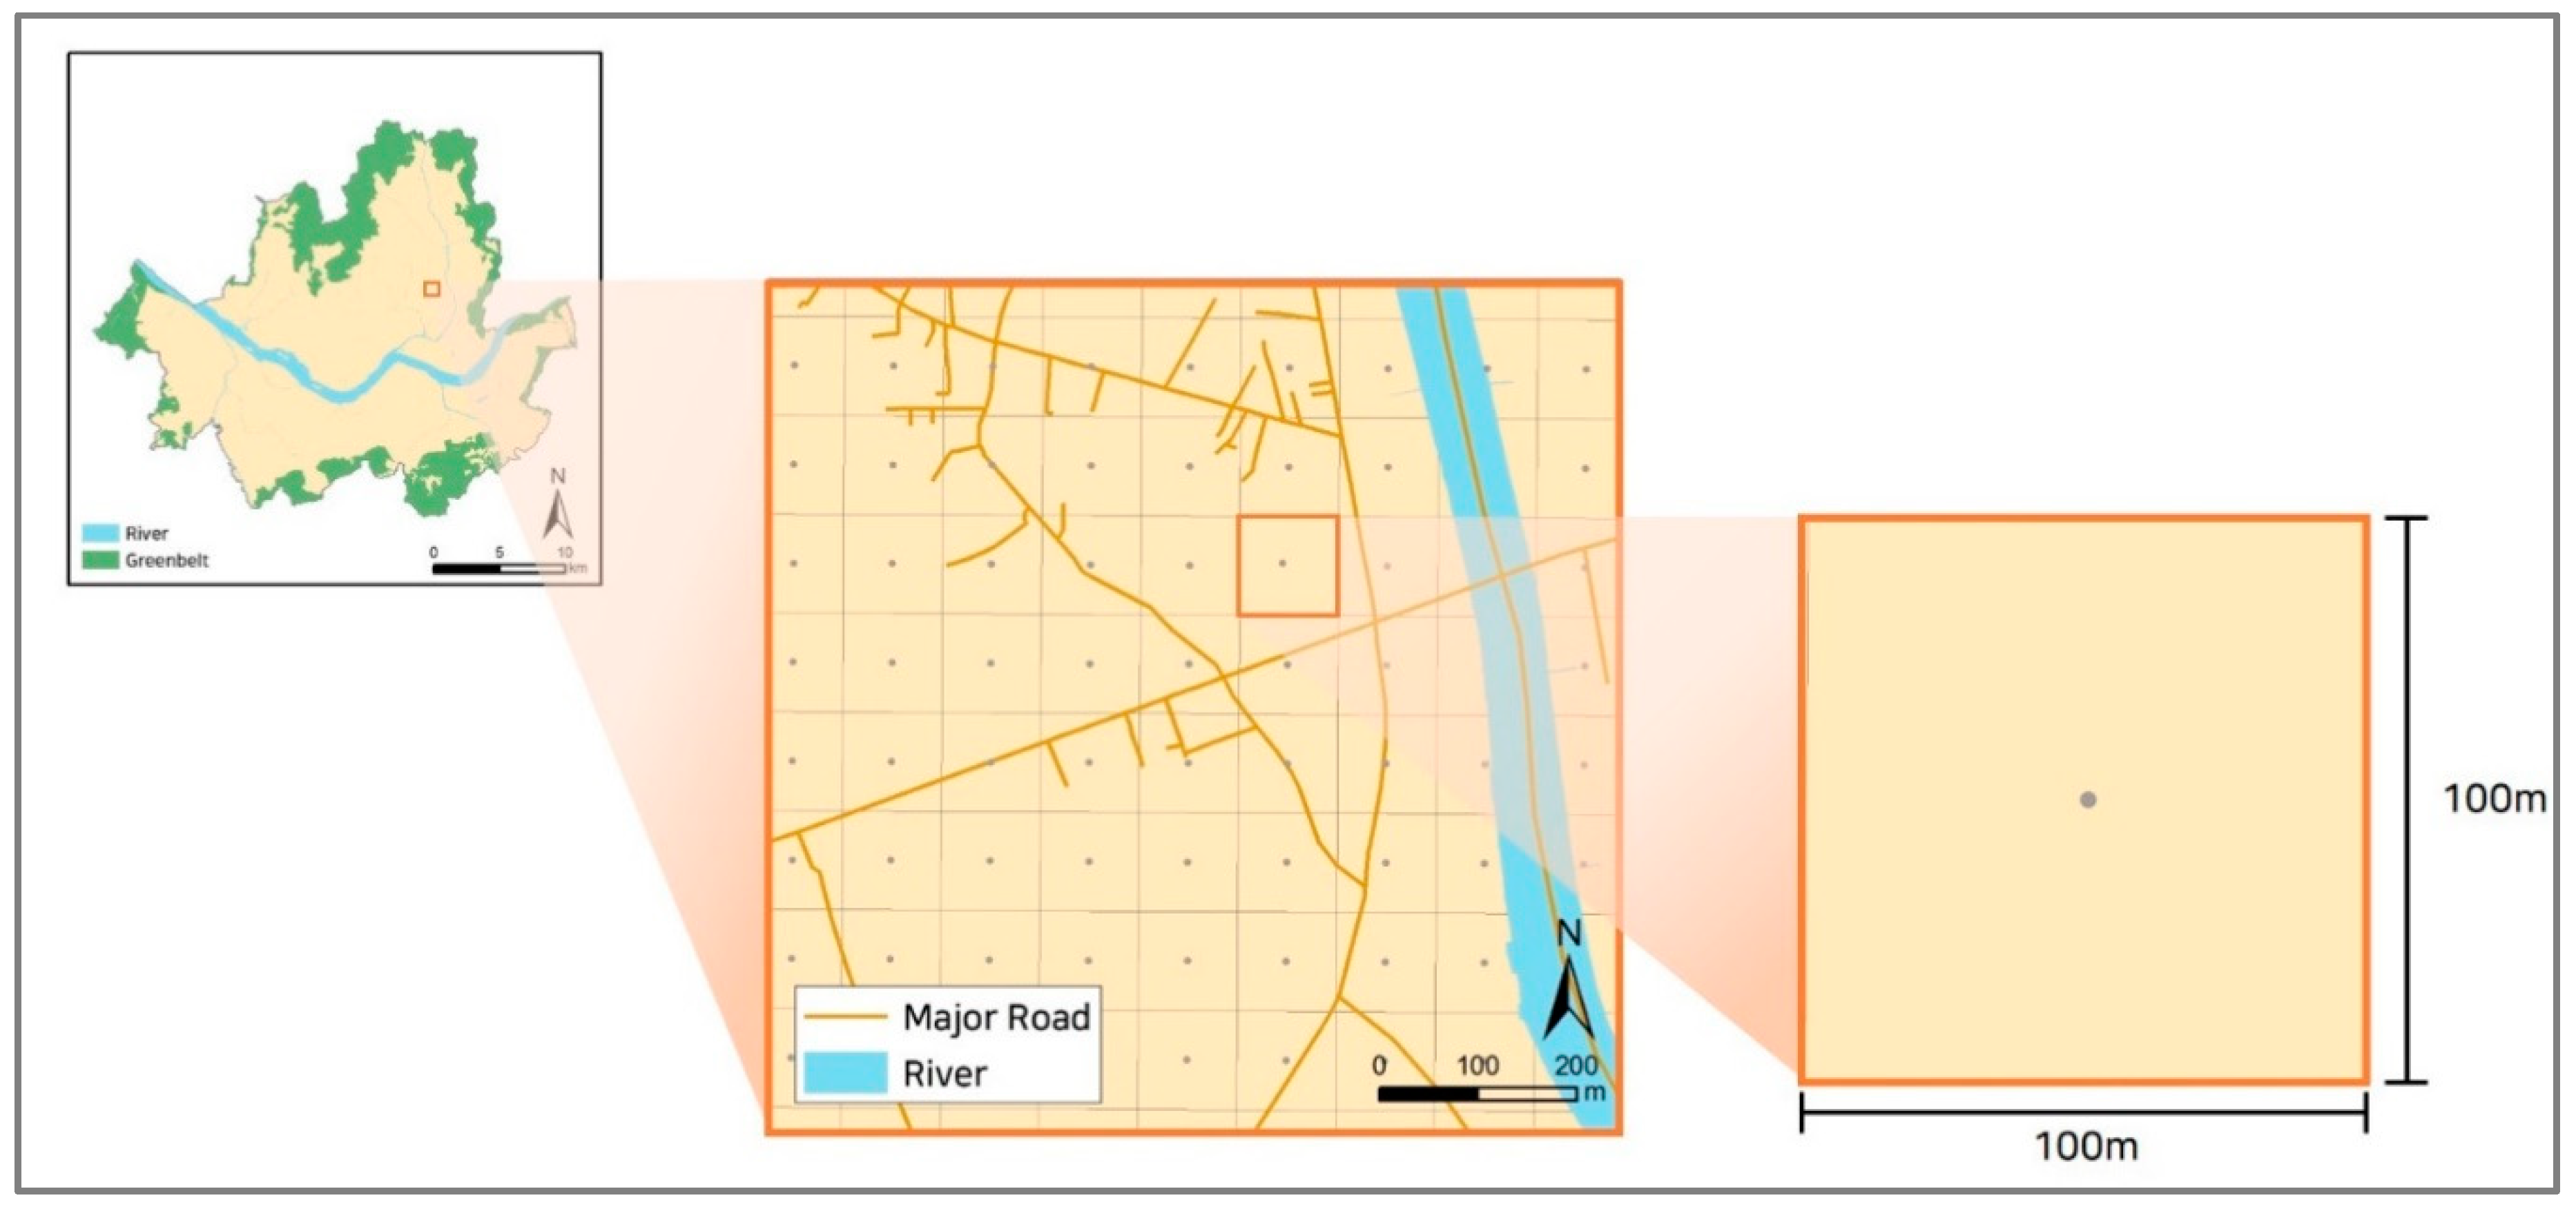
2.1. Study Area

This study examined Seoul, which is the capital of Korea and the nation’s leading financial, cultural, and social center. Seoul has an area of 605 km2, accounting for only 0.6% of the country’s total area, but about one-fifth of the country’s total population (19.0%) reside in the city. The number of businesses (N = 822,863) and workers (N = 5,119,913) in Seoul accounts for 20.5% and 23.7% of the whole country’s businesses and workers, respectively. Moreover, gross regional domestic product (GRDP) in Seoul (372 trillion won, approximately US$307.6 billion) accounts for 21.5% of Korea’s national GDP as of 2017 [41]. These figures are the highest out of 17 metropolitan cities and provinces across the country and clearly indicate the scale of Seoul’s economic power compared to other regions in Korea.
The target area includes all of Seoul, excluding rivers and greenbelt areas, from the city’s total area of 605 km2, 437 km2 was examined. There has been much discussion on the unit of neighborhood in the area of urban planning and design. Perry suggested a walking distance of a quarter-mile (400 m) as the radius of the neighborhood unit [42]. Several studies have taken Perry’s suggestion and used the 400 m radius, which is “5-min walking distance”, to measure the level of walkability [43,44,45]. Zhang et al. (2019) used a grid point with an interval of 150 m to measure the walkability of the Futian district in China. This is because a 150 m interval was utilized in the original Walk Score calculation method [46]. This study used a spatial unit that was equal to or smaller than 400 m, taking into account the previously used walking distance. Furthermore, taking into account the research of Zhang et al. (2019), which measured walkability similarly to this study, we utilized a grid point with a 150 m interval or smaller.
The study area and spatial units of analysis are shown in Figure 1. As the size of spatial units of analysis decrease, the accuracy of the study increases. However, the duration of the analysis also increases because of the higher number of samples. After several attempts to identify rules based on experience, the spatial units of analysis for this study were chosen to be 100 × 100 m grid points (N = 44,000).

2.2. Materials: Data

As discussed earlier, it is important to choose an index to measure the level of walkability. This study derives walkability indices that meet the following conditions. First of all, built environmental variables associated with walking behavior should be included [2,31,34,47]. The walkability index should be able to measure the built environmental condition to quantify walking. Second, indices that can be objectively measured using GIS will be considered. This is because measuring the level of walkability using GIS rather than using the subjectively measured survey data can ensure objectivity [27,32,34,47]. Third, the most popular measures of neighborhood environment walkability in previous studies can be considered. Recent studies have shown a tendency to select commonly used indices [2,5,26,31,32,33,35,48]. Finally, built environmental variables related with the five Ds (Density, Diversity, Design, Destination accessibility, and Distance to transit) of urban forms can be considered [30]. This is because these five Ds of urban forms are important factors affecting walking behaviors in neighborhoods.
In this study, four types of indices were used as walkability measures: WI, WS, Ps, and MI. This is because they meet the four requirements as walkability indices of this study. They are the most popular measures of neighborhood environment walkability in previous studies using GIS [5,26,31,32,33]. Moreover, these four indices are correlated with active transportation behaviors and the five Ds of the urban form. Table 1 presents the five Ds in relation to the four selected indices.
Both the WI and the MI are indices calculated based on standardized values. The WI is the sum of four physical environmental indicators: Intersection density (intersections per unit area), residential density (the ratio of residential units to the land area devoted to residential use), retail floor area ratio (retail building floor area divided by retail land area) and land use mix (entropy score, the relative percentage of two or more land use types within an area). The MI is a combination of standardized values of three urban forms: Street connectivity (density of four urban forms, i.e., sidewalks, bikeways, intersections, and public transit stations), destination density (density of three destinations, i.e., public playgrounds, sport facilities, and green spaces), and urbanization level (land use mix and residential density). Meanwhile, the WS is a score (Range: 0–100) that represents the accessibility from each point to nearby walkable amenities. The Ps, pedestrian catchment, is expressed as the area reachable via the network/Euclidian buffer. More detailed expressions, measures, and data sources of these indices are shown in Table 2. This study used data collected in 2017 and utilizes data from the nearest year if no data are available in that year. In particular, the values of WS came from the preceding study produced by Kim et al. [49], and the values of the other three indices (e.g., WI, Ps, and MI) were calculated in this research.

2.3. Methods

The assessment of reliability depends on the scale of measurements. The agreement percentage and the Kappa statistic are typically used when addressing categorical variables. However, when continuous variables are considered, Pearson correlation coefficient (Pearson’s R), Intraclass correlation coefficient (ICC), Brand–Altman plot with limits of agreement (LOA), and coefficient of variance can be used [57,58,59,60,61,62,63]. As the scale of measurement in this study is continuous, Pearson’s R, Brand–Altman plot with LOA, and ICC were chosen as reliability measures. These three methods are basically techniques to verify the consistency between measurement objects. This study examines the reliability among four walkability indices (e.g., WI, WS, Ps, and MI) using these methods.
Pearson’s R is a measure of the correlation between two variables. This method was selected because of the ease with which calculations can be made and understood.
The Brand–Altman plot is a scatter XY plot in which the X-axis represents the mean of two measures ((A + B)/2), and the Y-axis represents the mean difference of two measurements (A-B). This plot conveniently and clearly displays comparisons between pairs of measurements [58,59,60]. This plot has been widely used in medical and public health studies and was selected to visually analyze the agreement between walkability indices.
The Brand–Altman plot displays three horizontal lines parallel to the X-axis, which reflects the degree of inconsistency. The middle horizontal line represents the mean difference ( d ¯   ). The calculation formula is as follows:
d ¯ = 1 n k = 1 n d k
Variance is estimated from the standard deviation of the difference between measurements, 95% LOA calculates range by adding and subtracting 1.96 S d from the mean difference. The line above the middle line (mean difference) represents 95% upper LOA, and the line below the middle line is 95% lower LOA. The calculation formula of LOA is as follows:
d ¯ ± 1.96 S d
Moreover, ICC was selected to check reliability among walkability indices. The ICC is a widely used index for reliability assessment, such as test-retest, intra-rater, and interrater reliability analyses [61]. In particular, the ICC is used in inter-method reliability in some literature [38,39,40]. This study uses the ICC to measure inter-method reliability between four indices of walkability. The ICC is used to determine the consistency of measurements (reliability): A higher ICC indicates greater consistency [62]. In measuring the degree of agreement between variables, Kappa statistics are used for categorical variables, whereas the ICC is used for numerical or quantitative variables [63]. Generally, ICC values should be greater than 0.4 to be considered reliable (0.4–0.6: Moderate reliability, 0.6–0.75: Good reliability, 0.75–1.0: Excellent reliability) [64]. Even if the ICC value is relatively small, a large sample can be considered statistically significant [63,65]. Since the sample size is big and the variables are numerical, ICC can be used to measure reliability among walkability indices. The calculation formula is as follows:
I C C = σ 2 b σ 2 b + σ 2 w
where σ 2 b is the between-cluster component of variance and σ 2 w is the within-cluster component of variance.

2.4. Data Analysis

Four walkability indices were calculated according to the expression and measurement stated in Table 2, using ArcGIS 10.6. Spatial descriptive statistics and hotspot analyses of four indices also utilized ArcGIS 10.6. For the reliability check among walkability indices, Pearson’s R, Brand–Altman plot with LOA, and ICC were generated using the SPSS Statistics 2.5.

3. Results

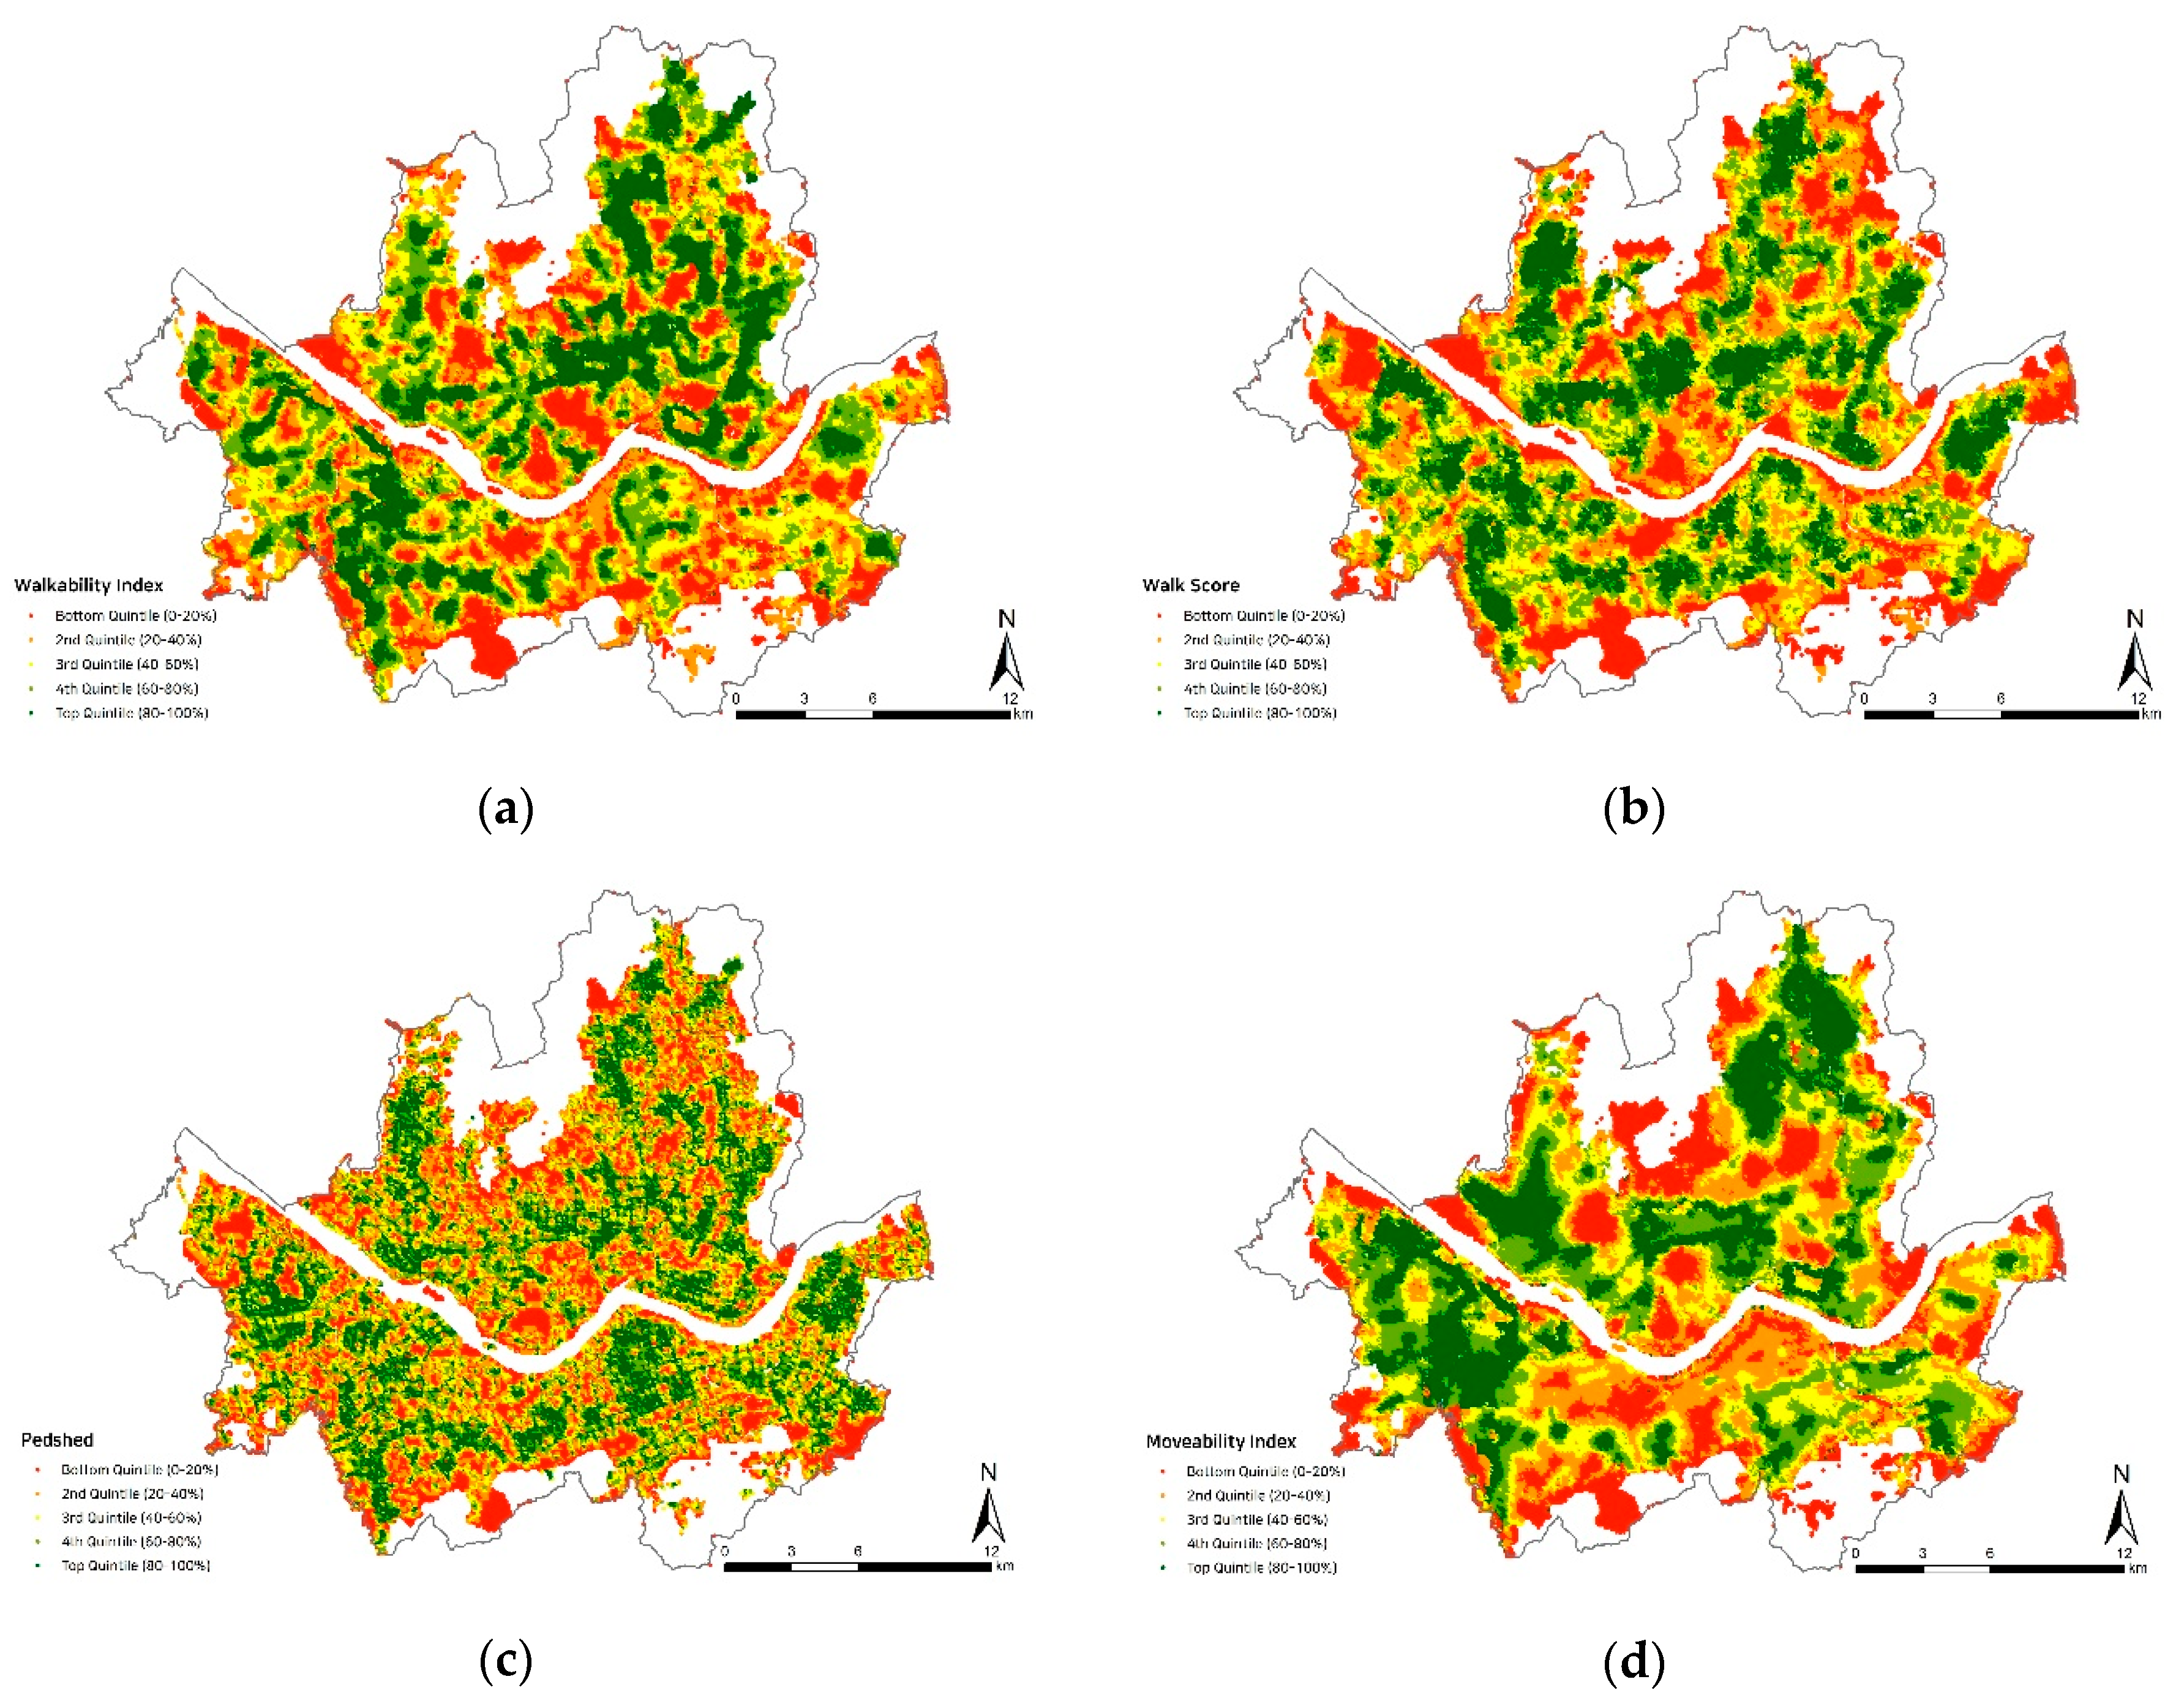
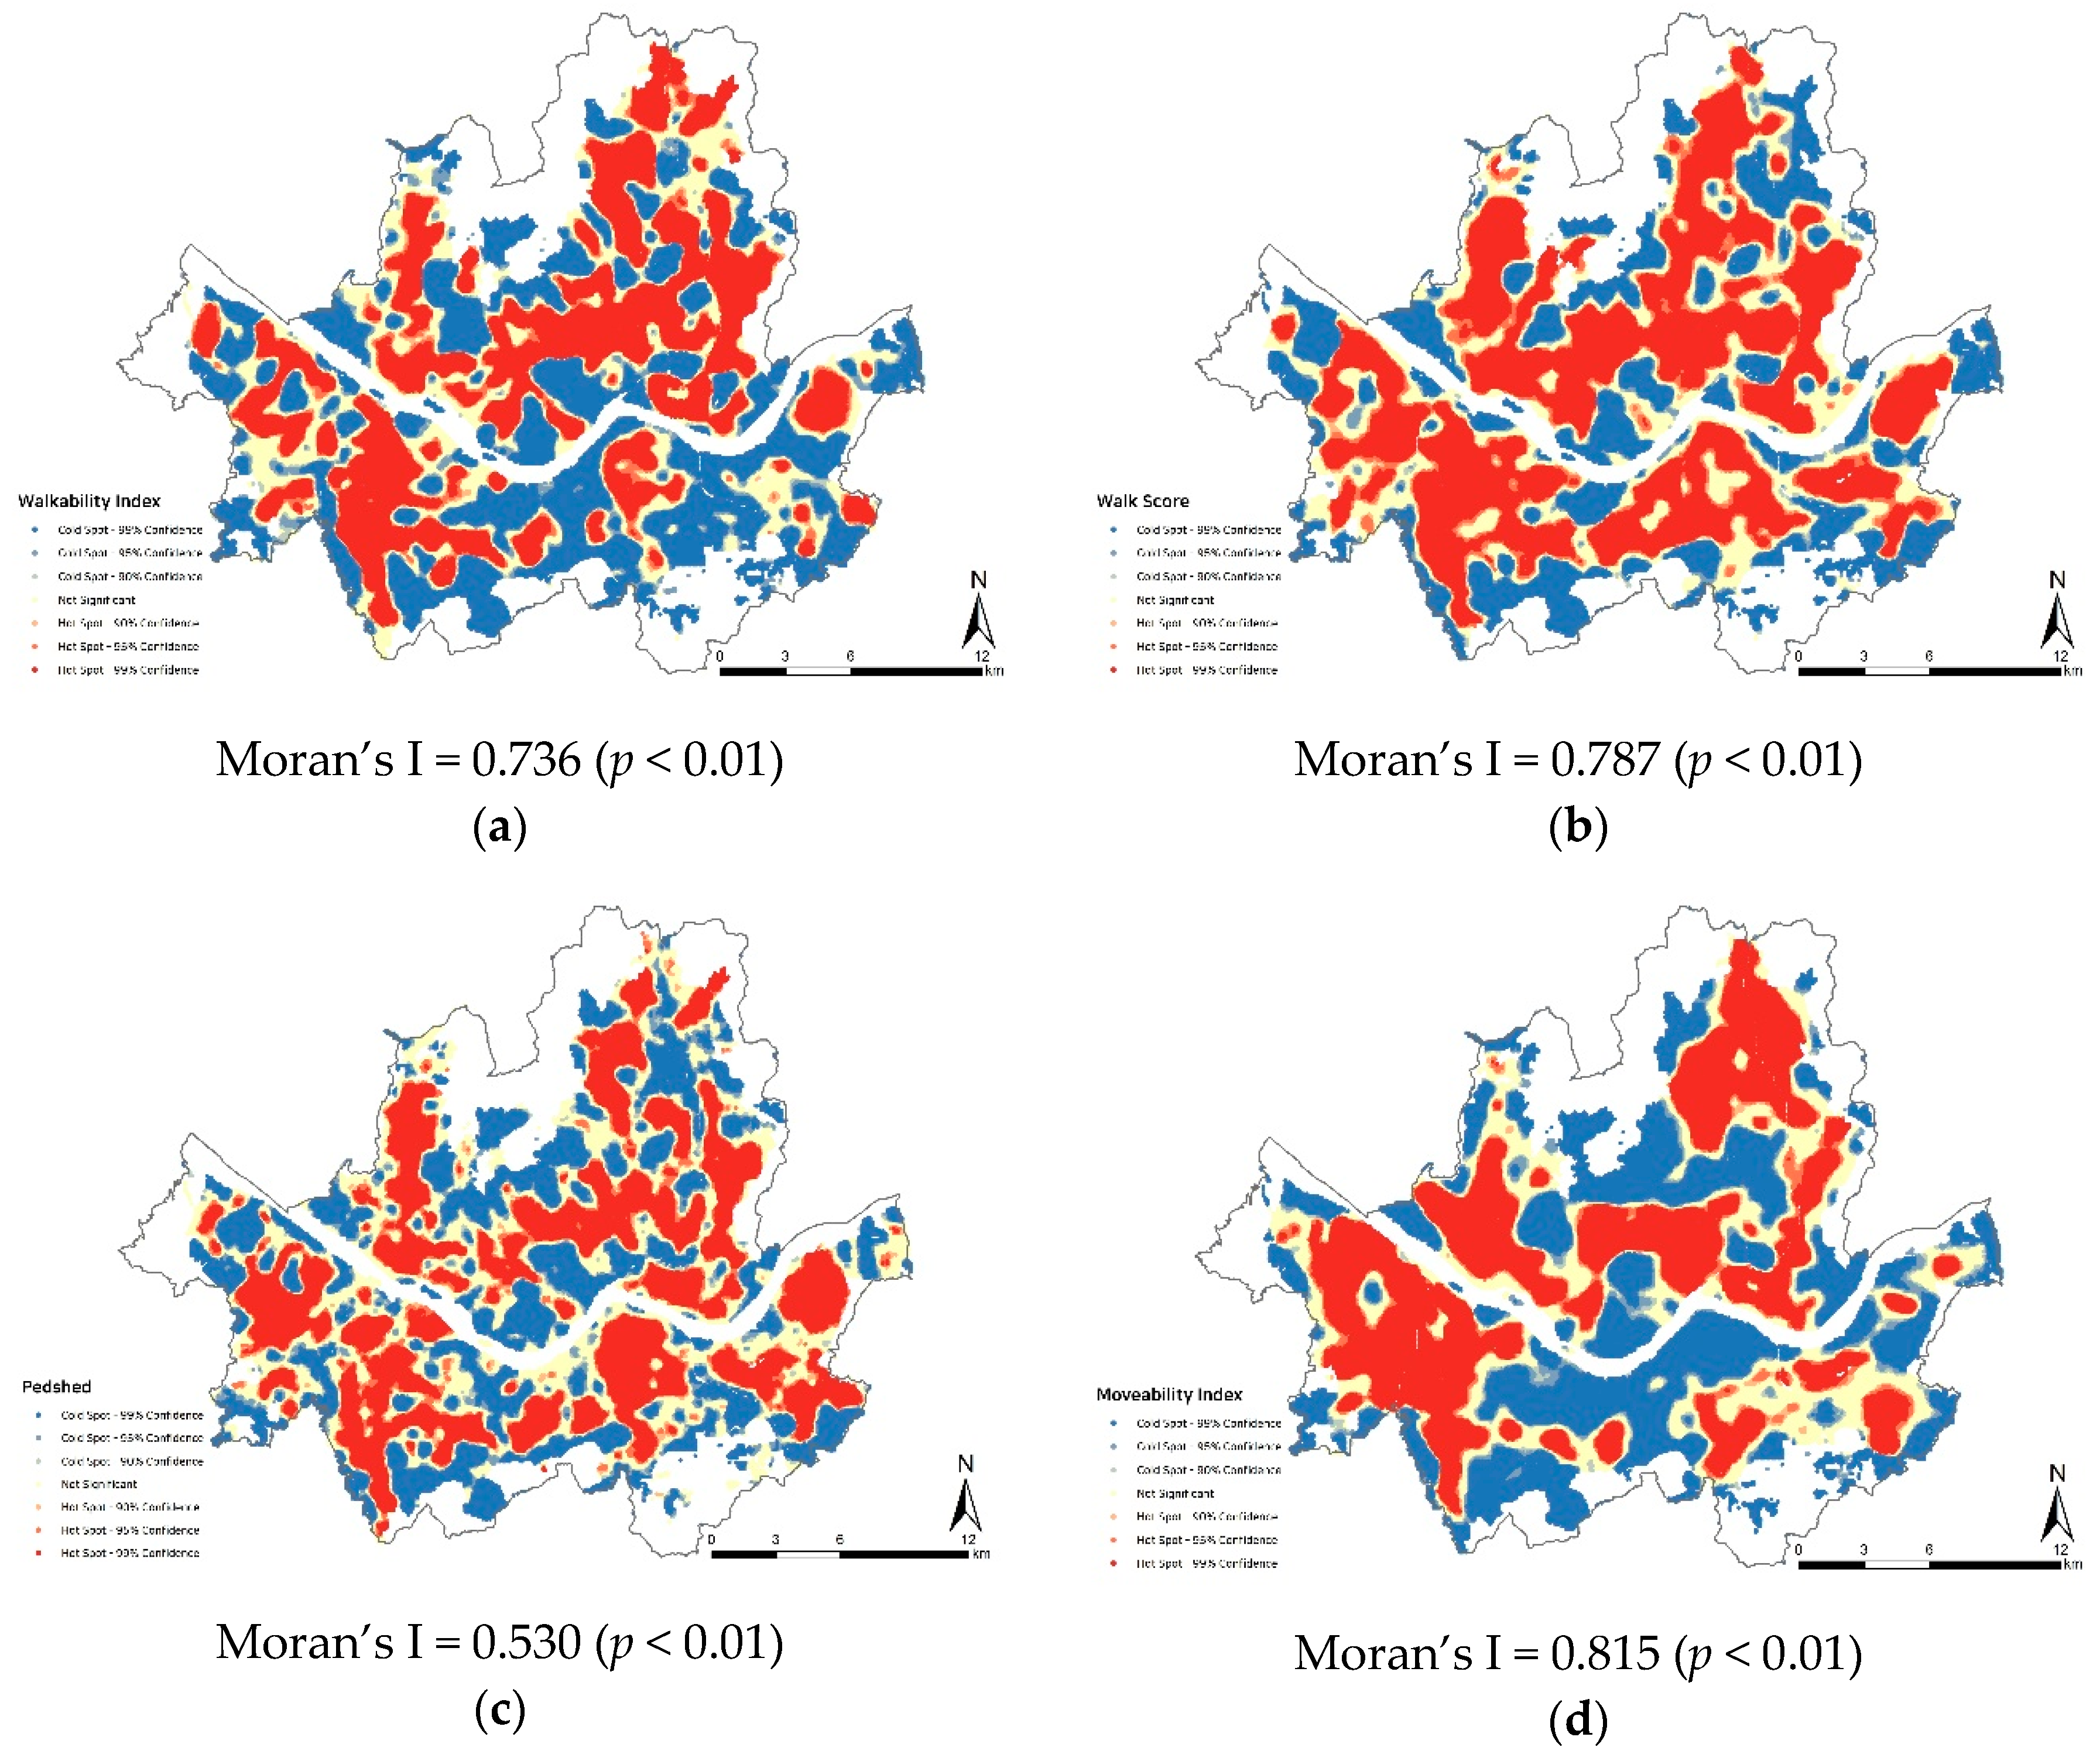
3.1. Descriptive Statistics and Hotspot Analyses of Four Indices

Descriptive statistics of walkability indices are shown in Table 3. The mean WI was 0.0 (SD = 3.0), and the mean MI was 0.0 (SD = 0.4). Because the WI and MI are combinations of standardized component values, they are both near-average values of zero. When examining SD values, the distribution of MI appeared to be closer to normal distribution than that of WI.
The mean values of WS and Ps were 64.4 (SD = 18.4) and 38.5 (SD = 13.3), respectively. The average value of WS was 64.4, which indicates that the walkability level of the urban setting was “somewhat walkable (50–69)” [36]. Contrastingly, the Ps value falls in the range of 0 to 100, and an average value of 38.5 implies that the walkability level is not very high. In other words, in terms of the street network, Seoul’s walkability is not notably high.
Figure 2 presents the quintile WI, WS, Ps, and MI maps of Seoul. Although they exhibit slight differences, the quintile maps of WI, WS, and Ps are, for the most part, notably similar. The quintile MI map exhibits slightly different patterns in the southern region, which is close to the Han River. Furthermore, there was a difference in the values of the four indices in the northeastern region of Seoul. Overall, however, the four quintile maps had similar patterns.
Owing to the above maps’ inability to demonstrate the states of walkability spatial autocorrelation, this section focuses on the degree of spatial autocorrelation for the four indices through hotspot analysis. As shown in Figure 3, with a distance threshold of 400 m, Moran’s I of the four indices ranged from 0.530 to 0.185 (p < 0.01). MI exhibited strong spatial autocorrelation (Moran’s I = 0.815, p < 0.01), while Ps had the lowest Moran’s I value (0.530). However, the latter still exhibited strong spatial autocorrelation. This reveals that each of these four indices exhibited statistically significant spatial autocorrelation.
The results also demonstrate that there were statistically significant spatial clusters of hotspots and coldspots in four indices of walkability. Large hotspot clusters were observed in the northern and southwestern parts of Seoul in all four indices. The results of the WI, WS, and Ps hotspot analyses exhibited some differences but had similar shapes overall. One point to note on the MI hotspot analysis result is that coldspots were evident in the south-central areas of the Han River.

3.2. Reliability among Indices

3.2.1. Pearson Correlation Coefficient (Pearson’s R)

To evaluate validity among walkability indices, a correlation analysis, Brand–Altman plots with LOA, and ICC were conducted. Correlation between the four indices was calculated by utilizing the Pearson’s R, and the results are shown in Table 4. Among the four indices, the correlations between WS and Ps (Pearson’s R = 0.645, p < 0.01) and WI and MI (Pearson’s R = 0.640, p < 0.01) were significantly high. In contrast, Ps and MI exhibited a statistically significant level, although they were relatively low in correlation (Pearson’s R = 0.308, p < 0.01). Overall, there were significantly strong correlations among the four indices (range of Pearson’s R: 0.308–0.645) at p < 0.01.

3.2.2. Brand–Altman Plot with Limits of Agreement (LOA)

It is important to select the appropriate method for assessing reliability because reliability check methods can vary according to the type of variables examined. In the case that continuous variables are examined, scatter plot, Pearson’s R, ICC, Mean within-pair difference, coefficient of variation, and Bland–Altman plot methods can be used to assess reliability [57]. Specifically, the Bland–Altman plot with the limit of agreement (LOA) is recommended because of the ease with which calculations can be performed and results can be visually understood [59].
To check the agreement among indices, the individual indices must have the same measurement level. Among the four indices of walkability, WI and MI were calculated on the basis of the z-score, and WS and Ps were measured as a percentage (range from 0 to 100). In this study, all four indices were converted to standardized values (z-scores) to align the measurement levels among these indices.
The results of the Bland-Altman plot (limit of agreement test) are presented in Table 5. There were approximately 5.0% (range from 4.5% to 5.5%) outside the limit of agreement among paired indices. In other words, over nearly 95.0% of the samples (total sample N = 44,000) were located within the limit of agreement. Among six paired indices, the agreement between z-Ps and z-MI (inside the limit of agreement: 95.5%) was the highest, and the agreement between z-WS and z-Ps (inside the limit of agreement: 94.5%) was the lowest.
As mentioned in the methodology section, the blue solid line represents the mean difference ( d ¯ ), and the red dotted line above and below the mean difference is the upper LOA ( d ¯ + 1.96 S d ) and lower LOA ( d ¯ 1.96 S d ), respectively. There should be no relation between mean difference and the mean, but the scatter of the difference increases or decreases as the mean increases in Figure 4. The plot between z-WI and z-MI exhibited constant variation as the value of the X-axis increased, and other plots exhibited a tendency to increase and then decrease in variability as the value of the X-axis increased. Owing to the large sample size (N = 44,000), the normal probability plot of the mean difference between paired measurements and the scatter plot between paired measurements were checked for normality. The analyses revealed that all six cases of paired measurements were sufficiently normal.
As shown in Table 5, approximately 95% of the total 44,000 dots were found to be within the inside LOAs. This result indicates that the measurements of the four walkability indices were sufficiently reliable.

3.2.3. Intraclass Correlation Coefficient (ICC)

Another reliability check method includes analyzing the ICC value between the four indices. As shown in Table 6, the ICC of the four indices was 0.544, with a 95% confidence interval from 0.540 to 0.549 in Seoul. The ICC values by twenty-five administrative units (gu) are shown in Table 6. The areas with ICC values greater than 0.6 were Gwanak-gu (0.760), Gangbuk-gu (0.658), Gwangjin-gu (0.648), Seongbuk-gu (0.627), Jung-gu (0.613), Mapo-gu (0.612), Yongsan-gu (0.607), and Jongno-gu (0.602). According to previously mentioned criteria, these areas exhibited good reliability of measurement consistency [64]. Contrastingly, areas with poor consistency of measurement (less than 0.4) were Nowon-gu (0.359) and Yangcheon-gu (0.368).

4. Discussion

Before this study was conducted, few studies had developed a walkability index in Korea [28]. Furthermore, no studies had been conducted on the measurement reliability between walkability indices. This study used four types of indices, WI, WS, Ps, and MI, to measure the walkability of the environment and checked the reliability of the measure between these indices in Seoul, Korea. The study area was the total area of Seoul, excluding rivers and greenbelts. Using 100 × 100 m grids as units of analysis, walkability values were obtained for 44,000 total points.
The findings of this study are as follows. First, quintile maps using the four indices showed slightly different shapes locally but a similar pattern across Seoul in general. Since the factors evaluated in each index are different, differences in the walkability levels were observed depending on which index was used. For example, the MI measures elements such as street connectivity, destination density, and level of urbanization, whereas Ps measures pedestrian catchment. Therefore, differences between the MI and Ps scores were expected. Nevertheless, it is noteworthy that quintile maps of the four indices exhibited similar patterns. Second, the hotspot analyses showed that Moran’s I value ranges from 0.530 (pedshed) to 0.815 (movability index) at a 0.1 significance level, indicating that all four indices exhibited significantly high spatial autocorrelation. Since the distinction between hotspots and coldspots was apparent by region, different urban planning and policy approaches may be applied to improve walkability levels in each region. Specifically, it would be suitable to suggest various policies for coldspot areas with poor walkability. Third, the results of the analyses using Pearson’s R, the Brand–Altman plot, and the ICC reveal that the measurement reliability among the four indices was significantly high. The Pearson’s R values were in the range of 0.308 to 0.645, and the range of inside LOA of the Brand–Altman plots was 94.5% to 95.5%. Furthermore, the ICC value among the four indices was 0.544 (moderately reliable) at the 0.1 significance level. This indicates that the four indices have statistically significant high measurement reliability. Researchers can begin to utilize any of these four indices for measuring the walkability of other cities in Korea. Additionally, future studies need not hesitate to choose either of these methods and among the indices used in this study, an index that is easy to collect data and low cost of measurement will be available.
This study brings to light three major points of significance. First, this study is meaningful in that we empirically verified measurement reliability between walkability indices in Seoul, where there has been little walkability research. Furthermore, there have been few studies that have checked the reliability between walkability indices. Second, while studies of measurement reliability have generally focused on looking at the overall level of measurement reliability, this study divided the study area into disaggregated levels for checking measurement reliability. Specifically, when comparing ICC values, this study carried out its analysis by using administrative units (gu). Third, to check measurement reliability, this study used several methods including Pearson’s R, Brand–Altman plot with LOA, and ICC. Thus, the reliability of the results has been greatly enhanced using the triangulated methodology application rather than a single method.
Although this study is meaningful in checking the reliability of walkability research methods, some limitations remain. This study used four indices of walkability to verify the reliability among them and found that they had statistically significant high measurement reliability. However, depending on which index was used and which district was analyzed, the results of the study could be different. In particular, if we take a closer look at some parts of the city of Seoul, we will definitely find some places that exhibit lower levels of reliability. To address this problem, a validation check on walkability measurement should be performed. Several studies have examined the validation of walkability by analyzing its correlation with health-related variables such as walking [1,35] and physical activity [27]. In future studies, it may be possible to check the validation of walkability with pedestrian satisfaction and active transport.
This study provides information on the feasibility of data preparation and appropriateness of analysis methodology, not only in Seoul but in other cities in Korea as well. Based on these results, walkability levels in other cities can be measured with greater surety. This enables urban planners and policymakers to provide ideas on the desired direction of walkability index development while considering spatial characteristics. We look forward to seeing a variety of urban planning policies that promote walkability.

5. Conclusions

A growing body of evidence suggests that the built environment is a significant contributor to behaviors and health conditions, such as walking and physical activity. It has become a pressing matter, not only in urban planning but also in public health, to assess the pedestrian-friendliness of a given community. This study was conducted in Seoul to measure the level of walkability using popular indices. The results reveal a relatively high level of measurement reliability between the four indices. This indicates that any of the four indices may be used interchangeably to evaluate pedestrian environmental conditions in Seoul without compromising reliability. The limitation of this study is that it is difficult to accurately assess the walkability level of a specific area only by reliability check between the indices. Therefore, further research on a validation check of walkability is needed. Despite the limitation, this study is meaningful in that it may provide a scholarly foundation for the development of walkable urban environments for urban planners and policymakers.

Author Contributions

Conceptualization, E.J.K. and Y.-J.K.; methodology, E.J.K. and Y.-J.K.; software, E.J.K.; validation, E.J.K. and Y.-J.K.; formal analysis, E.J.K.; investigation, E.J.K.; resources, E.J.K.; data curation, E.J.K.; writing—original draft preparation, E.J.K. and Y.-J.K.; writing—review and editing, E.J.K. and Y.-J.K.; visualization, E.J.K.; supervision, E.J.K.; project administration, E.J.K.; funding acquisition, E.J.K. All authors have read and agreed to the published version of the manuscript.

Funding

This work was supported by the National Research Foundation of Korea (NRF) grant funded by the Korea government (MSIT) (No. NRF-2017R1A2B4005440).

Conflicts of Interest

The authors declare no conflict of interest. The funders had no role in the design of the study; in the collection, analyses, or interpretation of data; in the writing of the manuscript, or in the decision to publish the results.

References

  1. Frank, L.D.; Sallis, J.F.; Conway, T.L.; Chapman, J.E.; Saelens, B.E.; Bachman, W. Many pathways from land use to health: Associations between neighborhood walkability and active transportation, body mass index, and air quality. J. Am. Plan. Assoc. 2006, 72, 75–87. [Google Scholar] [CrossRef]
  2. Manaugh, K.; El-Geneidy, A. Validating walkability indices: How do different households respond to the walkability of their neighborhood? Transp. Res. Part D Transp. Environ. 2011, 16, 309–315. [Google Scholar] [CrossRef]
  3. Giles-Corti, B.; Kelty, S.F.; Zubrick, S.R.; Villanueva, K.P. Encouraging walking for transport and physical activity in children and adolescents. Sports Med. 2009, 39, 995–1009. [Google Scholar] [CrossRef] [PubMed]
  4. Saelens, B.E.; Handy, S.L. Built environment correlates of walking. Med. Sci. Sports Exerc. 2008, 40 (Suppl. S7), S550–S566. [Google Scholar] [CrossRef] [PubMed] [Green Version]
  5. Saelens, B.E.; Sallis, J.F.; Frank, L.D. Environmental correlates of walking and cycling: Findings from the transportation, urban design, and planning literatures. Ann. Behav. Med. 2003, 25, 80–91. [Google Scholar] [CrossRef]
  6. Lee, C.; Moudon, A.V. Physical activity and environment research in the health field: Implications for urban and transportation planning practice and research. J. Plan. Lit. 2016, 19, 147–181. [Google Scholar] [CrossRef]
  7. Leslie, E.; Coffee, N.; Frank, L.; Owen, N.; Bauman, A.; Hugo, G. Walkability of local communities: Using geographic information systems to objectively assess relevant environmental attributes. Health Place 2007, 13, 111–122. [Google Scholar] [CrossRef]
  8. Powell, K.E.; Martin, L.M.; Chowdhury, P.P. Places to walk: Convenience and regular physical activity. Am. J. Public Health 2003, 93, 1519–1521. [Google Scholar] [CrossRef]
  9. Ewing, R.; Schmid, T.; Killingsworth, R.; Zlot, A.; Raudenbush, S. Relationship between urban sprawl and physical activity, obesity, and morbidity. Am. J. Health Promot. 2016, 18, 47–57. [Google Scholar] [CrossRef]
  10. Poston, W.S.C.; Foreyt, J.P. Obesity is an environmental issue. Atherosclerosis 1999, 146, 201–209. [Google Scholar] [CrossRef]
  11. Humpel, N. Environmental factors associated with adults’ participation in physical activity a review. Am. J. Prev. Med. 2002, 22, 188–199. [Google Scholar] [CrossRef]
  12. Ding, D.; Sallis, J.F.; Kerr, J.; Lee, S.; Rosenberg, D.E. Neighborhood environment and physical activity among youth. Am. J. Prev. Med. 2011, 41, 442–455. [Google Scholar] [CrossRef] [PubMed]
  13. Hill, J.O. Environmental contributions to the obesity epidemic. Science 1998, 280, 1371–1374. [Google Scholar] [CrossRef] [PubMed]
  14. Hill, J.O. Obesity and the environment: Where do we go from here? Science 2003, 299, 853–855. [Google Scholar] [CrossRef] [Green Version]
  15. Coffee, N.T.; Howard, N.; Paquet, C.; Hugo, G.; Daniel, M. Is walkability associated with a lower cardiometabolic risk? Health Place 2013, 21, 163–169. [Google Scholar] [CrossRef]
  16. Paquet, C.; Coffee, N.T.; Haren, M.T.; Howard, N.J.; Adams, R.J.; Taylor, A.W.; Daniel, M. Food environment, walkability, and public open spaces are associated with incident development of cardio-metabolic risk factors in a biomedical cohort. Health Place 2014, 28, 173–176. [Google Scholar] [CrossRef]
  17. Müller-Riemenschneider, F.; Pereira, G.; Villanueva, K.; Christian, H.; Knuiman, M.; Giles-Corti, B.; Bull, F.C. Neighborhood walkability and cardiometabolic risk factors in australian adults: An observational study. BMC Public Health 2013, 13, 755. [Google Scholar] [CrossRef] [Green Version]
  18. A Glance at Local Health Statistics. Available online: https://chs.cdc.go.kr/chs/stats/statsMain.do (accessed on 20 March 2018).
  19. Kim, E.J. Development and application of healthy city indicators and index: Case of seoul metropolitan area. Korea Spat. Plan. Rev. 2012, 72, 161–180. [Google Scholar] [CrossRef]
  20. Kim, E.J.; Kang, M. Effects of built environmental factors on obesity and self-reported health status in seoul metropolitan area using spatial regression model. Korea Spat. Plan. Rev. 2011, 68, 85–98. [Google Scholar] [CrossRef]
  21. Kim, T.K.; Kim, E.J. Healthy-friendly environmental correlates of population health. Korea Spat. Plan. Rev. 2014, 81, 185–200. [Google Scholar] [CrossRef]
  22. Kim, S. Improvements of Travel Survey and Statistical Indicators for Walk Trips; The Seoul Institute: Seoul, Korea, 2015; pp. 1–89. [Google Scholar]
  23. Pedestrian Network Becomes Close and Convenient: Seoul’s Five-Year Plan for ‘Walking Special City’. Available online: http://spp.seoul.go.kr/main/news/news_report.jsp#view/290155?tr_code=m_snews (accessed on 10 June 2019).
  24. Stockton, J.C.; Duke-Williams, O.; Stamatakis, E.; Mindell, J.S.; Brunner, E.J.; Shelton, N.J. Development of a novel walkability index for london, united kingdom: Cross-sectional application to the whitehall ii study. BMC Public Health 2016, 16, 416. [Google Scholar] [CrossRef] [PubMed] [Green Version]
  25. Frank, L.D.; Sallis, J.F.; Saelens, B.E.; Leary, L.; Cain, K.; Conway, T.L.; Hess, P.M. The development of a walkability index: Application to the neighborhood quality of life study. Br. J. Sports Med. 2009, 44, 924–933. [Google Scholar] [CrossRef] [PubMed]
  26. Porta, S.; Renne, J.L. Linking urban design to sustainability: Formal indicators of social urban sustainability field research in perth, western australia. Urban Des. Int. 2005, 10, 51–64. [Google Scholar] [CrossRef] [Green Version]
  27. Buck, C.; Pohlabeln, H.; Huybrechts, I.; De Bourdeaudhuij, I.; Pitsiladis, Y.; Reisch, L.; Pigeot, I. Development and application of a moveability index to quantify possibilities for physical activity in the built environment of children. Health Place 2011, 17, 1191–1201. [Google Scholar] [CrossRef]
  28. Choi, D.J.; Suh, Y.C. A spatial statistical approach on the correlation between walkability index and urban spatial characteristics -case study on two administrative districts, busan. J. Korean Soc. Surv. Geod. Photogramm. Cartogr. 2014, 32, 343–351. [Google Scholar] [CrossRef] [Green Version]
  29. Vale, D.S.; Saraiva, M.; Pereira, M. Active accessibility: A review of operational measures of walking and cycling accessibility. J. Transp. Land Use 2015, 9, 209–235. [Google Scholar] [CrossRef]
  30. Ewing, R.; Cervero, R. Travel and the built environment. J. Am. Plan. Assoc. 2010, 76, 265–294. [Google Scholar] [CrossRef]
  31. Lefebvre-Ropars, G.; Morency, C.; Singleton, P.A.; Clifton, K.J. Spatial transferability assessment of a composite walkability index: The pedestrian index of the environment (pie). Transp. Res. Part D Transp. Environ. 2017, 57, 378–391. [Google Scholar] [CrossRef] [Green Version]
  32. Buck, C.; Tkaczick, T.; Pitsiladis, Y.; De Bourdehaudhuij, I.; Reisch, L.; Ahrens, W.; Pigeot, I. Objective measures of the built environment and physical activity in children: From walkability to moveability. J. Urban Health 2014, 92, 24–38. [Google Scholar] [CrossRef] [Green Version]
  33. Koschinsky, J.; Talen, E.; Alfonzo, M.; Lee, S. How walkable is walker’s paradise? Environ. Plan. B Urban Anal. City Sci. 2016, 44, 343–363. [Google Scholar] [CrossRef]
  34. Frank, L.D.; Schmid, T.L.; Sallis, J.F.; Chapman, J.; Saelens, B.E. Linking objectively measured physical activity with objectively measured urban form. Am. J. Prev. Med. 2005, 28, 117–125. [Google Scholar] [CrossRef] [PubMed]
  35. Reyer, M.; Fina, S.; Siedentop, S.; Schlicht, W. Walkability is only part of the story: Walking for transportation in stuttgart, germany. Int. J. Environ. Res. Public Health 2014, 11, 5849–5865. [Google Scholar] [CrossRef] [PubMed]
  36. Walk Score. Available online: https://www.walkscore.com/ (accessed on 15 December 2017).
  37. Kerlinger, F.N.; Lee, H.B. Foundations of Behavioral Research; Harcourt College Publishers: Fort Worth, TX, USA, 2000. [Google Scholar]
  38. Kenawey, M.; Hasan, N.M.A.; Saleh, S.; El-Deen, M.A.; Abdel Aziz, A.H.; Shiha, A. Intraobserver and intermethod reliability for using two different computer programs in preoperative lower limb alignment analysis. Egypt. J. Radiol. Nucl. Med. 2016, 47, 1515–1519. [Google Scholar] [CrossRef] [Green Version]
  39. Ramirez, J.; Gibson, E.; Quddus, A.; Lobaugh, N.J.; Feinstein, A.; Levine, B.; Scott, C.J.M.; Levy-Cooperman, N.; Gao, F.Q.; Black, S.E. Lesion explorer: A comprehensive segmentation and parcellation package to obtain regional volumetrics for subcortical hyperintensities and intracranial tissue. NeuroImage 2011, 54, 963–973. [Google Scholar] [CrossRef] [PubMed]
  40. Cerrada, C.J.; Weinberg, J.; Sherman, K.J.; Saper, R.B. Inter-method reliability of paper surveys and computer assisted telephone interviews in a randomized controlled trial of yoga for low back pain. BMC Res. Notes 2014, 7, 227. [Google Scholar] [CrossRef] [PubMed]
  41. Kosis. Available online: http://kosis.kr/statisticsList/statisticsListIndex.do?menuId=M_01_01&vwcd=MT_ZTITLE&parmTabId=M_01_01#SelectStatsBoxDiv (accessed on 27 May 2019).
  42. Perry, C.A. The Neighborhood Unit: From the Regional Survey of New York and Its Environs, Volume VII, Neighborhood and Community Planning; Routledge/Thoemmes Press: London, UK, 1998. [Google Scholar]
  43. Hoehner, C.M.; Brennan Ramirez, L.K.; Elliott, M.B.; Handy, S.L.; Brownson, R.C. Perceived and objective environmental measures and physical activity among urban adults. Am. J. Prev. Med. 2005, 28, 105–116. [Google Scholar] [CrossRef]
  44. Boehmer, T.K.; Hoehner, C.M.; Wyrwich, K.W.; Ramirez, L.K.B.; Brownson, R.C. Correspondence between perceived and observed measures of neighborhood environmental supports for physical activity. J. Phys. Act. Health 2006, 3, 22–36. [Google Scholar] [CrossRef]
  45. Smith, G.; Gidlow, C.; Davey, R.; Foster, C. What is my walking neighbourhood? A pilot study of english adults’ definitions of their local walking neighbourhoods. Int. J. Behav. Nutr. Phys. Act. 2010, 7, 34. [Google Scholar] [CrossRef] [Green Version]
  46. Zhang, J.; Tan, P.Y.; Zeng, H.; Zhang, Y. Walkability assessment in a rapidly urbanizing city and its relationship with residential estate value. Sustainability 2019, 11, 2205. [Google Scholar] [CrossRef] [Green Version]
  47. Maghelal, P.K.; Capp, C.J. Walkability: A review of existing pedestrian indices. J. Urban Reg. Inf. Syst. Assoc. 2011, 23, 5–19. [Google Scholar]
  48. Duncan, D.T.; Aldstadt, J.; Whalen, J.; Melly, S.J.; Gortmaker, S.L. Validation of walk score® for estimating neighborhood walkability: An analysis of four us metropolitan areas. Int. J. Environ. Res. Public Health 2011, 8, 4160–4179. [Google Scholar] [CrossRef] [PubMed]
  49. Kim, E.J.; Won, J.; Kim, J. Is seoul walkable? Assessing a walkability score and examining its relationship with pedestrian satisfaction in Seoul, Korea. Sustainability 2019, 11, 6915. [Google Scholar] [CrossRef] [Green Version]
  50. National Spatial Data Infrastructure Portal. Available online: http://data.nsdi.go.kr/dataset (accessed on 15 March 2018).
  51. Seoul Open Data Portal. Available online: http://data.seoul.go.kr/dataList/datasetList.do (accessed on 10 March 2018).
  52. Road Name Address. Available online: http://www.juso.go.kr/addrlink/addressBuildDevNew.do?menu=mainJusoLayer (accessed on 1 March 2018).
  53. Cgv. Available online: http://www.cgv.co.kr/ (accessed on 15 December 2017).
  54. Lotte Cinema. Available online: http://www.lottecinema.co.kr/LCHS/index.aspx (accessed on 15 December 2017).
  55. Megabox. Available online: http://www.megabox.co.kr/ (accessed on 15 December 2017).
  56. Seoul Transport Operation & Information Service. Available online: http://topis.seoul.go.kr/ (accessed on 15 March 2018).
  57. Szklo, M.; Nieto, F.J. Epidemiology: Beyond the Basics, 3rd ed.; Jones & Bartlett Learning: Burlington, MA, USA, 2014; pp. 1–515. [Google Scholar]
  58. Altman, D.G.; Bland, J.M. Measurement in medicine: The analysis of method comparison studies. R. Stat. Soc. 1983, 32, 307. [Google Scholar] [CrossRef]
  59. Martin Bland, J.; Altman, D. Statistical methods for assessing agreement between two methods of clinical measurement. Lancet 1986, 327, 307–310. [Google Scholar] [CrossRef]
  60. Bland, J.M.; Altman, D.G. Measuring agreement in method comparison studies. Stat. Methods Med. Res. 2016, 8, 135–160. [Google Scholar] [CrossRef]
  61. Koo, T.K.; Li, M.Y. A guideline of selecting and reporting intraclass correlation coefficients for reliability research. J. Chiropr. Med. 2016, 15, 155–163. [Google Scholar] [CrossRef] [Green Version]
  62. Mehta, S.; Bastero-Caballero, R.F.; Sun, Y.; Zhu, R.; Murphy, D.K.; Hardas, B.; Koch, G. Performance of intraclass correlation coefficient (icc) as a reliability index under various distributions in scale reliability studies. Stat. Med. 2018, 37, 2734–2752. [Google Scholar] [CrossRef] [Green Version]
  63. Bujang, M.A. A simplified guide to determination of sample size requirements for estimating the value of intraclass correlation coefficient: A review. Arch. Orofac. Sci. 2017, 12, 1–11. [Google Scholar]
  64. Cicchetti, D. Guidelines, criteria, and rules of thumb for evaluating normed and standardized assessment instrument in psychology. Psychol. Assess. 1994, 6, 284–290. [Google Scholar] [CrossRef]
  65. Gulliford, M.C.; Ukoumunne, O.C.; Chinn, S. Components of variance and intraclass correlations for the design of community-based surveys and intervention studies: Data from the health survey for England 1994. Am. J. Epidemiol. 1999, 149, 876–883. [Google Scholar] [CrossRef]
Figure 1. Study area and spatial units of analysis.
Sustainability 12 00176 g001
Figure 2. Quintile maps of the four indices: (a) WI, (b) WS, (c) Ps, (d) MI, WI: Walkability index, WS: Walk score, Ps: Pedshed, MI: Movability index.
Sustainability 12 00176 g002
Figure 3. Hotspot analyses of the four indices identified by the Getis-ord Gi*: (a) WI, (b) WS, (c) Ps, (d) MI, WI: Walkability index, WS: Walk score, Ps: Pedshed, MI: Movability index.
Sustainability 12 00176 g003
Figure 4. Brand–Altman plots: (a) Plot of z-WI and z-WS, (b) plot of z-WI and z-Ps, (c) plot of z-WI and z-MI, (d) plot of z-WS and z-Ps, (e) plot of z-WS and z-MI, (f) plot of z-Ps and z-MI, WI: Walkability index, WS: Walk score, Ps: Pedshed, MI: Movability index.
Sustainability 12 00176 g004
Table 1. The five Ds as measures of the built environment and four walkability indices 1.
ElementsWIWSPsMI
Density
Diversity
Design
Destination accessibility
Distance to transit
1 WI: Walkability index, WS: Walk score, Ps: Pedshed, MI: Movability index.
Table 2. Expression, measure, and data source of the four walkability indices.
Index 1ExpressionMeasureSource
WIWI = [(2 × z-intersection density) + (z-net residential density) + (z-retail floor area ratio) + (z-land use mix)]Intersection densitySource [50]
Net residential density
Retail floor area ratio
Land use mix 2
WSWS = [(distance to nine types of amenity) − (pedestrian friendliness)]Distance to amenityGrocerySource [51]
Restaurants
ShoppingSource [52]
CoffeeSource [51]
BanksSource [50]
ParksSource [52]
Schools
Books
EntertainmentSource [53,54,55]
Pedestrian friendlinessIntersection densitySource [52]
Average block length
PsPs = [(network buffer/Euclidean buffer) × 100]Area ratio of network buffer/Euclidean bufferSource [52]
MIMI = [1/3(street connectivity + destination density + level of urbanization)]Street connectivity = 1/4(z-sidewalk density + z-bikeway density + z-intersection density + z-public transit stop density)DensitySidewalkSource [52]
BikewaySource [51]
IntersectionSource [52]
Public transit stopSource [52,56]
Destination density = 1/3(z-public playground density + z-sport facility density + z-green space density)DensityPublic playgroundSource [52]
Sport facility
Park/green space
Level of urbanization = 1/2(z-residential density + z-land use mix)Residential densitySource [52]
Land use mix 2
1 WI: Walkability index, WS: Walk score, Ps: Pedshed, MI: Movability index, 2 L a n d   U s e   M i x = 1 ( i = 1 n p i × l n   ( p i ) ) / ln ( n ) .
Table 3. Descriptive statistics of the four indices.
Index 1MeanSDMinMax
WI0.03.0−6.018.6
WS64.418.40.097.5
Ps38.513.30.069.4
MI0.00.4−1.33.1
1 WI: Walkability index, WS: Walk score, Ps: Pedshed, MI: Movability index.
Table 4. Pearson correlation coefficients between indices.
Index 1WIWSPsMI
WI1
WS0.611 **1
Ps0.571 **0.645 **1
MI0.640 **0.492 **0.308 **1
1 WI: Walkability index, WS: Walk score, Ps: Pedshed, MI: Movability index, ** p < 0.01 level.
Table 5. Limit of agreement between paired indices.
Agreement between Indices 1Outside the Limit of AgreementInside the Limit of AgreementSum
N%N%N%
z-WI and z-WS21094.841,89195.244,000100.0
z-WI and z-Ps21394.941,86195.144,000100.0
z-WI and z-MI22355.141,76594.944,000100.0
z-WS and z-Ps24045.541,59694.544,000100.0
z-WS and z-MI20854.741,91595.344,000100.0
z-Ps and z-MI19874.542,01395.544,000100.0
1 WI: Walkability index, WS: Walk score, Ps: Pedshed, MI: Movability index.
Table 6. ICC and 95% confidence interval of the four indices by administrative units (gu).
Administrative UnitNIntraclass Correlation Coefficient95% Confidence Interval
Lower BoundUpper Bound
Jongno-gu15480.602 **0.5800.625
Jung-gu9930.613 **0.5840.640
Yongsan-gu17990.607 **0.5860.627
Seongdong-gu14420.477 **0.4500.504
Gwangjin-gu13360.648 **0.6250.670
Dongdaemun-gu14050.537 **0.5110.563
Jungnang-gu13590.584 **0.5590.609
Seongbuk-gu19010.627 **0.6070.646
Gangbuk-gu11690.658 **0.6340.681
Dobong-gu11070.533 **0.5040.562
Nowon-gu19190.359 **0.3350.384
Eunpyeong-gu17100.576 **0.5530.598
Seodaemun-gu15810.536 **0.5110.560
Mapo-gu19370.612 **0.5920.632
Yangcheon-gu16430.368 **0.3420.394
Gangseo-gu24770.544 **0.5250.564
Guro-gu16860.479 **0.4540.504
Geumcheon-gu11470.571 **0.5440.599
Yeongdeungpo-gu19180.457 **0.4340.481
Dongjak-gu15930.503 **0.4780.528
Gwanak-gu21720.760 **0.7460.773
Seocho-gu25240.501 **0.4810.520
Gangnam-gu30500.442 **0.4240.461
Songpa-gu29300.553 **0.5350.570
Gangdong-gu16540.574 **0.5510.597
All (Seoul)44,0000.544 **0.5400.549
** p < 0.01 level.

