Abstract
Under the low-carbon background, with the aid of the Malmquist–Luenberger SBM (Slack-based Measure) model of unexpected output, the green total factor productivity (GTFP) of the logistics industry in Jiangsu Province, China, was measured and decomposed in this study based on the reality and experience of logistics industry development in 13 cities in three regions of Jiangsu Province in the years 2006–2018 by taking resource consumption into the input system and discharged pollutants into the output system. It is concluded that the environmental regulation (ER) has a significant positive effect on the growth of the GTFP of the logistics industry, and technological progress has become an important endogenous force that promotes the GTFP of the logistics industry in Jiangsu Province. On this basis, a dynamic GMM (Generalized method of moment) model and a Tobit model were constructed to further study the possible temporal and spatial effects of ER on the GTFP of the logistics industry. The research results reveal that the ER can exert both promoting and inhibitory effects on the GTFP of the logistics industry, and there is a temporal turning point for the effects. Besides, the effects notably differ spatially and temporally. Finally, some policies and advice for the green sustainable development of the logistics industry were proposed. For example, the government and enterprises should pay attention to the green and efficient development of the logistics industry and dynamically adjust the ER methods. They should consider the greening of both forward logistics links and reverse logistics system in the supply chain.
1. Introduction
In the face of the problems of global warming and gradual deterioration of the ecological environment, governments around the world have regarded low-energy consumption, low pollution, and low emissions as the main directions of future economic development strategies [1,2]. As a composite service industry integrating transportation, storage, freight forwarding, information, and other industries, the logistics industry supports the development of the national economy, but its energy consumption, carbon emissions, and air pollutant emissions have posed considerable challenges to its development [3]. According to China’s energy consumption data in the years 2005–2014, the energy consumption of the logistics industry accounts for 7%–8.5% of the total national energy consumption. With the continuous deepening of the concept of a low-carbon economy, the reduction of logistics costs, the improvement of logistics efficiency, and the development of green logistics have become a focus of government and enterprises [4]. In 2014, the State Council of China issued the Medium- and Long-term Plan for the Development of the Logistics Industry (2014–2020), which emphasized “accelerating the construction of a green, safe, and orderly modern logistics service system by improving the operation quality and efficiency of the logistics industry on the one hand, and constantly promoting the efficiency of energy utilization on the other hand”. This plan pointed out the direction for the development of the logistics industry in China [5].
Jiangsu Province is one of the major logistics provinces in eastern China. Driven by national strategies such as “regional economic integration” and “the Belt and Road Initiative”, the logistics industry in Jiangsu Province achieves steadily growing development, continuously improving operational quality, and further provides enhanced support for economic and social development. According to the statistical data given by the Statistical Bulletin on the Development of the Logistics Industry of Jiangsu Province (2019), by 2018, the total social logistics of the whole province reached 30.25519 trillion yuan, the logistics demand coefficient was 3.29, and the total social logistics costs of the whole province reached 1.28927 trillion yuan, the ratio of which to the GDP (Gross Domestic Product)was up to 17.02% (this ratio is about twice that of developed countries and about 6.5% higher than the global average). Besides, the value of logistics-related industries was reached 330.13 billion yuan, which accounted for 12% of the added value of service industries in the whole province. Despite the rapid development of the logistics industry in Jiangsu Province, a series of problems that have been masked by high-speed growth for long-term, such as the rapid growth of energy consumption, the worsening environmental pollution, and increasing urban traffic pressure, have begun to emerge [6]. According to statistics from the Jiangsu Energy Resources and Environment Statistics Office, the main energy consumption of industrial enterprises above the designated size in Jiangsu Province in 2018 was 326.5924 million tons, and the energy consumption of the logistics industry accounted for 6.28% of the total energy consumption in the province. It can be concluded that the logistics industry has gradually become an important member that leads to high-energy consumption and heavy environmental pollution, and its sustainable development is facing severe challenges.
For a long time, the Jiangsu provincial party committee and the provincial government have been closely focusing on the requirements of high-quality economic development. They have pushed forward the supply-side structural reform of the logistics industry and have attached great importance to environmental development and logistics cost reduction and efficiency improvement 6]. In November 2016, the Jiangsu provincial government issued Opinions on Further Reducing the Cost of Real Economy Enterprises, in which 21 cost-reducing policies were put forward, including three policies on reducing the logistics cost of enterprises. In March 2018, the general office of the Jiangsu provincial government issued Implementation Opinions on Further Reducing the Cost and Enhancing the Efficiency of Logistics to Promote the Development of Real Economy. In view of the key areas and weak links restricting logistics cost reduction in Jiangsu Province, various policies for optimizing the logistics development environment were put forward in strict accordance with the reality of Jiangsu Province.
Meanwhile, with the aggravation of global resource depletion and environmental pollution, scholars have also begun to pay attention to the exploration of a low-carbon, green, and sustainable development path of the logistics industry [7,8]. The green total factor productivity (GTFP, or environmental TFP by some scholars, i.e., the evaluation that takes energy input and CO2 pollution emissions into consideration) of the logistics industry has become an important indicator to measure the healthy development of the logistics industry [9,10]. In recent years, the reaearch is focused on the following three aspects:
(1) TFP calculation methods. Among the methods mainly used for TFP calculation in most literatures, the Solow residual method is the simplest method applicable to time series, but just as the data envelopment analysis (DEA) and the stochastic frontier approach (SFA), it has some limitations and prerequisites [11]. For example, Zhang et al., Tu et al., and Wang et al. [12,13,14] adopted the Solow residual method to study the TFP of the Chinese economy. Based on the equation of Solow residual value growth rate, Wang et al., Li et al., Dong et al., Yu et al., and Shao et al. [11,15,16,17,18] calculated the contribution rate of the scientific and technological progress of the logistics industry in different time periods and different regions with the aid of Eviews6.0 software and explored the importance of TFP for the sustainable development of the logistics industry. Based on the improved DEA models (such as the super-efficiency DEA model, the DEA-C2R model, the complex network DEA model, the improved super-efficiency DEA model, and the three-stage DEA model), Fu et al., Xiong et al., Han et al., Liu et al., and Guo et al. [19,20,21,22,23,24] analyzed the operating efficiencies, innovation performance efficiencies, and environmental efficiencies of different industries as well as their influencing factors, and reached reliable and robust conclusions. By adopting the SFA method, Wang et al., Fan et al., and Yu et al. [25,26,27] measured and compared the logistics efficiency of agricultural products, the production and service efficiency of logistics channels, and the efficiency of the urban logistics industry based on panel data and found large temporal-spatial differences.
(2) Influencing factors of the GTFP of the logistics industry. Scholars took indicators such as the level of economic development, the degree of opening up, the level of logistics infrastructure, and the degree of logistics informatization as influencing factors. For instance, when analyzing factors influencing the TFP of the logistics industry in China, Lin [28] selected variables such as the degree of marketization and industrialization and the level of economic development for the panel regression analysis. When researching factors influencing the efficiency of the logistics industry in Xi’an City, Wang et al. [29] took the regional advantages, the level of human resources, the rate of resource utilization, and the level of regional economic development as the impact indicators, and conducted an empirical analysis with the aid of the Tobit model. When analyzing factors influencing the TFP of the logistics industry in Jiangxi Province, Ding [30] regarded the degree of government intervention, the level of opening up, the level of economic development, and the industrial structure as the influencing factors, and conducted an empirical analysis with the aid of the Probit model. When investigating factors influencing the efficiency of the provincial logistics industry in China, Zhao [31] selected the level of regional economic development, the per capital logistics investment, the level of urbanization, and the degree of logistics informatization as influencing factors for the empirical analysis. From the mesoscopic perspective, indicators such as regional industrial structure, industrialization process, and level of urbanization are usually selected as influencing factors. For example, when studying factors influencing the TFP of the logistics industry in China, Yang et al. [32] and Liang et al. [33] took the rate of industrial growth, the level of disposable income of urban residents, the level of urbanization development, the proportion of the logistics industry in GDP, and the proportion of total imports and exports in GDP as influencing factors, and conducted an empirical analysis by means of the grey correlation analysis method.
(3) Effect of environmental regulation (ER) on the GTFP. Since the effect of ER on the GTFP is uncertain, scholars drew varying conclusions about the effect. Some scholars believed that ER has a positive effect on the promotion of the GTFP. These conclusions were drawn in light of the research results of famous scholars such as Porter [34], Berman and Bui [35], and Mazzanti and Zoboli [36]. Domestic scholars, such as Sun et al. [37] and Cai et al. [38] concluded that ER played a positive role in the promotion of industrial GTFP by using the directional distance function and the ML (Malmquist-Luenberger) index. By taking the manufacturing industry in China as the research object, Wu et al. [39] and Hu et al. [40] found that the overall GTFP of the manufacturing industry would increase with the increase of ER intensity. On the contrary, some scholars believed that ER has a negative effect on the promotion of GTFP. Jiang [41], Jin [42], and Du et al. [43] studied the effect of ER on the industrial GTFP and the GTFP of high-energy-consumption industries, respectively. They all reached the conclusion that increasing ER intensity could produce a certain effect of innovation compensation, but it was not enough to make up for the ER-induced compliance costs of enterprises. As a result, ER negatively affected GTFP. At the same time, some scholars believed that the relationship between ER and GTFP is not a simple linear relationship, but a U-shaped or inverted-U-shaped nonlinear relationship. For instance, the research of Yin [44] and Ma [45] revealed that the relationship between ER and the GTFP is a U-shaped nonlinear relationship which differed to some extent in different industries. Guo [46], Liu et al. [47], Zhou et al. [48], and Liu [49] investigated the GTFPs of the construction industry, industrial sector, and logistics enterprises. Their investigation results revealed that different types of ER exerted direct and indirect effects on the GTFP. To be specific, actively negotiating ER exerted a direct U-shaped effect on the GTFP, the commanding ER did not directly affect the GTFP, and incentive ERs had an inverted-U-shaped effect on the GTFP.
In summary, scholars have carried out theoretical research and empirical analyses from multiple perspectives, enriched and improved the indicators and framework of the logistics industry productivity, and unanimously concluded that the study on the relationship between the ER and the GTFP of the logistics industry has important reference value for the formulation of current low-carbon economic policies [39,42]. Therefore, in light of the previous studies [9,10,18,24,28,31,33] and with the aid of the Malsquist–Luenberger SBM model of unexpected output, the GTFP of the logistics industry in Jiangsu Province, China, was measured and decomposed in this study based on the panel data on the logistics industry development in 13 cities in three regions of Jiangsu Province in the years 2006–2018 by taking resource consumption into the input system and discharged pollutants as undesired output into the output system. Furthermore, a regression model was established by taking undesired output as the dependent variable and the influence of the GTFP of the logistics industry as an independent variable to explore the relationship between the independent variable and the dependent variable. In this way, the actual situation of the development of the logistics industry in Jiangsu Province under the low-carbon background was investigated more scientifically and effectively, which provides references for the construction of ER and the formulation of green logistics development policies in China.
2. Model Construction and Data Processing
2.1. Model Setting
Model 1: Green total factor productivity (GTFP) measurement of the logistics industry
By combining the directional distance function and the Malmquist productivity index, every city is regarded as a decision-making unit. Under the condition of constant technical level and constant input level, the directional distance function can describe the optimal output variable function. In the productivity index, the following assumptions are made: The input variable is which satisfies , the expected output variable is which satisfies , the unexpected output variable is which satisfies , and the direction vector is g. Then, the formula based on the Malmquist–Luenberger SBM model of unexpected output is:
where represents the gap between the actual output in the t period and the theoretical output in the t period under the level of production technology in the period t; represents the gap between the actual output in the t + 1 period and the theoretical output in the t period under the level of production technology in the period t; represents the gap between the actual output in the t period and the theoretical output in the t + 1 period under the level of production technology in the period t + 1; represents the gap between the actual output in the t + 1 period and the theoretical output in the t + 1 period under the level of production technology in the period t + 1.
Based on the principle of economics, the improvement of the GTFP of the logistics industry can be analyzed from two aspects, namely efficiency change (EC) and technical change (TC). Therefore, the above model is decomposed into a product of EC and TC, i.e.,:
where GTFP represents the GTFP of the logistics industry from the period t to the period t + 1. If GTFP > 1, then the GTFP increases during this period, and the increase is driven by efficiency enhancement and technological progress. If EC > 1 in the same period, then GTFP is gradually increasing under basically constant returns to scale, which makes GTFP closer to the front of production. If TC > 1 in the same period, then technological progress leads to the improvement of GTFP, and the expected output increases while the unexpected output decreases.
Model 2: Temporal effect model of environmental regulation (ER) on the GTFP of the logistics industry
Considering that the effect of ER may vary temporally in Model 1 [44], a system generalized method of moment (GMM) is adopted based on the dynamic panel hypothesis to further explore the temporal effect of ER on the GTFP of the logistics industry.
The GMM was proposed by Hansen [50] and improved by Pagan and Wickens [51]. Starting from the data requirements of the econometric model, it obtains a series of moment conditions and solves the coefficients according to the moment conditions. The GMM assumes a regression equation: , where is the instrument variable and satisfies ; is a -dimensional dimension-independent variable, and is instrument variables and . For the residual term in the estimation, , the instrument variable and the error term are independent of each other. Accordingly, is used as the moment condition to solve the equation. In fact, since in general, parameters are found during moment estimation so as to minimize the distance between and 0. In the calculation, a semi-positive definite matrix is used to calculate the modulus of :
The goal becomes to find the parameter vector . The first-order condition equals 0. It can be derived that:
By substituting into the above formula, the estimator of GMM can finally be obtained:
After obtaining the estimator of GMM, the Harsen test or the Sargan test is needed to determine whether is sufficiently small, namely, to judge the overall validity of instrument variables. The sequence correlation of the residual term is judged by using the first-order and second-order sequence correlation tests AR(1) and AR(2) of the first-order difference transformation equation.
Meanwhile, the Porter hypothesis advocates that the effect of ER on the economy presents a lag in time [28,31]. With reference to the Porter hypothesis, in this study, five control variables, namely labor productivity, energy productivity, per capital GDP, level of technological innovation, and degree of logistics industry agglomeration, are employed to ensure the rationality of the model and to formulate a dynamic panel model of the temporal effect of ER on the GTFP of the logistics industry. The formula is as follows:
In order to eliminate the heteroscedasticity and maintain the stability of the data, logarithmic processing is performed on each explanatory variable. Among the variables, i represents a city in Jiangsu, and its value is an integer in 1–13; t represents the year, and its value is an integer in 2006–2018; j represents the value of lag period, and its value is 1, 2 or 3; αi (i = 0, 1, 2, ..., 8) is a specific coefficient; µit and ɛit are random error terms.
Model 3: Spatial effect model of ER on the GTFP of the logistics industry
On the basis of Model 2, the Tobit model is used to further explore the spatial effect of ER on the GTFP of the logistics industry. The Tobit model (i.e., the limited dependent variable model) is widely used in the study on environmental governance, energy utilization, resource endowment, and economic structure because it can avoid the data error of the OLS (Ordinary Least Square) model [29]. Its formula is:
The limited dependent variable model is obtained by limiting the interval value of the dependent variable. Since the GTFP value of logistics industry analyzed by the DEA model mostly lies in the interval [0,2], the interval of dependent variable is set to be [0,2].
The ER is an environment-oriented independent variable. In order to investigate the possible nonlinear relationship between the GTFP and the ER of the logistics industry, the square term of ER (ER2) is used as the independent variable to construct the formula of the spatial effect of ER on the GTFP of the logistics industry:
2.2. Sample Data and Variable Selection
2.2.1. Data Source
The researched period of this paper is 2006–2018, and the basic data selected come from the versions of the Jiangsu Statistical Yearbook, the Jiangsu Transportation Yearbook, and the Jiangsu Energy Statistical Yearbook in the years 2007–2019 and the 2006 IPCC (Intergovernmental Panel on Climate Change) Guidelines for National Greenhouse Gas Inventories. Considering the availability of data, data on the added value of the logistics industry are replaced with the data on transportation, storage, and postal industries. The CO2 emissions of the logistics industry (the CO2 emissions of transportation, storage, and postal industries) can be calculated according to the carbon emission coefficient given by the 2006 IPCC Guidelines for National Greenhouse Gas Inventories in combination with the total energy consumption of transportation, storage, and postal industries.
2.2.2. Indicator Selection and Data Processing
(1) Input and output indicators
In accordance with Model 1 and the research results of scholars [9,28,31,33], the capital formation, the number of employees, and the energy consumption of the logistics industry are selected as input indicators, the added value of the logistics industry and the freight turnover are selected as expected input indicators, and the CO2 emissions of the logistics industry is selected as the undesired output indicators, as listed in Table 1.

Table 1.
Description of input and output indicators.
Table 2.
Estimation coefficient of CO2 emissions.
Among them, capital investment, i.e., the input variable of capital formation of the logistics industry, is estimated by using the perpetual inventory method [30]. Calculated with reference to the research on the depreciation rate of 17 industries in China, the average capital depreciation rate of the logistics industry is 5.42% [30,38]. In the calculation, the fixed asset investment of the logistics industry in 13 cities of Jiangsu Province is selected as the basic data, and the year 2005 (the year 2005 = 100) is taken as the base period. The formula for calculating the capital formation of the logistics industry is as follows:
where and represent the capital stock of the logistics industry in 13 cities of Jiangsu Province in the years t and t − 1 respectively, is the capital stock of the base period, and and represent the fixed capital amount and the depreciation rate, respectively. Meanwhile, by using the steady-state method proposed by Halberg [52], the stock of capital at the starting point is derived under the assumption that in the steady state, the capital output ratio is constant, or the capital growth rate is equal to the output ratio growth rate. The calculation method is:
The data on capital investment of 13 cities in Jiangsu Province are obtained through Formula (2). represents the annual average growth rate of the actual added value of the logistics industry in Jiangsu Province in the years 2006–2018.
Unexpected output: Environmental pollution caused by the logistics industry is mainly carbon oxides (primarily CO2 in this study) generated during transportation. Using the method for estimating the CO2 emissions from chemical fuel combustion provided by the 2006 IPCC Guidelines for National Greenhouse Gas Inventories (IPCC, 2006), CO2 emissions from the logistics industry can be calculated by multiplying different types of energy consumed during the operation of the logistics industry with the CO2 emission coefficient of fossil fuels. The calculation formula is:
where the numbers of 44 and 12 means the molecular weights of CO2 and carbon, respectively; (1, 2, 3, 4, 5, 6, 7) represents the consumption of the ith type of energy which is converted into the unified unit (10,000 t of standard coal); is the average low calorific value of the ith type of energy; is the carbon emission coefficient of the ith type of energy given in the 2006 IPCC Guidelines for National Greenhouse Gas Inventories; is the carbon oxidation factor of various energy sources (the IPCC default value is 1 according to the 2006 IPCC Guidelines for National Greenhouse Gas Inventories).
According to the above method of sample data selection and processing, a total of 1014 statistical data of 6 variables are obtained, and the data description is given in Table 3. Scholars [9,28,31,33] have pointed out that the input and output items should conform to the hypothesis of isotonicity (that is, when the input quantity increases, the output quantity cannot decrease). In this study, in order to test the isotonicity of correlation, the Pearson correlation test is performed on the selected input and output indicators with the aid of SPSS19.0 software. The results are shown in Table 4.
Table 3.
Descriptive statistical analysis on samples.
Table 4.
Pearson correlation coefficient between input and output variables.
(2) Explained variables and control variables
According to Models 2 and 3, under the comprehensive consideration of a low-carbon economy, ER is taken as the explained variable while labor productivity, energy productivity, per capita GDP, level of technological innovation, and degree of logistics industry agglomeration are selected as the five control variables (see Table 5). ER: The intensity of regional environmental regulation is measured by using the ratio of CO2 emissions to the corresponding added value of the logistics industry. The smaller the value is, the stronger the regional environmental regulation is. LP: Labor productivity is expressed by the ratio of the added value of the regional logistics industry to the number of people engaged in this industry. EP: Energy productivity is expressed by the ratio of added value of regional logistics industry to energy consumption of the industry. PGDP: The actual per capita GDP of 13 cities in Jiangsu Province was calculated at constant prices in 2005. RD: The level of technological innovation is measured by the ratio of R and D (Research and Development) funds to regional GDP of 13 cities in Jiangsu Province. AGG (Aggregate): The degree of logistics industry agglomeration is calculated by the location entropy index, and its calculation formula is:
where LQij stands for the location entropy of the i industry in the j region in the entire region. The greater its value is, the higher the degree of agglomeration. When LQij > 1, the j region boasts advantages in the entire region, and vice versa.
Table 5.
Descriptive statistical analysis on samples.
3. Empirical Analysis
3.1. Calculation and Analysis of the GTFP of the Logistics Industry in 13 Cities in Jiangsu Province Based on the SBM Model
The GTFP of the logistics industry in 13 cities in three regions of Jiangsu Province in the years 2006–2018 is measured with the aid of MaxDEA (Data Envelopment Analysis) software. To ensure that the GTFP can fully reflect the effect of unexpected output and that the results are objective and accurate, the GTFP and its decomposition under two conditions are measured in this study, as shown in Table 6.
Table 6.
The GTFP and its decomposition of the logistics industry of 13 cities in three regions of Jiangsu Province.
It can be seen from Table 6 that the GTFP values calculated after considering carbon emissions as an unexpected output are all greater than the TFP values calculated without considering carbon emission. This indicates that when CO2 emissions and energy input are taken into account, the logistics enterprises will formulate corresponding strategies according to the environmental rules and regulations issued by the government, such as optimizing the transport routes, standardizing the logistics process, reducing the transport links, improving the transport efficiency, replacing the means of transport with energy-saving and emission-reducing new energy vehicles, etc., so as to reduce the emissions and promote the efficiency.
When CO2 emissions are not considered, Nanjing City and Suzhou City experience an overall increase during the investigated period, while the rest of the cities undergo varying degrees of reduction. To be specific, the average annual growth rates of Nanjing City and Suzhou City are 2.47% and 0.72% respectively, while the average annual decline rates of Suqian City, Huai’an City, and Yancheng City, which are the highest three, are 4.56%, 4.65%, and 5.93%.
When CO2 emissions are considered, in addition to Nanjing City and Suzhou City which maintain average annual growth, Yangzhou City also exhibits a growing trend and achieves an average annual growth rate of 4.3%, suggesting that it has taken effective measures to reduce CO2 emissions in the years 2006–2018. On the contrary, the rank of Xuzhou City falls from the fourth to the eighth, and the rank of Lianyungang City also declines, indicating that the development of the logistics industry in Xuzhou City and Lianyungang City has been extensive in this period with high-energy consumption and heavy pollution. The power of technological progress is insufficient to make up for the improvement of scale efficiency, so the two cities are in the throes of transformation and upgrading.
It is noteworthy that from the perspective of Jiangsu Province as a whole, the EC values of 13 cities are all smaller than the TC values, which demonstrates that technological progress has become the main driving factor for the growth of the GTFP of the logistics industry in Jiangsu Province. Among the 13 cities, Xuzhou City, Changzhou City, and Yangzhou City achieve the fastest growths of TC, with average annual growth rates of 5.89%, 5.89%, and 4.28%, respectively. This fully shows that since the Eleventh Five-Year Plan, the logistics industry, as an important component of the “Service Industry Acceleration Plan” of Jiangsu Province, has entered a golden development period and a new stage of transformation and upgrading from quantitative expansion to quality improvement. However, some cities still possess relatively extensive development modes of the logistics industry and rather low speeds of transformation and upgrading. In these cities, the development levels need to be further improved [6].
From the perspective of regional development, the GTFP of the logistics industry in Southern Jiangsu (Nanjing City, Suzhou City, Wuxi City, Changzhou City, and Zhenjiang City) presents relatively mature efficiency input and output and stable technology input drive. That in Central Jiangsu (Yangzhou City, Nantong City, and Taizhou City) shows a rapid technology drive, that is, the development mode of the logistics industry is changed through technological improvement and upgrading. That in Northern Jiangsu (Xuzhou City, Lianyungang City, Suqian City, Huai’an City, and Yancheng City) is characterized by relatively low efficiency input and a medium-level technology drive. Changes in the GTFP of the logistics industry in the three major regions in Jiangsu Province are illustrated in Figure 1.
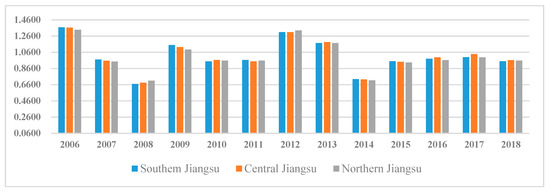
Figure 1.
Changes in the GTFP of the logistics industry in the three regions of Jiangsu Province.
As can be seen in Figure 1, on the whole, the GTFP of the logistics industry in three regions of Jiangsu Province changes and varies significantly. In other words, the GTFP of the logistics industry in three regions of Jiangsu Province fluctuates notably in the period 2006–2018. Specifically, in the period 2007–2009, affected by the impact of financial crisis, the GTFP of the logistics industry drops significantly, in the period 2011–2013, it rebounds, and in the period 2015–2017, it grows slowly, and after 2018, it declines slowly again. Among the three regions, the overall GTFP in Southern and Central Jiangsu is higher than that in Northern Jiangsu, while the GTFP in Northern Jiangsu is more stable than those in Southern and Central Jiangsu.
3.2. Analysis of the Temporal Effect of ER on the GTFP of the Logistics Industry in Jiangsu Province
The temporal effect of ER on the GTFP of the logistics industry in Jiangsu Province is analyzed by using the dynamic GMM method with the aid of Stata software. The results are disclosed in Table 7 and Table 8.
Table 7.
Temporal effect of ER on the GTFP of the logistics industry in Jiangsu Province.
Table 8.
Temporal effect of ER on the efficiency change (EC) and technical change (TC) of the logistics industry in Jiangsu Province.
In the Hansen test, the p value of the model is 1, which indicates that the model does not have the problem of over-identification. At the same time, the model passes the AR(1) and AR(2) tests, suggesting that the first-order sequence is correlated while the second-order sequence is not correlated after the difference of the original sequence, which conforms to the setting of the GMM model. The model construction is effective as a whole.
By analyzing the model variables, it can be found that the GTFP of the logistics industry has a strong autocorrelation, and the effect of the GTFP of lag-1 on that of the current period is as high as 0.8436. This means that every 1% increase in the GTFP of lag-1 will result in an increase of 0.84% in the GTFP of the current period. Meanwhile, ER has a negative effect on the GTFP of the logistics industry of the current period, with an elasticity coefficient of −2.9472. However, the ER of lag-1 leads to an increase in the GTFP of the current period, with an elasticity coefficient of 2.1381. This verifies that the positive promoting effect of ER on the GTFP presents a lag in time. Moreover, the autocorrelation of GTFP gradually decreases in the cases of lag-2 and lag-3. Besides, the ER of lag-2 exerts the greatest effect on the GTFP, with an elastic coefficient of 2.3043, whereas the ER of lag-3 exerts an insignificant effect on the GTFP, with the elastic coefficient dropping to 1.4929. On the one hand, it demonstrates that the ER of the current period results in a decline in the GTFP, but the ER of lag-2 has the largest positive effect on the GTFP. On the other hand, this also shows that the GTFP generally decreases under the effect of ER, but it tends to increase with the element and technology innovation of logistics enterprises.
From the perspective of EC, the effect of the EC of lag-1 on that of the current period is significant, with a correlation coefficient of 94.29%, after which, the effect gradually decreases to 0.8042 and 0.7491. The effect of ER on the EC is not significant, but it is always positive, which means that the EC of the current period rises instead of falling under the effect of ER. In contrast, the ER of lag-1 has a certain inhibitory effect on the EC, reducing the EC to 0.8936, while the effects of ERs of lag-2 and lag-3 on the EC are reduced to as low as 0.5032 and 0.1035, respectively.
From the perspective of TC, the autocorrelation of TC is not strong, only 76.34%, 69.42%, and 61.03%, respectively. The ER of the current period leads to a decrease of TC, and the inhibitory effect reaches −1.4306. With the increase of investment in technology R and D, the ER of lag-1 begins to promote the TC, and the promoting effect is up to 1.9396, which is greater than the inhibitory effect. It can be concluded that there exists a temporal turning point for the effect of ER on the GTFP of the logistics industry. From the data of lag-2 and lag-3, it can also be found that logistics enterprises must carry out technological improvement under the effect of ER, but a time cycle exists for technological innovation.
3.3. Analysis of the Spatial Effect of ER on the GTFP of the Logistics Industry in Jiangsu Province
The spatial effect of ER on the GTFP of the logistics industry in Jiangsu Province is analyzed by using the Tobit modeling method with the aid of Stata software. The results are displayed in Table 9.
Table 9.
Spatial effect of ER on the GTFP of the logistics industry in Jiangsu Province.
It can be seen from Table 9 that the regression coefficient of the primary term (ER) is negative, while that of the secondary term (ER2) is positive. The regression result shows that in the years 2006–2018, the relatively low ER intensity fails to motivate logistics enterprises to implement technological innovation and management system innovation for the purpose of energy conservation and emission reduction.
Meanwhile, according to Table 9, the thresholds of the effect of ER on the GTFP are 4.9262 and 1.3993 respectively, and the midpoint of the curve is 3.1627. That is, the relationship between the ER and the GTFP is a U-shaped curve which falls first and then rises. When the ER is smaller than 1.3993, it leads to a decrease of the GTFP. Nevertheless, the effect is not significant, and there is no strong negative correlation between the two. When the ER lies between 1.3993 and 4.9262, it causes a significant drop of the GTFP, and the drop can be divided into two ranges. First, the GTFP drops notably when 1.3993 < ER < 3.1627. Second, as the ER intensity increases, the GTFP gradually declines at a reduced rate and even increases when 3.1627 < ER < 4.9262. When ER > 4.9262, the two become remarkably positively correlated, which means that the ER can promote the improvement of the GTFP. It can be concluded that when the ER intensity is low, logistics enterprises, failing to be constrained by the ER, will not effectively adopt energy-saving and environment-protecting measures. As a result, the market environment is further deteriorated, and therefore, the investment in pollution control is imminent. As the ER intensity increases, logistics enterprises realize that they must gradually improve their own environmental control measures and raise the GTFP by updating production and transportation equipment, formulating energy-saving operating mechanisms, and altering the development mode. In this process, the GTFP changes from negative to positive.
From the perspective of regional development, the spatial effect of ER on the GTFP of the logistics industry in the three regions of Jiangsu Province (Northern Jiangsu, Central Jiangsu, and Southern Jiangsu) is presented. The results are shown in Table 10:
Table 10.
Spatial effect of ER on the GTFP of the logistics industry in the three regions of Jiangsu Province.
As can be observed from Table 10, the effect of ER on the GTFP of the logistics industry in three regions obviously differs. The regression coefficient of the primary term is negative, and the effect is not significant. In contrast, that of the secondary term is positive, and the effect is significant at the level of 1%, indicating the obvious threshold effect. The calculation results of the threshold ranges of the three regions reveal that the threshold values of Northern Jiangsu are 1.3024 and 5.4491, those of Central Jiangsu are 1.5772 and 4.9136, and those of Southern Jiangsu are 1.0194 and 4.4073. Among the three regions, Southern Jiangsu, in which the GTFP of the logistics industry begins to reverse when the ER reaches 1.0194, is the most sensitive to ER policies. The fact that the threshold range in Southern Jiangsu is the smallest suggests that this region responds to the ER the fastest and adopts a pretty effective environment-protecting mechanism. Northern Jiangsu responds to the ER the most slowly, followed by Central Jiangsu. In addition, the threshold range in Northern Jiangsu is the largest, which means the effect of ER intensity on the GTFP of the logistics industry in this region presents a large lag effect in time. The corresponding midpoints of the threshold ranges of Northern Jiangsu, Central Jiangsu, and Southern Jiangsu are 3.3757, 3.0356, and 2.7133, respectively. This shows that the ER succeeds in exerting its motivating effect at different points due to the different resource endowments and driving modes of the logistics industry.
Judging from the coefficients of various variables, labor productivity can promote the increase of the GTFP of the logistics industry in Southern Jiangsu, and energy productivity has the strongest promoting effect (0.7395) on the GFTP of the logistics industry in Central Jiangsu. In terms of per capita GDP, the performance (0.3194) of Southern Jiangsu is better. In terms of technological innovation, Northern Jiangsu achieves the highest marginal growth rate (0.2946), suggesting that technological improvement in Northern Jiangsu has the most significant effect on the GFTP of the logistics industry. In terms of industrial agglomeration, the abundant resource endowment (0.2826) of Southern Jiangsu is pretty conducive to the improvement of the GFTP of the logistics industry. In general, with the increase of ER intensity, the development of the regional logistics industry shifts from extensive development at the expense of the environment to new development driven by new technologies, new business forms, etc. In this way, the regional economic development gets promoted.
4. Conclusions and Suggestions
(1) The GFTP of the logistics industry is measured with the aid of the Malsquist–Luenberger SBM model of unexpected output. The GTFP values calculated after considering carbon emissions as an unexpected output are all greater than those without considering carbon emission. This indicates that in the years 2006–2018, the logistics industry in Jiangsu Province continuously abandons the traditional extensive development path with high-energy consumption and heavy pollution and attaches importance to technological progress rather than scale efficiency. The ER policies issued by the government take effect. Among the 13 cities, Xuzhou City, Changzhou City, and Yangzhou City, whose development of the logistics industry is driven by technology investment, witness a prominent increase of the GFTP of the logistics industry. From the perspective of regional development, Southern and Central Jiangsu, whose logistics industry has been relatively mature and stable, are not significantly affected by changes in environmental pollution and energy consumption, whereas the development of the GFTP of the logistics industry in Northern Jiangsu still needs to be driven by high-efficiency investment and strong technology.
(2) The overall positive effect of ER on the improvement of the GTFP of the logistics industry presents a lag in time, and there exists a temporal turning point for the effect of ER on the GTFP of the logistics industry. That is, the ER of the current period results on a decline in the GTFP, but the ER of lag period promotes the improvement of the GTFP. From the perspective of EC and TC, in the short term, logistics companies are more concerned about their own benefits and tend to focus on EC. However, the enterprises must gradually increase their investment in technology R and D with the continuous rise of pollutant treatment and comprehensive utilization rates and the continuous strengthening of pollution punishment and pollution control investment. In the long run, ER will inevitably manifest its positive promoting effect as the application of new technologies and R and D achievements will gradually offset the ER-induced cost increase.
(3) The analysis based on the Tobit model shows that the primary term (ER) has a negative effect on the GTFP of the logistics industry, while the secondary term (ER2) exerts a positive effect. This result suggests that although the low-intensity ER cannot arouse the enthusiasm of logistics enterprises for technological innovation, the low-intensity ER and the promulgation and implementation of a series of environment-protecting policies and regulations can promote the GTFP, EC, and TC of the logistics industry. At the same time, from the perspective of regional development, among the three regions, Southern Jiangsu is the most sensitive to ER policies, followed by Central Jiangsu, and Northern Jiangsu responds to the ER the most slowly. The corresponding midpoints of the threshold ranges of Northern Jiangsu, Central Jiangsu, and Southern Jiangsu differ. Specifically, that of Northern Jiangsu being the largest, followed by Central Jiangsu, and that of Southern Jiangsu is the smallest. This result shows that the promoting effect of ER on the GTFP of the logistics industry significantly differs spatially under different resource endowments and driving modes.
Through the above analysis, combined with the spirit of the opinions of the general office of the State Council on policies and measures to promote the healthy development of the logistics industry issued during the Twelfth Five-Year Plan period, Jiangsu Province formulated the Twelfth Five-Year Plan and the Thirteenth Five-Year Plan for the development of the logistics industry, which further increased the policy support for the green development of the logistics industry. The effects of these series of special policies have gradually emerged; however, it is true that green logistics is a long-term and arduous task, and the following suggestions are proposed.
(1) Local governments and logistics enterprises should raise their awareness of a low-carbon economy. On the one hand, they should accelerate the development and utilization of clean energy in place of traditional energy sources and increase the use of renewable energy sources, so as to reduce carbon emissions during logistics operations at the source [40]. On the other hand, they should strengthen the development and utilization of low-carbon technologies and further promote the application mode of “Internet + logistics”. Moreover, under the encouragement of a favorable policy environment, it is advised to accelerate the implementation of new processes and new methods and increase the output of unit energy consumption. While achieving economic benefits, the logistics enterprises should pursue a goal which boasts economic and social attributes, namely saving resources and protecting the environment. They should attach importance to the green logistics and the resulting energy saving, high efficiency, and low pollution, finally realizing the coordination of logistics activities with social and ecological benefits.
(2) Considering the differences in the distribution of logistics resources and the level of economic development in different regions, it is necessary to carefully choose the ER methods instead of imposing one method for various regions. For the regions with low ER intensities, raising the ER intensity is conducive to the improvement of the GTFP of the logistics industry. On the contrary, for the regions whose ER intensities have reached a certain level, further raising the ER intensity may inhibit the improvement of the GTFP [10,30,42]. Therefore, the government should grasp the environmental carrying capacity of the logistics industry in different regions more carefully, raise the ER intensity step by step, and make flexible, effective dynamic adjustment of ER policies, gradually optimize the combination of ER tools, especially the ER tools suitable for the current development of logistics industry in China, and encourage innovation. In this way, the GTFP of the logistics industry can be enhanced, and the sustainable development of green logistics can be promoted.
(3) While the ER purifies the logistics environment in the logistics process, it is suggested to consider the greening of both forward logistics links and the reverse logistics system in the supply chain [43,44,48]. In accordance with the concept of sustainable development, a reverse logistics system for processing products and packaging should be established. For example, a waste and old material center that is equipped with the functions of maintenance and recycling can be established to facilitate the recycling of waste and old material resources and to alleviate the pollution of waste and old materials to the ecological environment. The system is helpful to promote the unity of logistics, social, and environmental interests and realize the development of a circular economy.
Author Contributions
Conceptualization, Z.L. and Y.Y.; Methodology, Z.L., Y-h.C. and Q.G.; Software, Z.L. and Y.Y.; Validation, Z.L., Q.G., and Y.Y.; Formal Analysis, Z.L. and Y-h.C.; Investigation, Z.L. and X.L.; Resources, Z.L. and Y.Y.; Data Curation, Z.L., X.L. and Y.Y.; Writing—Original Draft Preparation, Z.L. and Q.G.; Writing—Review and Editing, Z.L., Y.Y. and Y-h.C.; Visualization, Z.L. and Y.Y.; Supervision, Q.G. and Z.L.; Project Administration, Y-h.C. and Q.G.; Funding Acquisition, X.L. All authors have read and agreed to the published version of the manuscript.
Funding
This research was supported by “the Ministry of Education of Humanities and Social Science Project of China (Grant No. 18YJA630061)”; “the Jiangsu Social Science Foundation Project (Grant No. 18EYB009)”; “Jiangsu’s high-end training program for the specialty leading person in higher vocational colleges (Grant No. 2019GRFX087)” and “the Qinglan Project of Jiangsu Province”.
Acknowledgments
We gratefully acknowledge the funding support from “the Ministry of Education of Humanities and Social Science Project of China (Grant No. 18YJA630061)”;”the Jiangsu Social Science Foundation Project (Grant No. 18EYB009)”;”Jiangsu’s high-end training program for the specialty leading person in higher vocational colleges (Grant No. 2019GRFX087)”and”the Qinglan Project of Jiangsu Province”.The authors wish to thank the anonymous reviewers and the editor of the special volume for their excellent and insightful comments.
Conflicts of Interest
The authors declare no conflict of interest. The funders had no role in the design of the study; collection, analyses, or interpretation of data; writing of the manuscript; and decision to publish the results.
References
- Jorgenson, D.W.; Wilcoxen, P.J. Environmental regulation and US economic growth. Rand J. Econ. 1990, 21, 314–340. [Google Scholar] [CrossRef]
- Filbeck, G.; Gorman, R.F. The relationship between the environmental and financial performance of public utilities. Environ. Resour. Econ. 2004, 29, 137–157. [Google Scholar] [CrossRef]
- Ang, J.B. CO2 emissions research and technology transfer in China. Ecol. Econ. 2009, 68, 2658–2665. [Google Scholar] [CrossRef]
- Kiuila, O.; Pesako, G. Sectoral and macroeconomic impacts of the large combustion plants in Poland: A general equilibrium analysis. Energy Econ. 2006, 8, 288–307. [Google Scholar] [CrossRef]
- State Council the People’s Republic of China. Medium and Long Term Planning of Logistics Development (2014–2020). Available online: http://www.gov.cn/zhengce/content/2014-10/04/content_9120.htm (accessed on 14 December 2019).
- Jiangsu Province “13th Five Year” Logistics Industry Development Plan. Available online: http://www.jiangsu.gov.cn/art/2016/11/24/art_46556_3614923 (accessed on 24 November 2016).
- Gray, W.B.; Shadbegian, R.J. Plant vintage, technology, and environmental regulation. J. Environ. Econ. Manag. 2003, 46, 384–402. [Google Scholar] [CrossRef]
- Yale University. The Environmental Performance Index Ranks Countries’ Performance on High-Priority Environmental Issues. Available online: http://epi.yale.edu/sites/default/fifiles/Yale%20EPI%202016_Report_0.pdf (accessed on 2 August 2019).
- He, L. Research on the Measurement of Total Factor Productivity of Logistics Industry in Jiangsu Province. Mod. Mark. Inf. Ed. 2019, 4, 52–53. [Google Scholar]
- Yu, C.L. Analyse on Logistics Industry TFP and Its Influencing Factors. Stat. Inf. Forum 2018, 33, 50–57. [Google Scholar]
- Shao, J.G.; Zhao, H.Q. The Contribution of Technical Progress to Economic Growth Based on Solow Residual: An Analysis of the Data of Shanghai from 1990 to 2013. J. Mianyang Teach. Coll. 2017, 36, 8–14. [Google Scholar]
- Zhang, J.; Wu, G.Y.; Zhang, J.P. The Estimation of China’s provincial capital stock: 1952–2000. Econ. Res. J. 2004, 10, 35–44. [Google Scholar]
- Tu, Z.G.; Xiao, G. The Transformation of China’s Industrial Growth Model—A Nonparametric Production Frontier Dynamic Analysis of Labor Productivity in Large and Medium-sized Enterprises. Manag. World 2006, 10, 57–67. [Google Scholar]
- Wang, Y.H.; Wu, F.; Wang, Z. Bootstrap-Malmquist Index Analysis of Productivity Changes in the Transportation Industry (1980–2005). China Econ. Q. 2008, 3, 891–912. [Google Scholar]
- Wang, F.; Ouyang, T. Analysis of factors’ contribution to Hunan economic growth based on Solow residual method. J. Hunan Agric. Univ. Soc. Sci. 2013, 14, 64–69. [Google Scholar]
- Li, X.S.; Chen, L.D. Analysis of Logistics Industry’s Contribution to Scientific Advancement in Hebei Based on Solow Residue Method. Logist. Technol. 2014, 17, 207–210. [Google Scholar]
- Dong, F.Y.; Han, Y.M. Tecnology Progress Contribution Rate Calculatio of Wheat in Henan Province Basid on the Exeded Grey Relation Degree. Chin. J. Mgmt. Sci. 2015, 23, 667–671. [Google Scholar]
- Yu, X.; Ling, Y.Y. Calculation Errors of Agricultural Technological Progress Contribution under Yield Fluctuations Rate. Sci. Technol. Manag. Res. 2016, 36, 56–59. [Google Scholar]
- Fu, L.N.; Chen, X.H.; Leng, Z.H. Urban Agglomerations Eco-efficiency Analysis Based on Super-efficienty DEA Model: Case Study of Chang-Zhu-Tan “3+5” Urban Agglomeration. China Popul. Resour. Environ. 2013, 23, 169–175. [Google Scholar]
- Xiong, S.; Mai, Y.Y.; He, X.B.; Xiao, R.Q. A Study on Operational Efficiency of Hi-tech Startups in China Based on DEA Methods. J. Manag. Sci. 2014, 27, 26–37. [Google Scholar]
- Li, J.Y.; Mu, Y. Innovation Performance of Chinese Public Companies Based on DEA Method. Sci. Sci. Manag. S T 2015, 36, 111–121. [Google Scholar]
- Han, S.; Su, X. Study on Structure Efficiency of Chinese Commercial banking:Basing on Complex Network DEA model. Chin. J. Manag. Sci. 2016, 24, 1–9. [Google Scholar]
- Liu, F.; Deng, M.L. The Technology Innovation Efficiency Analysis of Yangtze River Economic Belt Using PCA and SE-DEA Joint Model. Sci. Technol. Prog. Policy 2017, 34, 48–53. [Google Scholar]
- Guo, S.D.; Tong, M.; Guo, J.; Han, Y. Measurement and influencing factors of inter-provincial real environmental efficiency based on three-stage DEA model. China Popul. Resour. Environ. 2018, 28, 106–116. [Google Scholar]
- Wang, X.H.; Wen, J.Y. The Agricultural Products Logistics Efficiency and Its Regional Difference in China: A SFA Method Analysis Based on Provincial Panel Data. Contemp. Econ. Manag. 2015, 37, 26–32. [Google Scholar]
- Fan, Y.J.; Wang, J. Research on the Production Service Efficiency of China’s Logistic Corridors—An Empirical Study Based on SFA Panel Data Model. J. Yunnan Univ. Financ. Econ. 2016, 32, 22–36. [Google Scholar]
- Yu, L.J.; Wang, H.F.; Jang, Y.Q. Research on Regional Logistics Efficiency in Shandong Province Based on Stochastic Frontier Analysis. Logist. Eng. Manag. 2017, 39, 16–18. [Google Scholar]
- Lin, J. China Logistics Total Factor Productivity and Its Influencing Factors Studies. Ph.D. Thesis, Hunan University, Changsha, China, 2010. [Google Scholar]
- Wang, Q.M.; Tan, C.E. An Empirical Study on the Logistics Efficiency of Xi’an and its Influencing Factors—Based on the Analysis of the DEA Model and the Tobit Regression Model. Soft Sci. 2013, 27, 70–74. [Google Scholar]
- Ding, R. Study on the Dynamic Evolution of Total Factor Productivity and Its Affect Factors in Jiangxi Logistics Industry. Ph.D. Thesis, East China Jiaotong University, Nanchang, China, 2014. [Google Scholar]
- Zhao, L. The Research on the Efficiency of China’s Provincial Logistics Industry and Its Factors. Ph.D. Thesis, Beijing Jiaotong University, Beijing, China, 2014. [Google Scholar]
- Yang, J.; Song, M.L. Efficiency Evalution on China’s Logistics Industry and the Analysis of Influencial Factors: A Provincial Panel Data-based Study. J. Shijiazhuang Univ. Econ. 2010, 33, 77–80. [Google Scholar]
- Liang, W.; Xu, L.Y. An Empirical Study on Total Factor Productivity and Influencing Factors in Logistics Industry. J. Mianyang Teach. Coll. 2017, 36, 34–40. [Google Scholar]
- Porter, M.E.; van der Linde, C. Toward a new conception of the environment-competitiveness relationship. J. Econ. Perspect. 1995, 9, 97–118. [Google Scholar] [CrossRef]
- Berman, E.; Bui, L.T.M. Environmental regulation and productivity: Evidence from oil refineries. Rev. Econ. Stat. 2001, 83, 498–510. [Google Scholar] [CrossRef]
- Mazzanti, M.; Zoboli, R. Enviromental efficiency and labour productivity: trade-off o rjoint dynamics? Ecol. Econ. 2009, 68, 1182–1194. [Google Scholar] [CrossRef]
- Sun, Y.H.; Liu, N.N.; Zhang, Y.H. Regional Comparison of the Relationship between Environmental Regulation and TFP in China. J. Dongbei Univ. Financ. Econ. 2018, 1, 33–40. [Google Scholar]
- Cai, N.; Wu, J.W.; Liu, S.Y. On Environmental Regulation and the Green Industrial Total Factor Productivity—Empirical Analysis Based on the Data of 30 Provinces in China. J. Liaoning Univ. Philos. Soc. Sci. 2014, 42, 65–73. [Google Scholar]
- Wu, Z.X.; Zhang, Z.Y. The Study of Environmental Regulations Impact on China’s Manufacturing Industry Total Factor Productivity. J. Xiangtan Univ. Philos. Soc. Sci. 2016, 40, 77–81. [Google Scholar]
- Hu, J.; Wang, Z.; Lian, Y.; Huang, Q.H. Environmental regulation, foreign direct investment and green technological progress-Evidence from Chinese manufacturing industries. Int. J. Environ. Res. Public Health 2018, 15, 221–235. [Google Scholar]
- Jiang, L.P. A Comparative Study of the Total Factor Productivity of Chinese Industry under Environmental Regulation. Knowl. Econ. 2016, 8, 25–26. [Google Scholar]
- Jin, Y.X. The Effect of Environmental Regulation on Industrial Green TFP Analysis—In Shanxi Province as an Example. Ph.D. Thesis, Shanxi University of Finance and Economics, Taiyuan, China, 2016. [Google Scholar]
- Du, J.; Liu, Y.; Diao, W. Assessing Regional Differences in Green Innovation Efficiency of Industrial Enterprises in China. Int. J. Environ. Res. Public Health 2019, 16, 940. [Google Scholar] [CrossRef]
- Yin, B.Q. Environmental Regulation and China’s Green Total Factor Productivities: Based on the Perspective of Vertical Specialization. China Popul. Resour. Environ. 2012, 22, 60–66. [Google Scholar]
- Ma, S.P. A Research on Impact of Environmental Regulation on Total Factor Producticity. Ph.D. Thesis, Dalian University of Technology, Dalian, China, 2015. [Google Scholar]
- Guo, Q.G. Study on the Impact of Environmental Regulation on Construction Industries’ TFP Growth. Constr. Econ. 2015, 36, 24–27. [Google Scholar]
- Liu, H.W.; Zheng, S.L.; Zuo, W.T. The influence mechanism of environmental regulation on TFP of enterprises. Sci. Res. Manag. 2016, 37, 33–41. [Google Scholar]
- Cai, W.G.; Zhou, X.L. Dual Effect of Chinese Environmental Regulation on Green Total Factor Productivity. Economist 2017, 9, 27–35. [Google Scholar]
- Liu, Y. The Impact of Environmental Regulation on Firms’ Total Factor Productivity in China. Ph.D. Thesis, University of Electronic Science and Technology of China, Chengdu, China, 2017. [Google Scholar]
- Hansen, L.P. Large Sample Properties of Generalized Method of Moments Estimators. Econometrica 1982, 50, 1029–1054. [Google Scholar] [CrossRef]
- Pagan, A.; Wickens, M. A Survey of Some Recent Economertic Methods. Econ. J. 1989, 99, 962–1025. [Google Scholar] [CrossRef]
- Harberger, A.C. The Incidence of corporation Income Tax. J. Polit. Econ. 1962, 70, 215–240. [Google Scholar] [CrossRef]
© 2019 by the authors. Licensee MDPI, Basel, Switzerland. This article is an open access article distributed under the terms and conditions of the Creative Commons Attribution (CC BY) license (http://creativecommons.org/licenses/by/4.0/).