Article

Evaluation Research of Green Innovation Efficiency in China’s Heavy Polluting Industries

1
School of Economics, Fujian Normal University, Fuzhou, Fujian 350007, China
2
Centre for Applied Economic Research, Faculty of Management and Economics, Tomas Bata University in Zlín, nám. Masaryka 5555, 76-001 Zlín, Czech Republic
*
Authors to whom correspondence should be addressed.
Sustainability 2020, 12(1), 146; https://doi.org/10.3390/su12010146
Submission received: 30 November 2019 / Revised: 18 December 2019 / Accepted: 19 December 2019 / Published: 23 December 2019
(This article belongs to the Special Issue Sustainability Assessment)

Abstract

:
Recently, green innovation efficiency, which considers innovation and environmental factors, is gradually becoming important for the sustainable development of Chinese heavy polluting industries because of the increasing strictness in China’s environmental regulations. Previous studies ignore the impact of external environmental factors on the efficiency of green industry innovation and fail to explain the complex relationship between environmental and technical efficiency fully. Therefore, a non-radial directional distance function-data envelopment analysis (DDF-DEA) three-stage green innovation efficiency evaluation model was constructed to measure the green innovation efficiency of China’s heavy polluting industries objectively and explore the impact mechanism of external factors. Then, the aforementioned model was used to conduct an empirical test on China’s heavy polluting industries. Results indicate that the green innovation efficiency of heavy polluting industries is generally low in China, and the entire industry is in the transitional stage of “effective innovation but not green.” The uncertainty of the effect of the environmental regulation policy, the over-reliance on external technologies, and the scale diseconomies of industries, which are the key factors in improving the green innovation efficiency of China’s heavy polluting industries, have a significant negative impact on green innovation efficiency. The conclusions of this study can provide a useful reference for China and other emerging markets to formulate reasonable environmental regulations and green transition of heavy polluting industries.

1. Introduction

Industrial pollution, as a subsidiary product of economic development, has become a key to the sustainable development of developing countries because of the rapid development of industrialization and urbanization. Statistics show that heavy pollution industries are the core of China’s industrial economy and have greatly contributed to the rapid growth of its economy in recent years [1,2,3]. However, the heavy pollution industries have high energy consumption, emission, and pollution. In 2017, China’s heavy polluting industries consumed 3.03 billion tons of standard coal, which accounts for 60.31% and 80.17% of the country’s total and industrial energy consumption, respectively. Excessive energy consumption has a significant negative impact on the ecological environment. At present, CO2 emissions from heavy polluting industries in China accounted for approximately 56.67% of the country’s total emissions [4]. Since 2012, haze has frequently occurred in the concentrated areas of China’s heavy polluting industries (e.g., the Beijing–Tianjin–Hebei Region and the Northeast China Region). According to 2018 Chinese Environmental Status Bulletin [5], the distribution of cities and heavy industries with poor air quality almost completely coincide. This haze hazard has exposed the vulnerability of China’s ecosystem and has also revealed the serious environmental pollution problems caused by heavy polluting industries further [4,6]. Although the Chinese government has been committed to adopting policies and regulations to improve the pollution problems of heavy polluting industries since 1990 [7], the environmental pollution cost caused by heavy polluting industries (e.g., chemical, cement, and coking) is still placing serious pressure on the sustainable development of China’s economy. This trend needs to be changed. Proper ways of reducing energy intensity and improving energy efficiency should be developed to realize the green transformation of traditional heavy polluting industries.
From the perspective of the ecosystem, green and innovation are two key factors in the transformation of traditional industrial economy. The green innovation of heavy polluting industries is a process that considers innovation and green efficiency both. Several researchers have integrated environmental factors into the technological innovation research framework to explore the path of innovation efficiency sustainable development [8,9,10]. Moreover, some researchers emphasized that the optimal allocation of innovation factors in heavy polluting industries is under the objective constraint of environmental policies. These constraints not only exist in the direct impact of environmental policies on the innovation process of heavy polluting industries but also in the indirect impact of the introduction of enterprise technology and other related factors [11]. Therefore, the green innovation of heavy polluting industries is a crisscross network system with multifactor and multipath interaction effects [12].
The evaluation of green innovation efficiency is the “measuring instrument” of green innovation efficiency. Considering the importance of environmental pollution prevention, the green innovation efficiency discussed in this article is a comprehensive efficiency that considers innovation efficiency and environmental efficiency together. Recently, the economic and environmental performance of China’s industrial sector has gradually attracted the attention of many researchers [13,14]. To a country or a region, the key to promoting the green innovation transformation of heavy polluting industries is to measure green innovation efficiency properly and explore appropriate environmental regulations to higher the green innovation efficiency.
The aforementioned analysis provides a justification for taking China’s heavy polluting industries in this study as an example to discuss the complex relationship between environmental and innovational sub-system development efficiency. Thus, three questions are needed to be answered in this study: (1) Do external factors, such as environmental regulations, affect the green innovation efficiency of heavy polluting industries in China? (2) How to eliminate the influence of external factors and measure the green innovation efficiency of China’s heavy polluting industries objectively? (3) How to improve green innovation efficiency and promote the sustainable development of China’s heavy polluting industries effectively? Facing the three aforementioned problems, the innovation and environmental outputs are fitted by this study to establish a dual-expected output joint efficiency model for green innovation efficiency in heavy polluting industries. Then, China’s 17 heavily polluting industries (2004–2016 dataset) were selected as the object of empirical analysis to explore the status and key influencing factors of China’s heavy polluting industries’ green innovation.
This study explores and supplements the complex relationship powerfully between technological innovation and environmental regulation in heavy polluting industries in developing countries from the perspective of green innovation and provides scientific policy reference and suggestions for the green transition and sustainable development of heavy polluting industries. However, due to the limited sample dataset, the application of the proposed method is limited too, which is valuable to be overcome in the future.
The remainder of this study is organized as follows. Section 2 discusses the relevant literature on the evaluation of green innovation efficiency and proposes the innovation points of this work. Section 3 illustrates the non-radial DDF-DEA three-stage model and the source of the empirical dataset in detail. Section 4 discusses the key findings of empirical analysis. Section 5 concludes the paper and presents directions for future work.

2. Literature Review

In recent years, the ecological and environmental problems caused by the discharge of pollutants from heavy polluting industries have gradually attracted the attention of researchers worldwide because of the acceleration of the industrialization process in developing countries. Meanwhile, sustainable innovation is increasingly appearing in the development strategic planning of developing countries. The word “sustainable innovation” comes from “environmental efficiency,” which was firstly proposed by Fare et al. [15] (Rio Earth Summit) to measure production efficiency in the context of environmental efficiency. Since then, an increasing number of researchers focused on the complex relationship of the environment, economy, and innovation. Overall, a great number of works regarding the measurement and evaluation of sustainable innovation efficiency could be grouped into three parts as follows.
(1) Policy research to improve sustainable innovation efficiency. Studies on this part are generally based on a macro-level perspective. Brown et al. [16] proposed that industry entry thresholds should be established on the basis of pollutant emissions, and companies that could not meet the standard should not be allowed to enter the industry market. However, the pollutant emission threshold is only a preventive measure that cannot regulate the activities of companies in the industry strictly. As such, Miranda et al. [17] proposed that the taxation policy should be used to adjust the environmental costs of enterprises, that is, the enterprise operations will be influenced and the enterprises will be urged to improve energy efficiency through the study of different taxation environments for environmental taxes. However, Yi et al. [18] believed that government oversight and environmental regulation were more effective than tax incentives in improving sustainable innovation.
(2) Factors research on influencing sustainable innovation efficiency. From the perspective of the industry’s sustainable development, technological transform is the main answer to environmental problems, but the efficiency of sustainable technology innovation is subject to various factors, among which environmental regulation has a direct impact [19,20,21]. Some researchers highlighted that appropriate and complete environmental regulatory policies could induce enterprise innovation that would result in “innovation compensation effect” and competitive advantage, thereby improving sustainable innovation efficiency [22,23]. In addition, Feng et al. [24] further expanded the study of Porter et al., who pointed out that although environmental regulation had a decisive impact on sustainable innovation efficiency, significant differences in the impact mechanism and process of different types of environmental regulation were observed [25]. Therefore, relevant factors, such as technology introduction, research and development (R&D) investment, and enterprise scale should be included in the impact mechanism of sustainable innovation efficiency, so as to better understand the mediating effect of environmental regulation on sustainable innovation efficiency.
(3) Evaluation research on sustainable innovation efficiency. In general, the evaluation methods of sustainable innovation efficiency could be divided roughly into two categories, namely, decomposition analysis and measurement. The two main decomposition analysis methods are index decomposition analysis based on index theory (CA) [12,25] and structure decomposition analysis based on input–output theory [26,27,28]. However, in evaluating the sustainable innovation efficiency process, these two decomposition analysis methods mostly rely on short-term data, which often negatively affects the objectivity of the evaluation process. Therefore, many researchers tend to evaluate environmental efficiency through the measurement model because the empirical tests of measurement economy require accurate data with a long-time span, and the test results are often considered scientific and standardized. In the application of econometric models, some works use basic measurement tools, such as panel techniques, vector autoregressive model, and threshold model, to evaluate environmental efficiency. Based on these measurement models, the time series data from various industries are used in sustainable innovation efficiency evaluation [25,29]. In addition, the DEA method is widely used for environmental efficiency evaluation. As a non-parametric method, DEA has been widely used in the field of environmental efficiency evaluation. Zaim et al. [30] used the DEA method for environmental efficiency evaluation earlier, but the traditional DEA method could not distinguish the undesirable output required for environmental efficiency assessment effectively. Therefore, DDF and SBM models are developed to address the undesirable output. DDF is a model based on a weak disposition ability hypothesis, which is derived from the different improvements of input and output based on the distance function. This model could increase the desirable output and reduce the undesirable output [31,32]. Cooper et al. [33] constructed the DEA-SBM model to avoid the slack problem and angle selection in the traditional computing process. Furthermore, its RAM environment evaluation system was used by various researchers.
Previous works evaluate sustainable innovation efficiency based on different theoretical perspectives and practice methods that have important reference value for understanding and evaluating the efficiency of sustainable innovation. However, these methods do not pay sufficient attention to the influence of external environment factors on environmental efficiency. Thus, some deficiencies in efficiency measurement objectivity are observed. To this point, Fried et al. [33] proposed a three-stage DEA method based on the traditional DEA model to eliminate the interference of external environment and random noise on decision-making unit (DMU) efficiency, thereby making the efficiency evaluation more objective [34]. Zhao et al. [35] used this three-stage method to evaluate the eco-efficiency of Chinese provinces. Notably, all positive outputs are selected in the DEA models of the aforementioned researchers. Environmental pollutants, which are the negative outputs, are the key problems that needed to be overcome to ensure that the three-stage DEA method runs properly. Therefore, the non-radial DDF method is adopted in this study to optimize the traditional DEA model. Subsequently, the linear data transformation method is used to transform the environmental pollutant data to maintain the convexity and linear relationship in the three-stage DEA modeling. This operation is helpful in dealing with the problem of negative output and to obtain evaluation results with higher accuracy effectively. In addition, previous studies on China’s sustainable innovation efficiency evaluation mainly focused on provincial data or on manufacturing industry evaluations [1,2,36], with minimal attention given to sustainable innovation of heavy polluting industries. Sustainable innovation in heavy polluting industries is a process of multi-subject and multipath interaction. Therefore, this study combines innovation and environmental outputs to construct the unified efficiency measurement model for sustainable innovation efficiency evaluation in heavy polluting industries, which is used to estimate the sustainable innovation efficiency and provide transforming reference guidelines for different heavy polluting industries.

3. Materials and Methods

3.1. Non-Radial DDF-DEA Three-Stage Model

3.1.1. First Stage: Non-Radial DDF-DEA Model

Charnes et al. [37] adopted DEA to evaluate environmental efficiency, that is, the multiple input and output data of DMU were compared from the perspective of the production function. The DMUs were compared with efficient production frontiers to determine their relative efficiencies. However, this method cannot distinguish desirable outputs from undesirable ones effectively. For this reason, this study constructed a non-radial DDF-DEA model based on the DDF model developed by Fare et al. [38] to identify the undesirable outputs, so as to deal with environmental pollution variables more scientifically.
Suppose N evaluation units with N input factors x exist in a certain input production process, x = ( x 1 , x 2 , , x n , ) T n + , with M output indicators y, y = ( y 1 , y 2 , , y m ) T m + . The corresponding technology set can be defined as:
P R S = {   ( x , y ) ,   x y }
Subsequently, the distance function, which increases outputs and reduces inputs by direction vector path is used based on the shortage function proposed by Luenberger [39]. The DDF model can be expressed as follows:
D t ( x , y , g ) = max { β : ( x β g x , y + β g y ) P R S t } ,  
where g = ( g x , g y , g B ) is the direction vector that defines the direction of input and output changes, and β is the input–output ratio, which denotes the optimal solution to achieve the maximum desirable outputs and the minimum undesirable outputs. Considering the relativity of the green environment innovation efficiency, the optimal solution is acquired by the DEA model based on the DDF function formula similar to that in Picazao et al. [40]:
  β * s . t . { k = 1 N λ x + β g x x k , ( k = 1 , , N )   r = 1 N λ y β g y y r , ( r = 1 , , N )   j = 1 N λ Β β g B B j , ( j = 1 , , N )   λ 0 ;
where β is the measurement of inefficiency, and β * is the optimal solution. χ is the input, y is the desirable output, and B is the undesirable output, represents a pollutant. g x , g y , g b express the direction vector. λ is the linear combination coefficient. k , r , j is the DMU with k , r , j = 1 , 2 , N units.
In contrast with the traditional DEA model, the DDF model distinguishes the desirable output from the undesirable output, thereby matching the connotation of green environment efficiency evaluation effectively. However, as a radial efficiency measurement method, the DDF is performed by reducing the output and increasing the input in the same direction and proportion. The efficiency value of non-zero and slack variables obtained by this method is often overestimated. For example, in the radial DEA model constructed by Formula (2), all pollutants and other undesirable outputs should be reduced in the same proportion when the environmental technology innovation input is added. However, if one of the pollutants Β 1 has reached the maximum reduction ratio β 1 while the other pollutant Β 2 has not, and then Β 2 can be further reduced. Therefore, in practice, the constraints of “increase and decrease in the same proportion” required for radial measurement are difficult to achieve, thereby leading to errors in environmental efficiency evaluation. To this end, this study develops a non-radial DDF by calculating the directional slack variables based on DDF function, that is, the non-radial DDF model based on the study of Zhou et al. [41], as shown in Formula (4):
D t ( x , y , g ) = max { w t β : ( x , y ) + g d i a g ( β ) P R S t } ,  
where ω = ( ω χ , ω y , ω B ) represents the standardized weight vector (i.e., the weight value of input and output). g = ( g x , g y , g B ) represents the direction vector, which defines the direction of input and output change. β = ( β x , β y , β B ) k denotes the ratio of input and output changes. P R S t is a set of pressure requirement that represents all possible combinations y of production added value χ .
On the basis of Formula (4), the optimal solution is also achieved by the DEA model (Formula (5)):
ω x β x * + ω y β y * + ω B β B * s . t . { k = 1 N λ x + β x g x x k , ( k = 1 , , N )   r = 1 N λ y β y g y y r , ( r = 1 , , N )   j = 1 N λ Β β B g B Β j , ( j = 1 , , N )     g x , g y 0 ,   g B 0 λ 0 ,   β x , β , y , β B 0
where β is the measurement of inefficiency, and β * is the optimal solution. x is the input, y is the desirable output, ω χ , ω y , ω B represents the standardized weight vector and B is the undesirable output, represents a pollutant. g x , g y , g B express the direction vector. λ is the linear combination coefficient. k , r , j is the DMU with k , r , j = 1 , 2 , N units.

3.1.2. Second Stage: Input–Output Adjustment of the SFA Model

Fried [34] believed that the gap between the original and the target input values is a result of the difference between the overall invalidity and validity caused by external environmental factors, random errors, and inefficient management. Thus, distinguishing the extent of influence of these three factors is necessary. Therefore, the SFA model is used to eliminate the influence of external environmental and random error factors to ensure that management inefficiency is the only cause of the inadequacy of each DMU. Suppose i DMUs with m inputs and Ζ external environment variables exist. The constructed SFA regression equation can be expressed as follows:
S n k = f ( z k : β n ) + ν n k + μ n k   n = 1 , 2 m ;   k = 1 , 2 , i ,  
where S n k denotes the slack variable of DMU k with input n. z k is the environmental variable. β n is the coefficient of the environmental variable. f ( z k : β n ) represents the effects of environmental variables on slack variables and is usually expressed as f ( z k : β n ) = z k β n where z k = ( z 1 k , z 2 k , , z λ k ) is the external environment variable of DMK k , and β n is the coefficient of the environmental variable to be estimated. ν n k + μ n k is the composed error term, ν n k and μ n k are independent and irrelevant, respectively. ν n k is the random interference that expresses its influence on input slack variables following the distribution of N ( 0 , δ n k 2 ) . μ n k denotes the managerial inefficiency that expresses the influence of management factor on input slack variable following the distribution of N + ( μ n , δ n k 2 ) . Suppose θ is the ratio of managerial inefficiency variance to total variance, which can be expressed as θ = δ μ n 2 ( δ μ n 2 + δ ν n 2 ) . θ approaching 1 indicates that μ n k is the dominant factor, whereas θ approaching 0 indicates that ν n k is the dominant factor. Therefore, distinguishing the random interference ν n k from managerial inefficiency μ n k in the composed error term is necessary. To achieve this, Frontier4.1 is initially used for maximum likelihood estimation, and the estimated value for δ 2 , θ , β n is obtained. Next, the conditional expectation of managerial inefficiency μ is obtained by using the method proposed by Johndrow et al. (1982) [42]:
E ^ [   μ n k | μ n k + μ n k ] = θ δ 1 + θ 2 ( ϑ ( θ ε n ) σ ( θ ε n ) + θ ε n ) ,
where ϑ and σ denote the standard normal distribution function and density function, respectively, and ε n is the error term. The estimated value for the random interference term ν n k is further obtained as:
E ^   [   ν n k | ν n k + μ n k ] = S n k f ( z k : β ^ n ) E ^ [   μ n k | ν n k + μ n k ] .
The input variables of DMUs that have not reached the effective level are adjusted accordingly to organize all DMUs in an identical external environment based on the SFA regression analysis results. The adjustment is calculated according to the following formula:
x n k = x n k + [ max ( f ( z k β ^ n )   ) f ( z k β ^ n )   ] + [ max ( ν ^ n k ) ν ^ n k ] ,
where x n k denotes the adjusted inputs of DMU k with input n , and x n k denotes the initial inputs. β ^ n represents the estimated value for environment variables. [ max ( f ( z k β ^ n )   ) f ( z k β ^ n )   ] denotes the external environmental factor adjustments for all DMUs with input n . [ max ( ν ^ n k ) ν ^ n k ] indicates that all DMUs must be placed in the context of the maximum random interference to ensure that all DMUs are confronted with the same external environment. The non-radial DDF-DEA three-stage model is subsequently used for the third stage analysis.

3.1.3. Third Stage: Revised DEA Model

The adjusted input data derived from the second-stage processing is used to replace the original input data, while the output is still the original output data. The non-radial DDF-DEA model is used again for evaluation. The efficiency values obtained in the third stage exclude the impact of external environmental factors and random noise. The evaluation results can truly reflect the level of energy conservation and emission reduction.

3.2. Industry Data

Based on the Guidelines for the Industry Classification of Listed Companies (2012 Revision) [43] issued by the China Securities Regulatory Commission, this study refers to heavy polluting industries, such as coal mining, chemical products manufacturing, petrochemical, steel smelting, cement manufacturing, electrolytic aluminum, construction materials manufacturing, papermaking, alcohol, and wine manufacturing, medicine manufacturing, fermentation, spinning and weaving, fur tanning, metallurgy, and mining industry. In addition, considering the sample validity and time span and compared with Industrial classification for national economic activities (GB/T 4754 -2011) [44], this study selects 17 industries as research objects: Mining and washing of coal (B06), extraction of petroleum and natural gas (B07), food processing of agricultural products (C13), textile manufacture (C17), furniture manufacture (C21), paper and paper product manufacture (C22), processing and coking of petroleum and nuclear fuel (C25), chemical raw material and product manufacture (C26), medicine manufacture (C27), general purpose machinery manufacture (C34), special purpose machinery manufacture (C35), transportation equipment manufacturer (C36), electrical machinery and equipment manufacturer (C38), communication equipment, computers, and other electronic equipment manufacturer (C37), measuring instrument and machinery manufacture of cultural activity and office work (C40), artwork manufacture and other manufacturing (C24), and production and distribution of electric and heat power (D44). The sample ranges from 2004 to 2016. The data mainly came from China Statistical Yearbook [3], China Environmental Statistical Yearbook [45], and China Energy Statistical Yearbook [46]. If some years of data are missing, then the nearest estimation method or linear implantation method is used for the estimation.

3.3. Description of Input-Output Indicators and Influencing Factors

3.3.1. Input and Output Variables

Industry innovation efficiency is generally measured by innovation input and output. Innovation input includes labor and capital inputs. In this study, the R&D personnel of the 17 aforementioned industries were selected for labor input, and the R&D expenditure of each industry was chosen as capital input. Energy input is indispensable in green innovation. To measure the efficiency of green innovation, the total energy consumption of each industry, and the corresponding energy purchase price index were used as substitute indicators. Green innovation output includes desirable and undesirable outputs. For desirable output, we selected the sales revenue of new products and the number of invention patents in each industry. The sum of the total discharge of industrial solids, wastewater, and exhaust emissions in various industries is measured to investigate the environmental pollution factors comprehensively. The entropy weight method is then used for dimensionality reduction to integrate the three major emission indicators into one environment pollution index, which will be used to represent the undesirable output.

3.3.2. Influencing Factors

The selected variables of green innovation influencing factors must meet the requirements of the “separation hypothesis,” that is, the factors must affect the efficiency of green innovation. However, the selected sample cannot be changed subjectively in a short period of time. Researchers have many inconsistent empirical results on the factors that influence the efficiency of green innovation [47,48,49,50,51,52], but they generally believe that environmental regulation, enterprise scale, technology introduction costs, and government support have significant effects on green innovation efficiency [53,54,55].

Environmental Regulation

Proper environmental regulations contribute to the improvement of resource efficiency and promotion of enterprises’ technological innovation, thereby becoming a net positive driving force of the overall industry and economy development [22]. However, environmental regulation has positive “innovation compensation” effects and negative “offsetting” effects on sustainable technology innovation. Heavy polluting industries are of high investment, risk, and profitability. Thus, focusing on environmental protection policy becomes inevitable. At present, no definite measurement index is available for environmental regulation intensity, and researchers tend to choose the proxy indicators to represent it. The commonly used proxy indicators include decontamination capability of certain pollutants [56], investment expenditures for environmental pollution control [57], regional economic development [58,59,60,61], and the number of relevant laws and policies for environmental regulation [3]. However, the implementation of relevant laws and policies for environmental regulation is often subject to external factors and cannot show the effect of environmental regulation directly. Regional economic development affects the effectiveness of environmental regulation but is not a decisive factor. The investment expenditure for pollution control is closely related with the size of the industry. Large-scale and well-funded industries naturally invest in pollution control, which does not necessarily lead to high environmental regulation intensity, more than small-scale industries. Therefore, in this study, we construct the indicator of pollution emission by selecting industrial wastes (e.g., waste gas, wastewater, and solid waste) using the comprehensive index construction method to measure the intensity of environmental regulation. The indicator is obtained after normalized and standardized processing as follows.
① The pollutants emitted by the 17 selected industries are normalized to settle the problem of intensity difference. The annual wastewater discharge, solid waste production, and industrial S O 2 emissions of each industry will be divided by the gross industrial output value of each industry, as shown in Formula (10):
p n i t = p n i t Y i t , n = 1 , 2 , 3
where p is the N emission of industry i in year t , and Y i t represents the gross industrial output value of the industry i in year t .
② The emissions of each industry with the value range between [0,1] are standardized, as shown in Formula (11):
p x n i t = p n i t ( 1 n ) i = 1 m p n i t , n = 1 , 2 , 3 ,  
where p x n i t is the standardized value of p n i t , which represents the nondimensionalization discharge of pollutant n . The higher the value, the higher the level of pollutant emissions of this industry is in the entire manufacturing industry.
③ The standardized data is horizontally comparable, and the total sum is also informative. Therefore, the intensity of environmental regulation p x i t can be measured by the sum of pollutants from each industry after standardization, as shown in Formula (12):
p x i t = p x 1 i t + p x 21 i t + p x 3 i t 3 .
Given that the environmental regulation intensity index is measured by the amount of pollutant emissions, the larger the value of p x i t , the smaller the environmental regulation intensity is, and vice versa.

Technology Introduction Costs

Unlike traditional technological innovation, green innovation is based on technological innovation, which has higher complexity and is the direction of industrial transformation. The support of external scientific research has become an important means of independent innovation in many industries. Therefore, the technology introduction costs in each industry’s research and development funds are used as representative indicators.

Enterprise Scale

In contrast with small and medium-sized enterprises, large enterprises evidently play a greater role in technological innovation because technological innovation is achieved at the expense of enterprise development to some extent. For enterprises in the heavy polluting industries, the high cost and risk of green innovation enable enterprises with an appropriate scale and abundant resources to have sufficient incentive to innovate. Enterprise scale is closely related to technological innovation, which will inevitably have a significant impact on the overall green innovation process in the industry. Therefore, the proportion of large enterprises to the total number of enterprises in the industry is selected as the representative indicator.

Government Support

The “externality” inherent in green innovation is likely to bring high R&D costs and risks to enterprise innovation. Appropriate government intervention can make up for this deficiency, but excessive intervention will trigger the “crowding-out effect,” which is not conducive to enterprise technology innovation. This work regards government support as an influencing factor of the industry green innovation. Moreover, the proportion of government funds in the industry R&D expenditure is used as an indicator of government support.

4. Results

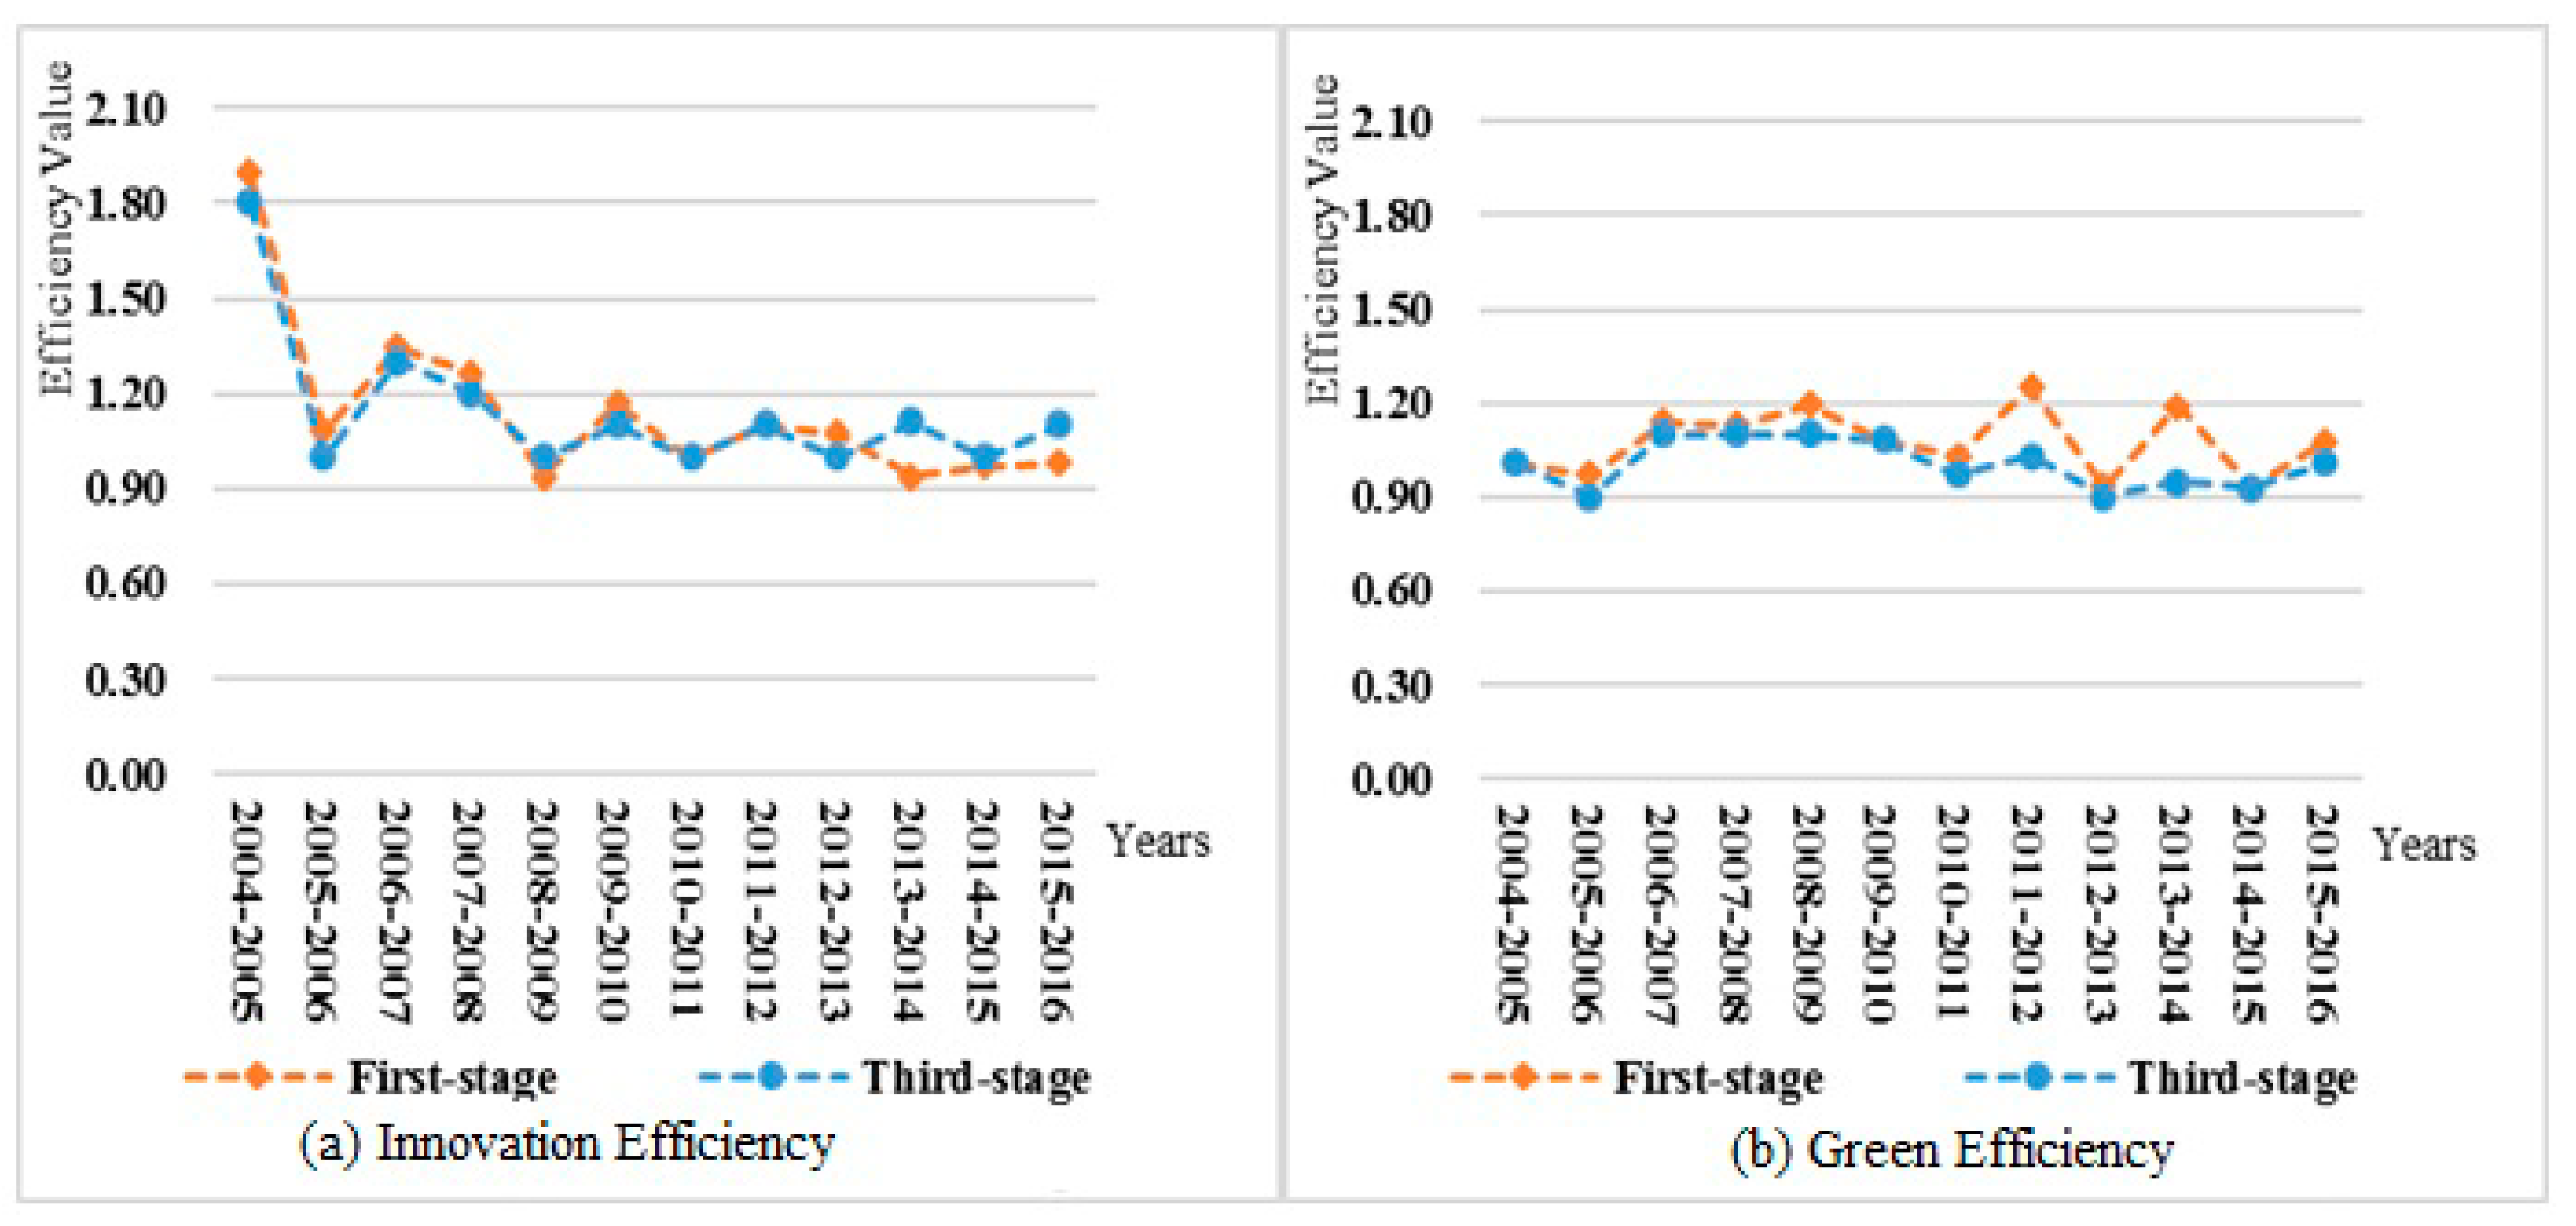
4.1. First Stage: A Comprehensive Green Innovation Efficiency Analysis

Non-radial DDF model that considers undesirable output is applied to analyze the initial efficiency of raw input–output data. The green innovation efficiency value of China’s heavy polluting industries from 2004 to 2016 is calculated by MAXDEA software (Table 1). In the past decade or so, the innovation and comprehensive efficiencies of China’s heavy polluting industries have represented a wave-like evolution, whereas their green efficiency has been relatively stable (Figure 1). The comprehensive efficiency increased from 1.31 in 2004 to 2.04 in 2009 and then decreased to 1.03 in 2016. Generally, according to the comprehensive efficiency value, the 17 industries can be categorized into high green innovation efficiency (with the average comprehensive efficiency value above 1.2), medium green innovation efficiency (with the average comprehensive efficiency value between 1.1 and 1.2), and low green innovation efficiency (with the average comprehensive efficiency value below 1.1). Three industries, namely, D44, C24, and C38, fall into the category of high green innovation efficiency. Four industries, namely, C37, C27, C40, and C35, fall into the category of low green innovation efficiencies. The 10 other industries, namely, C17, C26, C21, C36, B06, C13, C25, B07, C37, and C22, fall into the category of medium green innovation efficiency). From the perspective of the decomposition of green innovation efficiency, innovation efficiency was higher than green efficiency before 2009. However, since 2009, the two have been basically the same because of the disturbance of external environmental factors and random noise and insufficient optimization.

4.2. Second Stage: The Impact of External Environment on Green Innovation Efficiency

The SFA model is used to eliminate the impact of external environmental factors and random noise on green innovation efficiency. Although environmental regulation policy, technology introduction costs, enterprise scale, and government support are not controlled by the effect of the DMU’s scale, they will affect the sales revenue of new products and the exhaust emission. In this study, the stochastic frontier SFA model has been established by selecting the input slack variables obtained in the first stage as the explained variables and by choosing four environmental variables, namely, environmental regulation, technology introduction costs, enterprise scale, and government support, as the explanatory variables. FRONTIER 4.1 is used for regression, and the results are shown in Table 2.
The premise of empirical testing using the SFA model is the existence of management inefficiencies, which can be tested by the LR unilateral likelihood ratio test. Table 2 shows that the degree of freedom is 1, and the critical value at the 1% significance level is 5.412 in the unilateral generalized likelihood ratio test. The LR values of the four models are all greater than 5.412 and pass the significance test, thereby rejecting the assumption of no management inefficiency. γ values of the four models are all greater than 0.6 and pass the significance test at the 1% level, thereby implying the existence of management inefficiency, that is, the external environmental factors and management inefficiency affect the slack variables, and the SFA model needs to be used for testing. The regression analysis results show that all tested coefficients passed the t-value estimation, thereby indicating the reliability of the results in this model. Specifically, the impacts of each external environment variables are presented as follows:

4.2.1. Environmental Regulation

The regression analysis results show that environmental regulation is negatively correlated with enterprise R&D and energy input slack variables and positively correlated with personnel input slack variables. The increase in environmental regulation intensity restricts the energy emissions of relevant enterprises and encourages enterprises to increase research and personnel investment in green innovation, which will help improve the green innovation efficiency. However, the regression coefficients of environmental regulation on personnel input slack variables are significant at the 10% significant level, whereas the coefficients of environmental regulation on the R&D investment slack variable fail to pass the test, indicating that the impact of China’s environmental regulation on enterprise green R&D expenditure and personnel input is currently insignificant. This phenomenon is mainly due to the fact that the government in China collects pollution control fees based on the data reported by enterprises, and enterprises may conceal data which may decline the effectiveness of environmental regulation policies, thereby harming green innovation efficiency.

4.2.2. Technology Introduction Cost

The regression results show that the enterprise technology introduction cost is positively correlated with personnel input slack variables and negatively correlated with the R&D and energy input slack variables. It has passed the significance test at 1%, 10%, and 5% level, indicating that an increase in the cost of introducing advanced technology will help attract advanced technology personnel, improve the enterprises’ ability to enhance green innovation, and reduce energy consumption, respectively. If the enterprises rely greatly on the introduction of external technology, then they may lose the desire for independent innovation, which will be harmful for the sustainable development of green innovation efficiency.

4.2.3. Enterprise Scale

The regression results show that enterprise scale is negatively correlated with the R&D input slack variable and energy input slack variables and positively correlated with the personnel input slack variables and pass the significance test at the 1% level. In theory, the larger the scale of the enterprise, the more likely it is for the enterprise to use technical equipment to achieve economies of scale, so as to improve the efficiency of green innovation. However, from the measurement results, the large scale of enterprise in China’s heavy polluting industries does not increase and even decrease the R&D input, although it is helpful for attracting R&D personnel. This phenomenon may be due to the diseconomies of scale in the industry energy consumption manufacturing. Large enterprise scale results in low internal management efficiency, which generates excessive additional management costs and thereby reducing the enterprise’s willingness to invest in green innovation technology. In addition, the large scale of enterprises will lead to the excessive concentration of external markets, resulting in a lack of competition among enterprises within the industry. This phenomenon will increase the green technology innovation barriers, which is not conducive to the improvement of green innovation efficiency. Therefore, the government should focus on transforming the current high concentration of enterprises in heavy polluting industries so as to guide enterprises to accelerate the adjustment of internal management structure, solve the problem of low efficiency of management institutions, and encourage enterprises to practice green technology innovation.

4.2.4. Government Support

The regression results show that government support has a significant positive correlation with R&D personnel input slack variables and is negatively correlated with energy input slack variables and has passed the significance test at 1% and 10% level, respectively. However, their effects on R&D input slack variables are not evident. This finding shows that the current preferential policies granted by the Chinese government to heavy polluting industries while helping heavy polluting industries to attract green technology innovation talents have not motivated the enterprises to increase R&D investment. This result does not match the development characteristics of heavy polluting industries. The increase in new R&D personnel will lead to a waste of resources and finally affect the overall efficiency of green innovation in the industry.
The four aforementioned environmental variables have different effects on the input slack variables, and the degree of impact varies from industry to industry. Different heavy polluting industries exhibit large deviations in green innovation efficiency in various environments. Therefore, the original input variables must be adjusted to remove the active components of the environment and random noise, so as to obtain the true level of green innovation efficiency while all industries are under the same external environmental conditions.

4.3. Third Stage: Real Green Innovation Efficiency Analysis

The non-radial DDF model is used again to evaluate the green innovation efficiency of the 17 heavy polluting industries based on the adjusted input values. The efficiency values obtained at this stage exclude the influence of external environmental factors and random noise and can reflect the efficiency of green innovation more objectively (Table 1). Compared with the results obtained in the first stage, at this stage, seven industries, namely, C38, C24, C21, B06, C13, C25, and C37, fall into the category of high green innovation efficiency (with the average comprehensive efficiency value above 1.2). Five industries, namely, D44, C17, B07, C34, and C40, fall into the category of low green innovation efficiencies (with the average comprehensive efficiency value below 1.1). The five remaining industries fall into the category of medium green innovation efficiencies (with the average comprehensive efficiency value between 1.1 and 1.2).
Figure 2 shows that from 2004 to 2016 the green efficiency of China’s heavy polluting industries remains stable. However, innovation efficiency is significantly higher than green efficiency. The result of the synergistic integration of the two shows that comprehensive efficiency tends to move toward the production frontier of innovation efficiency. Therefore, heavy polluting industries in China are currently in the transformation stage of “effective innovation but not green”.

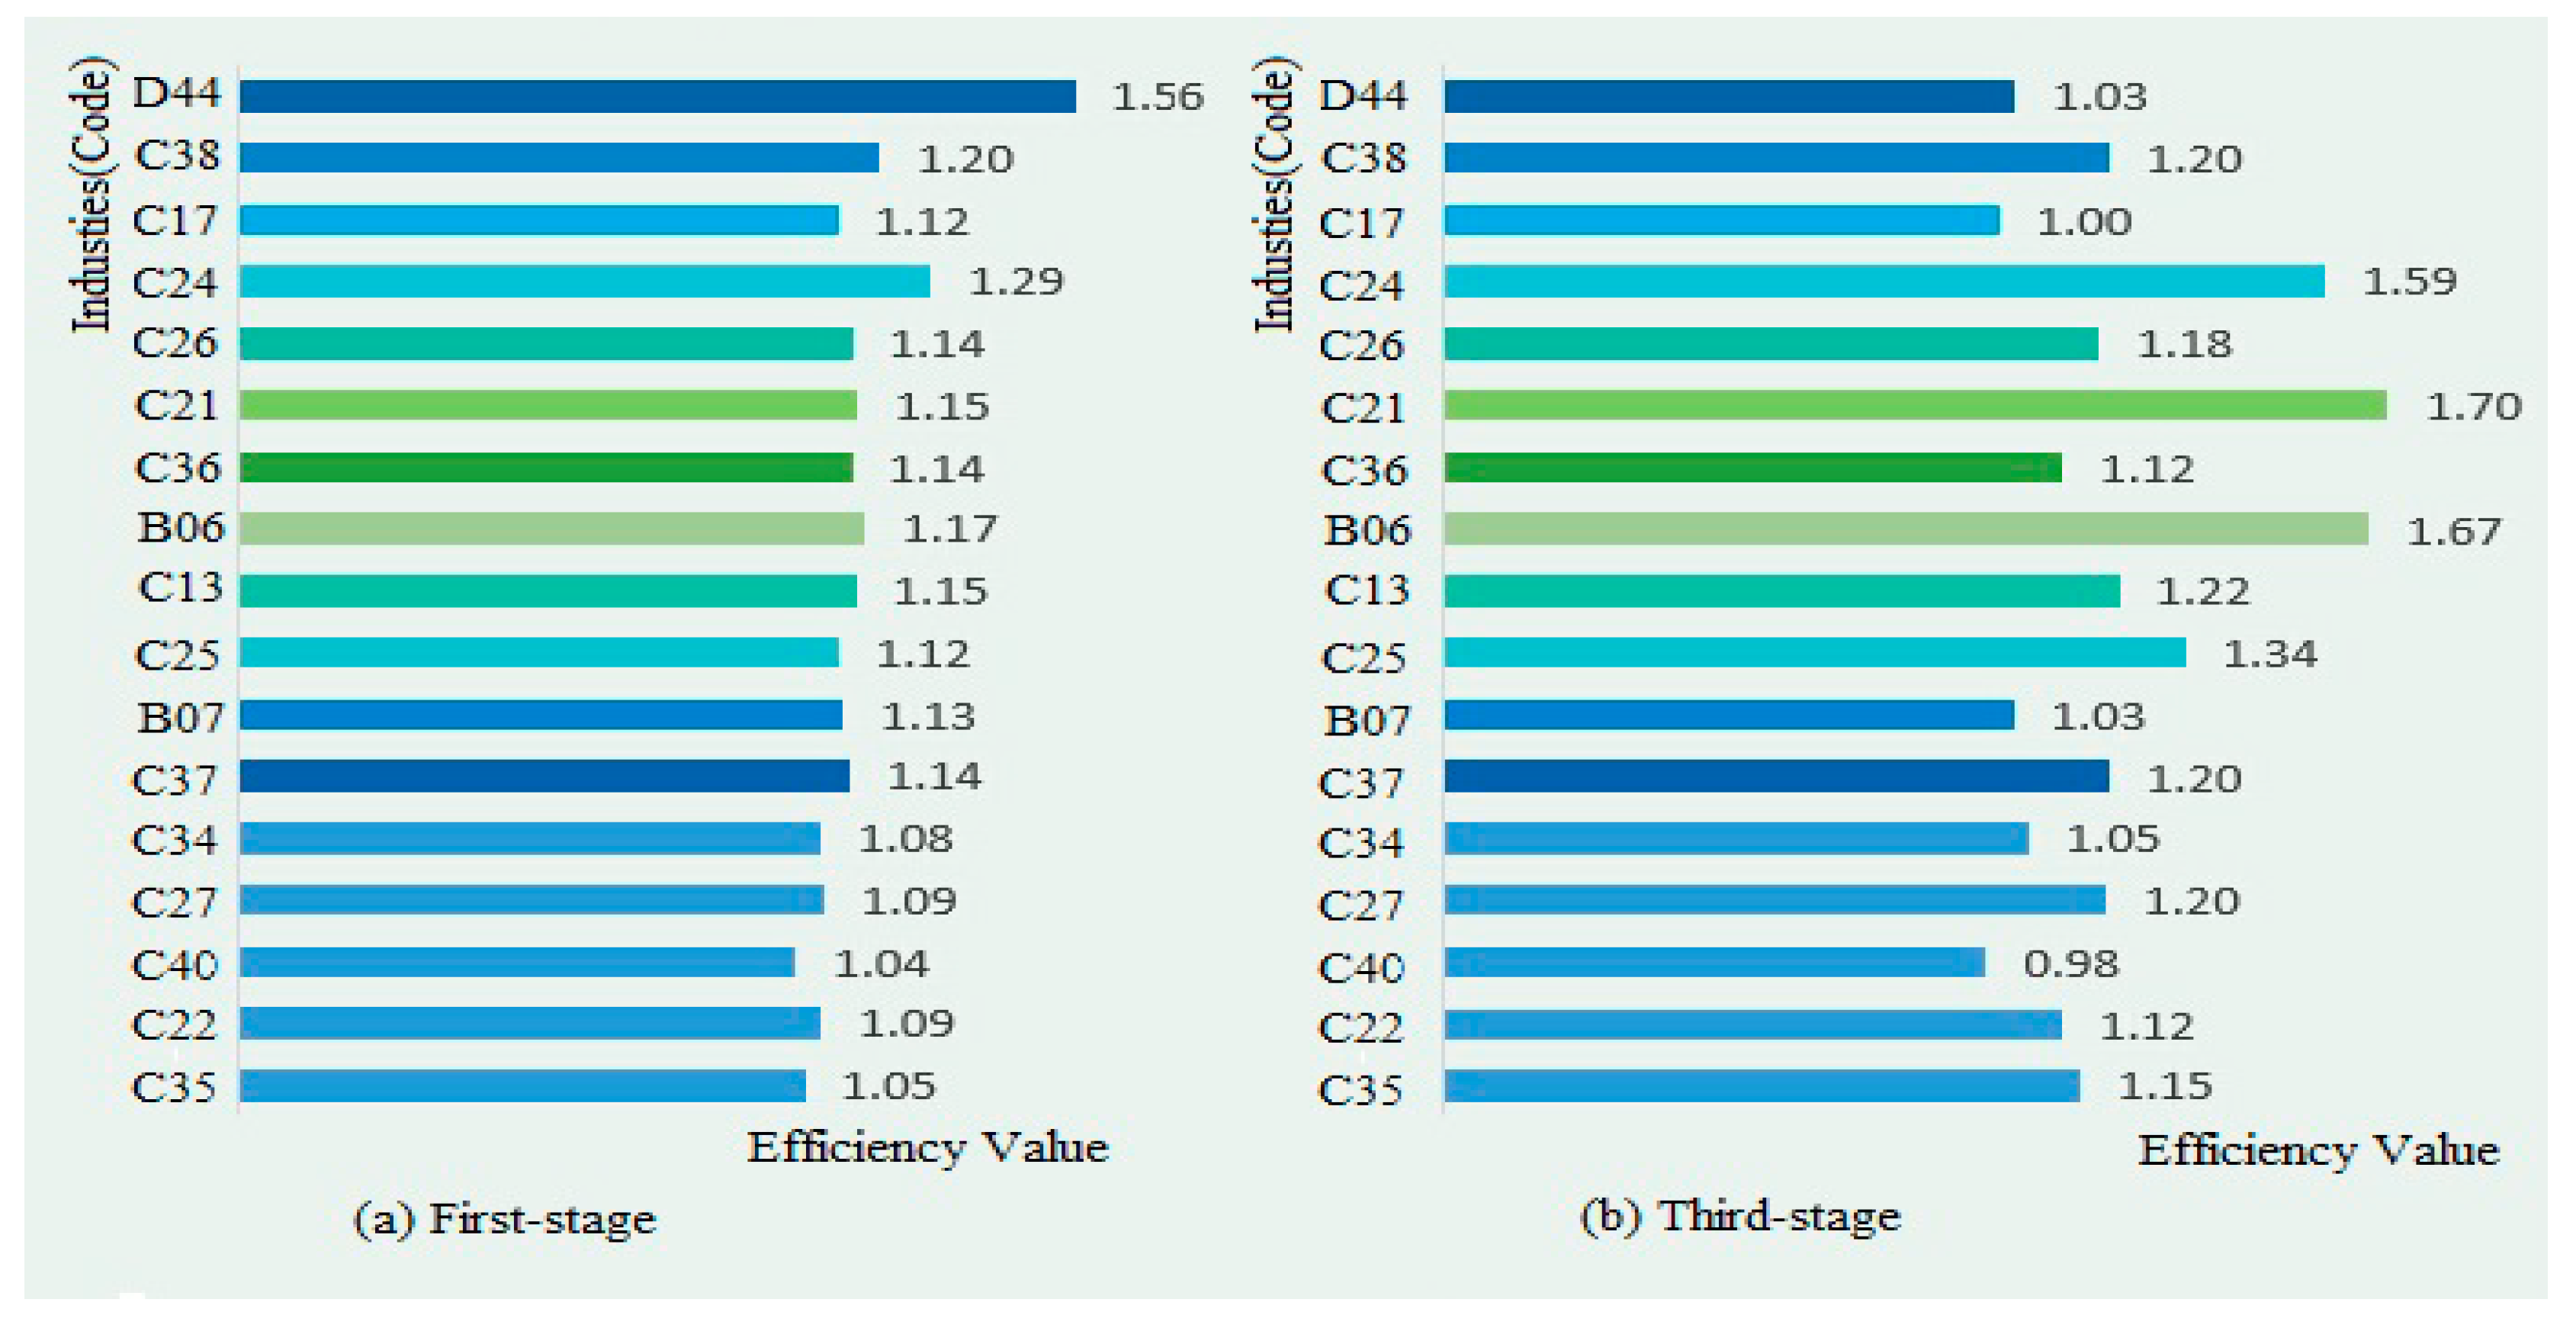
4.4. Comparative Analysis of the Results before and after Adjustment
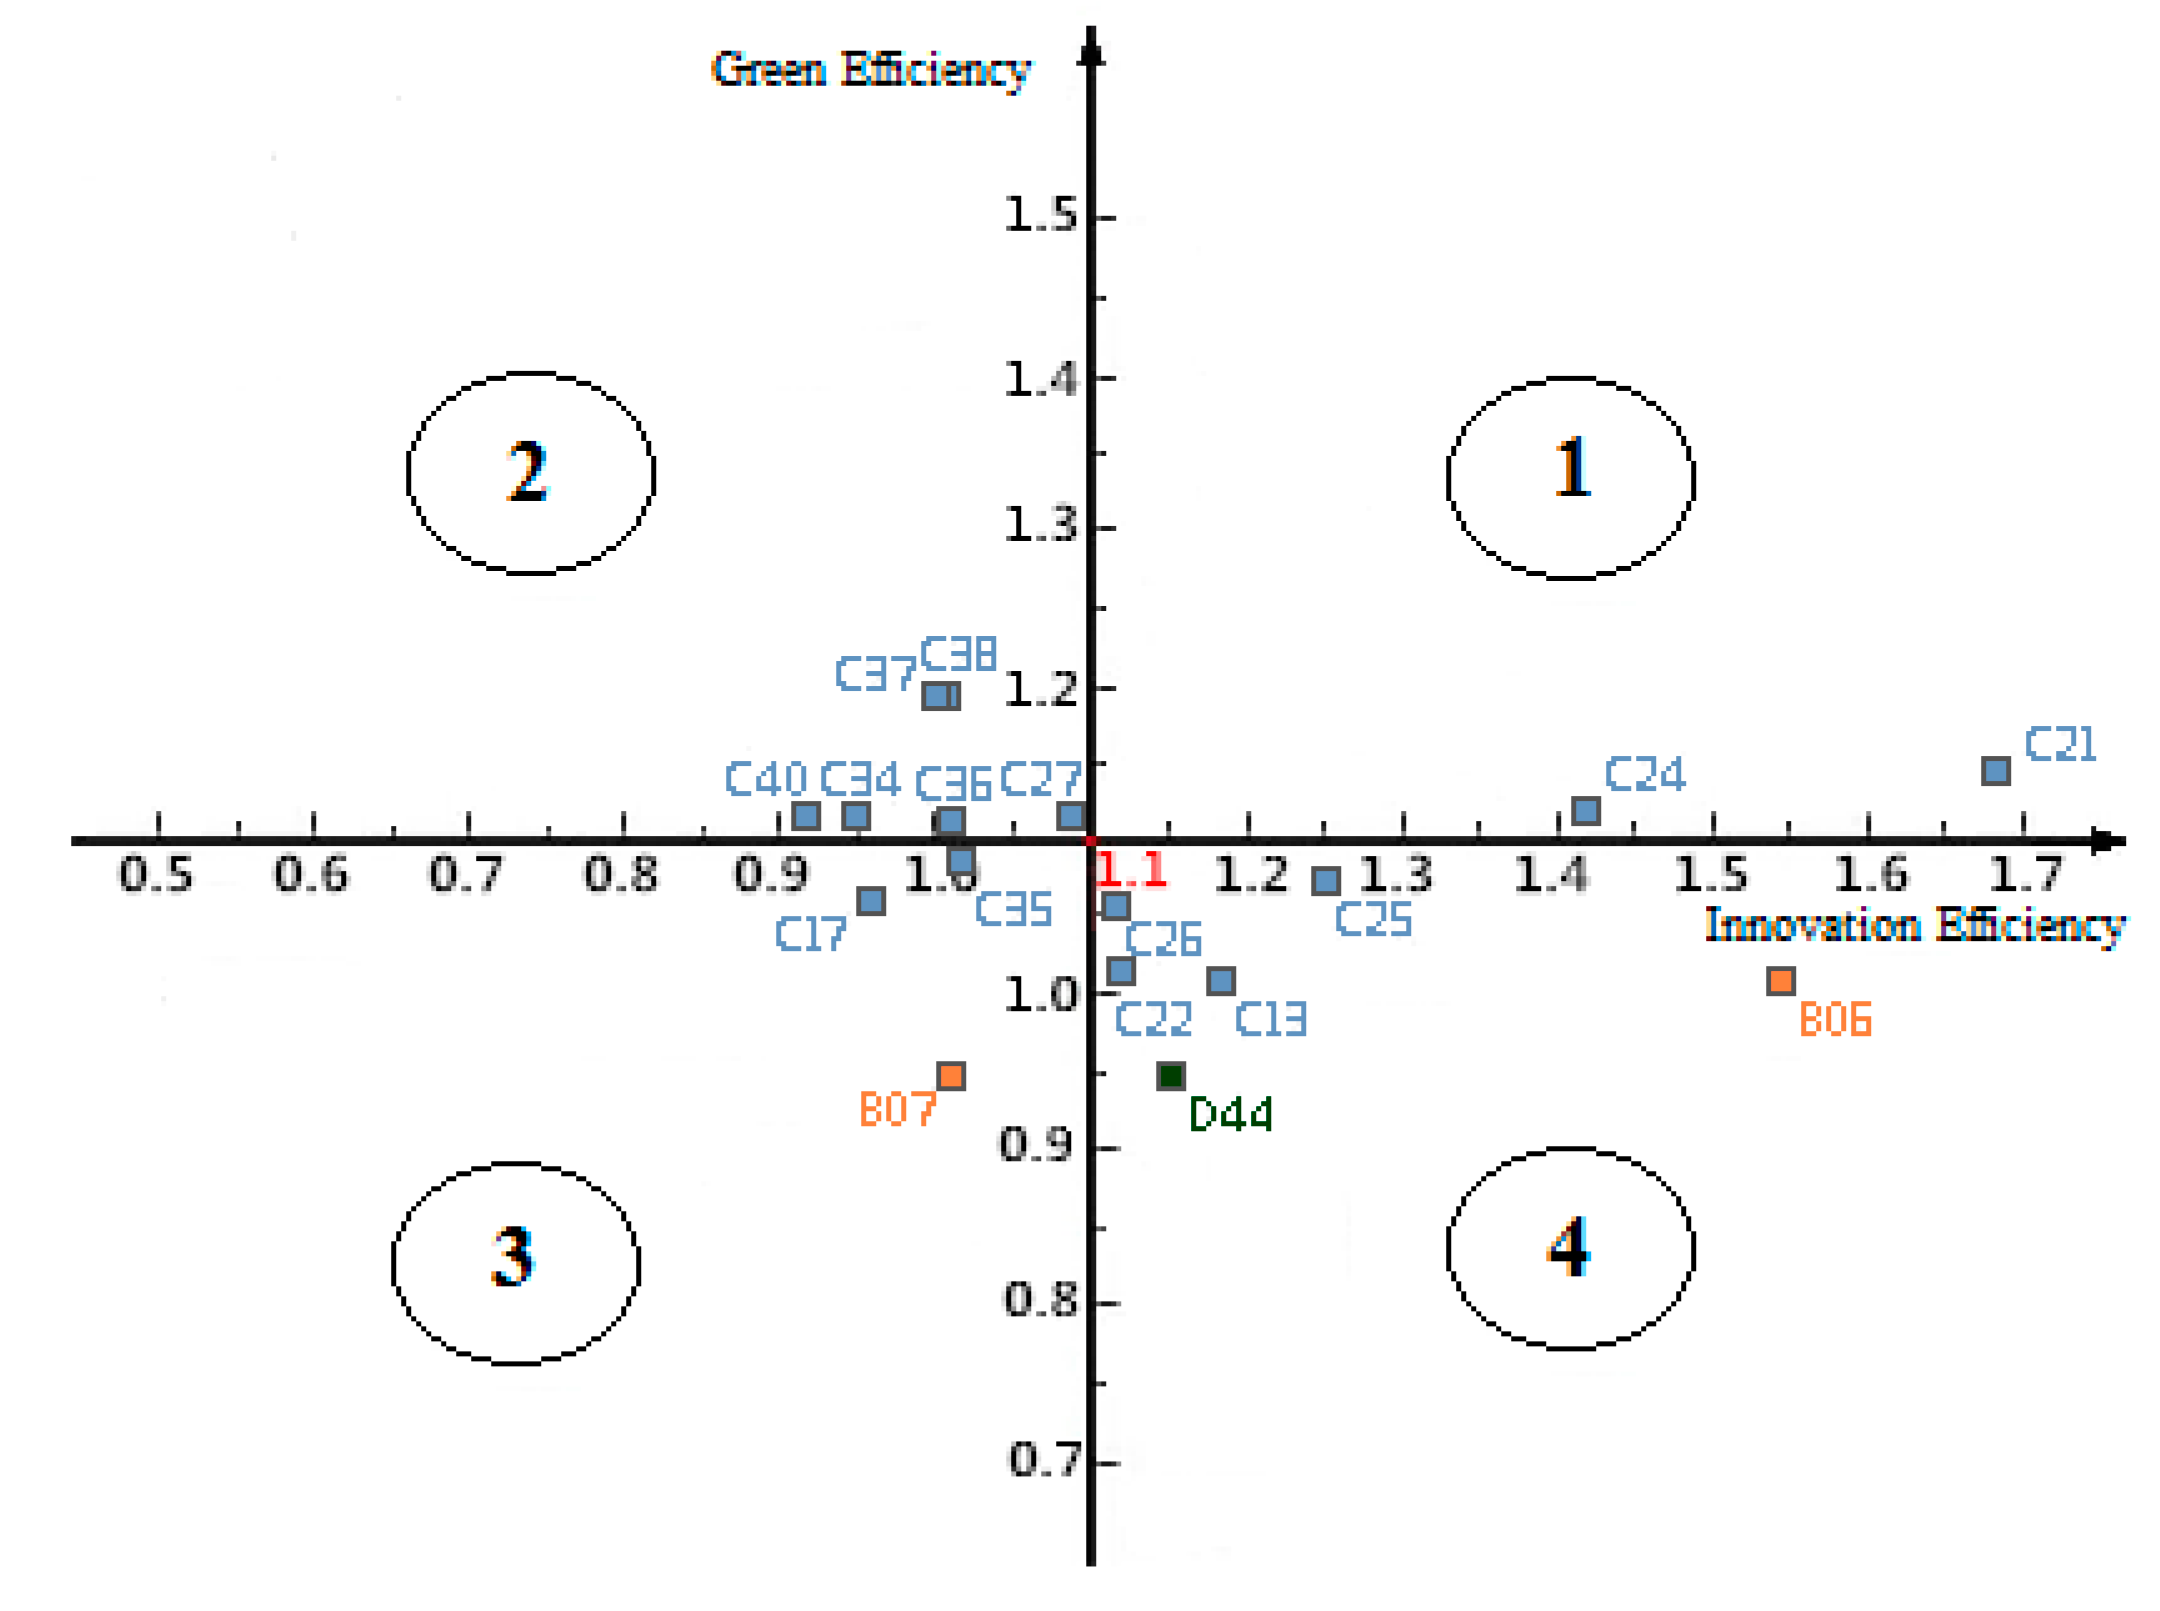
Figure 3 and Figure 4 shows the evolution trend of the efficiency values before and after the adjustment. The adjusted comprehensive efficiency value has increased, but not significantly. The average value of green innovation efficiency has increased from 1.15 to 1.2. The average value of innovation efficiency presents an evident increase from 1.07 to 1.22, whereas the average value of green efficiency has decreased from 1.12 to 1.01, which is basically consistent with the conclusion that China’s heavy polluting industries are in the stage of “effective innovation but not green.” The main reason for the change in efficiency value before and after adjustment is that after removing the external environmental factors and the interference of random noise, the coefficients of capital, personnel, and energy inputs have changed while the output variables remain unchanged. The degree of the external environment influence varies in different industries.
As a result, the adjustment of energy consumption in different industries has changed, which in turn affects the efficiency of green innovation in these industries. In general, the green innovation activities of China’s heavy polluting industries have been in a relatively good state that can scientifically and reasonably control the industrial scale at its best and create remarkable conditions for industry development, thereby improving the overall efficiency of the industry. However, the contrast between innovation and green efficiency in the past decade indicates the negative externalities of China’s heavy polluting industries environment and indirectly reflects that the green transformation of heavy polluting industries has not substantially improved green technology.
In view of the dynamic evolution of the green environment efficiency of China’s heavy polluting industries, analyzing the heterogeneous effects of green innovation efficiency in each heavy polluting industry becomes necessary. Thus, the average values of green innovation efficiency from 2004 to 2016 before and after removing the impact of external environmental factors are calculated. Figure 5 shows an evident difference in green innovation efficiency before and after adjustment. Compared with the results before adjustment, the imbalance of green innovation efficiency has significantly increased after adjustment. The number of high-green innovation industries has increased from three to seven, but the number of low innovation efficiency industries has also reached five. The results show that while China’s heavy polluting industries are improving their overall efficiency of green innovation, they still have serious differentiation problems within the industry. The green and innovation efficiencies of each industry require further analysis.
According to the adjusted values of green and innovation efficiencies, the 17 heavy polluting industries can generally be categorized into four groups (Figure 6).
The “high–high” group includes two industries with high green and innovation efficiencies, namely, C24 and C21. Both industries have high green innovation efficiency, mainly because they are capital-intensive and low energy consumers. The innovation efficiency value of the two industries is evidently higher than their green efficiency value. For example, the innovation efficiency value of C21 is 1.68, whereas its green efficiency value is only 1.15. Although the two industries belong to the “high–high” group, the synergistic development of green and innovation efficiencies has not been achieved yet.
The “high–low” group refers to industries with high green efficiency but low innovation efficiency, including C38, C34, C27, C37, and C40. These industries are basically technology-intensive with low energy consumption and tend to improve green efficiency by technology research and development to increase energy efficiency and decrease energy consumption. However, the innovation efficiency of these industries is currently extremely low. For example, the innovation efficiency value of C40 is only 0.98, indicating that the technology of this industry fails to support its green innovation effectively.
The “low–high” group refers to industries with low green efficiency and high innovation efficiency, including D44, B06, C13, C25, and C22. These industries are basically capital-intensive and energy consuming, that is, they strongly rely on energy consumption and exhaust significant amounts of pollutants in the process of production. The high cost of abatement and the energy environmental costs make industries in this group to continuously have high energy consumption for a long time. For example, the present energy consumed by China’s electric power industry is basically coal, and this consumption pattern hinders the industry’s green innovation. The improvement of its innovation efficiency is based on the current development of China’s new energy industry, which has led to the development of many new energy technologies. Therefore, for these industries, the government should focus on promoting green technology R&D and increasing investment in research on improving energy efficiency technologies so as to promote industrial upgrading and achieve low energy consumption.
The “low–low” group consists of industries with low green efficiency and low innovation efficiency, namely, C17, B07, and C35. The results show that technological innovation and environmental improvement have not reached an effective state in these industries, and they are confronted with many difficulties in the process of green transformation. For example, the innovation and green efficiency values of B07 are above 1.02, indicating that its traditional high energy consumption development pattern has not been changed. The current industry capacity reduction policy promoted by the Chinese government has not essentially improved its green technology innovation capability.

5. Discussion

The analysis results suggest that the average values of sustainable innovation efficiency of China’s high polluting industries have changed after eliminating the influence of external environmental factors and random disturbance factors. Environmental regulation and random interference factors affect sustainable efficiency by influencing the efficiency of technological innovation and the measurement of real sustainable innovation efficiency. Therefore, evaluating the sustainable innovation efficiency of heavy polluting industries in China by using the non-radial DDF-DEA three-stage model is reasonable and meaningful. The primary result discussions are presented as follows:
First, in the first stage of non-radial DDF-DEA analysis, the overall efficiency value increased from 1.31 in 2004 to 2.04 in 2009 and then fell back to 1.03 in 2016. Further analysis results in Figure 1 show that the innovation efficiency of heavy polluting industries in China was higher than the sustainable efficiency before 2009, but since 2009, the two lines are basically the same, and the distinction is not very evident. This result illustrates that the external environmental factors and random noise are most likely to interfere with the comprehensive measurement of sustainable innovation efficiency, which is basically consistent with our hypothesis.
Second, according to Fried’s (2002) [34] method of eliminating environmental factors and random noise, in the second stage, this study uses the SFA model to regress the slack variables in the first stage. The results in Table 2 show that four environmental variables have different effects on input slack variables, and the degree of impact varies from industry to industry, which results in heavy polluting industries showing large deviations in sustainable innovation efficiency in different environments. This result echoes Fried’s (2002) [34] conclusion, which proves that the elimination of environmental and random noise factors significantly affects the sustainable innovation efficiency of heavy polluting industries in China, and eliminating them in the process of efficiency evaluation is necessary, thereby ensuring that all industries are under the same external environment conditions.
Third, the results in Figure 3 and Figure 4 show that after adjusting for the elimination of environmental and random noise factors, the overall efficiency value of heavy polluting industries in China increased slightly (from 1.15 to 1.2). Meanwhile, the average value of innovation efficiency increased (from 1.07 to 1.22), but the sustainable efficiency dropped from 1.12 to 1.01, which shows that the development process of heavy polluting industries in China has a typical characteristic of “effective innovation but not sustainable.”
Fourth, in Figure 6, the results of the efficiency matrix distribution of heavy polluting industries show that the sustainable innovation performance of various industries in China’s heavy polluting industries have typical heterogeneity. According to different characteristics, all the heavy polluting industries can be divided into four types, namely, high–high, high–low, low–high, and low–low. Previously, Bian et al. (2010) [62] pointed out that the resource and environment efficiency of various provinces (region) in China has a strong heterogeneity characteristic. Hence, formulating relevant policies according to regional characteristics is necessary. Chang (2013) [63] and Vlontzos et al. (2014) [64] started from a certain profession, such as the traffic profession, agriculture, etc., to investigate the trend of environmental efficiency tendency concretely. On the one hand, the results of this study confirm the superiority of DEA method in efficiency evaluation [49,56,57]. On the other hand, this study also extends and supplements the previous studies usefully, focusing on 17 specific industries in heavy polluting industries from the perspective of heterogeneity and then comparing and analyzing of various industries before and after adjustment.
The results show that the government should implement differentiated energy tax policies and subsidy policies because of the heterogeneity of energy consumption in heavy polluting industries. Policies and measures should be taken to increase energy and taxation supervision and encourage high energy-consuming industries to innovate green technologies to reduce energy consumption. Policies and measures should be taken to increase tax incentives and encourage firms in low energy consuming industries to introduce energy-efficient production equipment to prevent the increase in energy consumption.

6. Conclusions

This study focuses on the heavy polluting industries in China and makes an objective and reasonable evaluation of its green innovation efficiency to provide a basis for the green transformation of heavy polluting industries. A non-radial DDF-DEA three-stage model is developed to evaluate the green innovation efficiency of China’s 17 heavy polluting industries. Its primary conclusions are drawn as follows:
(1) The average values of green innovation efficiency of China’s heavy polluting industries have changed after the non-radial DDF-DEA three-stage has eliminated the influence of external environmental and random disturbance factors. Therefore, the use of the non-radial DDF-DEA three-stage model is reasonable and necessary to evaluate the environmental efficiency of China’s heavy polluting industries.
(2) The green innovation efficiency of China’s 17 heavy polluting industries is generally low, and the phenomenon of “effective innovation but not green” exists in the industry as a whole, green technology capabilities improve slowly, and the prospect for sustainable development is not optimistic because of the influence of low green efficiency on comprehensive efficiency.
(3) Environmental and random disturbance factors affect the green environment efficiency of heavy polluting industries. Although China’s current environmental regulation policy helps restrict energy emissions, the effect of regulatory policies is not significant, thereby adversely affecting the efficiency of green innovation.
(4) The introduction of advanced technology in heavy polluting industries will help improve the enterprises’ green innovation ability and reduce energy consumption to some extent. However, over-reliance on the introduction of external technology may reduce the enterprises’ desire for independent innovation and would be harmful to the sustainable development of green innovation efficiency.
(5) The high enterprise concentration of heavy polluting industries may lead to diseconomies of scale behaviors, which will decline the desire for green innovation and a serious waste of related innovation resources.
This study puts some valuable exploration on green innovation efficiencies of China’s heavy polluting industries, however, there are also some limitations. On the one hand, the samples selected in this study are heavy polluting industries in China, the universality of the empirical results may have certain limitations. Therefore, the relevant conclusions and recommendations may not be applied to developed countries and poor and backward countries with low investment in technological innovation resources. On the other hand, this study uses the proportion of government funds in the industry R&D funds as a substitute for government support, which may have a certain impact on the interpretation of the results because the government’s support for industry involves a wide range of areas. Future studies will include larger sample size, that is, developed countries, poor countries, and more developing countries will be covered, and more accurate indicators of external environmental variables will be incorporated as much as possible to analyze the sustainable development and efficiency level of heavy polluting industries in the world.

Author Contributions

Conceptualization, Z.F.; data curation, Z.F. and H.B.; formal analysis, Z.F.; investigation, H.B.; methodology, Z.F. and H.B.; visualization, H.B.; supervision, Z.F. and Y.B.; Project administration, Z.F.; Writing-original draft, Z.F.; Writing-review & editing, H.B. and Y.B. All authors have read and agreed to the published version of the manuscript.

Funding

This research was funded by the National Social Science Foundation of China, grant number No. 18BJL127.

Acknowledgments

Work on this study was supported by a grant from the National Social Science Foundation of China (No. 18BJL127).

Conflicts of Interest

The authors declare no conflicts of interest. The funding sponsors had no role in the design of the study, the collection, analyses or interpretation of data, the writing of the manuscript, or in the decision to publish the results.

References

  1. Zhang, J.S.; Liu, Y.M.; Chang, Y.; Zhang, L.X. Industrial eco-efficiency in China: A provincial quantification using three-stage data envelopment analysis. J. Clean. Prod. 2017, 143, 238–249. [Google Scholar] [CrossRef]
  2. Song, M.; Wang, S.H.; Sun, J. Environmental regulations, staff quality, green technology, R&D efficiency, and profit in manufacturing. Technol. Forecast. Soc. Chang. 2018, 133, 1–14. [Google Scholar]
  3. NBSC. China Statistical Yearbook; National Bureau of Statistics of People’s Republic of China (NBSC): Beijing, China, 2018.
  4. Li, K.; Lin, B. Impact of energy conservation policies on the green productivity in China’s manufacturing sector evidence from a three-stage DEA model. Apply Energy 2016, 168, 351–363. [Google Scholar] [CrossRef]
  5. NBSC. China Environmental Status Bulletin; National Bureau of Statistics of People’s Republic of China (NBSC): Beijing, China, 2018.
  6. Zhou, Y.; Xing, X.; Fang, K. Environmental efficiency analysis of power industry in China based on an entropy SBM Model. Energy Policy 2013, 57, 68–75. [Google Scholar] [CrossRef]
  7. Wong, S.K. Environmental requirements, knowledge sharing and green innovation: Empirical evidence from the electronics industry in China. Bus. Strategy Environ. 2013, 22, 321–338. [Google Scholar] [CrossRef]
  8. Yu, C.; Shi, L.; Wang, Y.; Chang, Y.; Cheng, B. The eco-efficiency of pulp and paper industry in China: An assessment based on slacks-based measure and Malmquist-Luenberger index. J. Clean. Prod. 2016, 127, 511–521. [Google Scholar] [CrossRef]
  9. Rennings, K.; Rammer, C. Increasing energy and resource efficiency through innovation: An explorative analysis using innovation survey data. ZEW-Leibniz Cent. Eur. Econ. Res. Discuss. 2009, 5, 442–459. [Google Scholar] [CrossRef] [Green Version]
  10. Worthington, I.; Patton, D. Strategic intent in the management of the green environment within SMEs: An analysis of the UK screen-printing sector. Long Range Plan. 2005, 38, 197–212. [Google Scholar] [CrossRef]
  11. Kiefer, C.P.; Carrillo-Hermosilla, J.; Del Río, P.; Barroso, F.J.C. Diversity of eco-innovations: A quantitative approach. J. Clean. Prod. 2017, 166, 1494–1506. [Google Scholar] [CrossRef]
  12. Sun, L.; Miao, C.; Yang, L. Ecological-economic efficiency evaluation of green technology innovation in strategic emerging industries based on entropy weighted TOPSIS method. Ecol. Indic. 2017, 73, 554–558. [Google Scholar] [CrossRef]
  13. Jiang, Y.; Chen, X.; Valdmanis, V.; Baležentis, T. Evaluating Economic and Environmental Performance of the Chinese Industry Sector. Sustainability 2019, 11, 6804. [Google Scholar] [CrossRef] [Green Version]
  14. Miao, Z.; Baležentis, T.; Tian, Z.Z.; Shao, S.; Geng, Y.; Wu, R. Environmental Performance and Regulation Effect of China’s Atmospheric Pollutant Emissions: Evidence from “Three Regions and Ten Urban Agglomerations”. Environ. Resour. Econ. 2019, 74, 211–242. [Google Scholar] [CrossRef]
  15. Fare, R.; Grosskopf, S. Productivity and intermediate products: A frontier approach. Econ. Lett. 1996, 50, 65–70. [Google Scholar] [CrossRef]
  16. Brown, M.A. Market failures and barriers as a basis for clean energy policies. Energy Policy 2001, 29, 1197–1207. [Google Scholar] [CrossRef]
  17. Miranda, M.L.; Hale, B.A. Taxing environment: Evaluating the multiple objectives of environmental taxes. Environ. Sci. Technol. 2002, 36, 5289–5295. [Google Scholar] [CrossRef] [Green Version]
  18. Yi, H.T.; Liu, Y. Green economy in China: Regional variations and policy drivers. Glob. Environ. Chang. 2015, 31, 11–19. [Google Scholar] [CrossRef]
  19. Du, L.; Hanley, A.; Zhang, N. Environmental technical efficiency, technology gap and shadow price of coal-fuelled power plants in China: A parametric meta-frontier analysis. Resour. Energy Econ. 2016, 43, 14–32. [Google Scholar] [CrossRef]
  20. Guo, C.; Shureshjani, R.A.; Foroughi, A.A.; Zhu, J. Decomposition weights and overall efficiency in two-stage additive network DEA. Eur. J. Oper. Res. 2017, 257, 896–906. [Google Scholar] [CrossRef]
  21. Hamamoto, M. Environmental regulation and the productivity of Japanese manufacturing industries. Resour. Energy Econ. 2006, 28, 299–312. [Google Scholar] [CrossRef]
  22. Porter, M.E. America’s green strategy. Sci. Am. 1991, 264, 168. [Google Scholar] [CrossRef]
  23. Popp, D. Entice: Endogenous technological change in the DICE model of global warming. J. Environ. Econ. Manag. 2004, 48, 742–768. [Google Scholar] [CrossRef] [Green Version]
  24. Feng, Z.; Zeng, B.; Ming, Q. Environmental regulation, two-way foreign direct investment, and green innovation efficiency in China’s manufacturing industry. Int. J. Environ. Res. Public Health 2018, 15, 2292. [Google Scholar] [CrossRef] [PubMed] [Green Version]
  25. Cainelli, G.; Mazzanti, M.; Montresor, M. Environmental innovations, local networks and internationalization. Ind. Innov. 2012, 19, 697–734. [Google Scholar] [CrossRef] [Green Version]
  26. Wang, Y.; Liu, J.; Hansson, L.; Zhang, K.; Wang, R. Implementing stricter environmental regulation to enhance eco-efficiency and sustainability: A case study of Shandong province’s pulp and paper industry, China. J. Clean. Prod. 2011, 19, 303–310. [Google Scholar] [CrossRef]
  27. Molinos-Senante, M.; Gemar, G.; Gomez, T.; Caballero, R.; Sala-Garrido, R. Eco- efficiency assessment of wastewater treatment plants using a weighted Russell directional distance model. J. Clean. Prod. 2016, 137, 1066–1075. [Google Scholar] [CrossRef]
  28. Miranda, M.L.; Edwards, S.E.; Keating, M.H. Making the environmental justice grade: The relative burden of air polluted exposure in the United States. Int. J. Environ. Res. Public Health 2011, 8, 1755–1771. [Google Scholar] [CrossRef]
  29. Liang, X.; Si, D.; Zhang, X. Regional sustainable development analysis based on information entropy-Sichuan province as an example. Int. J. Environ. Res. Public Health 2017, 14, 1219. [Google Scholar] [CrossRef] [Green Version]
  30. Zaim, O.; Taskin, F. Environmental efficiency in carbon dioxide emissions in the OECD: A non-Parametric approach. J. Environ. Manag. 2000, 2, 95–107. [Google Scholar] [CrossRef]
  31. Tone, K. A slacks-based measure of efficiency in data envelopment analysis. Eur. J. Oper. Res. 2001, 130, 498–509. [Google Scholar] [CrossRef] [Green Version]
  32. Yoshi, S.; Goto, M. DEA approach for unified efficiency measurement: Assessment of Japanese fossil fuel power generation. Energy Econ. 2011, 33, 292–303. [Google Scholar]
  33. Cooper, W.; Park, K.S.; Pastorj, T. RAM: A range adjusted measure of inefficiency for use with additive models, and relations to other models and measures in DEA. J. Prod. Anal. 1999, 11, 5–42. [Google Scholar] [CrossRef]
  34. Fried, H.; Lovell, C.K.; Schmidt, S.S. Accounting for environmental effects and statistical noise in data envelopment analysis. J. Prod. Anal. 2002, 17, 157–174. [Google Scholar] [CrossRef]
  35. Zhao, H.; Guo, S.; Zhao, H.R. Provincial energy efficiency of China quantified by three-stage data envelopment analysis. Energy 2019, 166, 96–107. [Google Scholar] [CrossRef]
  36. Lin, S.F.; Sun, J.; Marinova, D.; Zhao, D.T. Evaluation of the green technology innovation efficiency of China’s manufacturing industries: DEA window analysis with ideal window width. Technol. Anal. Strateg. Manag. 2018, 30, 1166–1181. [Google Scholar] [CrossRef]
  37. Charnes, A.; Coopr, W.W.; Rhodes, E. Measuring the efficiency of decision making units. Eur. J. Oper. Res. 1978, 6, 429–444. [Google Scholar] [CrossRef]
  38. Fare, R.; Pasurka, C. Multilateral productivity comparisons when some outputs are undesirable: A nonparametric approach. Rev. Econ. Stat. 1989, 71, 90–98. [Google Scholar] [CrossRef]
  39. Luenberger, D.G. Benefit functions and duality. J. Math. Econ. 1992, 21, 461–481. [Google Scholar] [CrossRef]
  40. Picazo, T.A.J.; Prior, D. Environmental externalities and efficiency measurement. J. Environ. Manag. 2009, 90, 3332–3339. [Google Scholar] [CrossRef]
  41. Zhou, P.; Ang, B.W.; Wang, H. Energy and CO2 emission performance in electricity generation: A non-radial directional distance function approach. Eur. J. Oper. Res. 2012, 221, 625–635. [Google Scholar] [CrossRef]
  42. Jondrow, J.; Lovell, C.K.; Materov, I.S.; Schmidt, P. On the estimation of technical inefficiency in the stochastic frontier production function model. J. Econom. 1982, 19, 233–238. [Google Scholar] [CrossRef] [Green Version]
  43. CSRC. Classification Index of Listed Companies; Securities Regulatory Commissionof People’s Republic of China (CSRC): Beijing, China, 2018.
  44. NBSC. Industrial Classification for National Economic Activities; National Bureau of Statistics of People’s Republic of China (NBSC): Beijing, China, 2011.
  45. NBSC. Environmental Statistical Yearbook; National Bureau of Statistics of People’s Republic of China (NBSC): Beijing, China, 2017.
  46. NBSC. Energy Statistical Yearbook; National Bureau of Statistics of People’s Republic of China (NBSC): Beijing, China, 2017.
  47. Yang, Z.S.; Wei, X.X. The measurement and influences of China’s urban total factor energy efficiency under environmental polluted: Based on the game cross -efficiency DEA. J. Clean. Prod. 2019, 209, 439–450. [Google Scholar] [CrossRef]
  48. Li, F.; Zhu, Q.; Liang, L. Allocating a fixed cost based on a DEA-game cross efficiency approach. Expert Syst. Appl. 2018, 96, 196–207. [Google Scholar] [CrossRef]
  49. Guan, A.; Shi, J.; Zhang, Q. Research on total factor energy efficiency in western region of China-based on super-DEA and Malmquist. J. Ind. Technol. Econ. 2014, 2, 32–40. [Google Scholar]
  50. Spirkova, D.; Kloudova, J.; Kljucnikov, A.; Stehlikova, B. Economy of heating and competitiveness of the state–the link between the life expectancy and the heating fuel type. The case of the slovak republic. J. Compet. 2019, 11, 116–134. [Google Scholar] [CrossRef]
  51. Mamedov, O.; Movchan, I.; Ishchenko-Padukova, O.; Grabowska, M. Traditional economy: Innovations, efficiency and globalization. Econ. Sociol. 2016, 9, 61–72. [Google Scholar] [CrossRef]
  52. Hnatyshyn, M. Decomposition analysis of the impact of economic growth on ammonia and nitrogen oxides emissions in the European Union. J. Int. Stud. 2018, 11, 201–209. [Google Scholar] [CrossRef] [Green Version]
  53. Štreimikienė, D.; Mikalauskienė, A.; Mikalauskas, I. Comparative assessment of sustainable energy development in the Czech Republic, Lithuania and Slovakia. J. Compet. 2016, 8, 31–41. [Google Scholar]
  54. Tvaronavičienė, M.; Prakapienė, D.; Garškaitė-Milvydienė, K.; Prakapas, R.; Nawrot, Ł. Energy efficiency in the long-run in the selected european countries. Econ. Sociol. 2018, 11, 245–254. [Google Scholar] [CrossRef] [Green Version]
  55. Jovovic, R.; Draskovic, M.; Delibasic, M.; Jovovic, M. The concept of sustainable regional development – institutional aspects, policies and prospects. J. Int. Stud. 2017, 10, 255–266. [Google Scholar] [CrossRef] [Green Version]
  56. Levinson, A. Environmental regulations and manufacturer’s location choices: Evidence from the Census of Manufactures. J. Public Econ. 1996, 62, 5–29. [Google Scholar] [CrossRef]
  57. Lanoie, P.; Patry, M.; Lajeunesse, R. Environmental regulation and productivity: Testing the porter hypothesis. J. Prod. Anal. 2008, 30, 121–128. [Google Scholar] [CrossRef]
  58. Yang, T.; Chen, W.; Zhou, K. Regional energy efficiency evaluation in China: A super efficiency slack-based measure model with undesirable outputs. J. Clean. Prod. 2018, 198, 859–866. [Google Scholar] [CrossRef]
  59. Marikina, M. The impact of ecological regulations and management on national competitiveness in the Balkan States. J. Compet. 2018, 10, 120–135. [Google Scholar] [CrossRef]
  60. Raszkowski, A.; Bartniczak, B. Towards sustainable regional development: Economy, society, environment, good governance based on the example of polish regions. Transform. Bus. Econ. 2018, 17, 225–245. [Google Scholar]
  61. Turturean, C.I.; Asandului, L.A.; Chirila, C.; Homocianu, D. Composite index of sustainable development of EU countries’ economies (ISDE-EU). Transform. Bus. Econ. 2019, 18, 586–605. [Google Scholar]
  62. Bian, Y.; Yang, F. Resource and environment efficiency analysis of provinces in China: A DEA approach based on Shannon’s entropy. Energy Policy 2010, 38, 1909–1917. [Google Scholar] [CrossRef]
  63. Chang, Y.T.; Zhang, N.; Danao, D.; Zhang, N. Environmental efficiency analysis of transportation system in China: A non-radial DEA approach. Energy Policy 2013, 58, 277–283. [Google Scholar] [CrossRef]
  64. Vlontzos, G.; Niavis, S.; Manos, B. A DEA approach for estimating the agricultural energy and environmental efficiency of EU countries. Renew. Sustain. Energy Rev. 2014, 40, 91–96. [Google Scholar] [CrossRef]
Figure 1. Innovation, green, and comprehensive efficiencies of China’s heavy polluting industries from 2004 to 2016 (before adjustment).
Sustainability 12 00146 g001
Figure 2. Innovation, green, and comprehensive efficiencies of China’s heavy polluting industries from 2004 to 2016 (after adjustment).
Sustainability 12 00146 g002
Figure 3. Comparison of green and innovation efficiency.
Sustainability 12 00146 g003
Figure 4. Comparison of comprehensive efficiency.
Sustainability 12 00146 g004
Figure 5. Comprehensive efficiency of each industry before and after adjustment.
Sustainability 12 00146 g005
Figure 6. Efficiency matrix distribution of heavy polluting industries.
Sustainability 12 00146 g006
Table 1. Comprehensive efficiency values of China’s heavy polluting industries.
Industries (Code)BeforeAfter
Production and distribution of electric power and heat power (D44)1.561.03
Manufacture of electrical machinery and equipment (C38)1.201.20
Manufacture of textiles (C17)1.121.00
Manufacture of artwork and other manufacturing (C24)1.291.59
Manufacture of chemical raw materials and chemical products (C26)1.141.18
Manufacture of furniture (C21)1.151.70
Manufacture of transportation equipment (C36)1.141.12
Mining and washing of coal (B06)1.171.67
Processing of food from agriculture products (C13)1.151.22
Processing of petroleum, coking, processing of nuclear fuel (C25)1.121.34
Extraction of petroleum and natural gas(B07)1.131.03
Manufacture of communication equipment, computers and other electronic equipment (C37)1.141.20
Manufacture of general purpose machinery (C34)1.081.05
Manufacture of medicines(C27)1.091.20
Manufacture of measuring instruments and machinery for cultural activity and office work (C40)1.040.98
Manufacture of paper and paper products (C22)1.091.12
Manufacture of special purpose machinery(C35)1.051.15
Table 2. SAF model parameters and regression analysis results.
VariablesCoefficients of R&D InputCoefficients of Personnel InputCoefficients of Energy Input
Constant 4234.21 ***51,634.31 ***2377.92 ***
(423.42)(201.90913)(237.78)
ER−3071.6805428.8986 *−3071.68 ***
(−3,071,679.9)(499.44)(−3067.99)
TC−5.1077442 *0.92532736 ***−0.3394 **
(−9.36)(8.31)(−0.22)
ES−2101.92 ***21,608.45 ***−3893.29 ***
(−2536.03)(692.57)(−351.93)
GVM−1,426,314.9340,925.05 *−1048.67 ***
(−1035.29)(25,721.01)(−1304.78)
sigma-squared79,893,22643,565,187225,091,920
gamma0.760.650.96
log likelihood function−352.03−267.07−215.51
LR test 43.5767.8736.21
Note: ***, **, and * denote the significance level of 1%, 5%, and 10%, respectively. The numbers in brackets are the corresponding t-statistics of the estimated parameters.

