Abstract
Cities can enhance their sustainability planning by prioritizing accessibility as a performance metric for transportation planning. In this context, accessibility measures the ease of reaching opportunities and captures more characteristics of sustainable cities than the more conventionally used mobility metrics, focusing on the overall ability to move and generally recommending faster speeds to overcome distance. However, how cities can prioritize accessibility in planning is understudied. This research presents a case of Tempe, Arizona, putting accessibility into practice through a 20-min lens. Using a 20-min threshold for all modes, the city aims to promote travel for daily activities that is less reliant on private autos. The analysis presented here documents the challenges that planners face when planning for accessibility. The challenges range from technical points to decisions that need to be made about the quality of the built environment. The analysis also shows that Tempe, which is a classically suburban city of wide roads and single-family homes that was built around the automobile, is highly accessible by a 20-min metric by bicycling, walking and transit. These results suggest that planners focus on street network improvements that prioritize accessibility as part of a sustainability strategy.
1. Introduction
Transport planning and engineering have long been focused on improving mobility over accessibility [1]. Mobility is defined as our ability to travel, while accessibility is defined as the ease of reaching destinations. In recent years, accessibility research has developed measures of access to opportunities [2,3,4,5,6,7], and more cities and regions are looking to accessibility improvements as a guiding principle for transport goals. For example, Silva and Pinho [8] created a tool called the Structural Accessibility Layer (SAL) to measure accessibility considering how many, and what types, of destinations can be reached within a time budget through three different modes. Cheng et al. [9] measured sustainable accessibility through the number of jobs accessible to a resident (accessibility), and how far away they are located (sustainability). Accessibility is also commonly used as a measure of social equity [10], which is a component of urban social sustainability [11].
Access to opportunities is often defined as the number of jobs that are within a particular time measurement, such as 30 or 45 min, by a particular mode [12]. For instance, jobs available by transit within 45 min or jobs available by auto within 30 min. Accessibility measures offer a clearer sense as to what people value in cities, which is the ease of reaching the places they want to go. Applying the concept of accessibility in practice presents a new set of challenges [13], however. Accessibility is a metric, but what are acceptable parameters of what is considered accessible must be set through policy.
Another way that accessibility is brought into practice is through the concept of a 20-min city. The 20-min city concept has evolved from Portland’s 20-min neighborhood concept, which envisioned a neighborhood where residents were able to access daily activities within twenty minutes, ideally by walking, but alternatively by bike, transit, or even car [14]. A 20-min city can be defined as a city that allows its residents to access most activities required for good living within 20 min, walking, biking, or taking transit from their homes [15]. Sometimes the assessment considers a 30-min city, such as in Australia [16,17]. Tempe, Arizona has adopted the 20-min city as a benchmark to support sustainability and climate action plans by making the city more resilient and less reliant on private automobiles [18]. Portland, Oregon has also used the 20-min neighborhood framework as part of their general plan [14,19].
The 20-min city in Tempe adapts accessibility to focus on non-work trips. Typically, as noted above, accessibility measures access to jobs by a unit of time as a proxy for overall ease. This makes sense in that connecting people with employment is a traditional role for transportation, and jobs are easily understood as a reason people travel. From a planning perspective, though, access to jobs is more of a regional issue than a local issue. Jobs are dispersed throughout a metropolitan region and maintaining jobs-housing balance within individual cities may not be the most sustainable path forward. Job seekers are better off if they are able to access the largest number of jobs, which for most metro areas is by car. In places like Tempe, which sits within a region that grew almost entirely in the post-war automobile era, limiting residents’ ability to seek employment throughout the polycentric region would likely be economically harmful.
That said, most travel is not commuting. Tempe’s aim is to increase the use of sustainable modes by reducing car usage on discretionary trips, especially those for daily needs. Some advantages that the city has for alternatives to driving are that the city is flat and for much of the year the weather is favorable to being outside, though the summers are extremely hot. The city is also relatively dense as far as sprawling suburbs go and is getting denser as the city continues to grow and more multifamily housing is built. For challenges, the city is very auto-oriented, which affects not just the land development pattern but also the design of streets and intersections.
This research describes the development baseline assessment of a 20-min city plan for Tempe. The contributions of this work are the identification and evaluation of the decision-making process planners make to develop a 20-min city plan and put accessibility into practice. The second contribution is to identify and evaluate data sources required for the development of a 20-min city plan. The analyses presented show the challenges and opportunities for measuring and planning for a 20-min city. Lastly, we show that suburban Tempe is highly accessible by non-auto modes at a 20-min threshold for daily needs.
2. Materials and Methods
Tempe is located within the Phoenix metropolitan area and has about 190,000 people with a density of about 1850 people per square kilometer [20]. It borders the city of Scottsdale to the north, the city of Mesa to the East, the city of Chandler to the south, and the city of Phoenix to the West. Tempe is shaped roughly like a rectangle running north-south. Downtown Tempe is in the northern end of the city, bounded on two sides by the Arizona State University (ASU) campus and Tempe Town Lake. The downtown area is a mix of commercial and residential, with ample multi-family housing and rentals that cater to professionals and students. The growth of the city since the middle of last century has spread south from the historic downtown core. The further south it is, the more likely the city is to feature uni-functional land uses of single-family homes on cul-de-sacs. This geography of the city matters for the understanding of the 20-min assessment as discussed below.
Previous accessibility studies have created tools to measure how well a city is connected to opportunities—for examples, see References [21] or [22]. However, there was a lack of structured methodology to specifically assess compliance with the 20-min city concept being introduced in the City of Tempe. This paper describes a case study using the following method.
To measure and assess the City of Tempe infrastructure and development priorities, researchers analyzed current conditions to identify tangible performance measures. These analyses included three aspects:
- Destinations: Identification of daily necessities and quality of life amenities. The set of 12 non-work destinations was selected based on input from Tempe dwellers. Table 1 describes the list of destination groups used in this analysis.
 Table 1. Destination groups and data sources.
 - Networks: The creation of scenarios that allow the assessment of the three transportation modes (pedestrian, bicycle, and transit), regarding compliance with the 20-min city guidelines. The networks were created to simulate five different scenarios within the city. The analysis was conducted for biking on any road, biking on low-stress roads, walking on any road, walking on roads with sidewalks, and for using public transit. Unpaved paths were not considered in any of the analyses, given the fact that in this case study the segments indicated as unpaved were not compliant with the Americans with Disabilities Act (ADA) requirements.
- Travel Sheds and Coverage: The comparison of the 20-min City network against the full city limits and the number of residential units reached in each of the five selected scenarios. The travel shed and coverage analysis was done for all twelve destination groups, in five scenarios, based on a network assessment for biking on any road, biking on low-stress roads, walking on any road, walking on roads with sidewalks, and for using public transit. Each of the scenarios had its own specifications in terms of accepted distance from the facility to the closest road, as well as accepted distance to be covered on the network. Those specifications are described in the following subsections.
The analysis of several sets of data from different sources provided the baseline conditions in regard of being a 20-min city. The 20-min assessment primarily used three types of data: Destination data, network data, and residential parcels data. The decision on what data to be used was made based on the priorities identified by city residents, and availability to city officials. Table 1 lists the destinations considered in the study, as well as their subcategories, and data source. The list of destinations was chosen based on public input from the city dwellers, through public meetings where residents were able to point out which non-work destinations they considered important for a good living. Once again, the 20-min city concept adopted by the City of Tempe does not consider work trips as Tempe sits within a larger auto-oriented metropolitan area, and limiting residents’ ability to seek employment throughout the polycentric region would likely be economically harmful. Other residential areas were not included in the assessment, as they were not defined as a priority by the city of Tempe residents’, which are the ultimate beneficiaries of this study.
The destinations were treated exclusively as point features. For groups such as grocery stores, and retail locations, the data was retrieved from the NAICS database as points. However, some destination groups represent spaces with no specific assigned entry and were provided as polygon features; one example is the parks destination group. In order to include such a destination in the analysis, it was assumed on the edges of the polygon, separated by one-eighth of a mile each, that there were artificial points of entry. The threshold of one-eighth of a mile was chosen as the negligible walking distance. This analysis was done under the assumption that if a residential parcel could reach one of the assigned artificial entries of the polygon destination group within the parameters of the scenario, it had access to the destination type.
The network analysis was done exclusively on city of Tempe roads, meaning that only destinations within a short distance from the city border were considered (one-eighth of a mile for pedestrian and transit networks, one-quarter of a mile for bicycling networks). That assumption of the unavailability of destinations outside the city limits impacted the assessment close to the city border. While residential parcels might not connect to a destination group within Tempe in 20 min or less, they might have access to it in a neighboring city. Further analysis should include destination points outside the edge of Tempe for a more accurate representation of the 20-min city conditions.
Table 2 details the second type of data used in this study, which describes the city’s transportation network and was used to assess the accessibility in the city.
Table 2.
Description of network data sets utilized on the 20-minute assessment for the city of Tempe, AZ.
The third and final type of data utilized was residential parcels data. It represented the residential parcels in the city of Tempe, and the number of residential units within them. This data allowed the researchers to understand population density and the city, and to measure how many of the city’s residential units could access each set of destination within 20 min by walking, biking, or riding transit. This metric was the main measure used to assess compliance with 20-min cities guidelines.
2.1. Assessment of Compliance with the 20-min City Guidelines
This subsection describes in detail how compliance with the 20-min city guideline was assessed. A step by step procedure will be introduced, and details associated with the sub-analysis of each mode will be explored in further sub-sections. While each scenario had its own network and travel shed specifications, described later in this text, the general procedure to assess compliance with the 20-min city standard was the same for the pedestrian and bicycling networks. The assessment procedure for pedestrian and bicycling networks was as follows:
For each one of the four scenarios (bicycling on all roads, bicycling on low-stress roads, walking on all roads, and walking on roads with sidewalks):
For each one of the twelve sets of destinations
- i.
- Load the facility points in the software, respecting the scenario-specific distance from the city borders;
- ii.
- Attach the facility to the closest network segment, respecting the accepted distance from the entrance to the road, which is a scenario-specific parameter;
- iii.
- Run the travel sheds starting from each of the destination points, to cover a scenario-specific distance on the network;
- iv.
- Buffer the lines from the travel sheds generated on step iii by 100 feet;
- v.
- Intersect the buffer areas created on step iv with the residential parcels layer;
- vi.
- All residential parcels that intersect the buffer layer are considered as having access to the destination group under study.
The procedure to assess compliance with 20-min city guidelines by riding transit was as follows:
For each one of the twelve sets of destinations (refer to Figure 1):
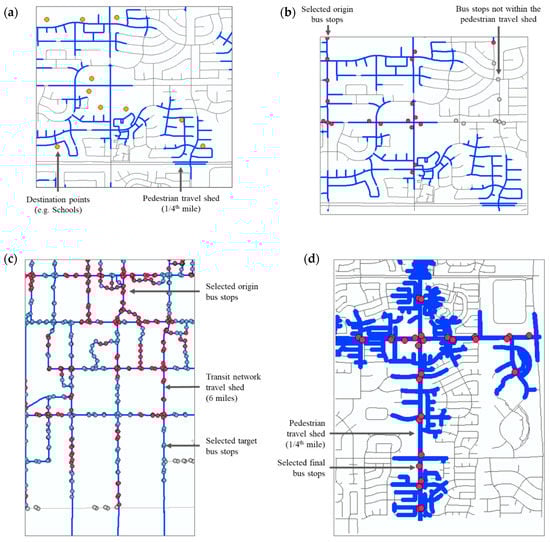
Figure 1.
Illustrative examples of the transit network assessment described in Section 2.1.
- i.
- Load the facility points in the software, respecting one-eighth of a mile distance from the city borders;
- ii.
- Attach the facility to the closest network segment, respecting the one-eighth of a mile distance from the entrance to the road;
- iii.
- Run travel sheds starting from each of the destination points to cover one-quarter of a mile distance on the network. This step represents the walk from the bus stop to the final destination, and is illustrated in Figure 1a;
- iv.
- Select the bus stops within one-quarter of a mile from the destination points; this selection indicates where residents can get off the bus/light rail to reach at least one of the destination points in the group. This step is illustrated in Figure 1b;
- v.
- Identify the bus routes that serve the bus points selected on step iv;
- vi.
- Select the bus stops, along the lines identified on step v, starting from the bus stops identified on step iv, and going no longer than 6 miles (within the route, no transfers considered). This step is illustrated in Figure 1c;
- vii.
- Identify the bus stops selected on step vi. This step represents the bus stops where residents can get on the bus/light rail line to access the destination;
- viii.
- Run travel sheds from all the bus stops selected on item vii, covering one-quarter of a mile on the network. This step represents the walk from the residential parcels to the bus/light rail stop, and is illustrated in Figure 1d;
- ix.
- Buffer the lines from the travel sheds generated on step viii by 100 feet;
- x.
- Intersect the buffer areas created on step iv with the residential parcels layer;
- xi.
- All residential parcels that intersect the buffer layer are considered as having access to the destination group under study.
The summary of how to assess compliance for all five scenarios is shown in Figure 2.
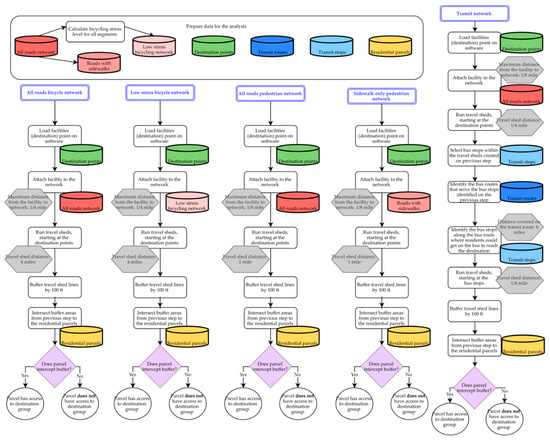
Figure 2.
Step by step description of methodology used to assess compliance with the 20-minute city guidelines, for each destination group.
Once the assessment is available for all the twelve groups of destinations, as per the scenario under study, compute how many of the twelve destinations each parcel can access, as was done for bicycling and pedestrian networks. Section 3 of this manuscript presents the maps showing the geographical representation of this assessment.
The remainder of this section describes the methodology specifications for each scenario, as well as the detailed procedure for the transit assessment. Section 2.1.1 describes the all-roads bicycle network, Section 2.1.2 the low-stress bicycle network, Section 2.1.3 all-roads pedestrian network, Section 2.1.4 the sidewalk only pedestrian network, and Section 2.1.5 the transit network.
2.1.1. The All-Roads Bicycle Network
The first and least-restricted network to be analyzed was the all-roads bicycle network. It included all the road centerlines, as well as all off-street walkways, multi-use paths, and paved paths. The maximum distance accepted from the destination points to the closest roads was one-quarter of a mile. The distance on the network used for this analysis was four miles (assuming average travel speed is twelve miles per hour). In a suburban setting, the all-roads approach is inadequate, as many of the roads are built primarily for cars and trucks and are not conducive to perceived and real safety conditions in cycling. To address this, a low-street bike network was developed.
2.1.2. Low-Stress Bicycle Network
The methodology to identify low-stress biking segments was based on the content provided on the Low-Stress Biking and Network Connectivity Report from the Mineta Transportation Institute (MTI) [23]. The Level of Traffic Stress methodology categorizes road segments into four classifications used to measure the effects of traffic-based stress on cyclists [23]. This methodology was adapted for this analysis. In the Tempe case, road width, median presence (divided roadway), and lane configurations were not considered as data was unavailable. Intersection approaches or intersection crossing were also not considered. These issues are returned to in the Discussion section below.
Based on the current science, data availability, and needs specific to the city of Tempe, the stress levels were defined as having the following characteristics:
- Stress Level 1: Comfortable to the majority of cyclists, represented by local streets, raised cycle tracks, protected bike lanes, unprotected bike lanes, and paved and unpaved multi-use paths;
- Stress Level 2: Comfortable to most adult cyclists, represented by collector-level streets and streets inside Tempe’s Central Business District;
- Stress Level 3: Safe for adult pedestrians, uncomfortable for adult cyclists, represented by low-speed arterials with bike lanes or moderate speed, two/three lane roadways;
- Stress Level 4: Uncomfortable for experienced cyclists, represented by high-speed/multi-lane roadways.
The criteria for assigning stress levels in the case study of the city of Tempe was based on facility type, road hierarchical classification (as a proxy for traffic volume, which was unknown), presence of protected bicycling facilities, and speed limits. Figure 3 details the parameters used to assign stress levels and the hierarchy of decision making.
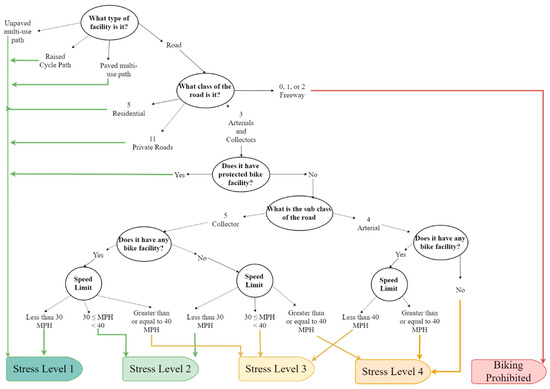
Figure 3.
Criteria for the assignment of bicycling stress levels for Tempe, Arizona.
Once stress levels were assigned to all segments, only those with stress levels of one or two were considered on the low-stress bicycle network assessment. This restriction removed from the network all city arterials. Figure 4 shows high-stress and low-stress roads in the city of Tempe. The network analysis parameters were the same as for the all-roads bicycling network: One-quarter of a mile accepted from the destination to the network, and travel sheds of four miles.
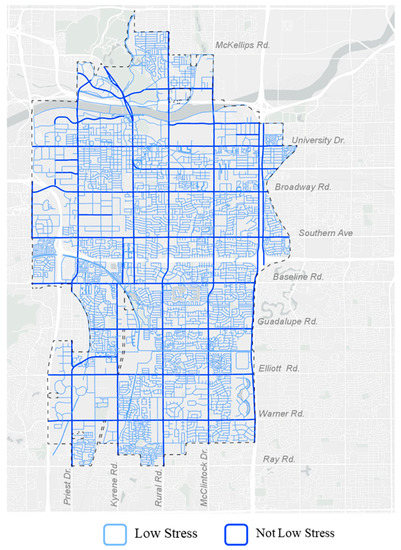
Figure 4.
Map of low-stress and high-stress roads in Tempe, Arizona.
2.1.3. The All-Roads Pedestrian Network
The first pedestrian network was identical to the all-roads bicycle network; however, the distance parameters were different. The all-roads pedestrian network included all the road center lines, as well as all off-street walkways, multi-use paths, and paved paths. The maximum distance accepted from the destination points to the closest roads was one-eighth of a mile. The distance on the network used for this analysis was one mile (assuming the average travel speed is three miles per hour).
2.1.4. Sidewalk-Only Pedestrian Network
The sidewalk-only pedestrian network was a subset of the all-roads pedestrian network. It considered only segments with sidewalk present on at least one side of the road. Figure 5 compares the all-roads pedestrian network and the sidewalk only pedestrian network. Information on sidewalk availability on private roads was not available. Some apartment complexes, especially on the south part of Tempe, were not considered in this analysis, since their sidewalks are not managed by the city. The network analysis parameters were the same as for the all-roads pedestrian network: One-eighth of a mile accepted from the destination to the network, and travel sheds of one mile.
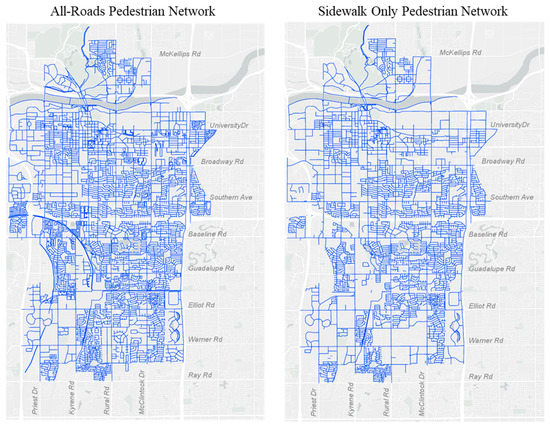
Figure 5.
Comparison of the all-roads pedestrian network and sidewalk-only pedestrian network.
2.1.5. The Transit Network
The transit network assessment was done differently than the previous scenarios for pedestrian and bicycling networks. First of all, it assumed a transit travel time of 30 min as being compliant with the 20-min city guidelines. Secondly, the network assessment was done in three parts: One quarter of a mile walking from the residential parcel to the bus stop, six miles transit ride, and a final quarter of a mile walk from the bus line to the final destination. Currently, Phoenix metro area has only one light rail light that connects the East Valley in Mesa and the West Valley in Glendale. The metropolitan light rail serves Tempe in its north area. In addition to the light rail, 17 regular bus routes from Phoenix Metropolitan Area serve Tempe. Six city circulators routes complement the transit system by offering free of charge service within the city limits (Valley Metro, 2019). Figure 6 illustrates the transit routes serving the city of Tempe.
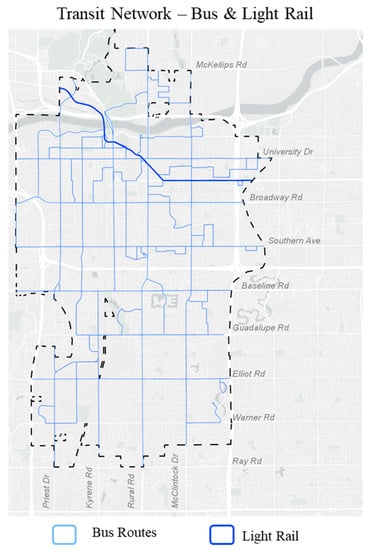
Figure 6.
Description of the transit routes serving Tempe, Arizona.
It is important to note that on this analysis, transfers were not allowed, and wait times were not considered. Many bus stops in Tempe are located on major roads, forcing transit users to cross large arterial and collector roads to access the bus; that time and discomfort were not incorporated into the methodology. Additionally, the proposed methodology works under the assumption that routes are identical in both directions, which does not hold on the beginning and end of most routes. The difference between route directions was considered negligible.
3. Results
The metrics used to assess compliance with 20-min city guidelines were the number of residential units that could reach at least one point of the destination groups and the number of destinations that each parcel could reach. The percentage of residential units that could connect to at least one occurrence of the destination type is shown in Table 3. The geographical representation of how many destinations each residential parcel could reach given the described scenarios are shown and discussed on Section 3.1, Section 3.2, Section 3.3, Section 3.4 and Section 3.5.
Table 3.
Percent of residential units * within 20-min of destination groups.
Table 3 shows, for each of the five analyzed scenarios, the percent of residential units that could reach at least one point of the destination groups. The cells marked in bold represent the destination groups with highest and lowest accessibility rates in the scenario. The scenario with the highest levels of accessibility was biking on any road. The criteria in this scenario was the least restrictive one, and all destination groups showed almost identical levels of connectivity with Tempe’s residential units. The second-best performing scenario was biking on low-stress roads. Given any set of destinations, an average of 80.8 percent of residential units could access it through bicycling on roads classified as low stress. Recreation destinations showed the highest level of accessibility through low stress bicycling, while special events destinations showed the lowest levels. The third scenario in terms of accessibility levels was pedestrians walking on any road. Transit represented the second-lowest in terms of compliance with 20-min city guidelines. Given any set of destinations, an average of 75.5 percent of residential units could reach at least one occurrence of that destination type through a 30-min transit trip. The lowest level of accessibility according to the 20-min city guidelines was observed for pedestrians walking only on segments with sidewalks.
3.1. The All-Roads Bicycle Network
Figure 7 shows the geographical representation, for each residential parcel, of how many destination groups it could reach within twenty minutes of bicycling on any road. The assessment indicated that while an average of 88.5 percent of Tempe’s residential units could reach a given destination, 98.5 percent of the residential area could access all twelve destination types. That result indicates that the parcels that could not reach any of the destinations were high-density parcels and represented a large number of residential units. Figure 7 shows areas without access to any destination within twenty minutes of bicycling on any roads (colored in red) on the northeast and southwest corners of Tempe.
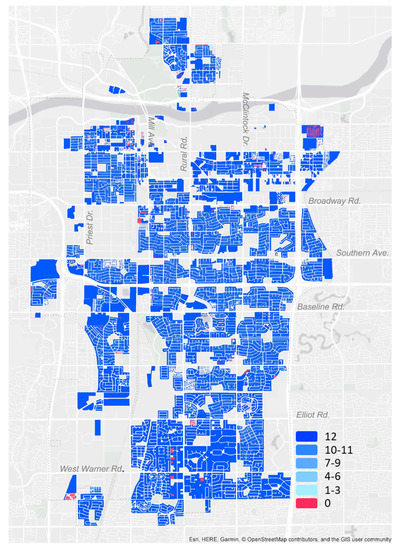
Figure 7.
Number of destinations accessible within 20-min by bicycle through all roads.
3.2. The Low-Stress Bicycle Network
Figure 8 shows the geographical representation, for each residential parcel, of how many destination groups it could reach within twenty minutes of bicycling on low-stress roads. It is noticeable that the accessibility levels decreased when compared to Figure 7. While the parcels without access to any of the twelve destinations remained the same, the number of parcels with intermediate levels of accessibility increased. Noticeably, the far east side of Tempe, around Southern Avenue showed decreased levels of accessibility, once it got disconnected from many destinations when major arterials were removed from the network. Reduced levels of accessibility were also observed on the east side and on the southeast corner of Tempe.
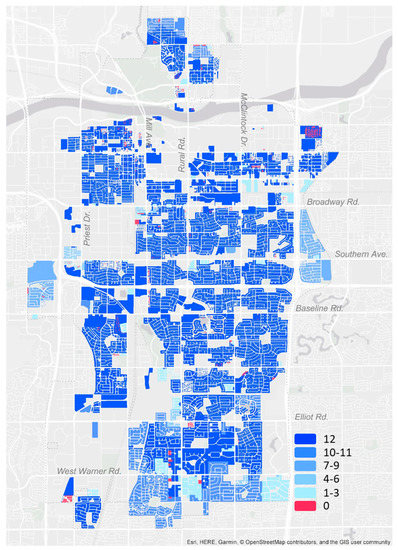
Figure 8.
Number of destinations accessible within 20-min by bicycle through low-stress roads.
3.3. All-Roads Pedestrian Network
Figure 9 shows the geographical representation, for each residential parcel, of how many destination groups it could reach within twenty minutes of walking on any road. The accessibility levels significantly dropped when compared to Figure 8. The parcels without connection to any destination repeated the patterns seen on Figure 7 and Figure 8. The areas that could connect to all twelve destinations in this scenario were restricted to the central part of Tempe (along Rural road), especially on around Baseline road, and south of Tempe Town Lake (indicated in the figure as the dark gray stream on north Tempe), as well as north Mill Avenue. It is important to note that while north Mill Avenue and the intersection of Rural and Baseline roads show similar levels of accessibility, they are very different from each other. North Mill Avenue is the heart of downtown Tempe, it has high pedestrian volume, and is very friendly to non-motorized modes and transit. Downtown Tempe offers amenities such as shades and traffic-calming measures. On the other hand, the intersection of Rural and Baseline is car-oriented, with multiple-lane roads, high-capacity parking lots, and other features that make it less friendly to non-auto modes.
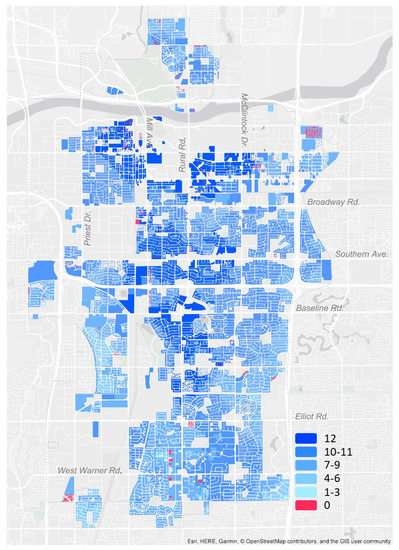
Figure 9.
The number of destinations accessible within 20-min by walking on all roads.
3.4. The Sidewalk-Only Pedestrian Network
Figure 10 shows how many destination groups each parcel could reach within twenty minutes of walking only on roads with sidewalk present on at least one side of the road. This scenario showed the lowest levels of accessibility across the studies shown on this manuscript. A large portion of South Tempe appears on Figure 10 as having no access to any of the twelve destinations. South Tempe is characterized by single-family homes, and residential complexes of with private roads. The lack of information on sidewalk availability on private roads was reflected on the methodology proposed in this manuscript. The remainder of the city showed decreased accessibility levels in comparison with the assessments for pedestrians walking on all roads. Smaller areas continued to exhibit access to all twelve destinations, such as north Mill Avenue, north Rural Road, and the surroundings of Rural and Baseline Roads.
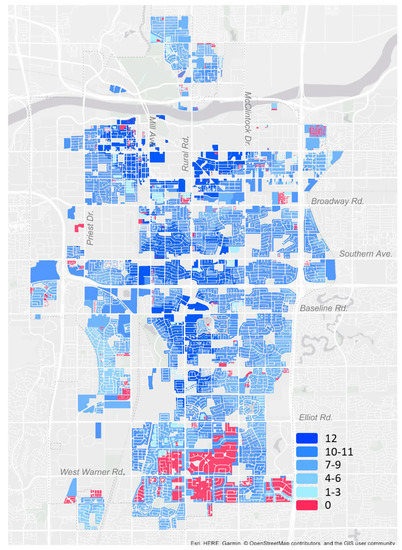
Figure 10.
The number of destinations accessible within 20-min by walking on streets with sidewalks.
3.5. Transit Network
Figure 11 shows the assessment of how many of the twelve destination groups each residential parcel could access through a 30-min transit ride. Even though the transit network analysis yielded the second-lowest level of accessibility, Figure 11 shows that a large portion of the city could not access any of the twelve proposed destinations. The transit network in Tempe is characterized by a higher route density north of Baseline Road, when compared to the south part of the city. This distinction can be seen on the map (Figure 11) as the connectivity levels on north Tempe is significantly better when compared with the rest of the city. Another factor influencing the result shown on Figure 11 is Tempe bus routes run mainly on arterials and collectors, leaving residential parcels that are farther than one-quarter of a mile from those roads without access to the transit system.
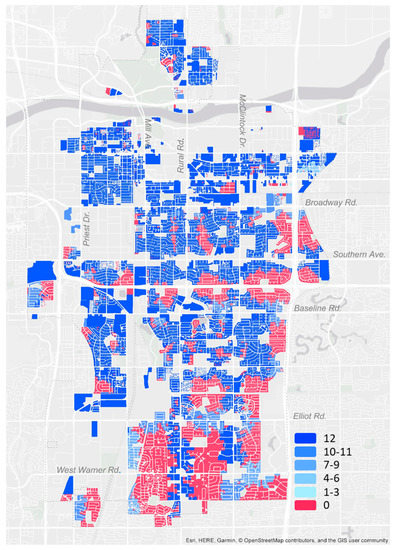
Figure 11.
Number of destinations accessible within 20-min by taking public transportation.
4. Discussion, Limitations, and Future Research
The analyses presented demonstrate that overall Tempe is highly accessible by multiple modes other than automobiles, and that there are substantial geographic differences in the amount of access. City planners using these methods and analyses can prioritize spaces where accessibility improvements will have the largest effect in terms of improving connections between homes and destinations. Measuring network distance, and estimating time, is effective, as shown, to evaluate 20-min access.
This work demonstrates methods that can be replicated in other cities to improve accessibility planning. A weakness of overall accessibility analysis has been the development and presentation of accessibility goals, such as access to employment, can be hard to apply in practice. It is also the case that in many metro areas, car commutes will continue to be the dominant mode of access to employment. In this paper, we focus on non-commute travel, which makes up over 80 percent of all travel trips in the US [24]. A suburban city like Tempe is unlikely to balance jobs and housing in a way that allows for substantial reductions in car commuting simply because employment within the region is so spread out spatially. So, to connect accessibility targets with sustainability goals, the city wants to develop planning interventions that facilitate non-auto travel for daily and weekly non-work needs. A 20-min city analysis for non-work home-based travel provides a framework for planning infrastructure upgrades and other interventions that may enhance sustainable transport alternatives.
However, while the data used for these analyses are detailed at the network and parcel level, there is more to walkability and cycling than network connections. These limitations suggest new areas of research and applications for accessibility modeling. The geographic differences are clear in that some places are more accessible than others, but what is less clear from these analyses are where people actually travel by foot, bike or transit. The development of the low-stress bike network was one way to classify perceived and real differences in cycling quality, but this approach focuses entirely on characteristics of the road network. To better understand how accessibility is used as people go about their daily lives, micro-level knowledge of the built environment is needed. In South Tempe, there are intersections that rate very high in terms of 20-min access, but in truth, few would ever walk or bike because few places are built to welcome pedestrians.
South Tempe, like many American suburbs, features commercial and retail that faces interior parking lots rather than sidewalks buffeting streets. Many of the commercial intersections of South Tempe rate as highly accessible as intersections in downtown Tempe based on network distance. Yet in South Tempe, stores do not even have doors that open to the sidewalk, and on many intersections there are no businesses that front the corner. Space that could be valuable real estate is reserved for signage. In downtown Tempe, the design is different. Stores at intersections have doors that open directly to the sidewalk, which makes the sidewalk more useful and more pleasant. Downtown also does not have setback requirements, which means that buildings provide valuable shade, and the distance between entries and across streets is minimized. There are many characteristics of the built environment not captured through network analysis that are critical for 20-min city success. Figure 12 illustrates intersections in Downtown Tempe and South Tempe.
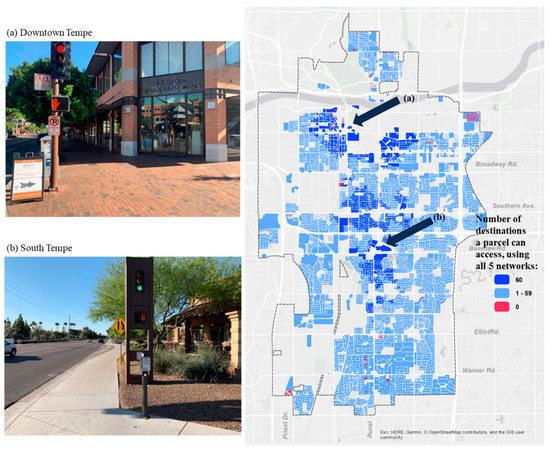
Figure 12.
Number of destinations accessible within 20-min by all 5 network analyses, and examples of intersections in Downtown Tempe and South Tempe.
Evaluating qualities of the built environment can be done through inventories, such as an adapted Irvine-Minnesota Inventory [25]. Such an inventory uses descriptive terms to assemble a standardized database of characteristics associated with active travel in the case of the I-M inventory. Developing an inventory to assess the small details that collectively sum to a sustainable, walkable, bikeable and transit-friendly city is an important next step of this research. The challenge for the city is there are few ways to automate the process of collecting such data and conducting an inventory without sending people out to personally evaluate, which may require more resources than available. There are some promising developments in the use of street-level images such as Google’s StreetView [26].
5. Conclusions
The analysis presented is a case study of how accessibility can be used in practice through a 20-min city program. The process and hierarchy of decision making described was used to create a baseline for 20-min city planning interventions. Creating baseline measures of a 20-min city requires many decisions about seemingly minor details, but the decisions must be made deliberately for legitimacy, replication, and to ensure that city priorities are considered.
The decision-making process for a 20-min city analysis was described. The process involves many small decisions that individually may seem trivial, but if not approached systematically, the results may be adversely affected, or the methods will not be replicable. The intent of this research is to adequately describe the decision-making process and show how 20-min city considerations do connect accessibility as a concept to practicing planners.
The 20-min city shows that accessibility can be implemented as a local sustainability strategy. Improved accessibility is not just a transport goal, but one that supports sustainability and climate action goals. Tempe is highly accessible, especially by bike, which suggests that orienting planning initiatives toward more bikeable infrastructure could improve their use. Yet limits to the data mean the analyses presented and developed by the city do not fully capture the qualities of the built environment and road network that may better encourage cycling. Site plans and real estate development should consider how design elements, such as curb cuts, driveways, and building frontages, create permeable sites that encourage walking and cycling. Improvements on the road network alone are unlikely to be sufficient on their own, though necessary, to promote alternatives to driving.
Future research directions should include evaluation of 20-min city interventions, such as bake infrastructure, and public engagement and acceptance of the process. The methods presented in this paper offer a direction for which cities can analyze and explain the steps required for analysis, as well as present the results in ways that hopefully are straightforward to the public. Other research directions include site design elements that best support accessibility and sustainability goals.
Author Contributions
Conceptualization, D.A.K. and S.L.; methodology, S.L.; software, S.L. and D.C.D.S.; validation, S.L.; formal analysis, D.C.D.S. and S.L.; investigation, S.L.; resources, S.L. and D.A.K.; data curation, S.L.; writing—original draft preparation, D.C.D.S. and D.A.K.; writing—review and editing, D.A.K. and D.C.D.S.; visualization, D.C.D.S.; supervision, D.A.K.; project administration, S.L.; funding acquisition, D.A.K. and S.L. All authors have read and agreed to the published version of the manuscript.
Funding
This research was funded by the City of Tempe.
Acknowledgments
This manuscript is one of the outcomes of a city studio class, in partnership with Arizona State University. The following students contributed to the results presented: Marina Copeland, Mehak Sachdeva, Ahmed Tambe, Wenqi Ding, Syera Torain, Clemente Francisco, Max Courval, Josue Barboza, and Brittney Topel.
Conflicts of Interest
The authors declare no conflict of interest.
References
- Levinson, D.; King, A.D. A Political Economy of Access, 1st ed.; Network Design Lab: Sydney, Australia, 2019. [Google Scholar]
- Bertolini, L.; Le Clercq, F.; Kapoen, L. Sustainable accessibility: A conceptual framework to integrate transport and land use plan-making. Two test-applications in the Netherlands and a reflection on the way forward. Transp. Policy 2005, 12, 207–220. [Google Scholar] [CrossRef]
- Borowski, E.; Ermagun, A.; Levinson, D. Disparity of Access: Variations in Transit Service by Race, Ethnicity, Income, and Auto Availability. 2018. Available online: https://ses.library.usyd.edu.au/bitstream/handle/2123/18780/DisparityOfAccess_Final.pdf?sequence=4&isAllowed=y (accessed on 22 December 2019).
- Curtis, C. Planning for sustainable accessibility: The implementation challenge. Transp. Policy 2008, 15, 104–112. [Google Scholar] [CrossRef]
- Deboosere, R.; El-Geneidy, A.M.; Levinson, D. Accessibility-oriented development. J. Transp. Geogr. 2018, 70, 11–20. [Google Scholar] [CrossRef]
- Farrington, J.H. The new narrative of accessibility: Its potential contribution to discourses in (transport) geography. J. Transp. Geogr. 2007, 15, 319–330. [Google Scholar] [CrossRef]
- Priemus, H.; Visser, J. Infrastructure policy in the Randstad Holland: Struggle between accessibility and sustainability. Political Geogr. 1995, 14, 363–377. [Google Scholar] [CrossRef]
- Silva, C.; Pinho, P. The Structural Accessibility Layer (SAL): Revealing how urban structure constrains travel choice. Environ. Plan. A 2010, 42, 2735–2752. [Google Scholar] [CrossRef]
- Cheng, J.; Bertolini, L.; le Clercq, F. Measuring sustainable accessibility. Transp. Res. Rec. 2007, 2017, 16–25. [Google Scholar] [CrossRef]
- Omer, I. Evaluating accessibility using house-level data: A spatial equity perspective. Comput. Environ. Urban Syst. 2006, 30, 254–274. [Google Scholar] [CrossRef]
- Dempsey, N.; Bramley, G.; Power, S.; Brown, C. The social dimension of sustainable development: Defining urban social sustainability. Sustain. Dev. 2011, 19, 289–300. [Google Scholar] [CrossRef]
- Owen, A.; Murphy, B. Access across America: Transit 2017. 2018. Available online: https://trid.trb.org/view/1522808 (accessed on 22 December 2019).
- Silva, C.; Bertolini, L.; te Brömmelstroet, M.; Milakis, D.; Papa, E. Accessibility instruments in planning practice: Bridging the implementation gap. Transp. Policy 2017, 53, 135–145. [Google Scholar] [CrossRef]
- McNeil, N. Bikeability and the 20-min neighborhood: How infrastructure and destinations influence bicycle accessibility. Transp. Res. Rec. 2011, 2247, 53–63. [Google Scholar] [CrossRef]
- Stanley, J.; Stanley, J.; Davis, S. Connecting Neighbourhoods: The 20 Minute City, Bus and Coach Industry Policy Paper 4; Bus Industry Confederation: Canberra, Australia, 2014. [Google Scholar]
- Legacy, C.; Rogers, D.; Ruming, K.J.; Cook, N.T. ‘30-Minute City’? Not in My Backyard! SMART Cities Plan Must Let People Have Their Say. The Conversation, 24 May 2016. [Google Scholar]
- Sarkar, S.; Levinson, D.M.; Wu, H. How close is Sydney to the vision of creating three 30-minute cities? The Conversation, 21 March 2019. [Google Scholar]
- Graves, B. The Shaping of a ‘20-Minute City’. Governing, 9 October 2017. [Google Scholar]
- Portland Plan: Portland, OR, USA. Available online: https://www.portlandonline.com/portlandplan/index.cfm?c=56527 (accessed on 22 December 2019).
- US Census. Vintage 2018 Population Estimates; US Census: Suitland, MD, USA, 2018.
- Te Brömmelstroet, M.; Curtis, C.; Larsson, A.; Milakis, D. Strengths and weaknesses of accessibility instruments in planning practice: Technological rules based on experiential workshops. Eur. Plan. Stud. 2016, 24, 1175–1196. [Google Scholar]
- US Census. North American Industry Classification System; US Census: Suitland, MD, USA, 2019.
- Mekuria, M.C.; Furth, P.G.; Nixon, H. Low-Stress Bicycling and Network Connectivity; Mineta Transportation Institute: San Jose, CA, USA, 2012. [Google Scholar]
- Federal Highway Administration. 2017 National Household Travel Survey; US Department of Transportation: Washington, DC, USA, 2018.
- Day, K.; Boarnet, M.; Alfonzo, M.; Forsyth, A. The Irvine–Minnesota inventory to measure built environments: Development. Am. J. Prev. Med. 2006, 30, 144–152. [Google Scholar] [CrossRef] [PubMed]
- Seiferling, I.; Naik, N.; Ratti, C.; Proulx, R. Green streets—Quantifying and mapping urban trees with street-level imagery and computer vision. Landsc. Urban Plan. 2017, 165, 93–101. [Google Scholar] [CrossRef]


© 2019 by the authors. Licensee MDPI, Basel, Switzerland. This article is an open access article distributed under the terms and conditions of the Creative Commons Attribution (CC BY) license (http://creativecommons.org/licenses/by/4.0/).