Classifying Dams for Environmental Flow Implementation in China


Abstract
1. Introduction
2. Materials and Method
2.1. Classification Method
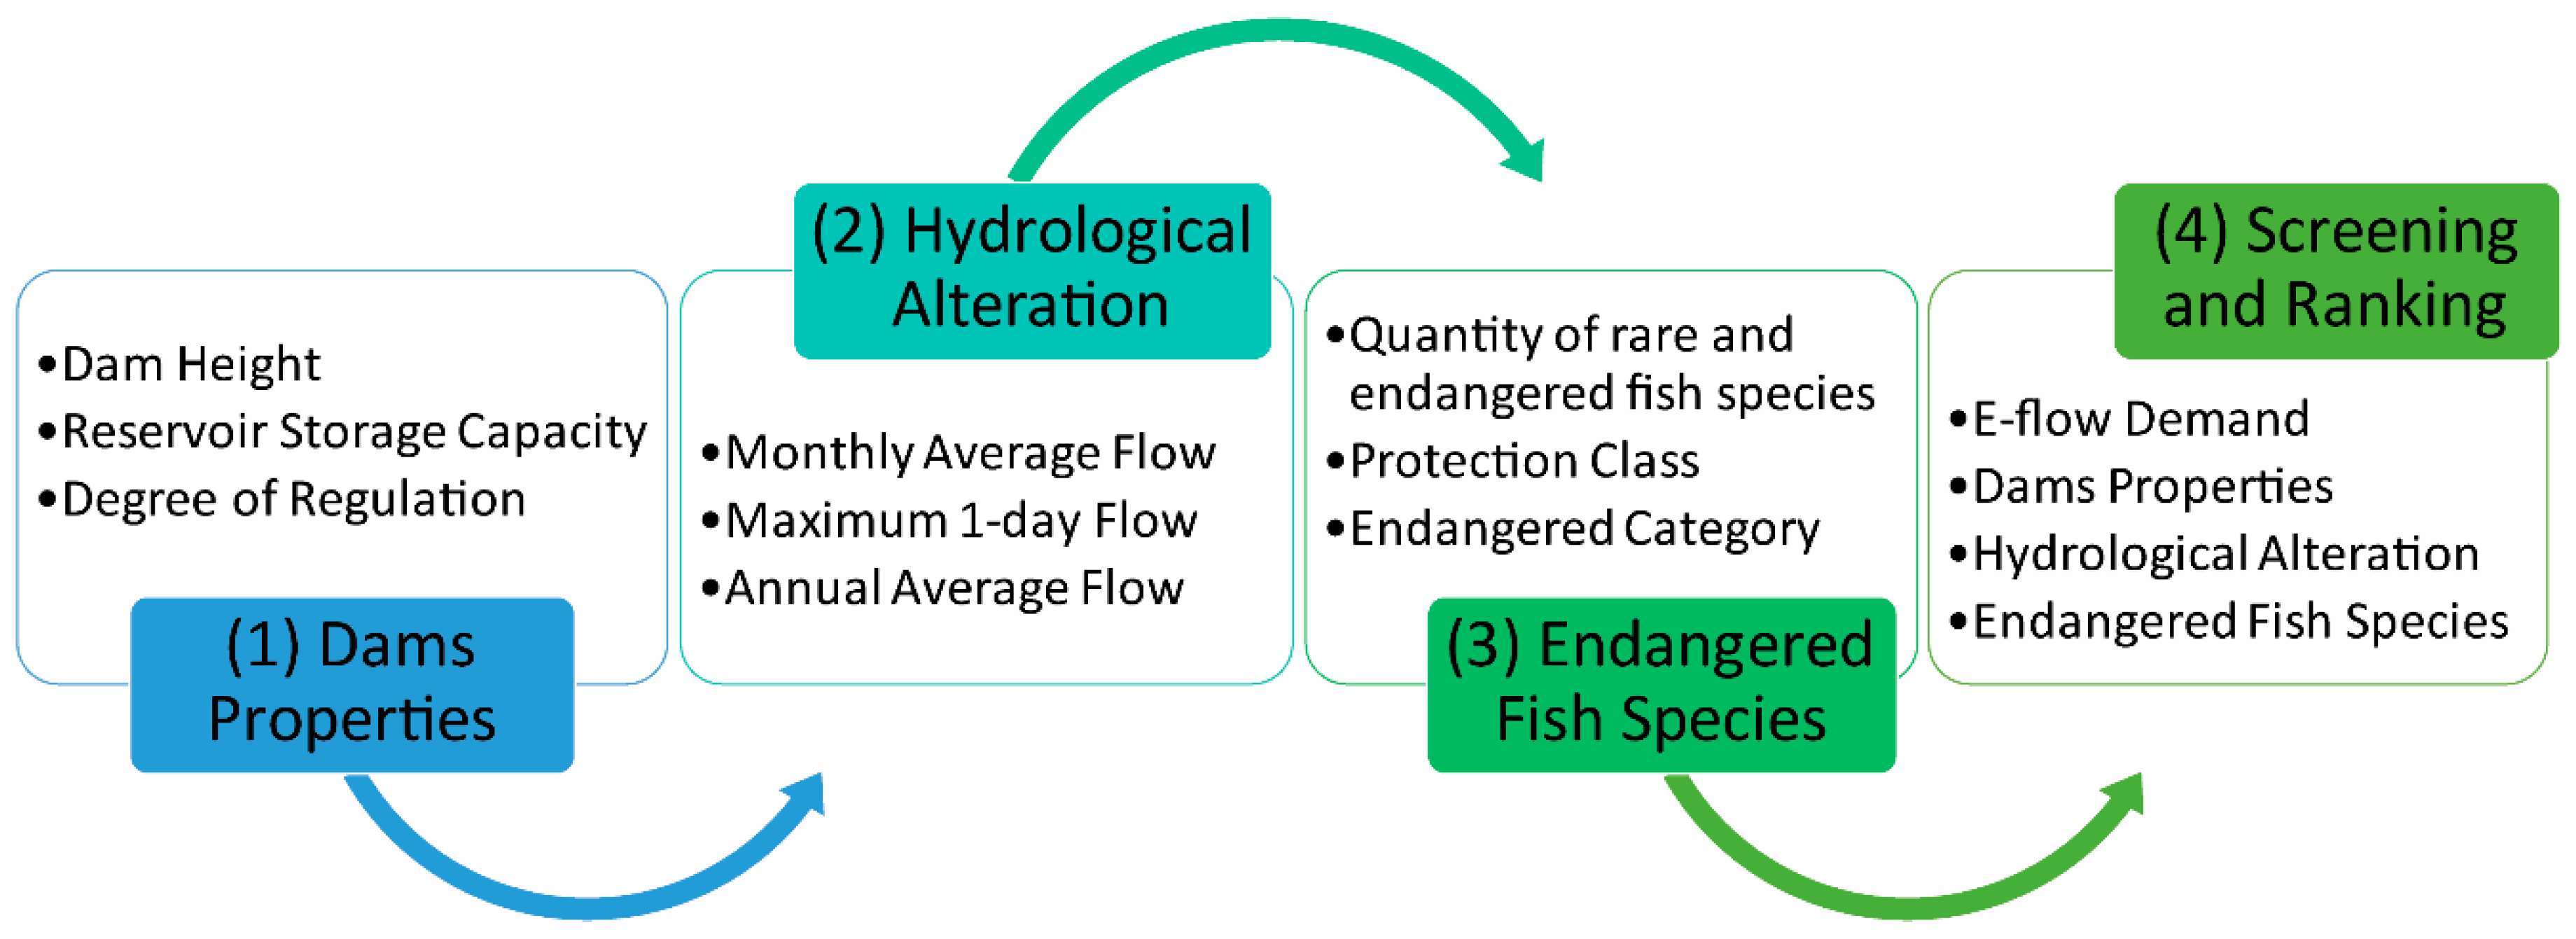
2.1.1. The Classification Framework
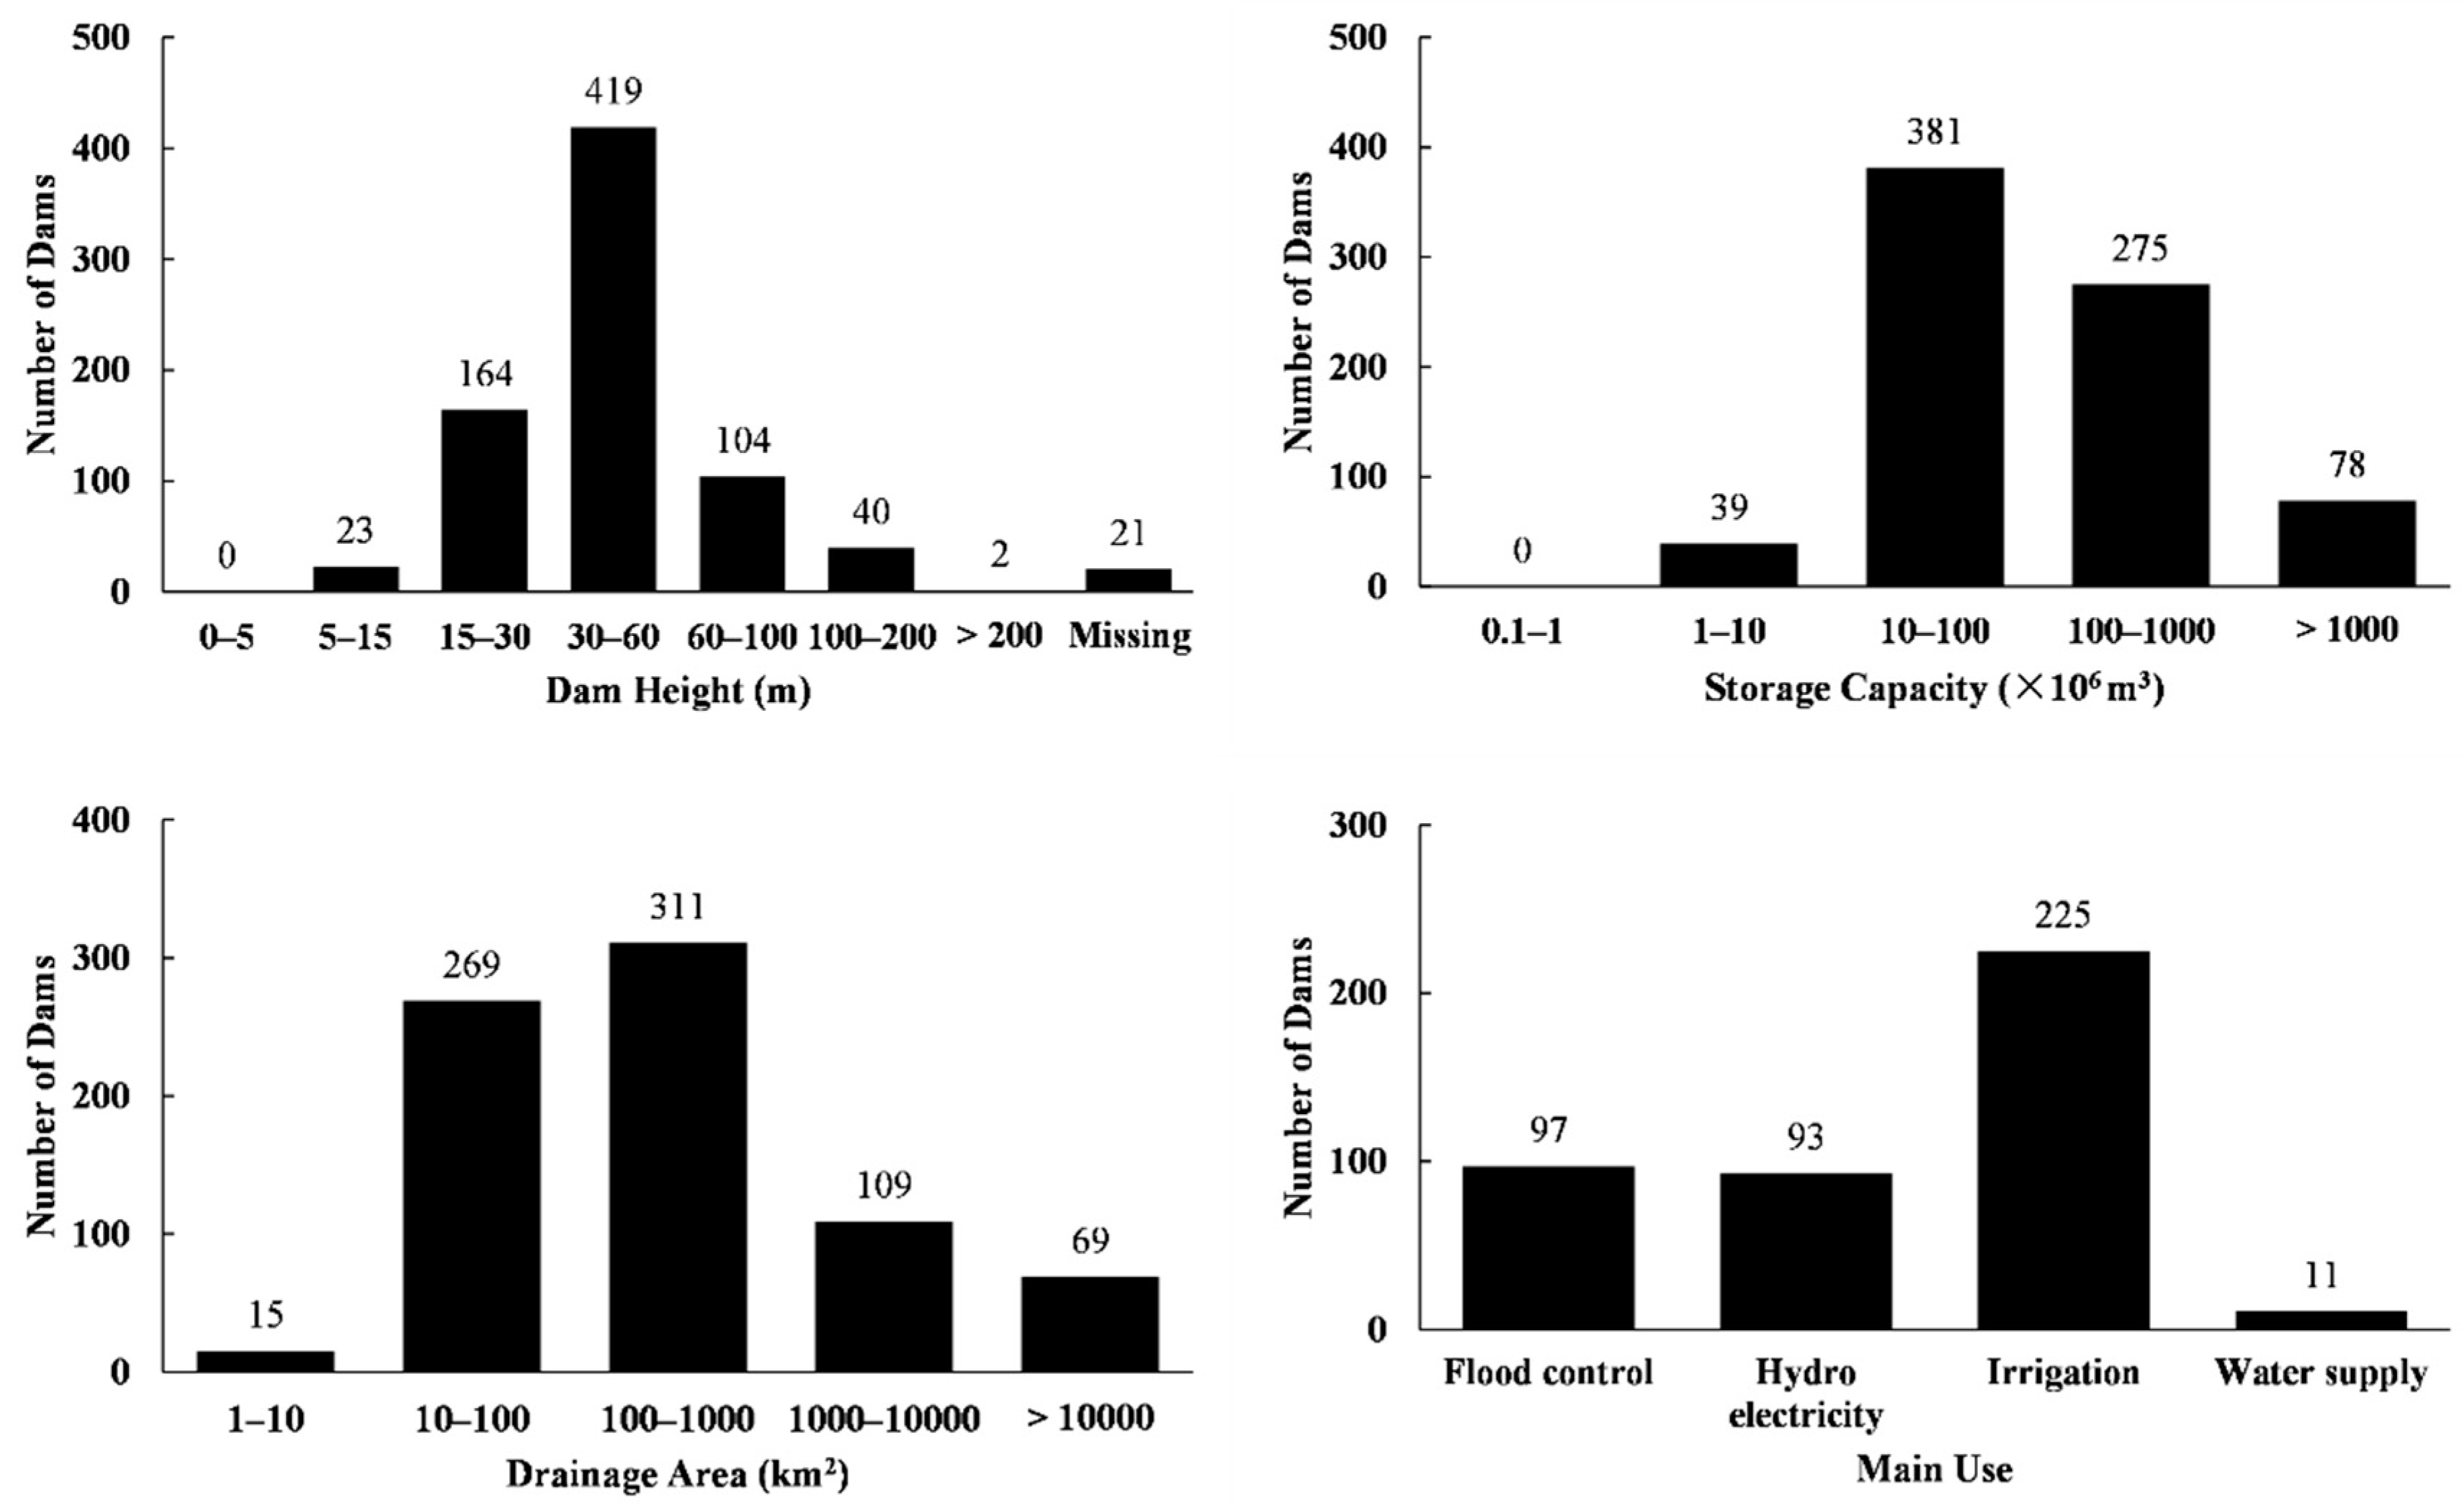
2.1.2. Dam Property Indicators
Reservoir Storage Capacity ()
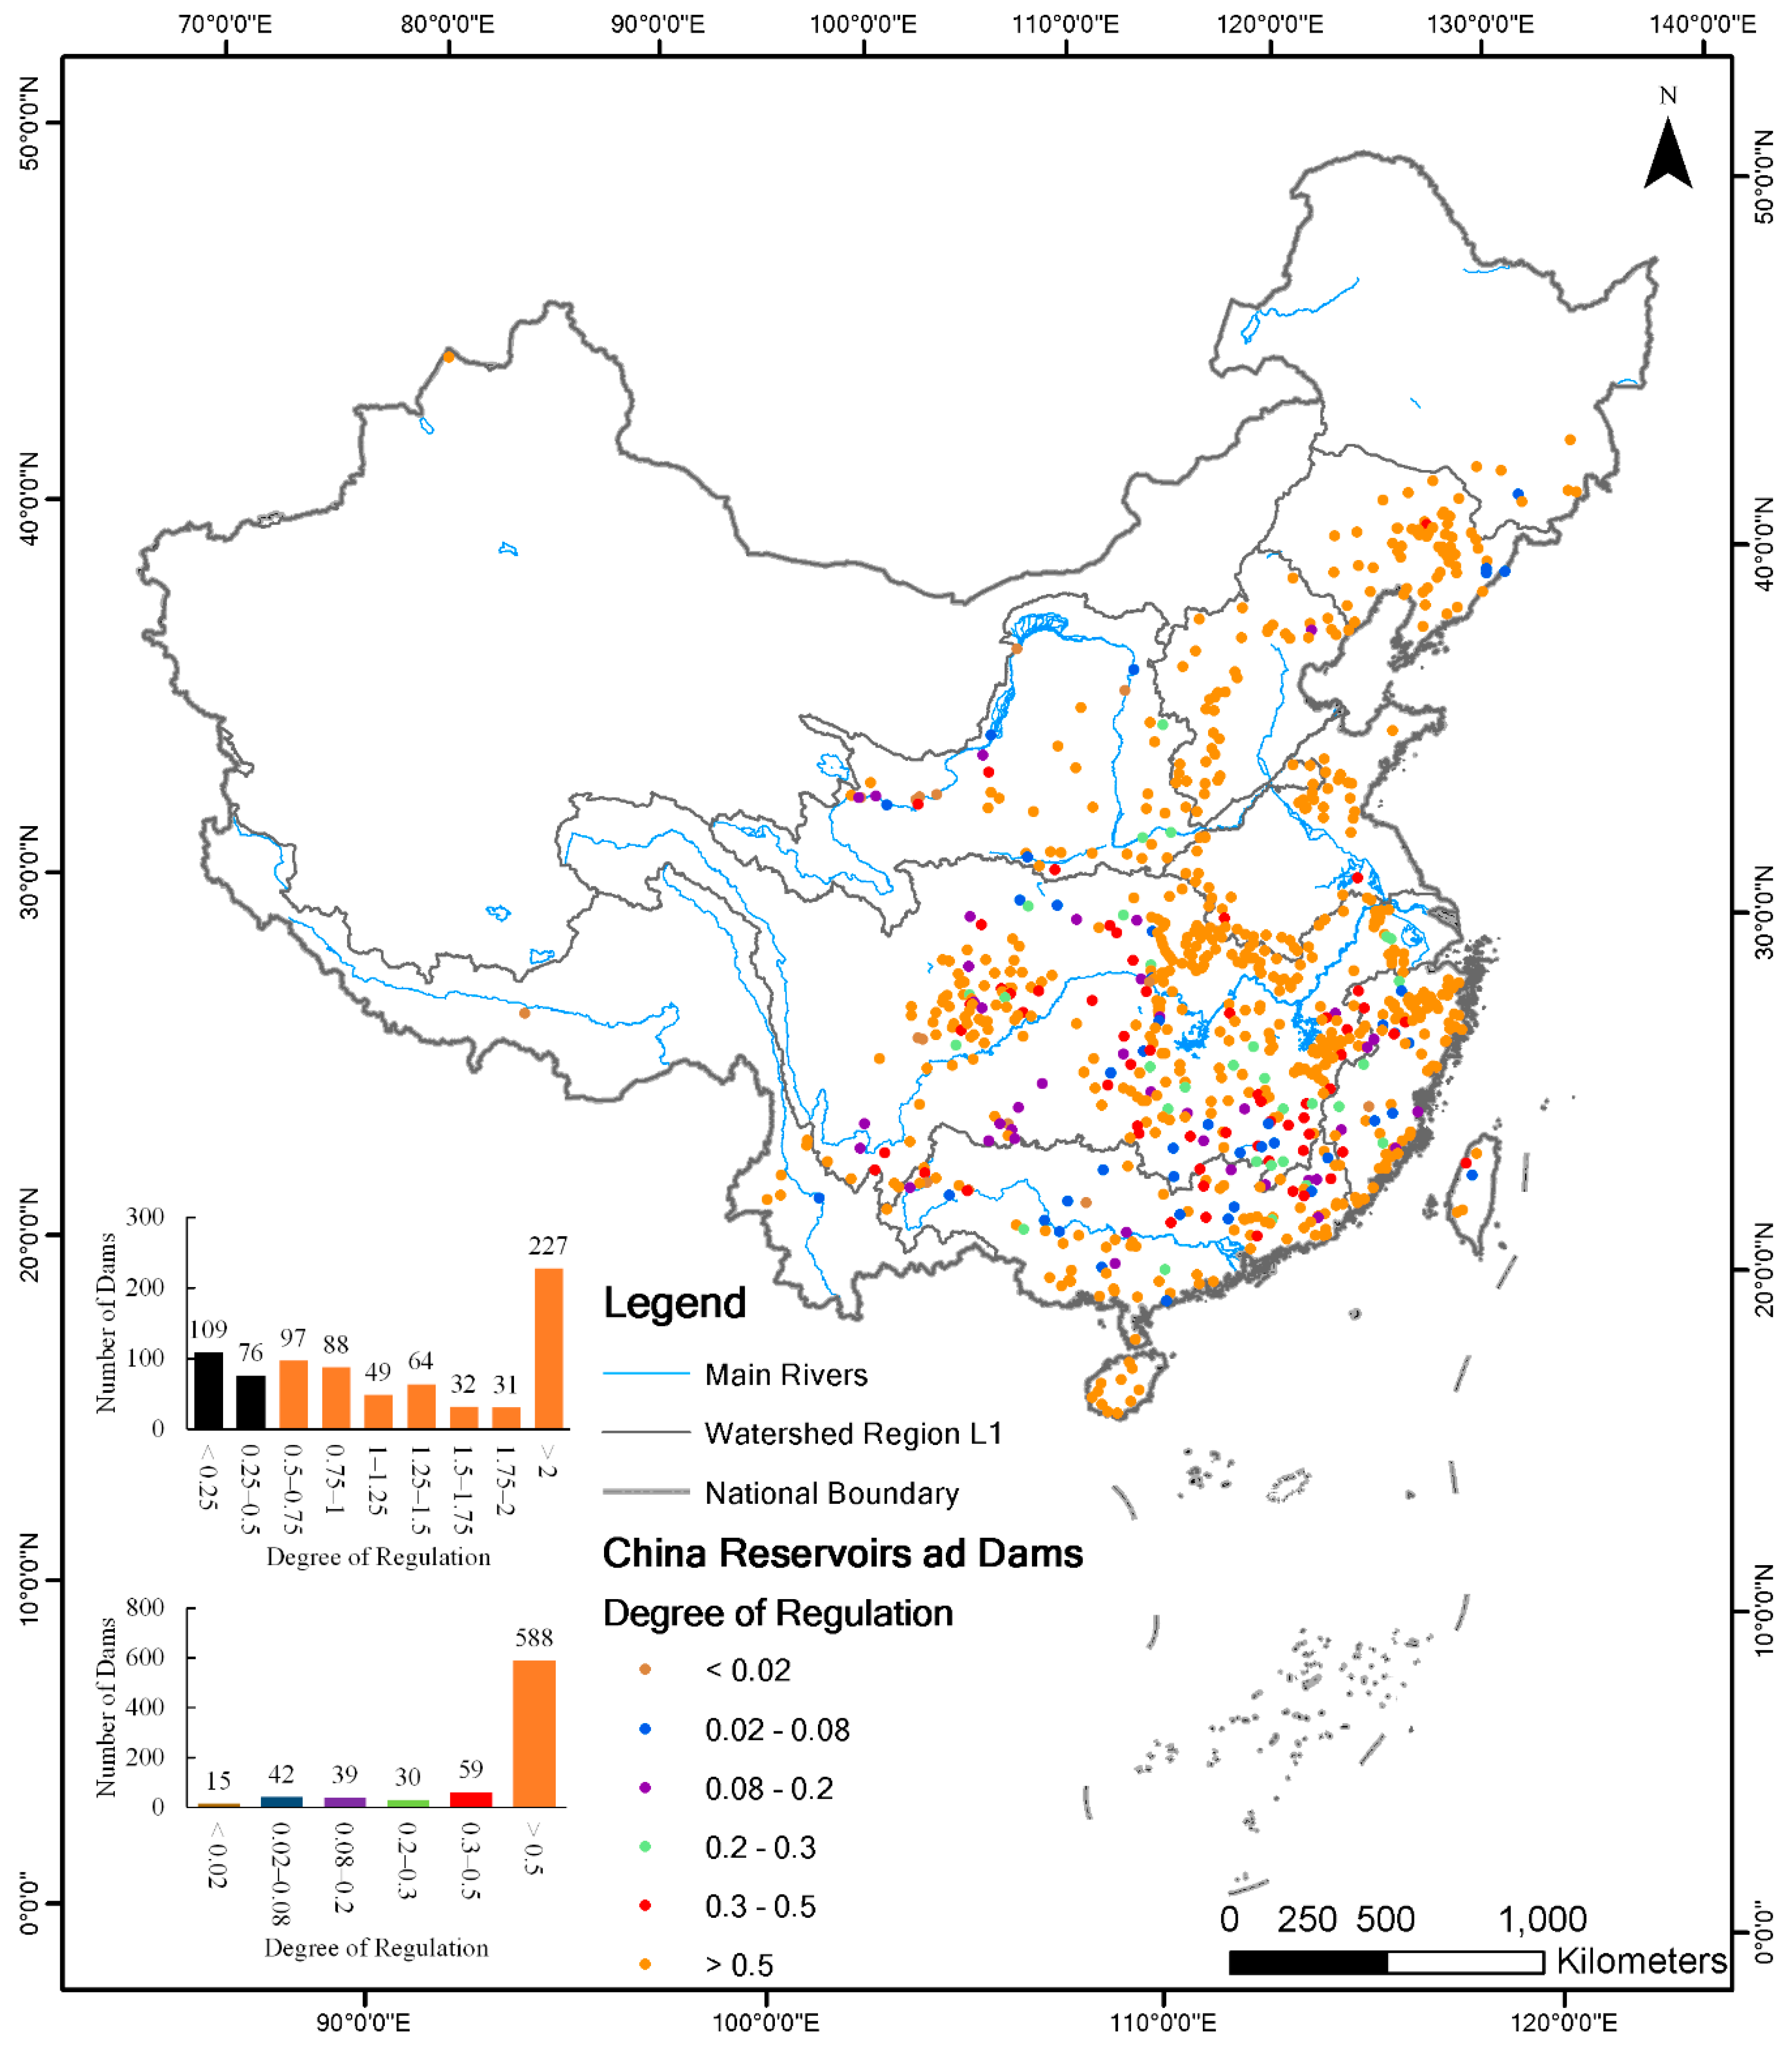
Degree of Regulation ()
2.1.3. Hydrological Alteration Indicators
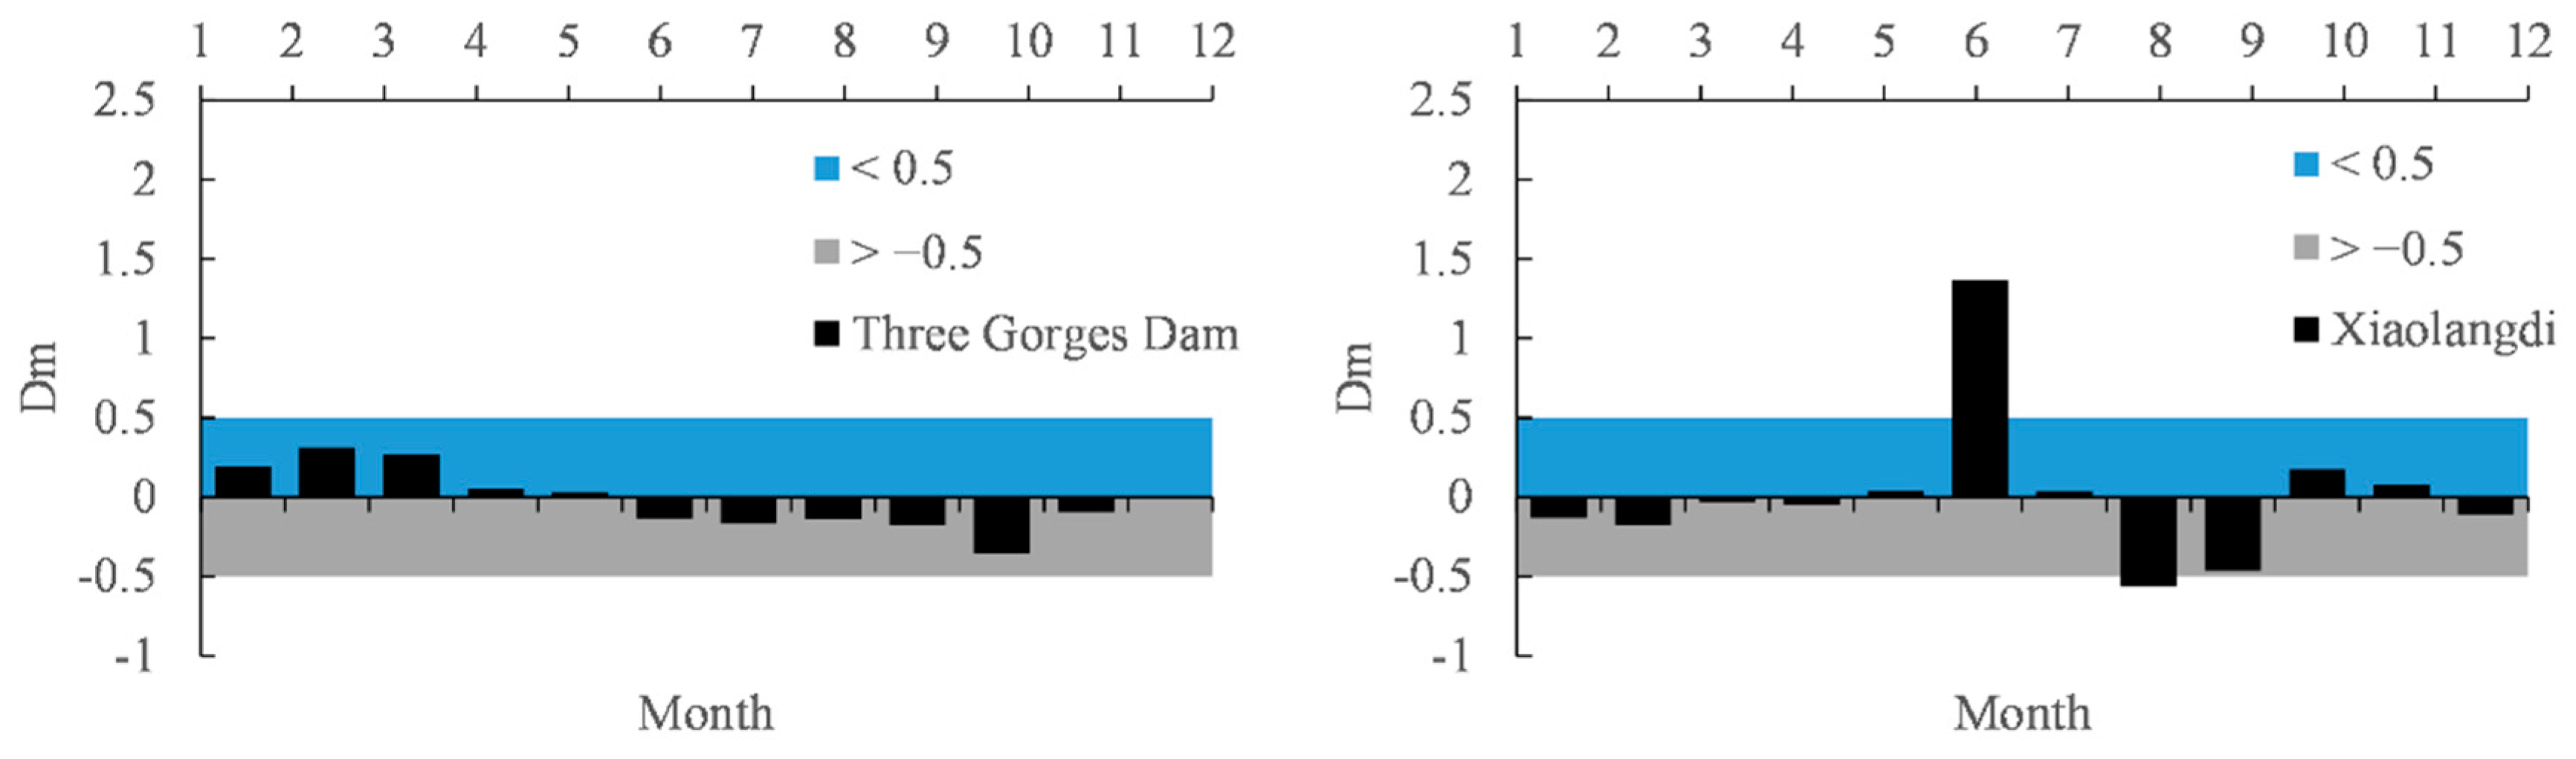
Range of Monthly Average Flow ()
Range of Maximum 1-Day Flow ()
Range of Annual Average Flow ()
2.1.4. Hydrobiological Indicators
The Quantity of Rare and Endangered Fish Species ()
Protection Class of Rare and Endangered Fish Species ()
Endangered Category of Rare and Endangered Fish Species ()
2.1.5. Screening and Ranking
2.2. Data Preparation
2.2.1. Dam Data
2.2.2. Hydrological Data
2.2.3. Hydrobiological Data
3. Results
3.1. Classification of Dam Properties
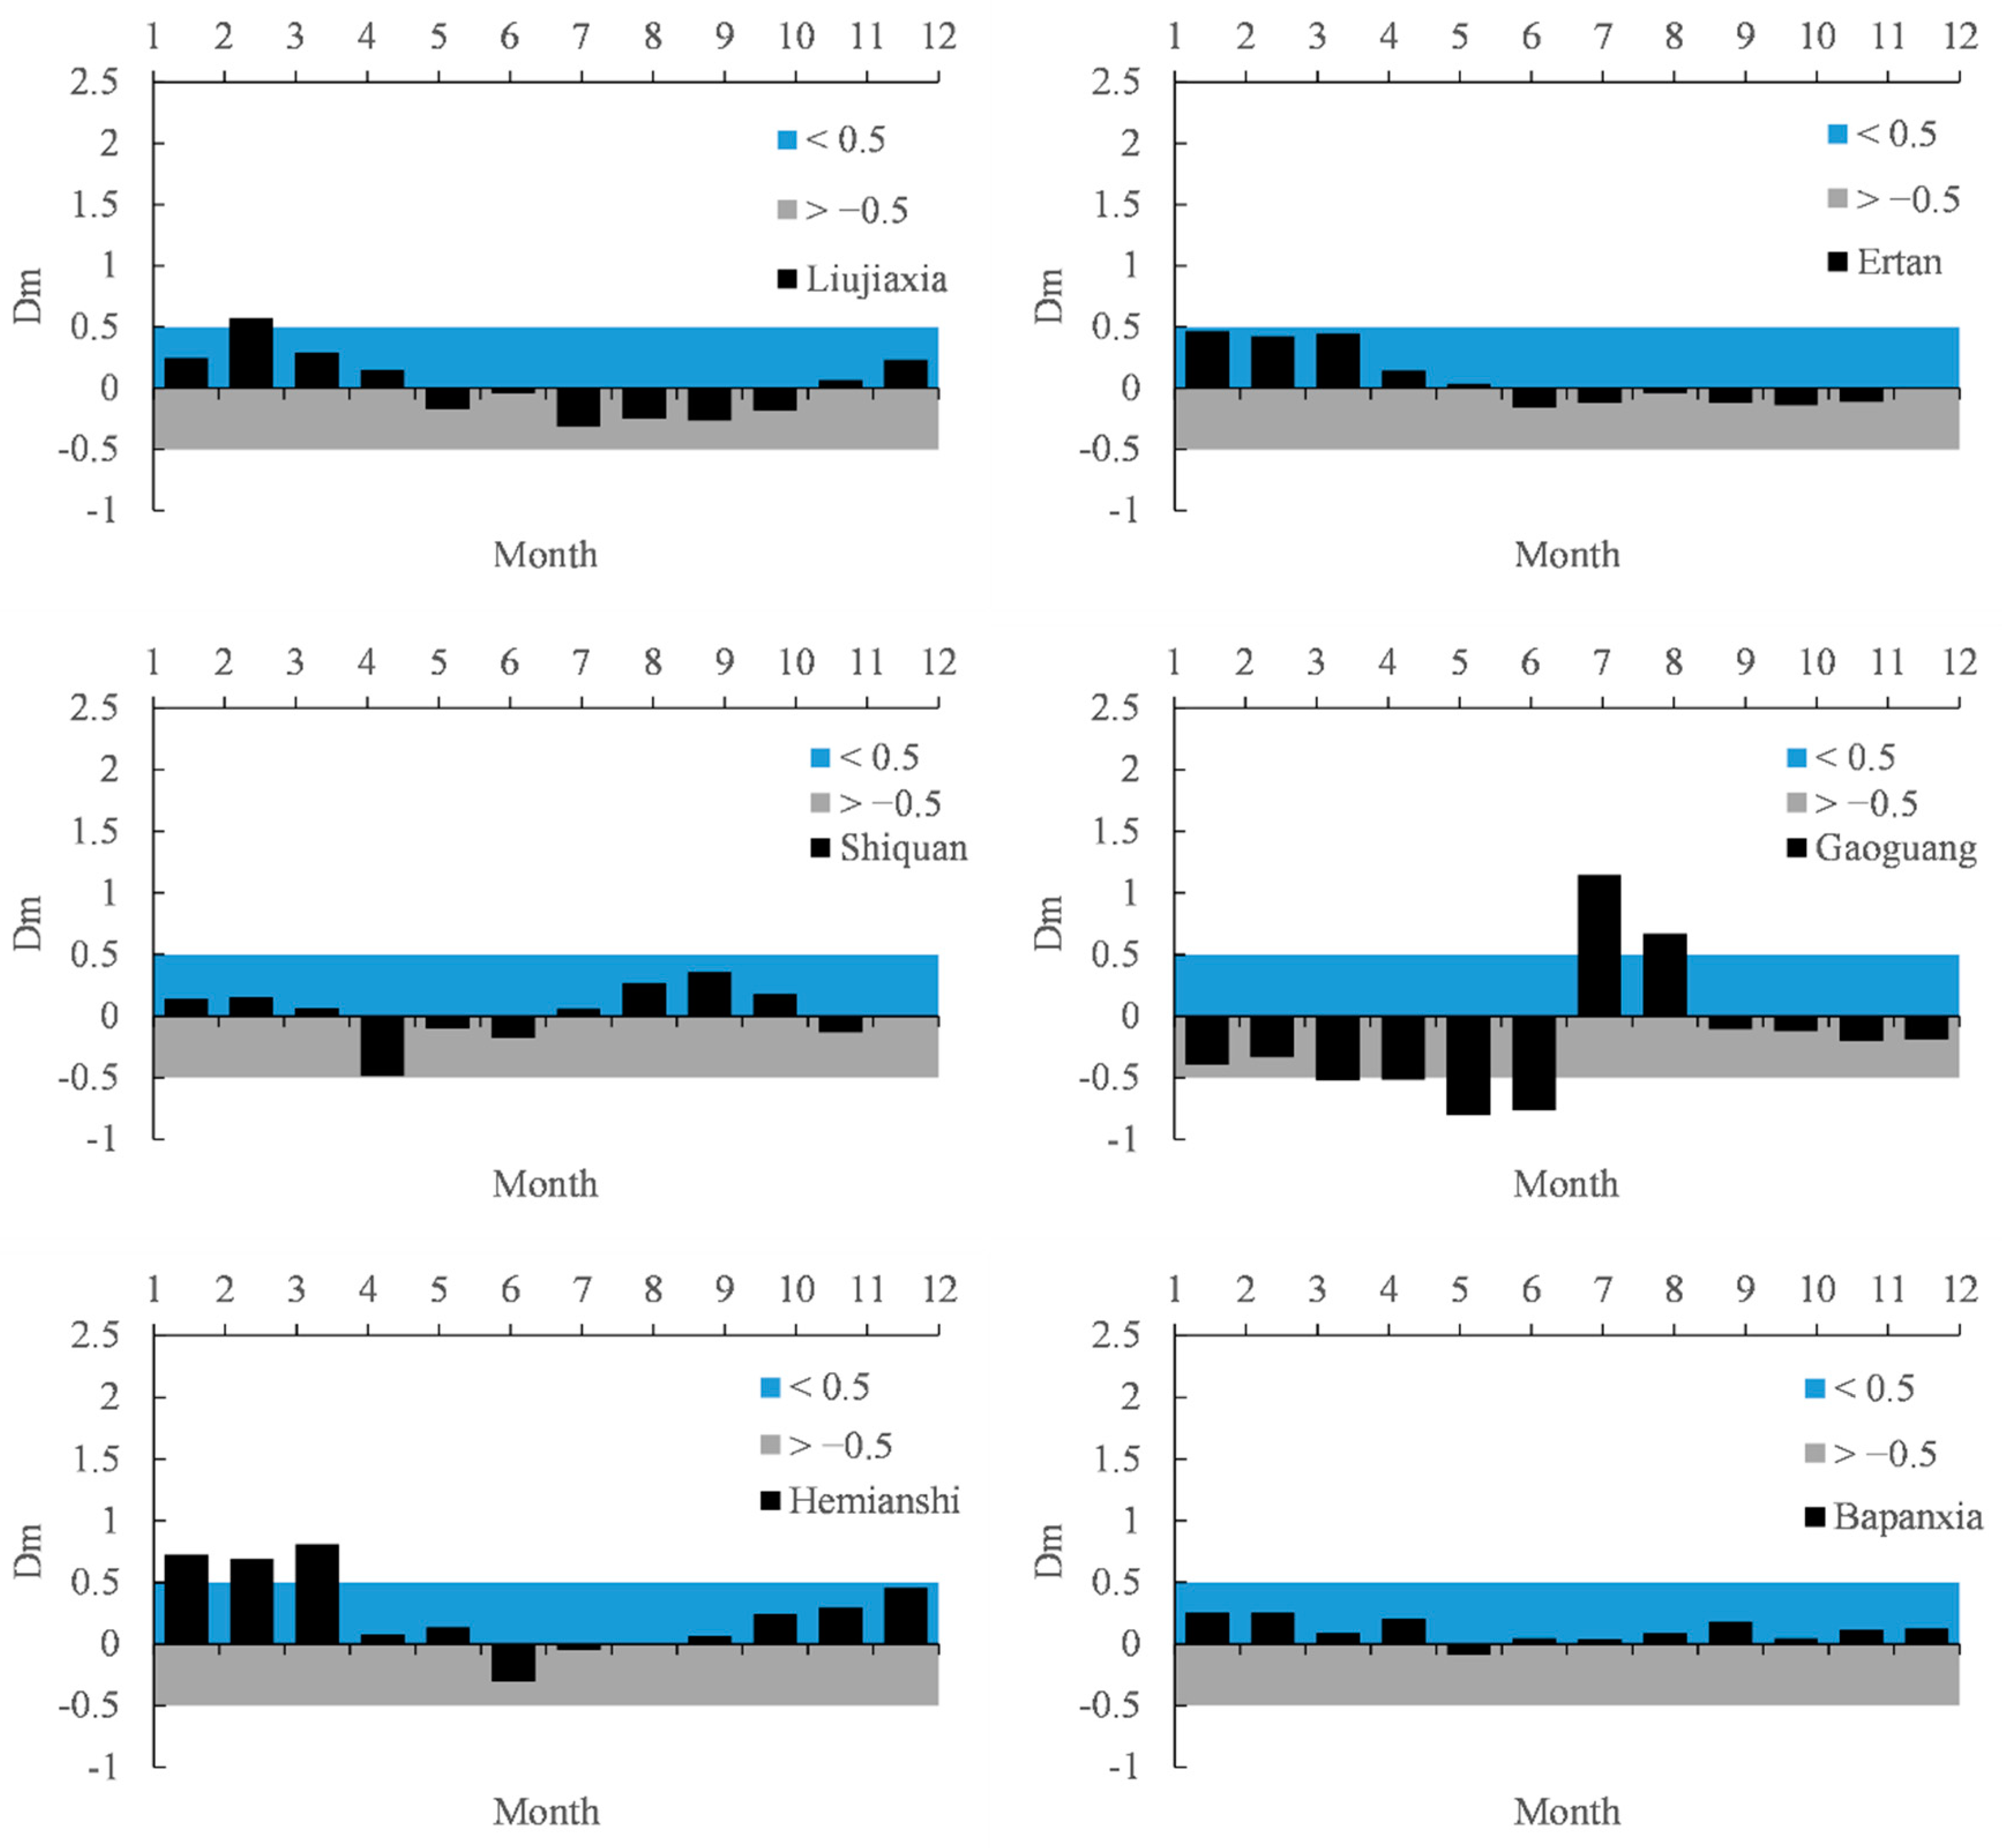
3.2. Classification of Hydrological Alteration
3.2.1. Range of Monthly Average Flow Variability ()
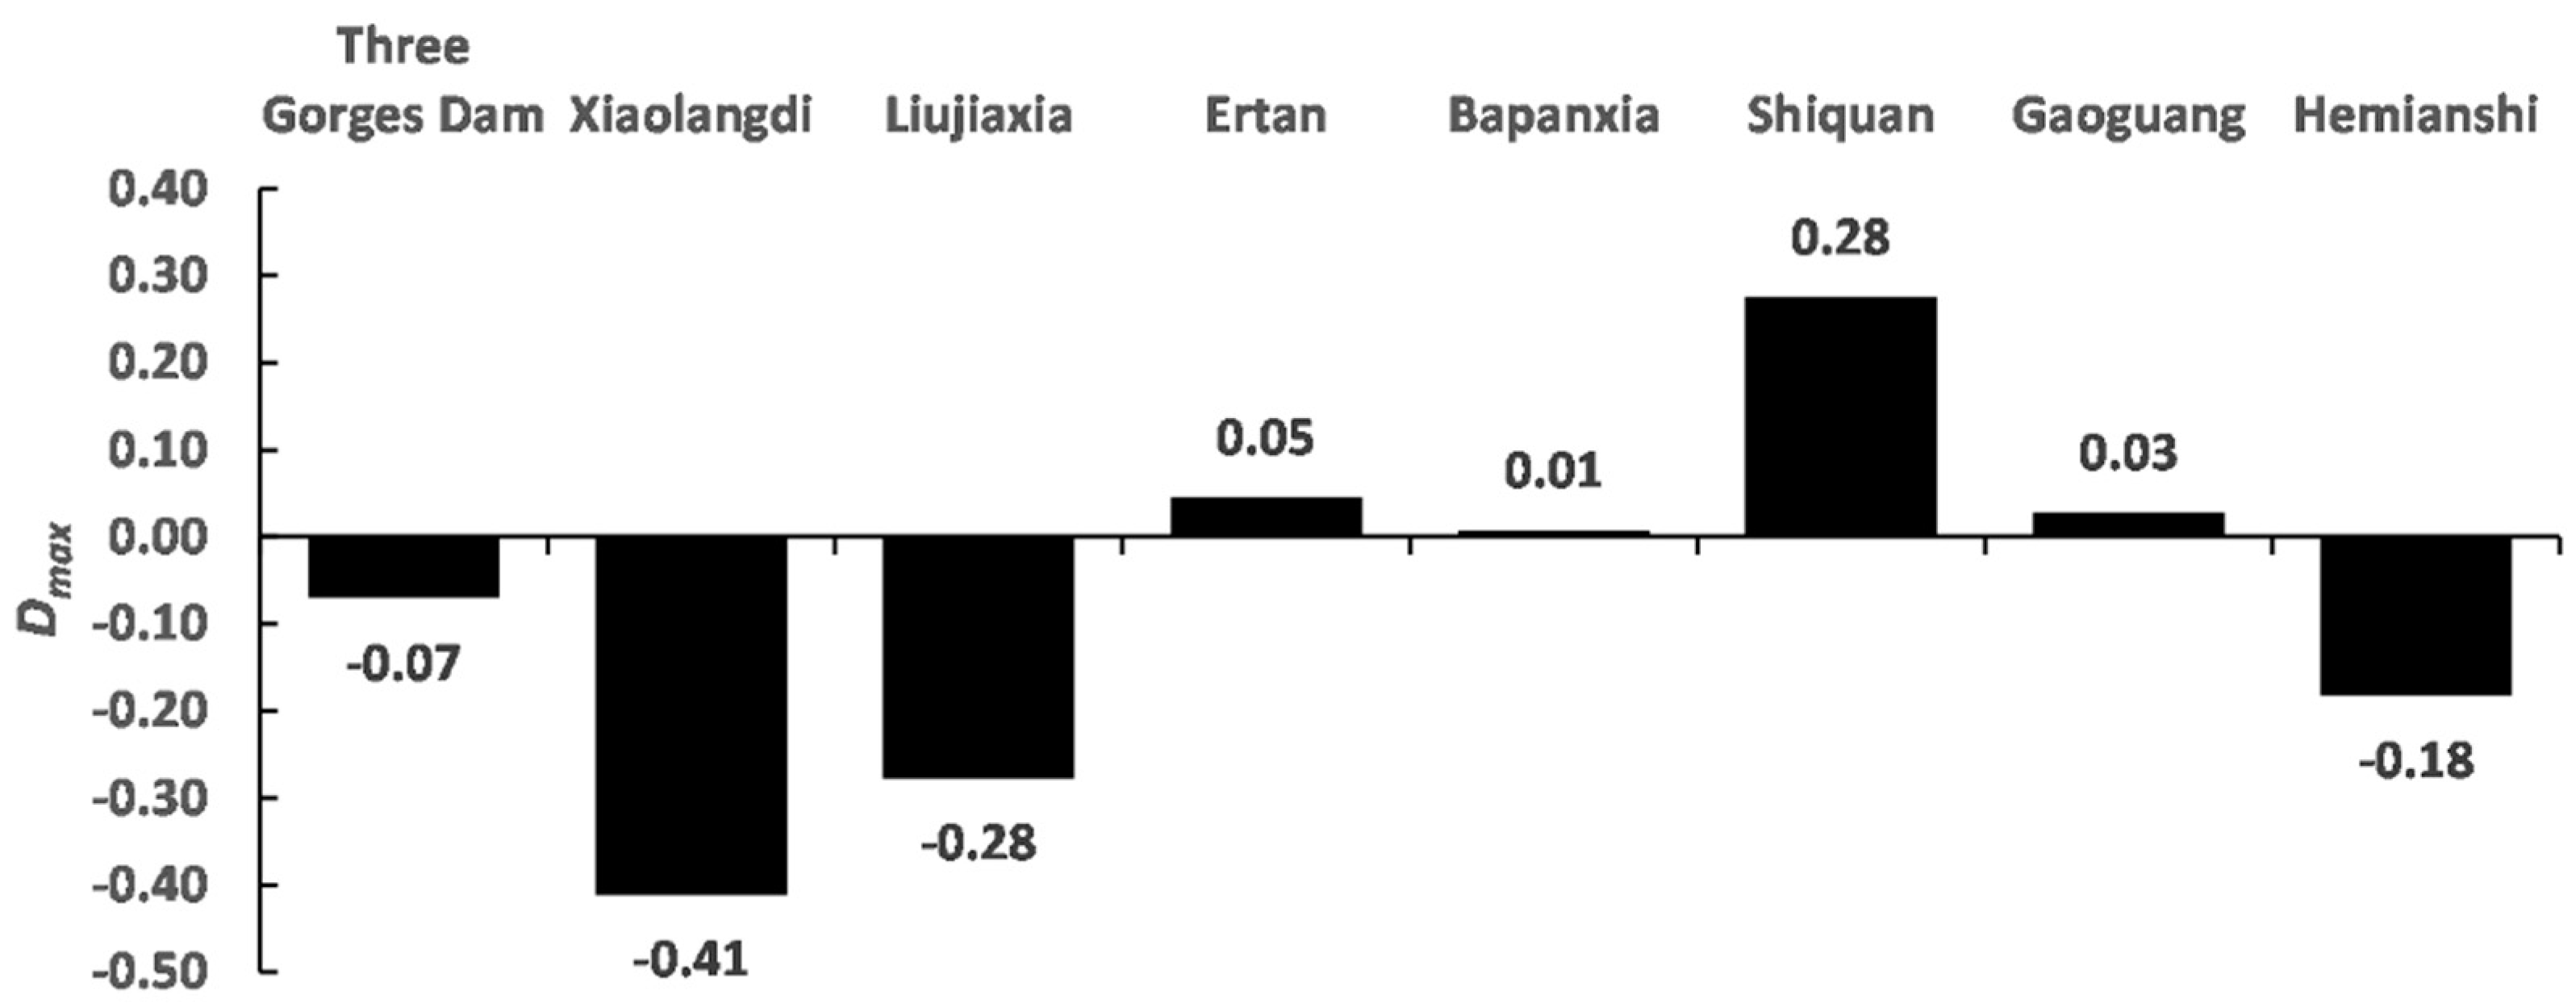
3.2.2. Range of Maximum 1-Day Flow ()
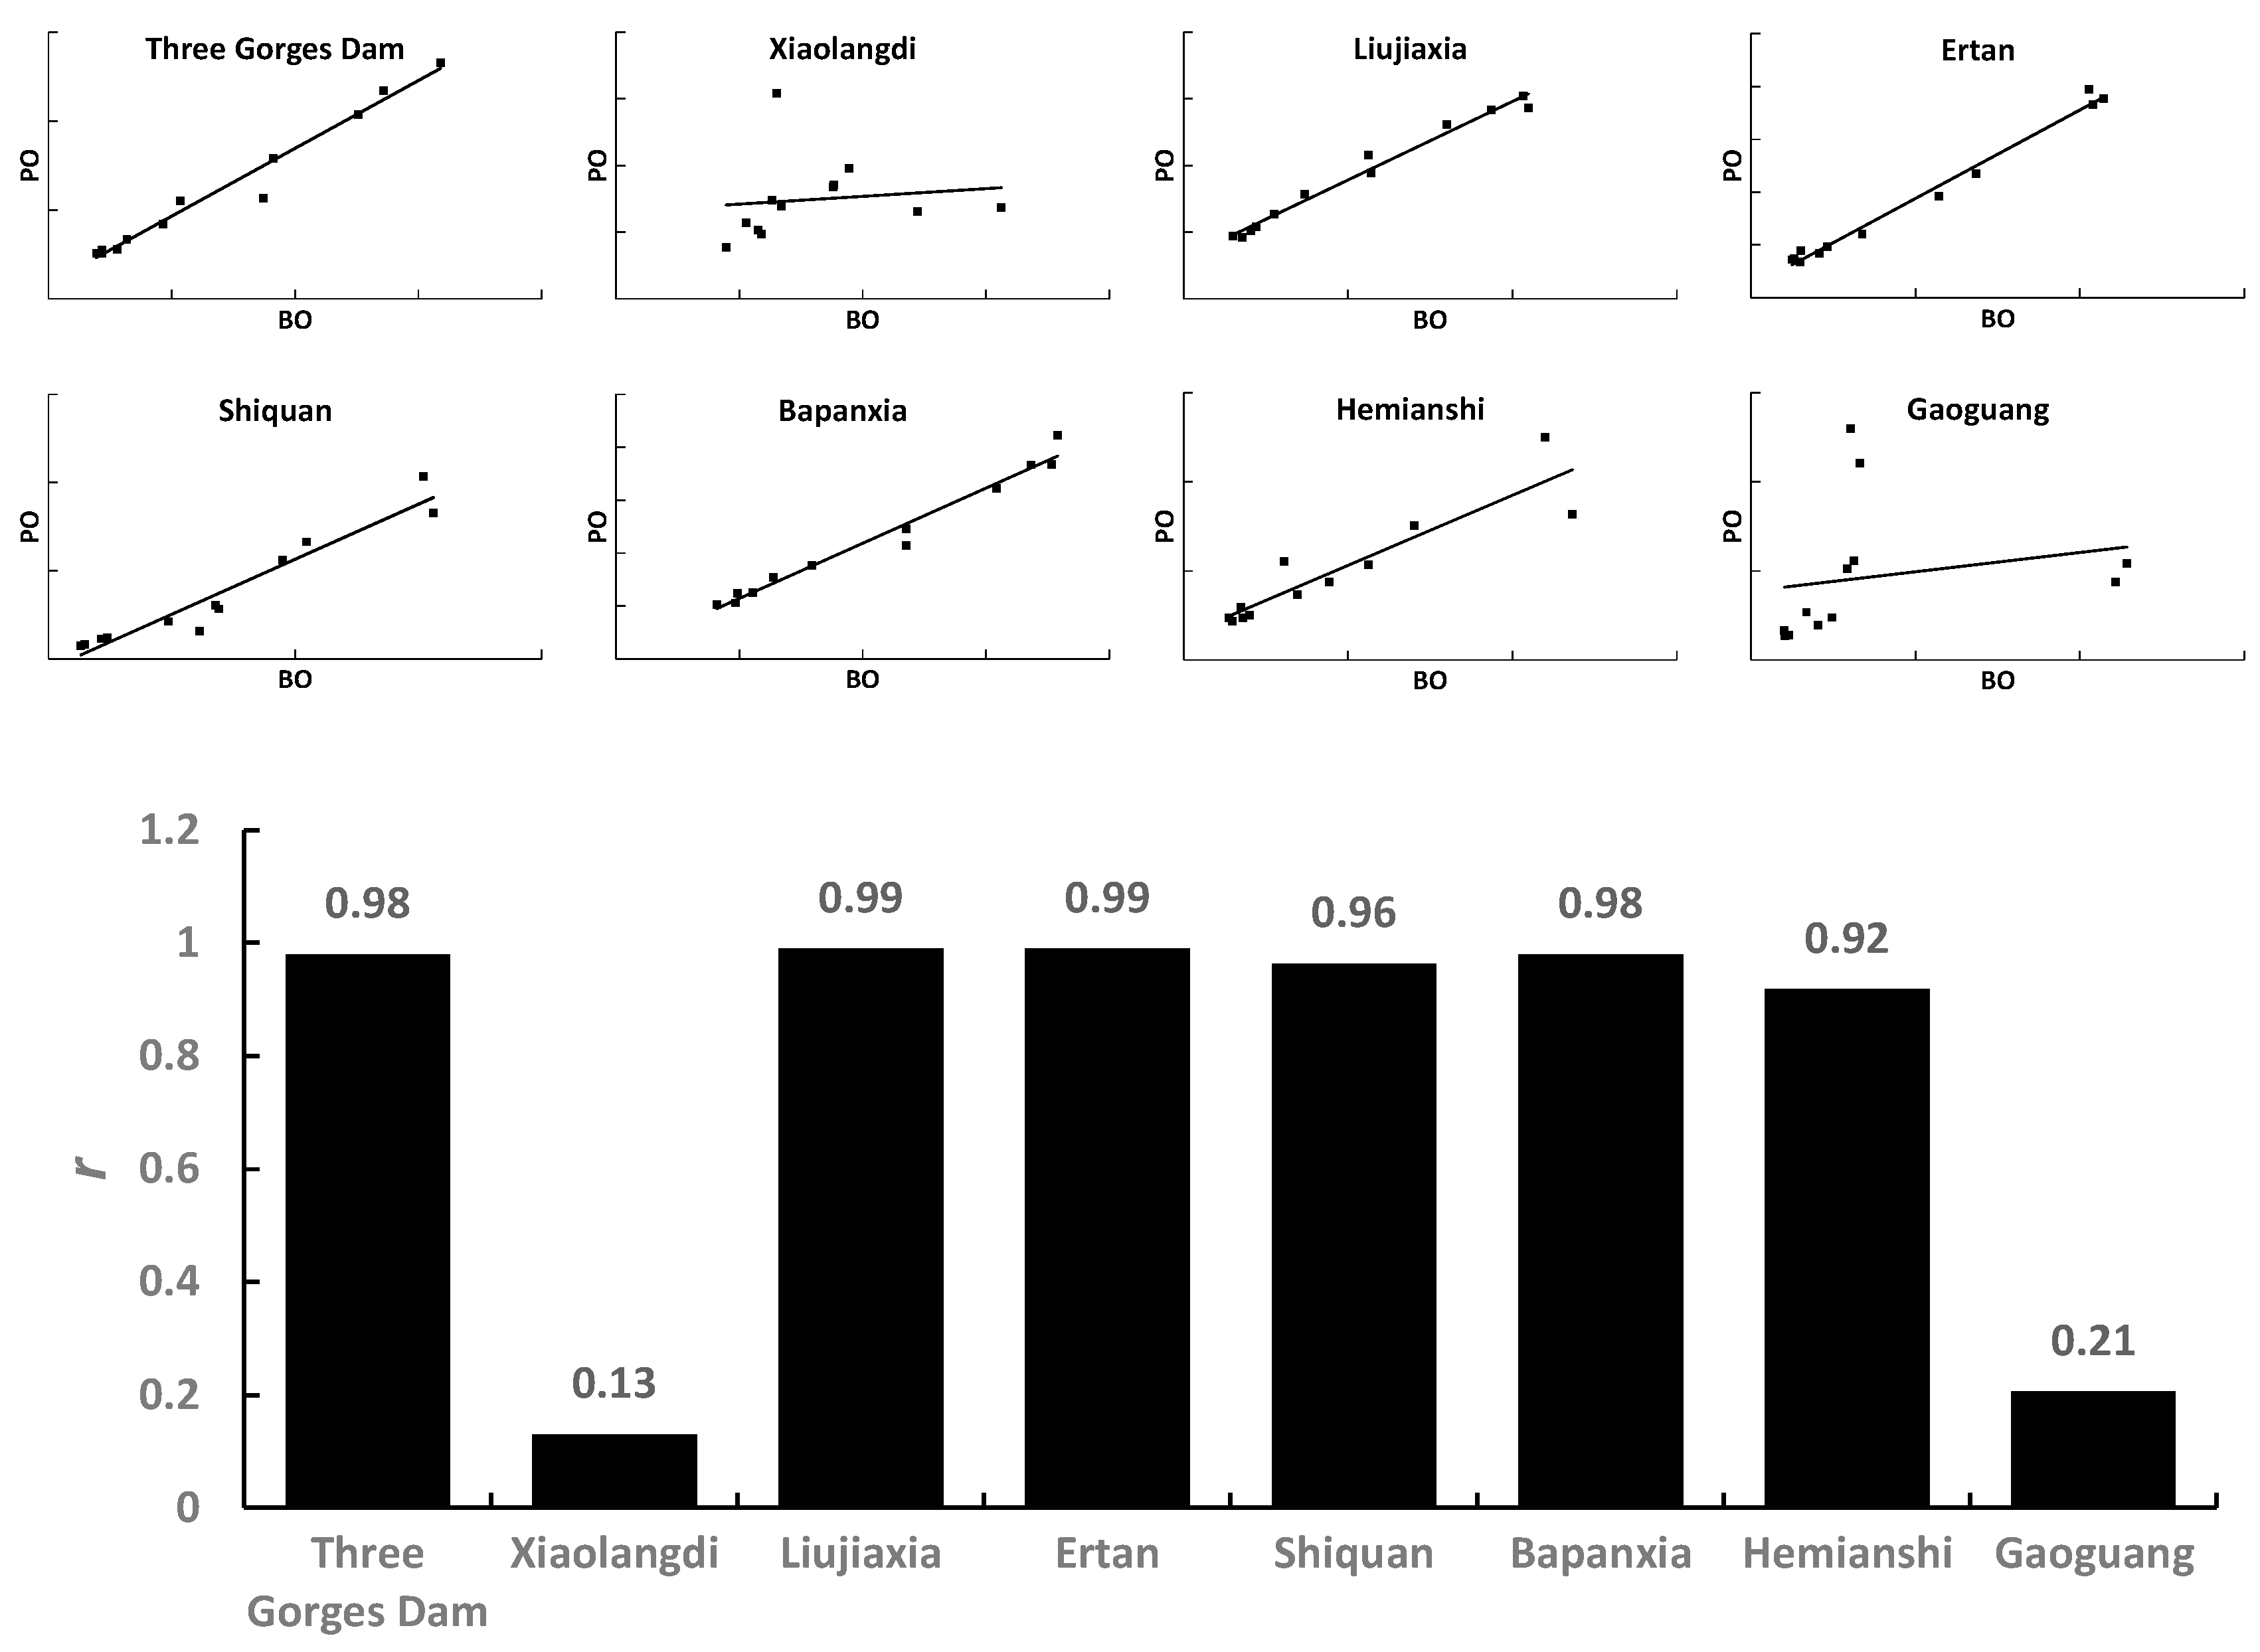
3.2.3. Range of Annual Average Flow Variability ()
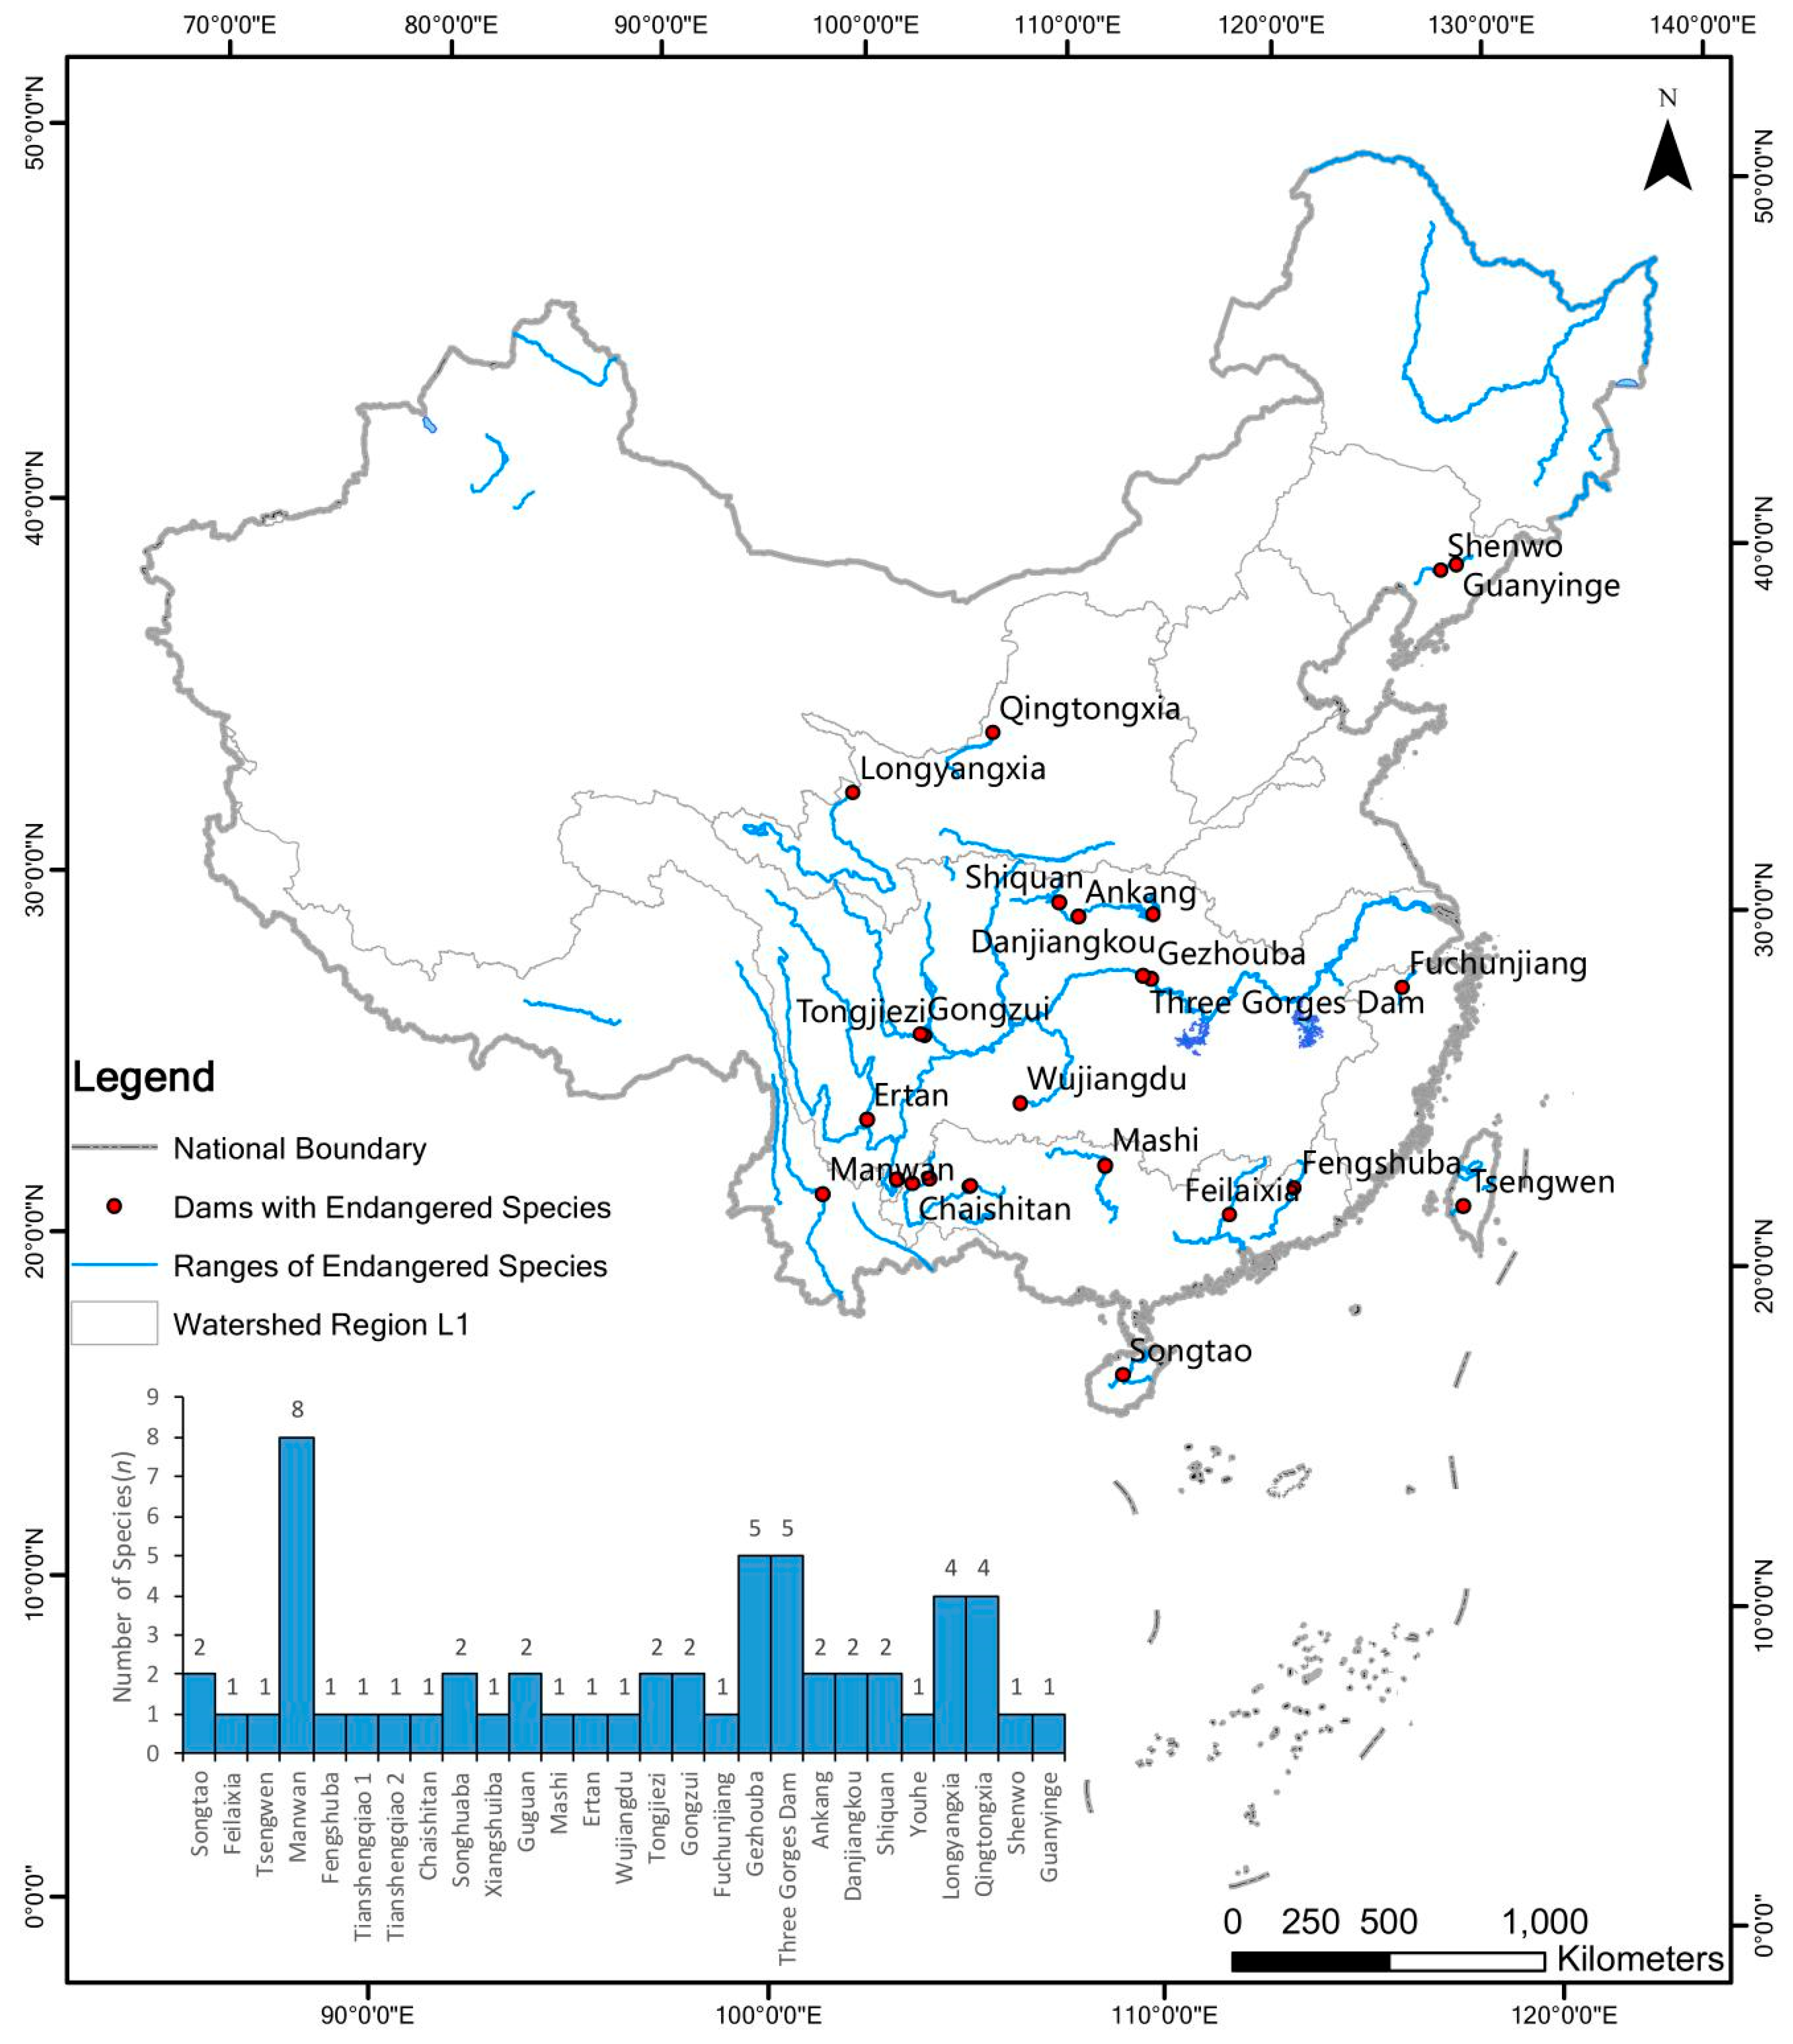
3.3. Classification of Hydrobiological Indicators
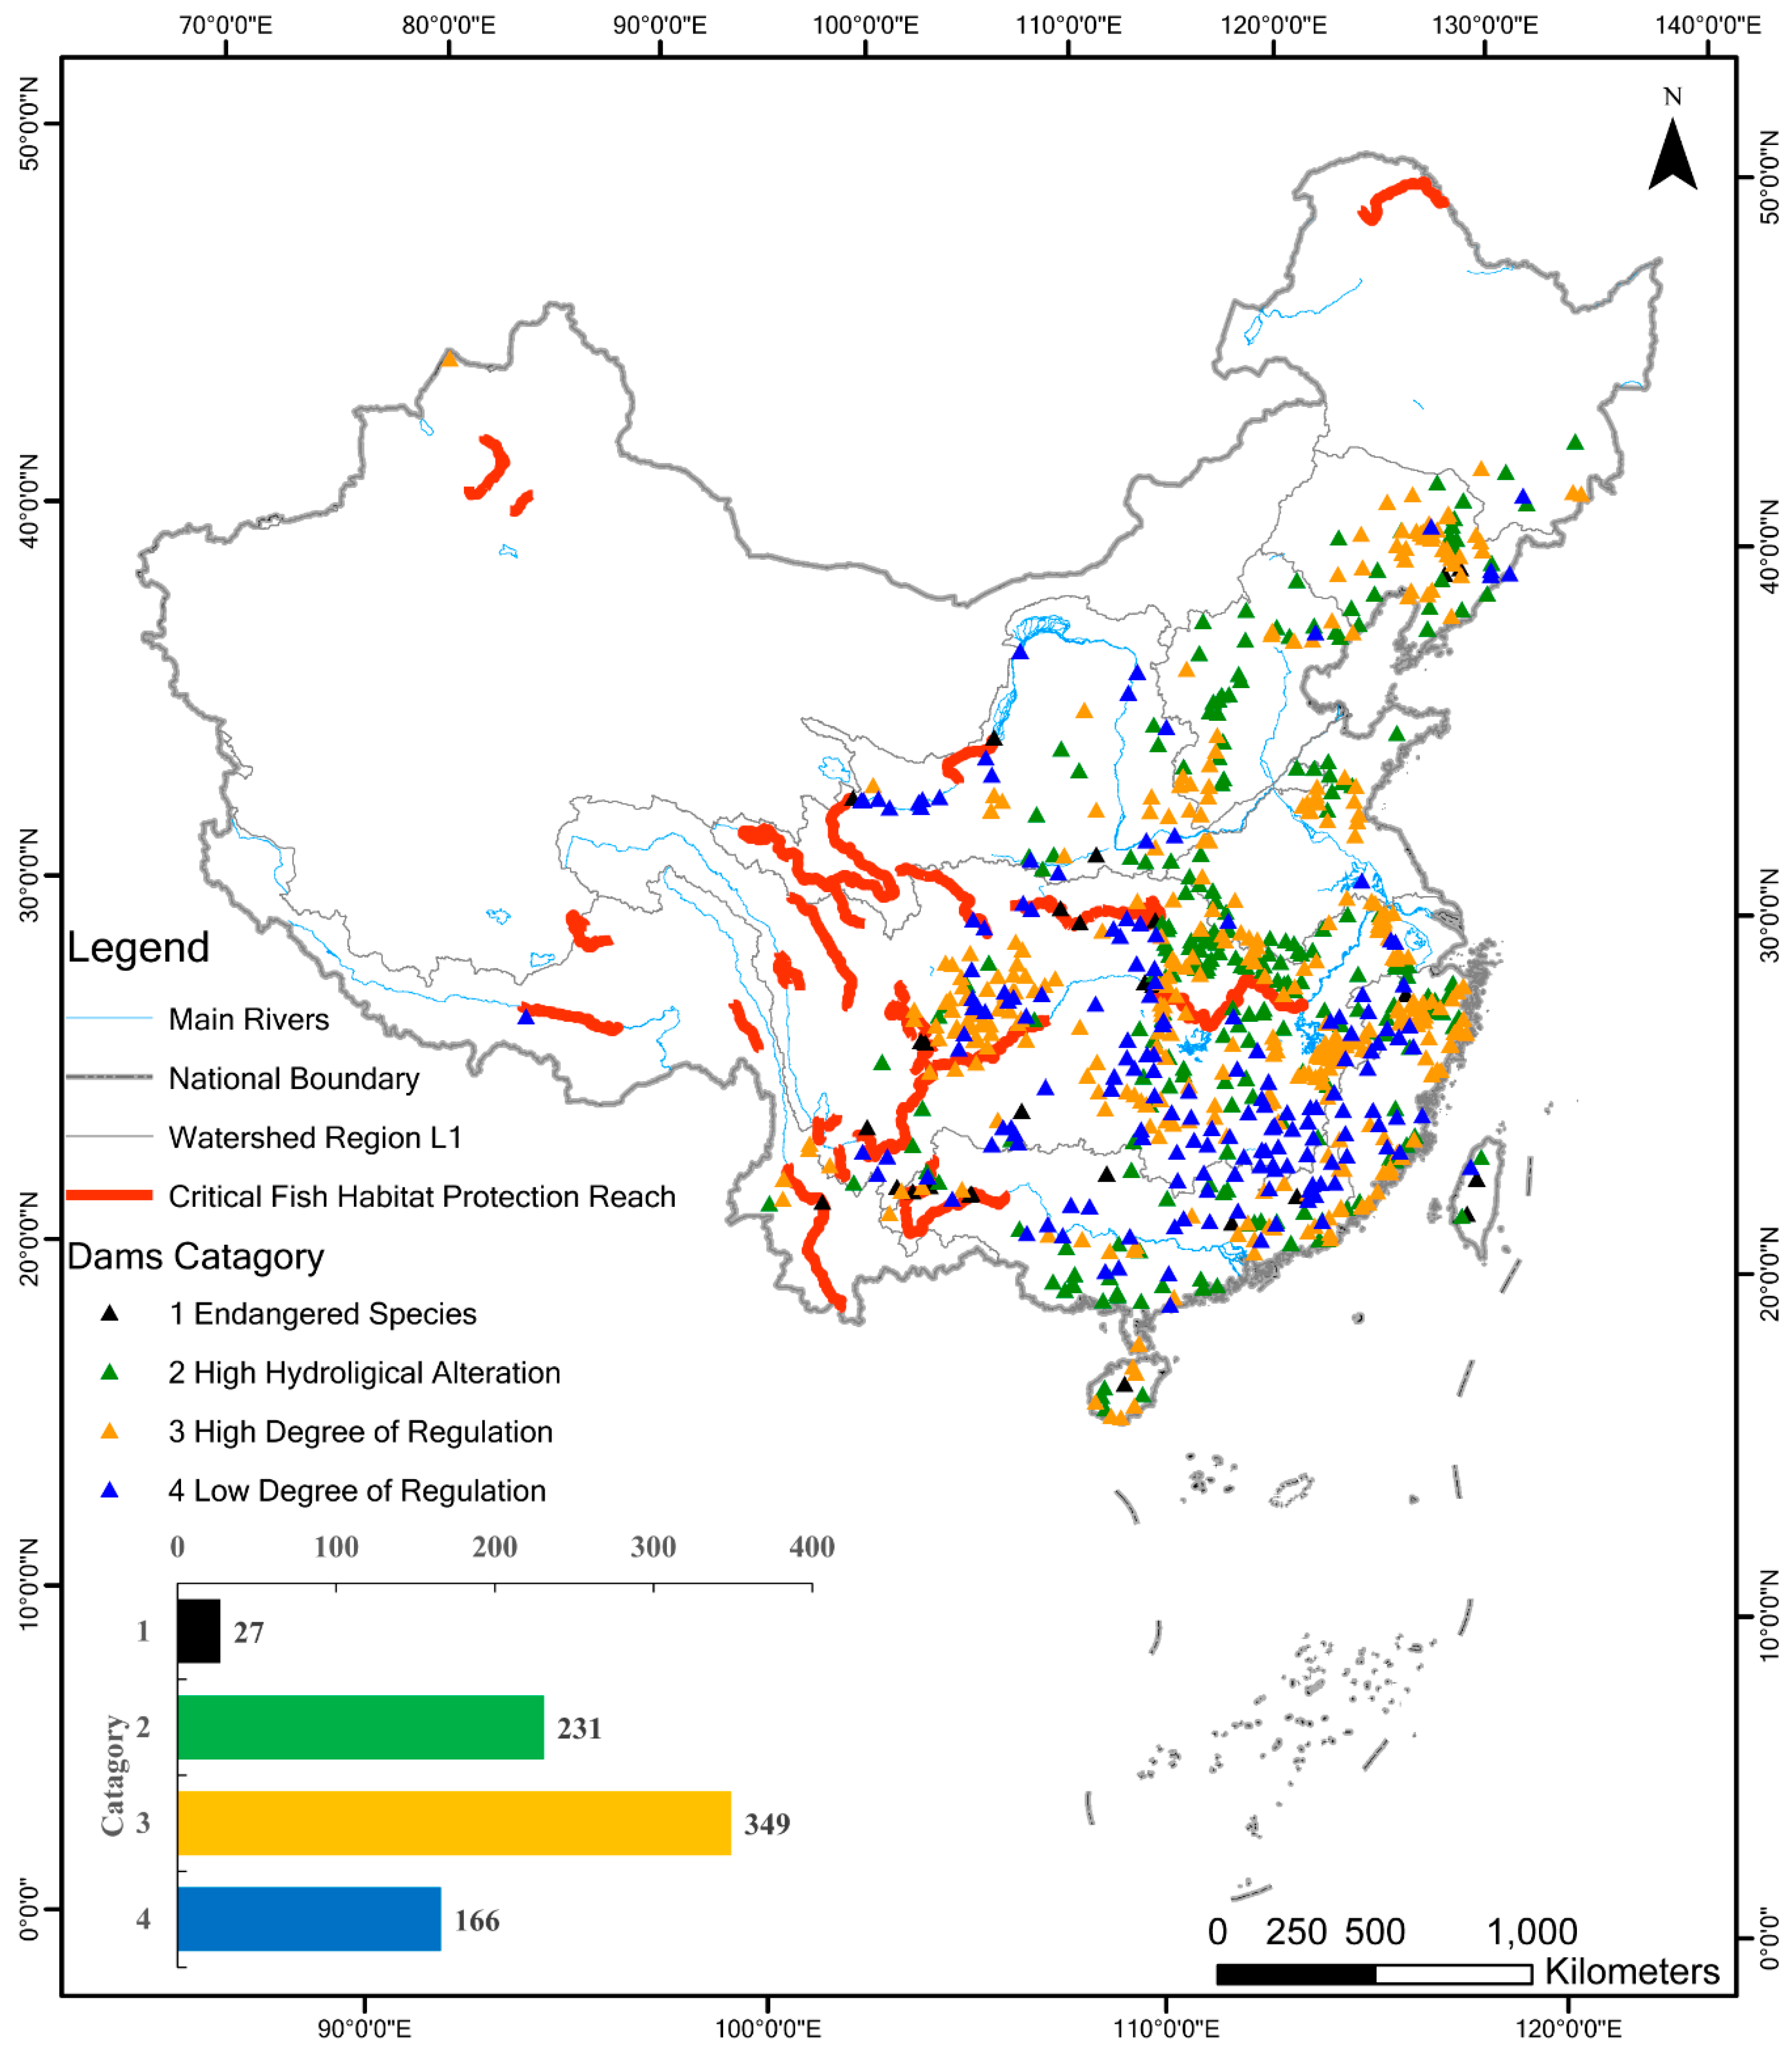
3.4. E-Flow Management Classes
4. Discussion
5. Conclusions and Recommendations
5.1. Systematic River Conservation and Habitat Restoration
5.2. E-Flow Optimizing Benefits and Cost Evaluation
5.3. E-Flow Guarantee and E-Flow Storage Capacity
5.4. Multi-Threshold Value Determination Method
5.5. Avifauna and Wetland Indicators Integration
Supplementary Materials
Author Contributions
Funding
Acknowledgments
Conflicts of Interest
References
- Berga, L.; Buil, J.M.; Bofill, E.; De Cea, J.C.; Perez, G.; Mañueco, G.; Polimon, J.; Soriano, A.; Yagüe, J. Dams and Reservoirs, Societies and Environment in the 21st Century; CRC Press: Boca Raton, FL, USA, 2006. [Google Scholar]
- Chen, A.; Wen, J.; Wu, M.; Wang, P. Review of global and China’s policies on fish passages. Water Policy 2019, 21, 708–721. [Google Scholar] [CrossRef]
- International Hydropower Association. 2018 Hydropower Status Report; International Hydropower Association: London, UK, 2018. [Google Scholar]
- World Commission on Dams. Dams and Development: A New Framework for Decision Making; World Commission on Dams: Cape Town, South Africa, 2000. [Google Scholar]
- Chen, A.; Wu, M. Managing for Sustainability: The Development of Environmental Flows Implementation in China. Water 2019, 11, 433. [Google Scholar] [CrossRef]
- Cumberlidge, N.; Peter, K.L.N.; Yeo, D.C.J.; Magalhãesc, C.; Campos, M.R.; Alvareze, F.; Naruseb, T.; Daniels, S.R.; Esser, L.J.; Attipoe, F.Y.K.; et al. Freshwater crabs and the biodiversity crisis: Importance, threats, status, and conservation challenges. Biol. Conserv. 2009, 142, 1665–1673. [Google Scholar] [CrossRef]
- Liermann, C.R.; Nilsson, C.; Robertson, J.; Ng, R.Y. Implications of Dam Obstruction for Global Freshwater Fish Diversity. BioScience 2012, 62, 539–548. [Google Scholar] [CrossRef]
- Opperman, J. The Power of Rivers: A Business Case; The Nature Conservancy: Arlington County, VA, USA, 2017. [Google Scholar]
- Arthington, A.H. Environmental Flows: Saving Rivers in the Third Millennium, 30; University of California Press: Berkeley, CA, USA, 2012. [Google Scholar]
- Richter, B.D.; Warner, A.T.; Meyer, J.L.; Lutz, K. A collaborative and adaptive process for developing environmental flow recommendations. River Res. Appl. 2006, 22, 297–318. [Google Scholar] [CrossRef]
- McManamay, R.A.; Oigbokie, C.O.; Kao, S.C.; Bevelhimer, M.S. Classification of US Hydropower Dams by their Modes of Operation. River Res. Appl. 2016, 32, 1450–1468. [Google Scholar] [CrossRef]
- Pahl-Wostl, C.; Arthington, A.; Bogardi, J.; Bunn, S.E.; Hoff, H.; Lebel, L.; Nikitina, E.; Palmer, M.; Poff, L.N.; Richards, K.; et al. Environmental flows and water governance: Managing sustainable water uses. Curr. Opin. Environ. Sustain. 2013, 5, 341–351. [Google Scholar] [CrossRef]
- Junna, W.; Dong, Z.; Liao, W.; Li, C.; Feng, S.; Luo, H.; Peng, Q. An environmental flow assessment method based on the relationships between flow and ecological response: A case study of the Three Gorges Reservoir and its downstream reach. Sci. China Technol. Sci. 2013, 6, 715–726. [Google Scholar]
- Ang, C.; Chen, S.; Miao, W.; Pengyuan, W. Recommendation on Ecological Water Demand Management in China. Sci. Technol. Rev. 2016, 22, 11. [Google Scholar]
- Ang, C.; Miao, W.; Chen, S.; Zhang, X.; Wang, P. Review of Method for Calculation of River Ecological Base-flow and Study on Its Assessment Framework. Water Resour. Hydropower Eng. 2017, 2, 97–105. [Google Scholar]
- Gillilan, D.M.; Brown, T.C. Instream Flow Protection. Restor. Ecol. 1997, 7, 100–101. [Google Scholar]
- Pittock, J.; Hartmann, J. Taking a second look: Climate change, periodic relicensing and improved management of dams. Mar. Freshw. Res. 2011, 62, 312–320. [Google Scholar] [CrossRef]
- Department of Environmental Impact Assessment State Environmental Protection Administration, P.R.C. Research and Practice of Ecological Protection for Water Resources & Hydropower Development Projects; China Environmental Science Press: Beijing, China, 2006. [Google Scholar]
- Wu, M.; Chen, A. Practice on ecological flow and adaptive management of hydropower engineering projects in China from 2001 to 2015. Water Policy 2017, 2, 336–354. [Google Scholar] [CrossRef]
- Grantham, T.E.; Viers, J.H.; Moyle, P.B. Systematic Screening of Dams for Environmental Flow Assessment and Implementation. BioScience 2014, 64, 1006–1018. [Google Scholar] [CrossRef]
- Mathews, R.; Richter, B.D. Application of the Indicators of Hydrologic Alteration Software in Environmental Flow Setting1; Blackwell Publishing Ltd.: Hoboken, NJ, USA, 2007; pp. 1400–1413. [Google Scholar]
- Chen, A.; Wu, M.; Chen, K.-Q.; Sun, Z.-Y.; Chen, S.; Wang, P.-Y. Main issues in research and practice of environmental protection for water conservancy and hydropower projects in China. Water Sci. Eng. 2016, 9, 312–323. [Google Scholar] [CrossRef]
- Gangloff, M.M. Taxonomic and ecological tradeoffs associated with small dam removals. Aquat. Conserv. Mar. Freshw. Ecosyst. 2013, 23, 475–480. [Google Scholar] [CrossRef]
- Smith, S.V.; Renwick, W.H.; Bartley, J.D.; Buddemeier, R.W. Distribution and significance of small, artificial water bodies across the United States landscape. Sci. Total Environ. 2002, 299, 21. [Google Scholar] [CrossRef]
- Günther, G.A.B.L. An index-based framework for assessing patterns and trends in river fragmentation and flow regulation by global dams at multiple scales. Environ. Res. Lett. 2015, 10, 015001. [Google Scholar]
- Batalla, R.J.; Gómez, C.M.; Kondolf, G.M. Reservoir-induced hydrological changes in the Ebro River basin (NE Spain). J. Hydrol. 2004, 290, 117–136. [Google Scholar] [CrossRef]
- Eng, K.; Carlisle, D.M.; Wolock, D.M.; Falcone, J.A. Predicting the likelihood of altered streamflows at ungauged rivers across the conterminous. USA River Res. Appl. 2013, 29, 781–791. [Google Scholar] [CrossRef]
- Alcamo, J.; Doll, P.; Henrichs, T.; Kaspar, F.; Lenhner, B.; Rosch, T.; Siebert, S. Development and testing of the WaterGAP 2 global model of water use and availability. Hydrol. Sci. J. 2003, 48, 317–337. [Google Scholar] [CrossRef]
- Lehner, B.; Verdin, K.; Jarvis, A. New Global Hydrography Derived from Spaceborne Elevation Data. Eos Trans. Am. Geophys. Union 2008, 89, 93–94. [Google Scholar] [CrossRef]
- Zhang, X.; Tang, Q.; Pan, M. A Long-Term Land Surface Hydrologic Fluxes and States Dataset for China. In Proceedings of the EGU General Assembly Conference, Vienna, Austria, 27 April–2 May 2014. [Google Scholar]
- Sanborn, S.C.; Bledsoe, B.P. Predicting streamflow regime metrics for ungauged streamsin Colorado, Washington, and Oregon. J. Hydrol. 2006, 325, 241–261. [Google Scholar] [CrossRef]
- Kennen, J.G.; Kauffman, L.J.; Ayers, M.A.; Wolock, D.M.; Colarullo, S.J. Use of an integrated flow model to estimate ecologically relevant hydrologic characteristics at stream biomonitoring sites. Ecol. Model. 2008, 211, 57–76. [Google Scholar] [CrossRef]
- Singh, V.P.; Frevert, D.K.; Singh, V.P.; Frevert, D.K. Mathematical modeling of watershed hydrology. J. Hydrol. Eng. 2002, 7, 270–292. [Google Scholar] [CrossRef]
- Wu, M.; Shi, P.; Chen, A.; Shen, C.; Wang, P. Impacts of DEM resolution and area threshold value uncertainty on the drainage network derived using SWAT. Water SA 2017, 43, 450–462. [Google Scholar] [CrossRef]
- Esselman, P.C.; Infante, D.M.; Wang, L.; Cooper, A.R.; Wieferich, D.; Tsang, Y.-P.; Thornbrugh, D.J.; Taylor, W.W. Regional fish community indicators of landscape disturbance to catchments of the conterminous. USA Ecol. Indic. 2013, 26, 163–173. [Google Scholar] [CrossRef]
- Moyle, P.B.; Katz, J.V.E.; Quiñones, R.M. Rapid decline of California’s native inland fishes: A status assessment. Biol. Conserv. 2011, 144, 2414–2423. [Google Scholar] [CrossRef]
- Carlisle, D.M.; Wolock, D.M.; Meador, M.R. Alteration of streamflow magnitudes and potential ecological consequences: A multiregional assessment. Front. Ecol. Environ. 2011, 9, 264–270. [Google Scholar] [CrossRef]
- Konrad, C.P.; Brasher, A.M.D.; May, J.T. Assessing streamflow characteristics as limiting factors on benthic invertebrate assemblages in streams across the western United States. Freshw. Biol. 2008, 53, 1983–1998. [Google Scholar] [CrossRef]
- Richter, B.D.; Davis, M.M.; Apse, C.; Konrad, C. A Presumptive Standard for Environmental Flow Protection. River Res. Appl. 2012, 28, 1312–1321. [Google Scholar] [CrossRef]
- Ministry of Water Resources, P.R.C.; National Bureau of Statistics, P.R.C. Bulletin of First National Census for Water; China Water & Power Press: Beijing, China, 2013; 20p. [Google Scholar]
- Lehner, B.; Liermann, C.R.; Revenga, C.; Vörösmarty, C.; Fekete, B.; Crouzet, P.; Döll, P.; Endejan, M.; Frenken, K.; Magome, J.; et al. High-Resolution Mapping of the World’s Reservoirs and Dams for Sustainable River-Flow Management; European Space Agency: Paris, France, 2011; Volume 9, pp. 494–502. [Google Scholar]
- Lehner, B.; Liermann, R.; Revenga, C.; Vörösmarty, C.; Fekete, B.; Crouzet, P.; Döll, P.; Endejan, M.; Frenken, K.; Magome, J.; et al. Global Reservoir and Dam Database; Version 1: Dams, Revision 01; GDW: Palisades, NY, USA, 2011. [Google Scholar]
- Lei, C. Estabilishment and Application of the Fundamental Geography Database of the Rare and Special Fish on the Upper Reaches of the Yangtze. Master’s Thesis, Huazhong Agricultural University, Wuhan, China, 2010. [Google Scholar]
- Santos, N.R.; Katz, J.V.E.; Moyle, P.B.; Viers, J.H. A programmable information system for management and analysis of aquatic species range data in California. Environ. Model. Softw. 2014, 53, 13–26. [Google Scholar] [CrossRef]
- Vorosmarty, C.J.; McIntyre, P.B.; Gessner, M.O.; Dudgeon, D.; Prusevich, A.; Green, P.; Glidden, S.; Bunn, S.E.; Sullivan, C.A.; Liermann, C.R.; et al. Global threats to human water security and river biodiversity. Nature 2010, 467, 555–561. [Google Scholar] [CrossRef]
- Syvitski, J.P.M.; Kettner, A.J.; Overeem, I.; Hutton, E.W.H.; Hannon, M.T.; Brakenridge, G.R.; Day, J.; Vörösmarty, C.; Saito, Y.; Giosan, L.; et al. Sinking deltas due to human activities. Nat. Geosci. 2009, 2, 681. [Google Scholar] [CrossRef]
- Grill, G.; Ouellet Dallaire, C.; Fluet Chouinard, E.; Sindorf, N.; Lehner, B. Development of new indicators to evaluate river fragmentation and flow regulation at large scales: A case study for the Mekong River Basin. Ecol. Indic. 2014, 45, 148–159. [Google Scholar] [CrossRef]
- Chen, A.; Sui, X.; Wang, D.; Liao, W.; Ge, H.; Tao, J. Landscape and avifauna changes as an indicator of Yellow River Delta Wetland restoration. Ecol. Eng. 2016, 86, 162–173. [Google Scholar] [CrossRef]
- Jin, C.; Li, Q. Assessment of eco-operation effect of Three Gorges Reservoir during trial run period. J. Yangtze River Sci. Res. Inst. 2015, 32, 1–6. [Google Scholar]
- Erfani, T.; Binions, O.; Harou, J.J. Protecting environmental flows through enhanced water licensing and water markets. Hydrol. Earth Syst. Sci. 2015, 19, 675–689. [Google Scholar] [CrossRef]
- Harwood, A.; Johnson, J.; Richter, B.; Locke, A.; Yu, X.; Tickner, D. Listen to the River: Lessons from a Global Review of Environmental Flow Success Stories; WWF-UK: Woking, Surrey, UK, 2017. [Google Scholar]
- Meitzen, K.M. Stream flow changes across North Carolina (USA) 1955–2012 with implications for environmental flow management. Geomorphology 2016, 252, 171–184. [Google Scholar] [CrossRef]
- Steinfeld, C.M.M.; Kingsford, R.T.; Webster, E.C.; Sharma, A. A simulation tool for managing environmental flows in regulated rivers. Environ. Model. Softw. 2015, 73, 117–132. [Google Scholar] [CrossRef]
- Summers, M.F.; Holman, I.P.; Grabowski, R.C. Adaptive management of river flows in Europe: A transferable framework for implementation. J. Hydrol. 2015, 531, 696–705. [Google Scholar] [CrossRef]
- Alcázar, J.; Palau, A. Establishing environmental flow regimes in a Mediterranean watershed based on a regional classification. J. Hydrol. 2010, 388, 41–51. [Google Scholar] [CrossRef]
- Chen, A.; Wu, M.; Wu, S.-N.; Sui, X.; Wen, J.-Y.; Wang, P.-Y.; Cheng, L.; Lanza, G.R.; Liu, C.-N.; Jia, W.-L. Bridging gaps between environmental flows theory and practices in China. Water Sci. Eng. 2019. [Google Scholar] [CrossRef]


| Category | Indicators | Criteria |
|---|---|---|
| Dam properties | Dam height | ≥1.8 m |
| Reservoir storage capacity | ≥1 billion m3 | |
| The degree of regulation | ≥0.02 | |
| Hydrological alteration | The range of monthly average flow variability | ≥0.5 |
| The range of maximum 1-day flow variability | ≥0.5 | |
| The range of annual average flow variability | ≥0.75 | |
| Hydrobiological characteristics | The quantity of rare and endangered fish species | > 0 |
| The protection class of rare and endangered fish species | Protection Class: I Protection Class: II | |
| The endangered category of rare and endangered fish species | Critically Endangered (CR) and Endangered (EN) included, Vulnerable (VU) considered. |
| No. | Dam Name | 1st Priority Development Target | Regulation Performance | Operation Time | Observed Flow Data |
|---|---|---|---|---|---|
| 1 | Three Gorges | Flood control | Incomplete seasonal flow regulation | 2003 | 1982–2014 |
| 2 | Xiaolangdi | Flood control | Incomplete annual flow regulation | 2002 | 1987–2014 |
| 3 | Liujiaxia | Hydroelectricity | Incomplete annual flow regulation | 1968 | 1956–1986 |
| 4 | Er’tan | Hydroelectricity | Seasonal flow regulation | 2000 | 1953–2012 |
| 5 | Shiquan | Hydroelectricity | Incomplete seasonal flow regulation | 1973 | 1956–1986 |
| 6 | Bapanxia | Hydroelectricity | Daily flow regulation | 1975 | 1967–1987 |
| 7 | Hemianshi | Irrigation | Incomplete seasonal flow regulation | 1974 | 1956–1984 |
| 8 | Gaoguang | Irrigation | Incomplete seasonal flow regulation | 1973 | 1970–1987 |
© 2019 by the authors. Licensee MDPI, Basel, Switzerland. This article is an open access article distributed under the terms and conditions of the Creative Commons Attribution (CC BY) license (http://creativecommons.org/licenses/by/4.0/).
Share and Cite
Chen, A.; Wu, M.; McClain, M.E. Classifying Dams for Environmental Flow Implementation in China. Sustainability 2020, 12, 107. https://doi.org/10.3390/su12010107
Chen A, Wu M, McClain ME. Classifying Dams for Environmental Flow Implementation in China. Sustainability. 2020; 12(1):107. https://doi.org/10.3390/su12010107
Chicago/Turabian StyleChen, Ang, Miao Wu, and Michael E. McClain. 2020. "Classifying Dams for Environmental Flow Implementation in China" Sustainability 12, no. 1: 107. https://doi.org/10.3390/su12010107
APA StyleChen, A., Wu, M., & McClain, M. E. (2020). Classifying Dams for Environmental Flow Implementation in China. Sustainability, 12(1), 107. https://doi.org/10.3390/su12010107