1. Introduction
The year of 2011 was special for urbanization in China. The rate of the urban population in the country reached 51.27% which was the first time that the urban population exceeded the rural population [
1]. Considering the great development of economic and city construction since the Reform and Opening, the urbanization in China is a marvelous miracle. As the largest developing country in the world, China has experienced rapid economic growth and urbanization in recent decades. The country’s total number of cities increased from 193 in 1978 to 660 in 2008, and its urban population rapidly increased from 172.45 million to 606.67 million [
2]. The remarkable success of China’s urbanization is reflected in about half a billion people who moved from rural to urban areas, seeking work in manufacturing and lifting half a billion people out of poverty. Meanwhile, China’s urbanization has largely avoided the social ills encountered in other countries’ urbanization, such as rising unemployment, slums, and congestion [
3].
In the greatest urbanization process, there are still many problems waiting to be solved. The most obvious one is that land urbanization occurs faster than population urbanization [
3,
4,
5]. Urban expansion in China has drawn plenty of scholarly attention [
6,
7]. In our research, land urbanization refers to the expansion of urban land, a large amount of rural land has transformed into urban land, and urban built-up areas have rapidly expanded. Population urbanization is defined as the gradual transfer of the population from rural areas to cities. From 2001 to 2012, the urban land in China increased from 24,000 km
2 to 46,000 km
2 [
8]. However, while the rate of urban land expansion reaches 6.2% per year, the rate of urban population expansion is only 3.6% per year. This form of urbanization is a false urbanization which is unsustainable. Urbanization means a change of rural lifestyles into urban ones [
9,
10,
11], not just the expansion of urban land.
In the history of urbanization in developed Western countries, a strong market environment is a common background. Beginning with the industrial revolution, those countries entered the process of urbanization and achieved simultaneous improvement in urbanization level and quality. It is a typical market-oriented urbanization development model. However, the cities in many developing countries have never really achieved significant industrialization [
12]. A key driver of China’s success is the decentralized fiscal system which encourages local governments to compete for resources between cities [
13,
14,
15]. Due to the specific conditions of China’s household registration system and land ownership system, the urbanization pattern in China is dominated by the governments. Local officials’ actions play a crucial role in the development of urbanization.
In this article, we focus on a prominent issue in the development of urbanization in China, which is that land urbanization occurs faster than population urbanization. We try to analyze the reasons why land urbanization in China is faster than population urbanization from the perspective of fiscal relations between the central government and local government, especially the impact of fiscal revenue distribution methods on urbanization patterns. We employ panel data of 30 provinces and autonomous regions in China from 2000 to 2012 to study the impact of fiscal incentives on local urbanization. Our regression results show that both the local tax revenue and fiscal self-financing rate have a significantly negative effect on the gap between land urbanization and population urbanization. The larger the proportion of business tax, the smaller the gap, and vice versa for value-added tax. The greater the local governments’ tax losses, the greater the degree of gap. The remaining part of this article is organized as follows:
Section 2 introduces the theoretical background,
Section 3 is the methodology of empirical analysis,
Section 4 is the regression results analysis, and
Section 5 is the conclusion.
2. Theoretical Background
The literature related to urbanization is primarily about why cities form and develop. The theoretical basis can date back to Marshall and Jacobs [
16,
17], who put forward the concept of externalities of scale. In a country that shifts from being predominantly agricultural to manufacturing and service industries, the latter’s external economies of scale will attract firms and labor to the cities [
18,
19,
20,
21]. The classical literature on labor transfer is a dual economy model [
22,
23]. In such models, differences in productivity between rural and urban areas are exogenous, while migration decisions are affected by migration costs, minimum wages, and urban–rural differences. In addition, the famous core-periphery model [
24] outlines the conditions under which manufacturing and population will be concentrated in one area rather than being dispersed in many areas.
Regarding the determinants of urbanization, an empirical research based on state-level cross-sectional data of India suggests that the level of industrialization has a positive effect, the density of crop planting has a negative impact, and the level of economic development represented by the average wage has no significant effect [
25]. Moomaw and Shatter [
26] added more independent variables to the econometric model, including gross domestic product (GDP) per capita, level of industrialization, export orientation, foreign aid, and political factors, and discussed the impact of these variables on the urbanization rate and urban concentration. Using cross-country panel data, Henderson [
21] uses generalized method of moments (GMM) with instrumental variables to analyze the impact of GDP growth and urban concentration on urbanization rates. He found that there was a significant positive correlation between urban concentration and urbanization rate. Based on the data of urbanization and economic growth in 229 countries around the world from 1950 to 2010, Wan et al. [
27] found that economic growth, non-agricultural industries (secondary and tertiary industries as a share of GDP), and human capital (adult years of schooling) are the key determinants of urbanization.
The process of urbanization can be divided into several stages [
9,
28,
29]. The urbanization stages are defined according to the combined growth and decline of the urban center and the urban fringe area [
30]. The first stage is called ‘urbanization’, which predominately emerged in the 1950s. It consists of the concentration of the population as they move into cities; some have conceived of urbanization as the increasing area of land being developed for urban use, while others think of urbanization as a social process of people associated with life in cities [
9]. Suburbanization is the second stage, which mainly occurred in the 1960s not only in America but also widely across Western Europe [
31]. Suburbanization means that while the urban population is still increasing, the population of the inner city has moved to the urban fringe zone. In many countries, the proportion of the population living in rings rose during the 1960s after losing ground to the cores [
32]. Suburbanization has also increased in Poland since the 1990s. The declining quality of urban cores and lower real estate prices were reasons for suburbanization in Poland [
33,
34]. The third stage is referred to as ‘counterurbanization’ or ‘disurbanization’, which emerged in the 1970s. Counterurbanization can be seen as a period of transition as the relationship switches from a positive urbanization correlation. It is a situation in which the net migratory growth rate of a place is inversely related to its size and urban status [
28,
35]. The last stage is ‘reurbanization’ with the recovery of larger cities. The stages of urban development models suggest that the reurbanization stage has not been proven yet [
9]. Klaassen and Scimeni [
36] think that reurbanization is one of continuous urban population decline and only towards the end of it is the core meant to move into absolute population growth. Cheshire [
37] found the proportion of population growth in urban cores recovered in Northern Europe. China’s current urbanization is still in the first stage of urbanization development, that is, the population is moving towards cities. On the one hand, it is because China’s urbanization has just exceeded 50%, and there is still much room for growth. On the other hand, urbanization in China lags behind industrialization. Urban density is lower than other countries and the agglomeration effect has not been fully utilized. What we are studying is the stage when the population moves to urban cores, with land expansion occurring faster than the concentration of the population.
China’s urbanization differs from other countries because urbanization in China is led by the government rather than the market. There are two distinctive systems in China: the household registration system and the land public ownership system. The household registration system in China is not only a supplementary administrative measure, but also a social control tool with both economic and political functions [
38]. Due to the income gap between urban and rural areas, urban residents can enjoy higher-quality public services and a more complete social security system. Urban household registration is a system that binds various interests [
39]. The interests attached to urban registration mean an increase in local government expenditures. In order to reduce fiscal expenditures, local governments impose stringent controls on urban registration [
40,
41]. A stricter household registration system is implemented in large cities, which to a certain extent restricts labor migration from rural areas to cities. In contrast, Chinese local governments are keen to expand the boundaries of cities [
41,
42,
43,
44]. The urban land belongs to the state in China, while the rural land belongs to collective ownership. The process of urbanization is accompanied by the change of the land ownership, and the land required for the city expansion basically comes from the rural collective land. However, the rural land must be acquired by the government, so that it can be converted into urban land for development and transfer. In the primary land market, the government has a monopoly position, and land acquisition is a link that must be taken to change the nature of agricultural land use. By this way, the collectively-owned land becomes state-owned land. The government will transfer the expropriated land to industrial enterprises or real estate developers and obtain a high land transfer fee to increase their revenue. In 2013, the revenue from land transfers exceeded 670 billion dollars, accounting for 7.25% of the GDP, and 31.94% of the fiscal revenue.
Therefore, the urbanization of land is the primary choice of local governments in China to promote urbanization. The rapid urban expansion has aroused the concern of many scholars, and related studies show that urbanization of land in China is mainly driven by economic growth and population growth [
45,
46,
47,
48,
49,
50,
51]. However, all these studies ignore the impact of fiscal incentives on the behavior of local governments. In fact, fiscal incentives can affect the mode of local government to promote urbanization.
The tax-sharing reform conducted by the Chinese government in 1994 has been a great reform in the fiscal field for the past 30 years. In this reform, there has been no major change in the scope of fiscal expenditures between the central and local governments. Most of the fiscal expenditures are still undertaken by local governments. The emphasis of the reform is the classification of taxes between the central and local governments. The central government has expanded the share of sharing tax, thus 75% of the value-added tax which is the largest tax in China is turned over to the central government. As a result of the income tax reform in 2002, local governments lost 60% of their income tax revenue. Therefore, business tax becomes the main income source of local governments. Tax revenue could not satisfy the expenditure needs of local governments, so the local governments began to actively seek extra budgetary income [
52,
53]. In the context of an agglomeration of various production factors into the cities, land has become a scarce resource for economic development, and an important way for local governments to increase their fiscal revenue. The Land Administration Law promulgated in 1998 gives local governments authority to acquire, develop, and transfer agricultural land. In the same year, the distribution of housing in cities and towns was terminated, and monetization of housing was gradually implemented. All these conditions provided an opportunity for local governments to store urban construction land and expand urban space, as well as increase fiscal revenue.
As a result of the fiscal incentive, local governments benefit three ways by choosing land urbanization: First, the land requisitioned by the local government is sold in the second-level land market through the form of bidding, auction, and hanging, which can obtain a huge amount of land-leasing income [
54]. Second, developing the construction industry and real estate industry vigorously can increase the revenue from business tax, which is retained by local governments. At the same time, it will drive up the tax revenue related to property tax, deed tax, urban land use tax, and land appreciation tax. Thirdly, the local officials attract enterprises to invest locally by transferring a large amount of industrial land to enterprises at a low-cost, which will bring about value-added tax.
3. Research Design
Land urbanization means the expansion of urban space and urban areas. According to the existing literature [
4,
44,
55], we use the built-up area of the city to represent urban space. Then the speed of land urbanization means the growth rate of the urban built-up area. Population urbanization is represented by the proportion of the urban population to the total population at the end of the year. In order to correspond with the speed of land urbanization, the speed of population urbanization is expressed by the growth rate of the urban population. The gap between land urbanization and population urbanization equals the speed of land urbanization minus the speed of urbanization of the population. The gap between the two types of urbanization is the focus of our investigation.
We use the balance panel data of 30 provinces in 2000–2012 (excluding the Tibet Autonomous Region) from the China Statistical Yearbook. China Statistical Yearbook is published by the National Bureau of Statistics and is a comprehensive reflection of the economic and social development of China. We refer to the China Statistical Yearbook from 2001 to 2013 (China Statistical Yearbook 2001 reflects the data in 2000). According to the average data of 13 years in the whole country (excluding the Tibet Autonomous Region), the speed of land urbanization was 6.1% and the speed of population urbanization was 3.8%, with a gap of 2.3% between the two (
Table 1). Accordingly, the speed of land urbanization was 1.6 times that of population urbanization. In terms of the rate of land urbanization in the past years, there were several fluctuations. Among them, the speed of land urbanization in China reached the fastest rate at 9.4% in 2003, probably due to the income tax sharing reform; starting in 2002, local governments were encouraged to share income tax revenue with the central government. So, local governments needed speed up the pace of land sales to get extra budgetary income.
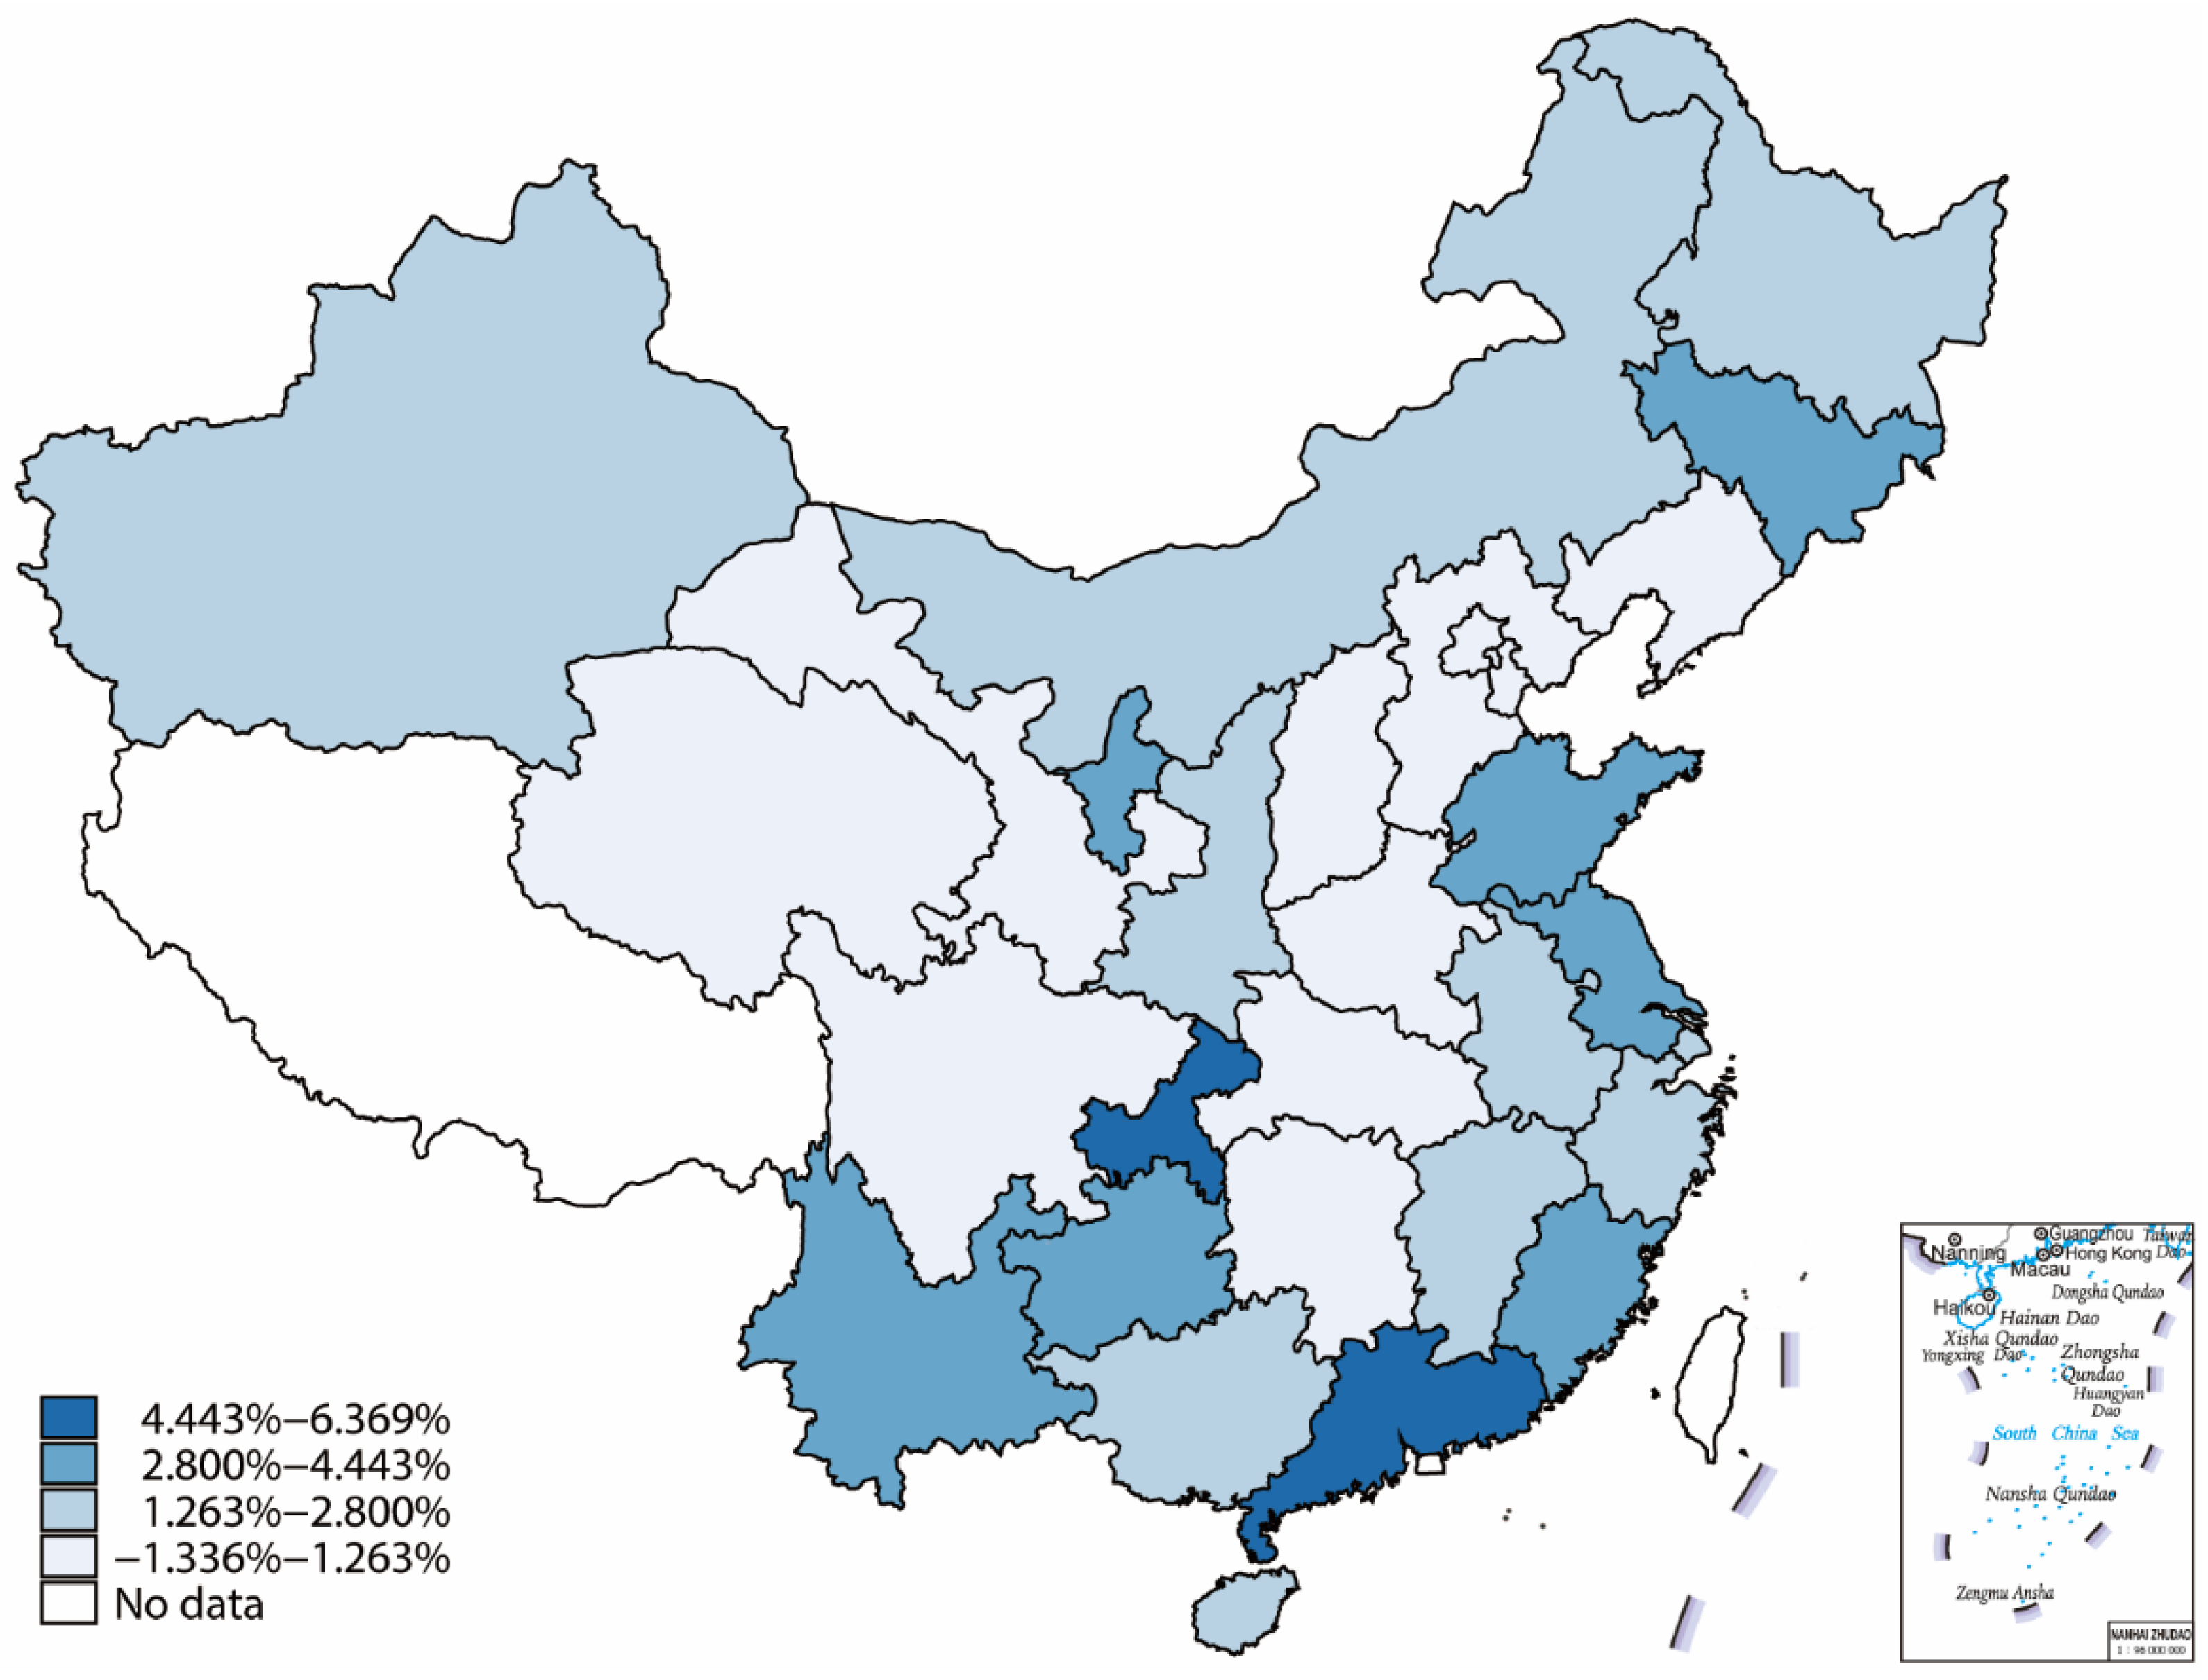
The urbanization development in different regions of China is quite different.
Figure 1 shows the extent to which the annual increase rate of land urbanization in each province from 2000 to 2012 exceeded the average annual growth rate of the population. The province with the fastest average annual growth rate of land urbanization in comparison to the average annual growth rate of population urbanization was Chongqing, followed by Guangdong. Overall, the population urbanization and land urbanization speeds were quite different in the eastern and western regions.
In order to examine the impact of fiscal incentive on the gap between land urbanization and population urbanization in the region, we set up a fixed effect model based on provincial panel data.
In the model above, represents the gap between land urbanization and population urbanization in province i and year t. represents the lagged fiscal variable in province i, as land urbanization and population urbanization may affect the fiscal variable in the same year. Using the lagged explanatory variable can resolve possible endogenous problems. represents variables that control some macroeconomic characteristics of the province, including the logarithm of per capita GDP, the logarithm of fixed investment, and the added value of secondary industry as a percentage of GDP. indicates the individual effect, and intrinsic geographical and cultural factors in the region that do not change with time, and indicates the year effect, which represents factors such as the policies promulgated by the central government each year that do not vary with the individual. is the error term.
4. Research Results
This part of the article presents the research results of the assessment of fiscal factor on different style urbanization. Firstly, we examine the impact of fiscal revenue on the general budget of local governments on the gap between land urbanization and population urbanization. The estimated results are shown in
Table 2.
Column 1 of
Table 2 shows the effect of the lagged general budgetary revenue of local governments on the gap between land urbanization and population urbanization, with a coefficient of −0.111 and a significantly negative effect at 5%. It shows that the more financial revenue in the region’s general budgets in the previous year, the less the gap between land urbanization and population urbanization in the region. The reason is that, if the local governments received more fiscal revenue in the previous year, the incentive to sell the land was weaker, and the speed of land urbanization would slow down. The results of column 2 and column 3 indicate that the lagged fiscal revenue of the local government had a significantly negative impact on the speed of land urbanization, but no significant effect on the speed of population urbanization. Fiscal revenue mainly affects land urbanization, because land urbanization can increase the revenue of local governments by transferring the rural land into urban land.
Among the control variables, the investment in fixed asset increased the speed of land urbanization. Per capita GDP had a positive impact on the population urbanization, as a large number of migrants flowed to the eastern cities in China with higher per capital GDP. The added value of the secondary industry as a percentage of GDP had a significantly positive impact on the land urbanization, but a significantly negative impact on population urbanization. This shows that the development of the secondary industry is more closely linked to land urbanization.
We then chose value-added tax and business tax to conduct separate studies on the tax categories. There was a clear difference between the two taxes. The business tax is a local tax, which accounts for the largest proportion of the local government’s tax revenue. The value-added tax is a sharing-tax, so 75% belongs to the central government and 25% belongs to the local government. Moreover, the value-added tax is levied by the national administration of taxation. The business tax applies to the construction industry and real estate industry, while the value-added tax is mainly levied on the manufacturing industry. So, local governments actively seek to improve the development of the construction industry to obtain enough business tax by selling more land to construction enterprises.
In order to investigate the effects of value-added tax and business tax on urbanization, we employed the lagged value-added tax proportion accounting for fiscal revenue, and lagged business tax proportion accounting for fiscal revenue separately as an independent variable. The results are shown in
Table 3.
Value-added tax had a significantly positive impact on the gap between land urbanization and population urbanization; on the contrary, business tax had a significantly negative impact on the gap. The results show that the larger the proportion of value-added tax in fiscal revenue in the previous year, the greater the gap. The larger the proportion of business tax in fiscal revenue in the previous year, the smaller the gap. These two taxes both affect land urbanization significantly, with little effect on population urbanization.
The reason why the effects of value-added tax and business tax on land urbanization are totally different is because of the varying nature of these two taxes. In China, the value-added tax is a sharing tax, and the business tax is a local tax. The value-added tax is levied by the national administration of taxation; the local governments cannot hide the tax base and have limited influence on the levying. Meanwhile the business tax is levied by the local administration of taxation, and local governments can enjoy all business tax income. The higher proportion of value-added tax to the fiscal revenue means the central government takes away more value-added tax by the sharing mechanism. Compared to value-added tax, the local governments prefer to increase the income of business tax. So, expanding urban areas through more rural land requisition to encourage the development of the construction industry is a good choice for local governments to obtain more business tax income.
China may be the most decentralized country in the world today, if we measure using the local governments’ spending proportion accounting for total government spending. Chinese local governments’ spending proportion accounting for total government spending was consistently 70% after 1994, reaching 80% in 2009, and was over 85% in 2012. The local governments’ fiscal revenue proportion accounting for total revenue was only 52% in 2012. This means that the local governments’ fiscal self-financing rate is relatively lower. The decentralization of Chinese fiscal expenditure has another feature in that the lowest level of government assumes the most fiscal expenditure. The proportion of the provincial government’s fiscal expenditure is less than 20%, the city government’s fiscal expenditure accounts for about 22%, but the proportion of the county government’s expenditure is nearly 40%.
The fiscal self-financing rate of local governments may have effects on the urbanization style of the region. The local governments with a lower fiscal self-financing rate face greater fiscal pressure, so they have to seek other government revenues. They may choose to promote land urbanization other than population urbanization. In order to test this idea, we employed the lagged fiscal self-financing rate of local governments as an independent variable in the regression model (
Table 4). The fiscal self-financing rate can be measured as the ratio of the fiscal expenditure and the fiscal revenue in the general budget of local governments.
The results of the regression are consistent with our conjecture. The lagged fiscal self-financing rate has a significantly positive impact on the gap between land urbanization and population urbanization, indicating that the lower the fiscal self-financing rate, the greater the degree of disjunction. These results are easy to understand because local governments tend to seek income from other sources when the budgetary revenues of local governments are difficult to sustain their large expenditures. The expansion of land is an effective way to increase the revenue of local governments and to attract investment for economic development. The costs of population urbanization make the fiscal pressure on local governments greater. Therefore, land urbanization is more popular.
Since the reform of the tax-sharing system in 1994, the proportion of local governments’ fiscal revenue has plummeted from 78% in 1993 to 44.3% in 1994, losing 75% of value-added tax and all consumption taxes. After the income tax reform in 2002, 60% of corporate income tax and personal income tax were lost. According to Sun and Zhou [
53], the more the local governments lose, the greater the incentive to obtain income from land acquisition and land grants. Therefore, we can draw the inference that the more the local government loses tax revenue in the tax sharing system, the stronger the local governments’ motivation for land acquisition and the expansion of urban areas. The decreases in fiscal revenue make the gap between fiscal revenue and fiscal expenditure larger, and the local governments will limit the increase in the urban population. Considering the two effects, we believe that the greater the local governments’ tax losses, the greater the disconnect between land urbanization and population urbanization.
Before 2002, the local governments’ tax losses were 75% of value-added tax revenues and all consumption taxes. At the same time, in order to ensure the vested interests of local governments, the central government also arranged tax refunds. Therefore, tax losses before 2002 = (consumption tax + value-added tax (VAT) × 75%) − tax refunds of consumption tax and VAT. In 2002, the reform of the income tax sharing mechanism was implemented. In that year, the central government shared 50% of corporate income tax and personal income tax. Therefore, the tax losses in 2002 = (consumption tax + VAT × 75%) − tax refunds of consumption tax and VAT + (corporate income tax + personal income tax) × 50% − income tax base refunds. After 2002, the central government changed the share of income tax to 60% for the central government and 40% for the local governments. Therefore, tax losses after 2002 = (consumption tax + VAT × 75%) − tax refund of consumption tax and VAT + (corporate income tax + personal income tax) × 60% − income tax base refunds. According to this method, we calculated the tax losses of each province, and used the lagged tax losses as an independent variable in the regression model (
Table 5).
Based on the results in
Table 5, the lagging tax losses have a significant positive impact on the gap between land urbanization and population urbanization. This shows that the more the local governments’ tax losses, the greater the degree of disjunction. The lagged tax losses have a significantly positive impact on the speed of land urbanization. The local governments’ tax losses have accelerated the speed of local land urbanization. This is reflected in the faster expansion of urban built-up areas. The results of this regression intuitively show that the important reason that caused land urbanization much faster than population urbanization is that the central government concentrated a large amount of fiscal revenue from local governments in the reform of the tax-sharing system.
5. Conclusions
The implementation of the tax-sharing reform in China demarcated taxes between the central and local governments, and the central government concentrated a large amount of fiscal revenue. However, most of the fiscal expenditure responsibilities are still assumed by the local governments. It can be considered that China has the characteristics of fiscal revenue centralization and fiscal expenditure decentralization. The local governments in China play an important role in economic development. In particular, the household registration system and land ownership system provide the conditions for local governments to dominate the development of urbanization. The reduction of fiscal revenue of local governments after the tax-sharing reform can explain why land urbanization has become the first choice of local governments.
This article conceptually and empirically investigates the influence of fiscal incentives on urbanization in China. We used panel data of 30 provinces and autonomous regions in China from 2000 to 2012 to discuss the impact of fiscal incentives on urbanization from four aspects: fiscal revenue, types of taxes, fiscal self-financing rate, and tax losses. The data analysis results indicate that the fiscal revenue of local government has a significantly negative impact on the gap between land urbanization and population urbanization. This means the lower the local government’s fiscal revenue, the stronger the driving force for land urbanization. Value-added tax expands the gap between land urbanization and population urbanization, and on the contrary, business tax narrows this gap. This has to do with tax administration authority. Local governments have the authority of business tax, so the more the business tax revenue, the slower the land urbanization. The fiscal self-financing rate has a significantly positive impact on the gap between land urbanization and population urbanization. Higher fiscal self-sufficiency means that there is less pressure on local governments’ fiscal expenditure. So, it will not inhibit population urbanization, and there is little incentive to promote land urbanization. Local governments’ tax losses have a significantly negative relationship with the gap between land urbanization and population urbanization. It provides direct evidence that fiscal incentives and population urbanization lag behind land urbanization. Due to the existence of sharing tax, local governments have less control over taxes. So, local officials are actively promoting urbanization based on urban land expansion rather than population urbanization.
We systematically analyzed the impact of the fiscal relationship between the central government and local governments on urbanization in China during the tax-sharing reform. We try to explain the reasons that led to faster land urbanization than population urbanization from the perspective of fiscal incentives. Compared with urbanization in the United States and European countries, the governments of Asian countries, such as Japan, South Korea, and China, have always played an important role in urbanization. Urbanization in the United States relies too much on market demand, causing extreme suburbanization; this urban sprawl has been criticized. The expansion of urban land in China is not driven by the market, but by the local governments. Improving the quality of population urbanization, fully utilizing the population agglomeration effect, and making land urbanization consistent with population urbanization are all problems that need to be solved for China’s urbanization.
China’s decentralized fiscal system has created a mismatch between resource availability and social spending at the local level, as money is not allowed to follow people. China’s fiscal system has served the country well since the tax-sharing reform in 1994, but further reforms are required. In order to improve the quality of urbanization and guarantee the sustainable development of urbanization, a stable local tax system should be established to make local governments obtain enough tax revenue, such as the levy of property tax. The abundant tax revenue can meet the public service demands from new urban residents and help the local governments reduce their dependence on land finance. While establishing the local tax system, the intergovernmental transfer payment system should be improved. The general transfer system should consider local governments’ revenue capacity and expenditure needs and ensure the money follows people. Then local governments will provide a minimum level of public services for all urban populations.


