1. Introduction
Companies that implement innovative business models based on new and innovative ways to create and capture value change the way they do business in order to secure a sustained competitive advantage [
1,
2,
3]. According to evidence, innovation is a key capability of companies that aim to improve their competitive advantage, while supporting sustainability [
4].
On the other hand, in the context of the depreciation and pollution of the environment, the transition to a more sustainable economic system has become a key priority [
5]. In the long term, companies implementing a sustainable business model come to be more resilient in the face of various risks [
6], diversifying their production processes. Recent evidence has shown that companies have increased the management commitment and investments they are dedicating to sustainability. Usually, firms begin by complying with regulations in order to avoid penalties, then try to improve their supply chain and their competitive advantage by developing new or updated products and services, and only at a final stage of maturity do firms aim to completely restructure their business model in order to support sustainability [
3,
7,
8]. Hence, the decision to adopt a strategy for sustainability-oriented innovation (SOI) is in part due to changes in the nature of not the activity, the value chain, and stakeholders’ demands, but also as an endogenous component consisting of the managerial capacity to anticipate the future nature of competitive advantages [
3,
7].
Sustainability-oriented business innovation has become a topic of great interest, but there is still a research gap with respect to how this business model is implemented and what its main tools and challenges are [
5].
This paper aims to identify the most important drivers supporting companies to develop business models more oriented towards sustainability. We explore microdata at company level from 29 European countries.
The paper consists of four parts. It opens up with analyzing the debates in the scientific literature dedicated to SOI, continues with describing the data and methodology used, and ends with some discussions and policy implications. The methodology approach is mainly based on a quantitative approach, using advanced statistical tools in order to identify the most important factors related to SOI activities that have the potential to shape the efficiency of raw material usage and environmental protection. We use for our purpose the data set of the 2016 Innobarometer “EU Business Innovation Trends” [
9]. As previous research has evidenced, factors such as companies’ size and investments in a variety of products, processes and marketing innovations are addressed. A special focus in our research is put also on investments in training, as any innovation requires new skills and knowledge. Our analysis identifies the main skills that are needed by companies in order to support their innovation activities targeting sustainability. Our results are useful for better understanding the way innovative companies commit themselves to sustainability and which are the main factors that boost innovation dedicated to sustainability.
2. Drivers of Sustainability-Oriented Innovation in Literature Review
Increasing awareness on the over-consumption of resources and environmental degradation has supported the goal of transitioning to a more sustainable economy. Over recent decades, companies have improved their commitment towards sustainability, becoming more aware that sustainable practices can also boost their economic performances. On the other hand, innovation is one of the companies’ manners to reach an improved position in the market, while supporting the transition to a more sustainable economy.
Different terms and concepts have been used in order to define this process, such as sustainable innovation, sustainability-driven innovation, eco-innovation, green innovation, etc. [
10,
11,
12], but their definitions are still not completely agreed on [
13]. Some of the definitions are more restrictive, considering only the production or exploitation of a new product/process/service/management method that result in the reduction of pollution or environmental risks [
14], while others are more comprehensive, referring to the opportunities opened by the current progress and changes for the survival and well-being of all humans [
15].
Research on the drivers of SOI is in its infancy, with different papers identifying one specific factor or strategy supporting its emergence. At first, studies were more focused on the behavior of large companies, but during recent years several steps were made in analyzing the practices of small and medium-sized enterprises (SMEs) [
7]. The debate on the role of firm size in innovating towards sustainability is one of the main issues addressed in the literature, as large companies are also large polluters and have a significant impact on the environment. Size is a proxy for both negative impacts on the environment, but also for firms’ financial and profit sustainability and for their strategic approach to change management. Other authors evidenced the flexibility and adaptability of SMEs, with research papers arguing that innovation strategies vary according to firms’ sizes [
3]. Studies aiming to analyze the SMEs’ practices in SOI have shown that they are more focused on environmental issues and more committed to eco-innovation, being less involved in social or ethical issues [
7].
The incentive for companies to promote SOI emerges at the intersection between the duty to comply with social and environmental regulations and the interest in benefitting from new business opportunities provided by sustainability targets. Previous studies have shown that there is a direct link between environmental performance and economic performance and that this relation is moderated by industry growth [
16]. So, the sectoral dynamic is also relevant for sustainable economic behavior among companies.
Companies adopting green innovations register a higher productivity, while optimizing their resource usage [
17,
18]. They gain a better position on the market and support environmental protection at the same time [
19,
20]. The business practices become more and more important for environmental protection. Hansen et al. [
21] exemplified how a “life cycle dimension” is needed in order to reach the long-term goals of SOI. The entire value chain has to be intentionally changed, from accessing resources, to production processes, employed technologies, obtained products and services and their impact on sustainability. So, analyzing factors that influence SOI has to refer to knowledge, production and marketing capabilities of companies and/or industries [
22,
23].
Recent evidence based on a bibliometric approach shows that green innovation is related to green marketing, green supply chains and climate change issues. Additionally, environmental regulations, environmental leadership and culture, knowledge sharing and information technology have acted as important drivers for green innovation [
10].
Innovations are newly launched in production or on the market, so their impact on sustainable development is hard to be anticipated, so, usually, studies analyse the intentions of companies to support sustainable development through their innovation acquisition or practices [
24]. SOI implies that companies have a clear and assumed intention to develop products and services that aim to support economic, environmental and social sustainability [
21,
25,
26]. The impact of recent developments in the sustainable goals still has to be measured and studied, so methodological approaches are in constant development, some of them providing mixed results. Considering this context, the management’s commitment to sustainability goals is with no doubt a core factor in developing SOI [
7,
21,
24,
27]. However, it is hard to believe that companies possess the needed knowledge and understanding on the long-term impacts of their operations on sustainability. But, nevertheless, they need to understand the importance of their business decisions on the sustainability performance of their company as well as how to combine technologies, processes and markets in order to improve their performances, also with respect to sustainability [
28].
The knowledge needed by companies in order to develop innovations targeting sustainability goals can be addressed though the existing skills and expertise [
29], but also research and development activities have a significant influence, irrespective of the fact that they are performed in-house, subcontracted or accessed through foreign direct investments (FDI). Education, R&D and innovation are conducive at a national and international level to added value and competitiveness, and at an individual level to the increased acquisition and utilization of knowledge [
23,
30,
31,
32], as well as to awareness on environmental issues.
Companies with external links, including access to FDIs, seem to be more oriented both towards innovation as well as towards sustainability goals [
13]. Therefore, SOI processes can rely not only on internal capabilities, but also on knowledge from the outside, including universities, NGOs and local communities [
33,
34,
35]. The results regarding the influence of FDIs on SOI are mixed. FDIs offer access to external partnerships and new technologies, but they support SOI only if they also facilitate access to knowledge and if they are coupled with partnerships with universities and research institutes [
24]. Additionally, academic researchers are among the most important agents in developing more responsible research and innovation [
36].
Other researchers have pointed to the role of the stakeholders’ participation in order to incorporate sustainable goals within companies’ business models in a coherent manner [
13], such as: clients and customers, consultants, providers, vocational, education and training providers and universities, etc. [
24]. But stakeholders are usually included only in the last stages of the innovation process and sometimes only after the innovation is already on the market [
35]. As the pressure on companies to develop sustainable operations increases and as the stakeholders become more diverse, adopting a strategy to develop open innovation practices becomes a rational choice.
Economies function in specific cultural, geographical and cultural factors that shape awareness and decision making, aiming to lead to the success of SOI. So, companies’ behaviors are influenced also by the larger context in which they operate [
37,
38,
39,
40]. Thus, the politics and institutional contexts in which companies operate are crucial for technological and sustainability transitions and are determined by different features of special and cultural spaces [
41].
3. Data and Methodology
We explored the microdata from the 2016 Innobarometer “EU Business Innovation Trends” [
9], covering 8635 companies from 29 European countries (28 EU member states plus Switzerland). The share of each country in the total sample is represented in
Appendix A,
Table A1. It varies from 1.4% (Luxembourg) to 4.2% (Denmark). The sample includes all types of companies, from micro-enterprises to large companies. Approximatively 40% of the instances are represented by companies with a maximum of nine employees. The second category, firms characterized by a size of 10 to 49 employees, represents 32% of the total sample. The last three categories cover approximately 28% of our dataset, from which 21% are companies which have 50 to 249 employees. The objective of the survey was to collect data on the innovation activities of these companies, as well as on industrial modernization. The interviews were conducted in 2016.
In this paper, we trained a classifier in order to understand which are the most important factors separating the companies whose innovations may positively impact resource efficiency, environmental protection and construction solutions for future smart cities from other firms not necessarily oriented towards sustainability. Factors included in the model are organized according to previous research in the field, aiming to capture the entire production chain— from accessing and developing knowledge, to improving production process and technologies, as well as improving the marketing of products and services [
23]. The size of the company is added to this model, as the entire literature pointed out its relevance both for capabilities and impact on SOI.
The factors included in the estimation are as
Table 1:
All these factors are categorical variables with five or six levels. Excepting the size of the company, the other eight factors are based on the percentage of total turnover invested to support innovation. The variable computed on the percentage of the company’s turnover invested in innovation activities (
invest) groups the firms into six categories: “0%”, “Less than 1%”, “Between 1% and 5 %”, “Between 6% and 10%”, “11% or more”. For the other seven factors, each company belongs to one of the following categories: “0%”, “Less than 1%”, “Between 1% and 5%”, “More than 5%”. The construction of these variables is not our contribution; they are predefined in the dataset we employed. We have included in
Appendix A (
Table A2 and
Table A3) the relative frequencies encountered for all these investment categories by level. About 40% of the companies are investing between 1% and 5% of their turnover into innovation activities, meanwhile only about 7.5% reported a share above 11%. Among all these investment categories, the acquisition of machines, equipment and software (
equipment) is the most frequently reported by the companies with a significant share in the total turnover. To be more specific, over 30% of the companies are allocating more than 5% of their turnover to this item. At the opposite pole is the companies’ propensity for research and development investments (
RD). In this case, only 10% of the companies dedicated more than 5% of the total turnover to this activity. Besides these factors capturing companies’ investments, we also considered in our model a variable controlling the innovation performance specific to each of the countries included in the analysis. We used the results from the European Innovation Scoreboard 2016 depicting the national innovation systems classification according to their innovation performance. The average innovation performance is measured by a composite indicator, known as the Summary Innovation Index. According to the value encountered for this index, states fall into four different groups. Denmark, Finland, Germany, the Netherlands, and Sweden are Innovation Leaders, their innovation performance being well above that of the EU average. Austria, Belgium, France, Ireland, Luxembourg, Slovenia, and the UK fall in the Strong Innovators group, with innovation performance above or close to that of the EU average. The performance of Croatia, Cyprus, Czech Republic, Estonia, Greece, Hungary, Italy, Latvia, Lithuania, Malta, Poland, Portugal, Slovakia, and Spain is below the EU average. These countries are Moderate Innovators. The Modest Innovators group includes those countries with innovation performance well below that of the EU average. Bulgaria and Romania belong to this category.
The dependent variable (y) was built on the item regarding the potential impact of innovation activities on different areas. The companies that selected at least one of the following—resource efficiency, environmental protection or construction solutions for future smart cities—belonged to the positive class of companies that through innovation practices drive sustainability (y=Yes). The companies included in the second class (y=No) were the ones considering that their innovations will impact other areas, not related to sustainability, such as job creation, IT and digital economy, lifelong learning and skills improvement, space applications, health and medical care, transport and transport infrastructures, availability and quality of food. For the sample we used in this investigation, we obtained that 37% of the companies belong to the positive class.
The selection of the methodology employed for investigating the factors explaining the companies’ propensity to develop innovation activities oriented towards a sustainable economy was based on the following aspects:
The number of companies in the positive class is outnumbered by the companies included in the negative class, underlining that the dependent variable has an unbalanced proportion of classes. Even if we are not dealing with a severe case of imbalance, the classification results will be affected by this issue. Generally, when training classifiers on unbalanced samples, the information coming from the less represented cases is ignored, the results become biased and the prediction performance is significantly reduced. This issue was addressed in the literature by re-sampling the original dataset [
42]. The main solutions based on re-sampling are included in one of the categories—under sampling, oversampling, synthetic data generation. Under sampling eliminates cases from the majority class and the oversampling methods consist of replicating observations from the minority class. The last one, synthetic data generation, represents an improved version of the first two and it is known in the literature as the synthetic minority oversampling technique (SMOTE). In this case, the algorithm used similarity measures to generate artificial data from the minority class [
42].
In order to emphasize the factors playing a significant role when trying to explain the companies’ tendency towards sustainable innovation, it is important to obtain classification results that provide information regarding the predictors’ importance. Moreover, we need a classifier that can achieve a high predictive accuracy.
With respect to the first issue, in order to balance the class distribution, we used a new solution, similar to SMOTE, because it also generates artificial data. This technique, referred to as ROSE (Random Over Sampling Examples), uses smoothed bootstrapping to draw the artificial samples [
43]. The new data generated to balance the sample was drawn from the two conditional kernel density estimates of the classes. We chose this approach because it has shown good performance compared to other existing methods, reducing the risk of model overfitting [
44].
Regarding the second aspect, among the classification methods, we selected the decision trees for interpretability and visualization considerations. Given that the decision tree provides a reduced level of predictive accuracy, when trying to separate the two categories of companies, we improved our prediction model by using a random forest approach [
45]. Instead of building a single decision tree, the results from a large number of trees is combined, deriving a classifier with a substantially improved predictive performance. In a nutshell, this involves building B decision trees using B bootstrapped training sets. Each tree was grown deep, and hence was not pruned. Moreover, a different random sample of predictors was taken at each split. Typically, the number of predictors considered at each split is approximately equal to the square root of the total number of predictors. These operations aimed to reduce variance by averaging a large number of uncorrelated trees. Furthermore, fitting nonlinearities and interactions is one of the main advantages of a random forest approach.
For a specific observation, each of the B trees predicted a specific class. The overall prediction for that company was the class occurring most often. For a certain tree of B, the estimation was made on a bootstrapped subset of the observations. This means that some of the observations, known as “out of bag” (OOB), were not included in this specific training set but were used for error estimation.
The following steps summarize the random forest approach for classification problems [
46]:
Draw a sample b from the training data set using bootstrap (b = 1 to B).
Train a decision tree on this sample. For each node of the tree, the best splitting criteria is selected from m variables chosen at random from all the predictors (m is the square root of the total number of predictors).
For each observation x included in sample b, we obtain from the estimated tree , the class prediction .
The ensemble of B trees are used to predict the class for x:
The importance of each predictor was measured by the mean decrease in the node impurity, computed by the Gini index, when that predictor served as a splitting variable [
46]. In the context of decision trees, the node impurity measures the homogeneity of the labels, meaning that a node is pure if all the observations in that node are belonging to the same class. The Gini index was computed using the formula:
where
denotes the frequency of class
i at a specific node.
The analysis was performed on unweighted data, given that the techniques we selected did not support sample weights.
4. Results and Discussions
Around one half of the manufacturing companies have used or have the intention to use (in the next 12 months) advanced technologies. Considering that the share of companies showing industrial modernization is not very high, it is relevant to know how many companies use advanced technologies aiming for the efficiency of raw material usage and environmental protection. The Innobarometer data show that only 31.1% of manufacturing companies have used technologies that address sustainability-related goals. Also, 30.2% of the manufacturing companies have the intention to use sustainable technologies in the near future. These results show a reduced potential for fast progress in this area.
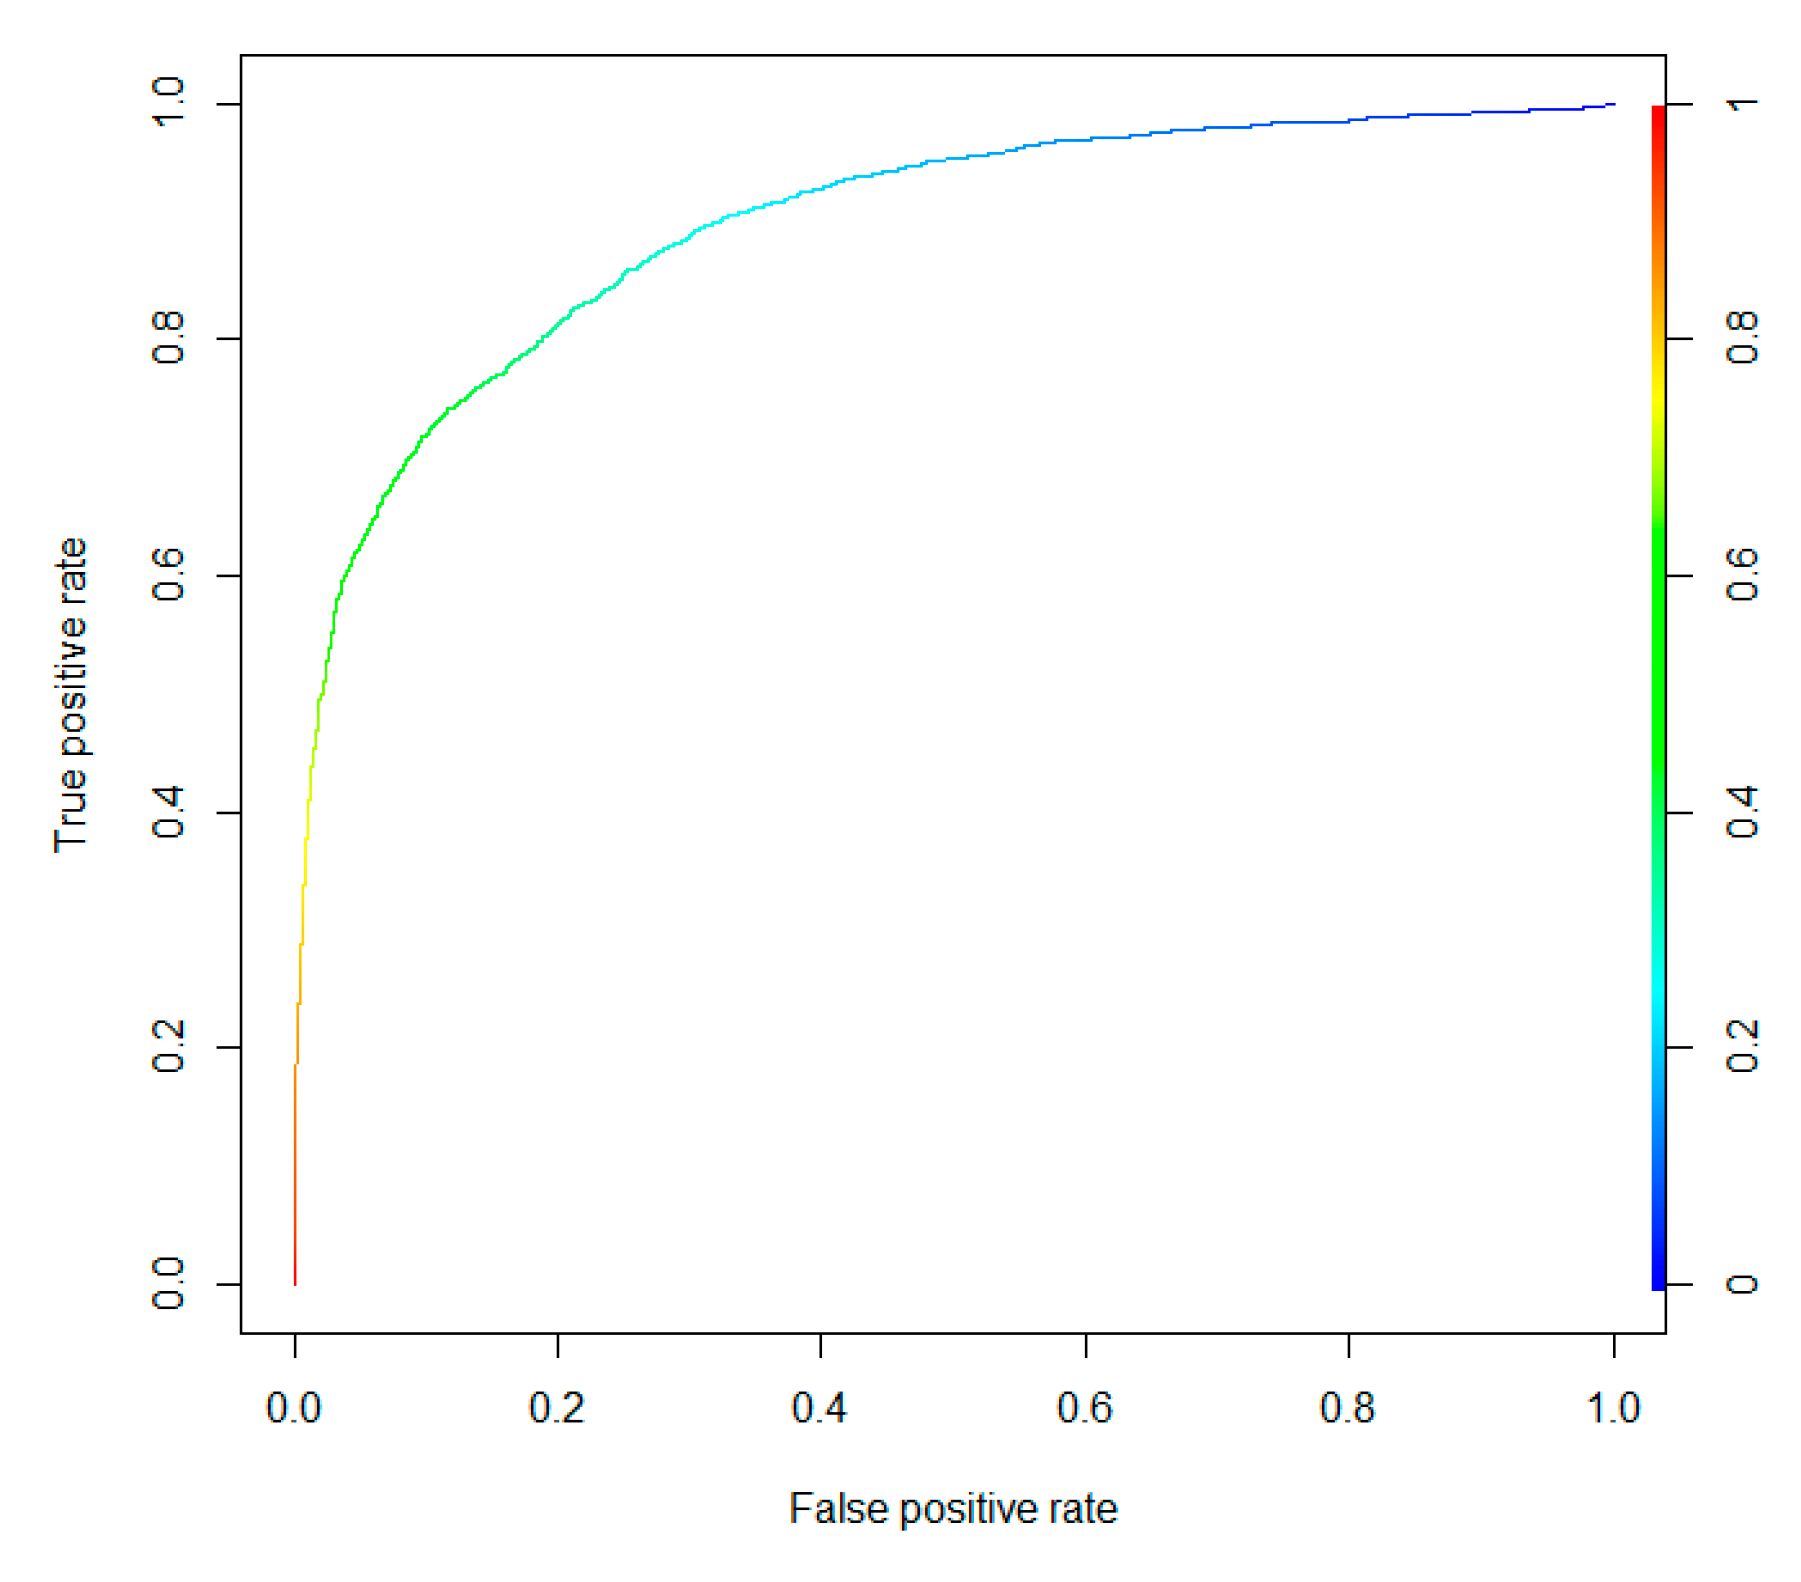
In this context, innovation activities become crucial not only for increasing the competitive advantage of the companies, but also for addressing sustainability related goals. It is important to better understand which are the main drivers influencing SOI activities in companies. The estimation was performed using randomForest library in R [
47]. The number of trees trained was 1000 and the number of variables tried at each split was 3. Within this framework, the OOB estimate of the error rate was 17.2%. The AUC (Area Under the Receiver Operating Characteristic (ROC) curve), the measure used to evaluate the performance of the estimator, was 0.895, describing a good model that can accurately distinguish between the two categories (
Figure 1).
In order to emphasize the factors discriminating between the positive and negative classes, two measures of variable importance are reported. The first is based upon the mean decrease in accuracy in predictions on the out of bag samples when a given predictor is excluded from the model. The latter is a measure of the total decrease in node impurity that results from splits over that variable, averaged over all trees.
The variables with the largest mean decrease in the Gini index are: innovation performance of the country (innovation), percentage of company turnover invested in innovation activities (invest), percentage of total turnover invested in acquisition of machines, equipment, software or licenses (equipment), percentage of total turnover invested in company reputation and branding, including web design (branding), percentage of total turnover invested in software development (software). The results indicate that across all of the trees considered in the random forest, classification of the national system of innovation performance is the most important variable, even if the criterion is the mean decrease in accuracy (
Figure 2).
The marginal effect of the variables on the class probability (y=No) is shown in the partial dependence plots. Given that the factors included in the estimation are categorical variables, these outputs show the impact of each level on the probability of not being oriented towards sustainability. Hence, the higher the value associated to a specific level, the smaller the propensity towards SOI activities. For each category, the partial dependence is computed using the average predictions obtained when that category is maintained at a constant for all instances. For the innovation factor, all the categories show a positive effect, but the magnitude differs. For the companies located in countries showing moderate innovation performance, the model predicts a higher probability of the negative class, meaning that a reduced innovation performance at national level could explain a lower tendency towards SOI at company level (
Figure 3) The estimation shows that the correlation between the national innovation performance measured by the Summary Innovation Index and the companies’ predilection towards sustainable innovation is not always direct. For example, companies operating in countries considered modest innovators are more opened to SOI than are the ones in from strong innovators systems. This result could be explained by the fact that the Summary Innovation Index does not necessarily reflect the sustainable innovation.
The model also validates the importance of some of the factors considered under the theoretical model. Only five of the factors included in the model are kept as relevant, but these factors cover all three of the theoretical dimensions: knowledge, production and market innovation capabilities.
For the other important factors, the partial dependence plots suggest that reduced levels of any kind of investment involve a higher probability of not undertaking innovation activities targeting sustainability (
Figure 4). Obviously, companies that are not interested in developing a sustainable business model do not use their resources for investments in production innovation capability or in company reputation and branding.
As previous studies have evidenced, skills and knowledge are very important in supporting and improving SOI activities. The needed skills which have been pointed out as relevant for supporting innovation, were explored among the companies performing SOI activities, the findings being presented in the figure below (
Figure 5). Technical skills (specific to the sector) are the most important for supporting a company’s innovation activities. Marketing skills and financial skills relating to investment and access to finance also registered high scores with respect to their relevance for boosting innovation activities at company level. Another useful class of skills refers to management commitment to SOI, covered under organizational and leadership skills. Also, creativity, inventiveness and experimentation are considered relevant, being in fact the soft skills which support the development of all mentioned above. The skills selected as relevant for innovation activities are in line with the dimensions of the prediction model. Technical and organizational and leadership skills are relevant for the process innovation capability, marketing skills for the market innovation capability, while creativity, inventiveness and experimentation could be relevant for knowledge innovation capability.
The analysis of skill needs by type of innovation performance, measured by European Innovation Scoreboard [
48], pointed out some relevant differences (see
Appendix B). All companies value, to approximately the same extent, technical, marketing and organizational and leadership skills. However, IT and digital skills gain more value as the innovation performance of the country where companies are located increases. A similar pattern can be witnessed for creativity, inventiveness and experimentation. Companies from moderate- and modest-innovation countries value these skills significantly less. But, with respect to financial skills relating to investment and access to finance, as the innovation performance decreases, the skills’ importance increases. Innovation implies financial costs that urge companies to look for financing opportunities, which seems to be very relevant for companies located in countries that are not so performant in relation to innovation.
5. Conclusions
Analyzing micro-data from the 2016 Innobarometer, this paper offers an in-depth image of the main factors defining the business model that relies on SOI in European countries. First, our results confirm that the innovation activities of companies play a crucial role in supporting and enhancing the transition to a more sustainable economy. Second, using a random forest approach, we found that the business model embracing SOI is characterized by higher investments in innovation activities, the acquisition of machines, equipment, software or licenses and software development, and in company reputation and branding,. Extremely important is the role of the national context for the way companies engage in SOI [
49]. Thus, a highly innovative environment supports companies to become more committed to sustainability. According to the random forest model, the companies operating in the countries characterized by a national innovation performance below the EU average are the least predisposed to sustainable innovation. Our results confirm the strong link between innovation and business models addressing sustainability goals. From this point of view, efforts for improving innovation performance at a national level can result in the improvement of sustainability-oriented business practices in the long term. Also, confirming previous findings, our analysis showed that larger companies have greater potential to innovate, while addressing sustainability goals.
From the point of view of the measures supporting innovation, skills development is considered essential by innovative companies focused on sustainability. Technical skills, marketing skills, financial knowledge and leadership, as well as creativity and inventiveness are the most important skills that support companies to innovate while addressing sustainability goals. Our results are useful for better shaping the education programs that target the development of business management skills and innovation, while fostering environmental protection. Also, companies which are interested in becoming environmentally friendly innovators need to develop this set of skills among their employees.
Future programs supporting businesses’ green innovation have to be better adjusted to the needs of small and medium-sized enterprises. The findings of this paper also suggest the fact that SMEs need specific policies (such as financial incentives, access to specific services) in order to make SOI more attractive and accessible for them.
The most important limitations of our research are related to the fact that, as we stated in the methodology section, for enhancing the robustness of our results, we have performed our analysis on unweighted data from the 2016 Innobarometer. In our future research, we aim to address these limitations by employing complementary research methods.


