1. Introduction
The body of academic contributions dealing with local and regional development has recently broadened to study the concept of regional resilience (i.e., how different regions respond and adapt to a wide array of external shocks). Seeking to understand the factors affecting the ability of a place to react to a more or less unexpected change inevitably begs the question of what influences its endogenous development, as well as what policy and governance structures are best in enabling and facilitating a positive change. One of the most intriguing facts is that while some areas manage to renew themselves, others start, or remain locked in, a path of decline.
Although many different notions of resilience have been proposed in recent years, resilience, broadly speaking, is simply meant as the ability of a socio-economic system to recover from a shock or disruption [
1,
2,
3,
4,
5,
6,
7,
8]. However, this concept has been fine-tuned, and three main interpretations of this ability to recover are now found in the literature [
1,
9,
10]. The first one—also known as engineering resilience [
11]—focuses on the resistance of a region to disturbances, and on the speed and extent of its recovery, where recovery is simply the return to the pre-shock equilibrium state or path. The second one—known as ecological resilience [
11]—emphasizes the magnitude/size of the disturbance that a system can tolerate before it moves to a new state or equilibrium (i.e., it changes form, function or position). The third one—known as adaptive resilience—refers to the capacity of a system to maintain core performances, despite a shock, by adapting its structure, functions and organization to change, and hence bouncing forward. This view is quintessentially an evolutionary one. Following Boschma [
4], resilience, meant as the capacity of a region to sustain long-run development, is regarded as important as the capacity of a region to respond positively to short-term shocks. Therefore, this interpretation focuses on the long-term evolution of regions and their abilities to adapt and reconfigure their industrial and institutional structures. Our paper is an initial attempt to study both dimensions of resilience. Within the evolutionary perspective, we also extensively draw on the theoretical framework built by Martin and Sunley [
9], who focus on the capacity of regions to change the evolution of their structural, organizational and behavioral characteristics as an answer to any kind of shock. Therefore, recovery is just one of the aspects of a multifaceted concept such as resilience. It simply considers the return to the pre-shock equilibrium state or path, without saying anything about the capacity of an economic system to adapt or move to a better development path than before the shock [
9]. We partially disagree with the limitation of excluding regional reactions to adverse processes that cumulate slowly and incrementally over long periods of time from the theoretical framework on resilience. Indeed, shocks “are often closely intertwined with the unfolding of broader, longer run and slow-burn processes of change” [
12] (p. 5).
The question of how resilience to a major shock interacts with long-term patterns of economic growth is intriguing, and is the main focus of our study. This interaction is at the core of why, for instance, the same major economic shock (at the national or international scale) can have highly spatially uneven local impacts, as in the great recessions of the early 1930s, early 1980s and early 1990s. Capello et al. [
13] point out that even the last crisis was characterized by a high degree of spatial heterogeneity in terms of regional and local effects [
14,
15]. Many studies have dealt with the evaluation of regional resilience in different countries [
1,
4,
9,
13,
16,
17,
18,
19,
20,
21,
22,
23,
24,
25,
26,
27,
28,
29] in response to the Great Recession. Nonetheless, there is a paucity of studies that focus specifically on the role of changes to local industrial structures as a result of regional adaptation in coping with economic crises (see [
30,
31,
32,
33]). Furthermore, to the best of our knowledge, our paper is the first that aims to discuss the relationship between the Great Recession, sectoral composition change and peripheral areas.
In fact, what is interesting in focusing on peripheral areas with long-run negative growth trajectories is that this allows us to see if a sudden, unexpected shock, such as the 2008–2009 global financial–economic crisis, makes them reach a critical tipping point that makes incremental slow-burn economic changes all at once disruptive. The underexplored issue here is whether such slow-burn processes are accelerated by shocks, or whether they could be positively reversed by them. Martin et al. [
31] suggest that the resistance of a national economy as a whole is counterfactual. Regions experiencing a larger fall in employment than the national economy would be deemed as being less resistant to the shock, while regions in which the fall is lessened would be regarded as being relatively resistant. Thus, the direction of industrial change (e.g., in line with the growth of the “national champions” or not) would be intended as a proxy of the capacity of peripheral areas to better respond to shocks.
With reference to the four-part question that the concept of resilience entails, in order to more accurately define the field and scope of investigation—following Martin and Sunley [
9]—the “to what” dimension is particularly relevant. We examined resilience to an acute shock (the Great Recession) in areas affected by chronic slow-moving challenges [
34], such as depopulation and ageing, economic decline, contraction of the provision of essential services, which tend to be corrosive to the adaptability capacity of places [
12,
35]. Economic shocks can be different in their nature, and hence, in their effects and implications for resilience.
If the “to what” is an economic crisis, as in our case, to build our analytical framework we can fruitfully rely on the four interrelated dimensions identified by Martin [
1] to conceptualize the notion of resilience precisely in relation to recessionary or other such shocks, which we found very salient to our purpose. These are: resistance (the capacity of a regional economy to face disruptions, such as recessions), recovery (the speed and degree of bouncing back from such a disturbance), re-orientation (the extent to which the regional economy undergoes structural realignment or adaptation) and renewal (the degree of resumption of the growth path that characterized the regional economy prior to the shock). It is worth noting that these different aspects of regional economic resilience interact in different ways with each other, but also with the various factors and characteristics that shape a region’s economic landscape. The economic structure of regions is commonly thought to play a pivotal role in shaping the resistance of places to recessionary shocks in particular [
1], despite also affecting the speed and extent of the recovery. More specifically, a diverse and heterogenous economic structure might provide greater regional resilience by allowing a greater resistance to the crisis, with resistance being assumed in this sense as the capacity to absorb potential sectoral unemployment through the re-distribution of the local workforce in other sectors. Investigating industrial local composition in terms of pro- and anti-trend sectors, with reference to national trajectories, could thus help in building knowledge on this specific aspect. As a potential outcome of future, follow-up research, this would help answer the fourth question inherent to the concept of resilience, which focuses on the “nature” of the recovery, exploring the direction of sectoral employment changes, the scale of shifts and whether they brought about a structural re-orientation of local economies over the long run (and if so, along which paths compared to national growing trajectories—see [
31]).
Empirically, our analysis starts from the first dimension of resilience (resistance) [
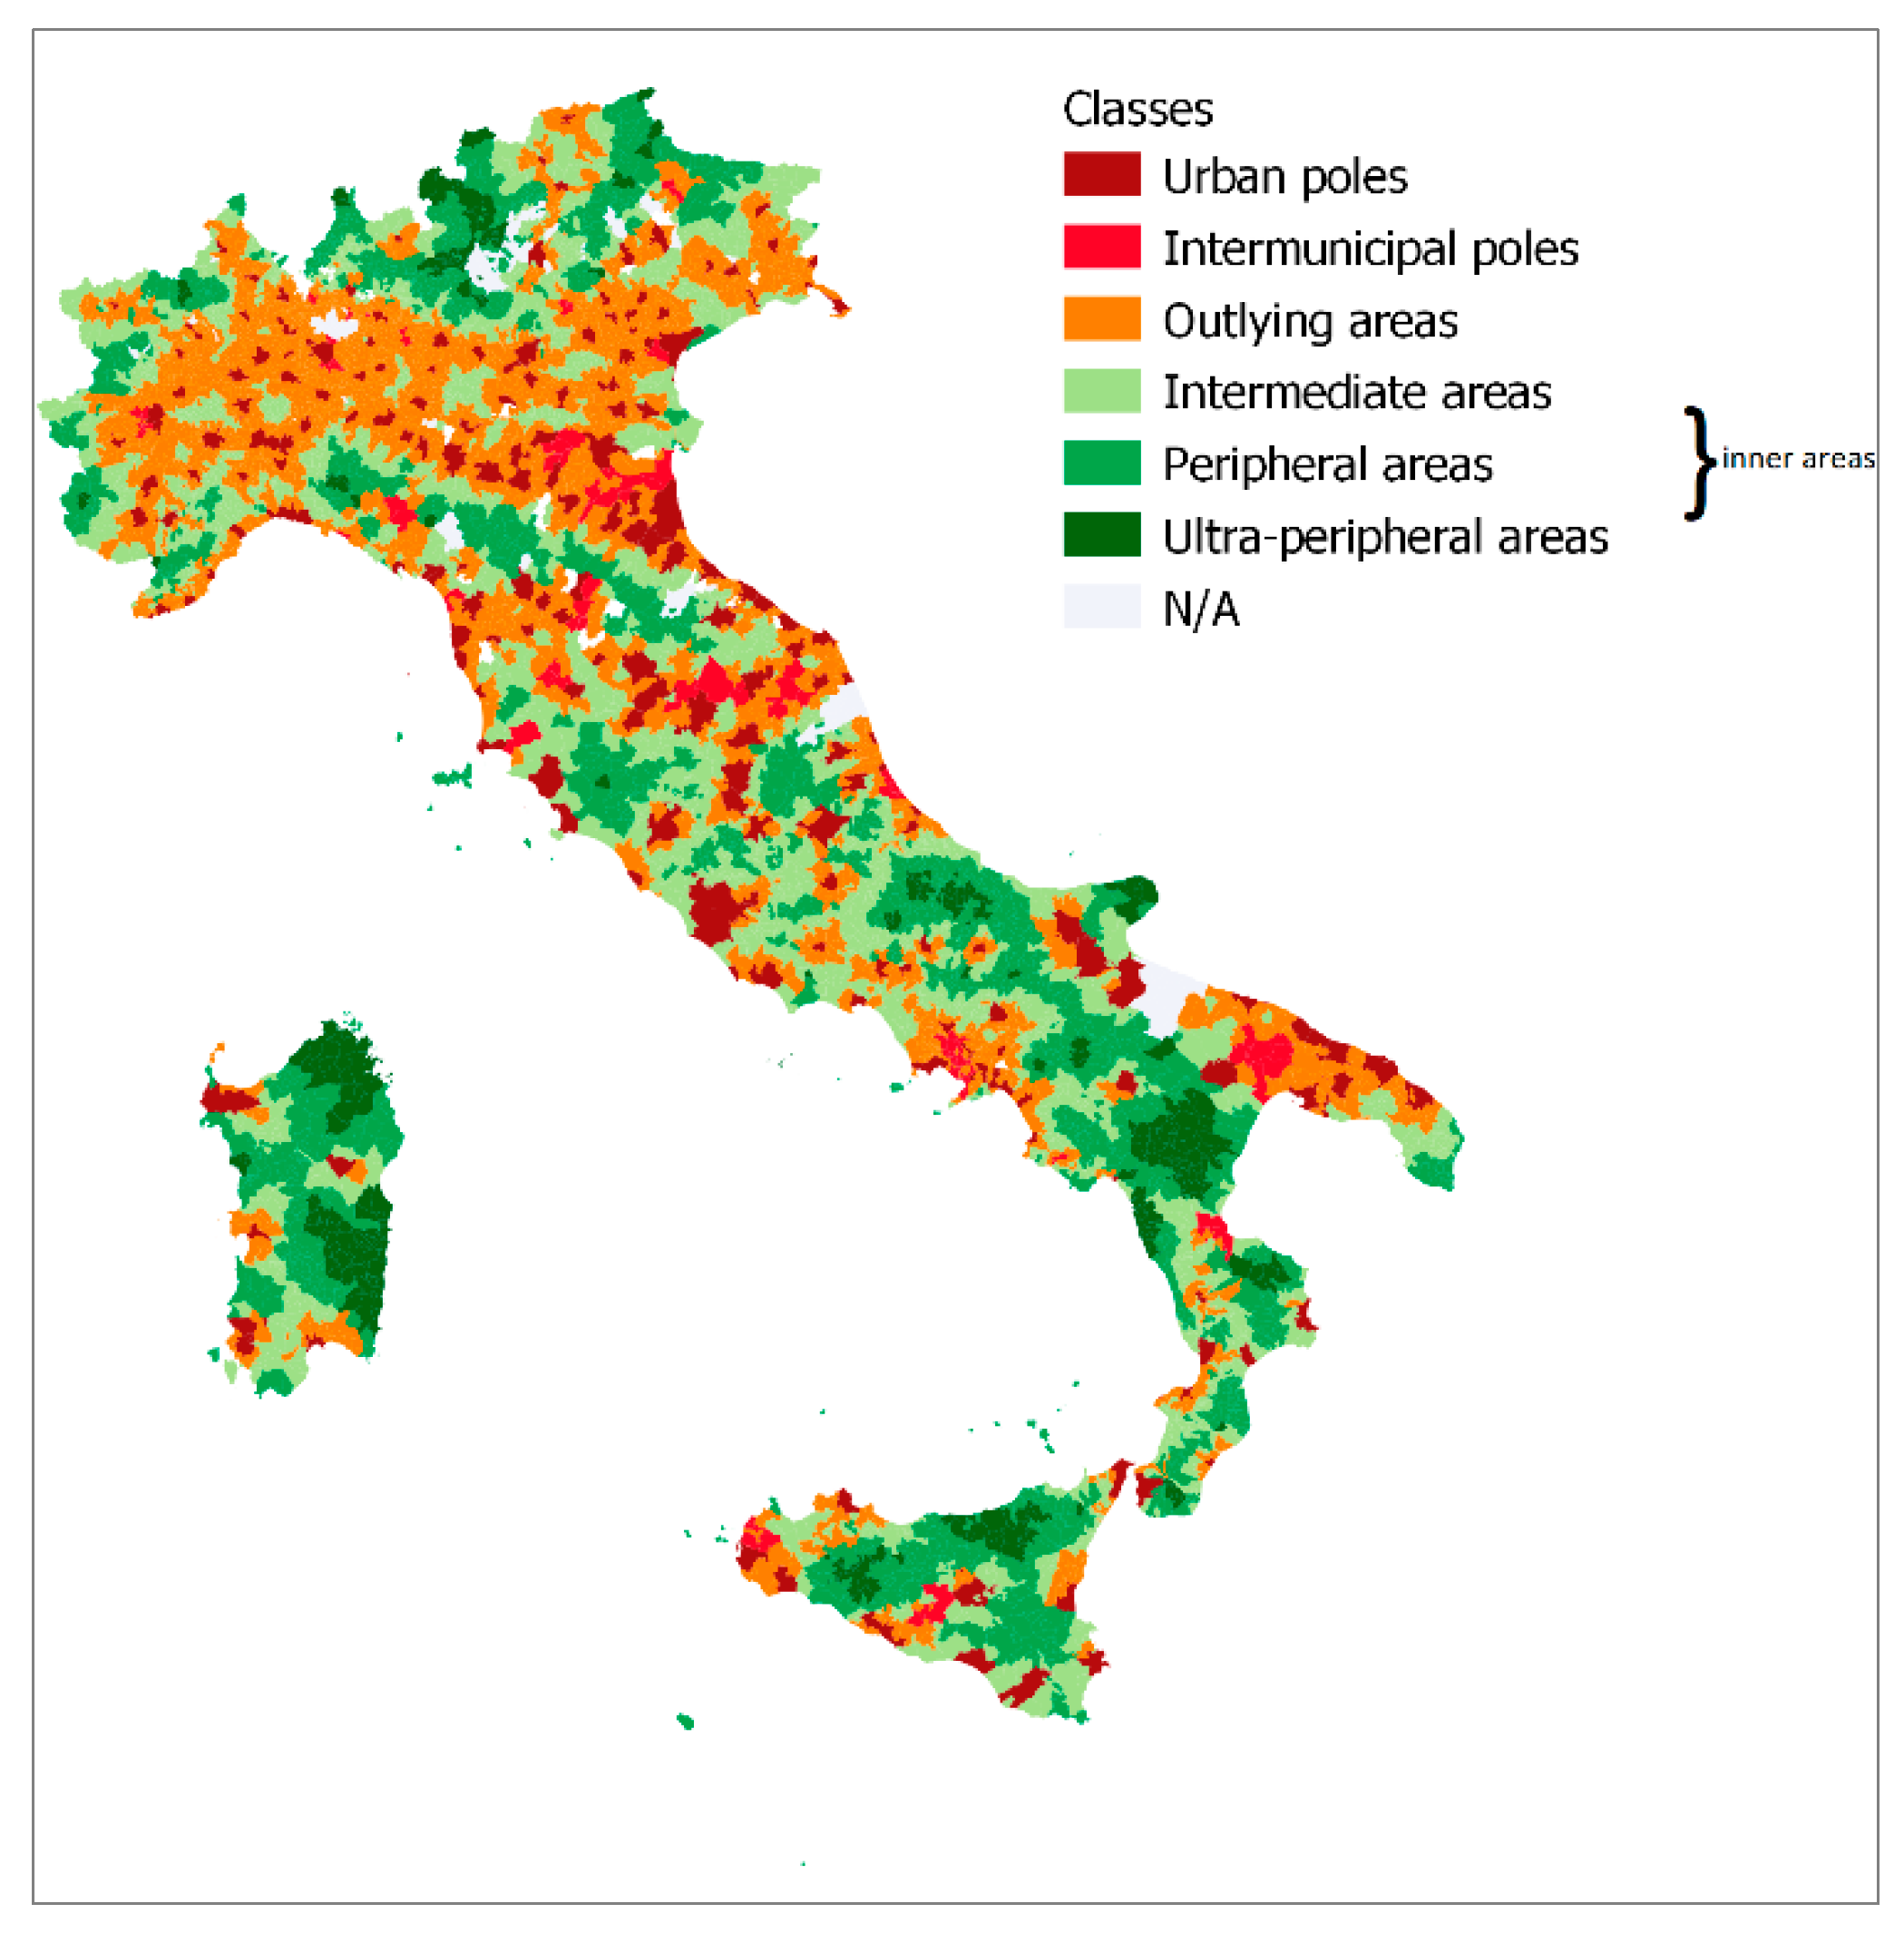
9] in order to gain some insight into whether a disturbance leads to rapid changes in a region’s economic structure. After the initial assessment of the degree of resistance, this paper moves onto: (i) other phases that are part and parcel of the very notion of resilience to economic crises, and (ii) the urban hierarchy exploiting the classification developed within the National Strategy for Inner Areas launched in Italy in 2014 (six categories from core to ultra-peripheral areas). The assumption is that the areas so defined could be functionally meaningful socio-economic entities, providing new pieces of knowledge on the topic, and ultimately unveiling the very determinants of the capacities of different places (in terms of their prior economic growth performances and structures) to react to a nationwide disruption. This answers the crucial “of what” question, since resilience clearly depends on the consistency and relevance of the geographical units used to delimit the local economies, which we will scrutinize through the lens of this analytical framework.
Inner areas are in fact economically weak areas, because of the long-term dynamics characterized jointly by population decline, aging, reduction in employment and scarcity of local public and private services, to a degradation of cultural and landscape heritage. Therefore, these areas are potentially very exposed to decline processes accelerated by the Great Recession. Nonetheless, in comparison with urban areas, inner areas show a temporal lag in response to the crisis [
36,
37].
Hence, this paper explores the short–medium term shock-induced change in the sectoral composition of Italian poles and peripheral areas following the Great Recession. In particular, we look at the trend of structural change across space in comparison with the national average. To this end, we are interested—following the methodological approach by Dauth and Suedekum [
38]—in the relationship between local industrial composition along the urban hierarchy. We have classified Italian municipalities according to “pro-trend” (i.e., a direction of industrial change similar to that of the nation as a whole), “anti-trend” (i.e., a direction of industrial change opposite to that of the nation as a whole) or “not-significant” growth (i.e., no clear pattern of the direction of industrial change), and we will provide a detailed comparison of these groups. Our main results show that one of the impacts of the Great Recession on inner areas was to promote a change in the local industry composition even though their local industry composition was not in line with the nationally booming sectors. This could be an intriguing research path to follow in the future, given the policy implications of such information. In fact, the high spatial differentiation that we highlight displays a need for tailored policies to improve a region’s ability to rapidly react to unforeseen disruptions, while at the same time reshaping local economic environments by focusing on sectors that may drive national economic growth. This might be the case not only in the emergency post-crisis phase, but also in helping places to find and strengthen what could be the drivers of their context-specific abilities to anticipate shocks—in a word, a place-based resilience strategy.
One of the limitations of our work is that, at the moment, we do not focus on the direction of industrial change, but only on whether the Great Recession promoted a change in the composition of local industries in inner areas. Future research avenues will lead to the identification of a possible re-orientation or renewal of the inner areas of Italy in the face of a recessionary disturbance under scrutiny, possibly providing more general conclusions on the degree and nature of the resilience abilities of these areas, as well as on areas showing similar characteristics in other countries. In this sense, we look at the factors influencing a change in the economic base from one state (pro-trend/anti-trend) to another, if this were the case.
Ultimately, a follow-up of our work could contribute to filling the gap identified within the theoretical and analytical framework underpinning our study; namely, the impact that major shocks might have on long-run regional growth patterns, and thus whether disturbances could set in motion (positive) structural changes in a local economy.
Our results clearly point at a heterogenous response to the recessionary shock of urban poles and peripheral areas. Besides the relevance as a research question, from a policy perspective (especially for strategies intended to cope with uneven regional development which could be in part due to differential in resilience capacity, see [
39]), this is extremely relevant to unveil the factors fostering a region’s recovery trajectory with a more favorable outcome, thus with a higher growth potential than its pre-shock trend and inform policy-making in the direction of more context-tailored strategies for preparedness to and recovery from economic disruptions.
This paper is structured as follows:
Section 2 outlines the data and methodology of the analysis;
Section 3 describes the main results, which are further discussed in
Section 4; and
Section 5 concludes.
2. Data and Methodology
As discussed above, the impact of shocks on long-term growth is more deserving of study than has traditionally been recognized, a shortage acknowledged by various scholars [
9,
12,
40]. Accounting for the evolutionary development path of places over time and disentangling the changes following a major shock brings about analytical and methodological challenges. This is due to the blurring between a single event and process-based change [
12], as well as the recursive nature of the relationship between the features and structures of a region’s economic growth and resilience [
9].
Being aware of this, our aim is to provide some insights on the effect of a discrete recessionary disturbance on areas that have been challenged by slow-burn pressures over a time span of almost seven decades (since the 1950s). Concerning the spatial units of our analysis, we relied on the classification produced by the National Strategy for Inner Areas (SNAI), which was launched by the Italian Minister for Economic Development in 2014. This allows us to focus on clearly identified areas that are very likely to have undergone negative path-dependence processes, locking them into a socio-economic decline. As stated in the official document of the strategy [
41], many inner areas have faced a reduction in the man-made environments because of aging, depopulation [
28,
42,
43,
44,
45,
46], dwindling employment and use of territorial capital, coupled with a progressive decline in offers of local public and private services. Inner areas are interpreted as areas located at a considerable distance from centers providing essential services (namely education, health and transport). Methodologically, “service provision centers” were identified as those municipalities (A: urban poles of attraction) or groups of neighboring municipalities (B: intermunicipal poles of attraction) able to simultaneously provide a full range of secondary education, at least one emergency care hospital and at least one railway station providing metropolitan/regional journeys. The identification of these centers was followed by the classification of the remaining municipalities into four bands: (C) outlying areas; (D) intermediate areas; (E) peripheral areas and (F) ultra-peripheral areas. This was carried out using an accessibility indicator in terms of the number of minutes taken to get to the nearest hub. The bands were defined based on distribution of the distance in minutes: <20 min for outlying areas (C); 20–40 min for intermediate areas (D); 40–75 for peripheral areas (E) and >75 for ultra-peripheral areas (F). The last three classes (D, E and F) are labeled “inner areas” (see
Figure 1).
Having defined the units of our empirical analysis, and the rationale for choosing them, we used one variable to proxy resilience: employment (no complex index) disaggregated by industry, according to the statistical classification of economic activities of the European Community, Nace (rev 2), which is provided by ISTAT (Italian National Institute of Statistics). We excluded from the analysis public and agriculture sectors as no reliable information was available for them.
The dataset provides information on employment at the municipal level (NUTS3 equivalent). In order to avoid excessive zeros and small number issues (such as high volatility over time), we focused on industrial activities at the two-digit level. Data cover a decade, from 2004 to 2014, which can be almost symmetrically split into a pre-recession (2004–2008) and post-recession (2009–2014) period.
The sectoral mix in the two sub-periods gives us a clear idea of the local level trends in industrial composition compared to the national trend. To this end, we drew on the methodology proposed by Dauth and Suedekum [
38], which we found particularly useful for our purpose. We also built on a previous work of ours ([
46]; see Step 1 and 2, see below).
Our empirical strategy can be classified into four steps:
Descriptive statistics—We started with a descriptive analysis of trends over time to identify possible differences along the urban hierarchy between areas with a different degree of peripherality, according to SNAI’s terminology [
41] (p. 25);
Defining the Excess of change—The second step, following Dauth and Suedekum (2016) [
38], was to look at the changes in sectoral composition before and after the Great Recession, defining a sort of excess of change (
ECm) at the municipality (
i) level—as compared with the national level—for each industrial sector (
s):
where
is the percentage change of employment in sector
s in municipality
i, and
is the change of employment in sector
s in the country (Please note that we adopt weighted sectoral growth rates for both class of inner areas (A, B … F) and at national level (see [
16] for details).
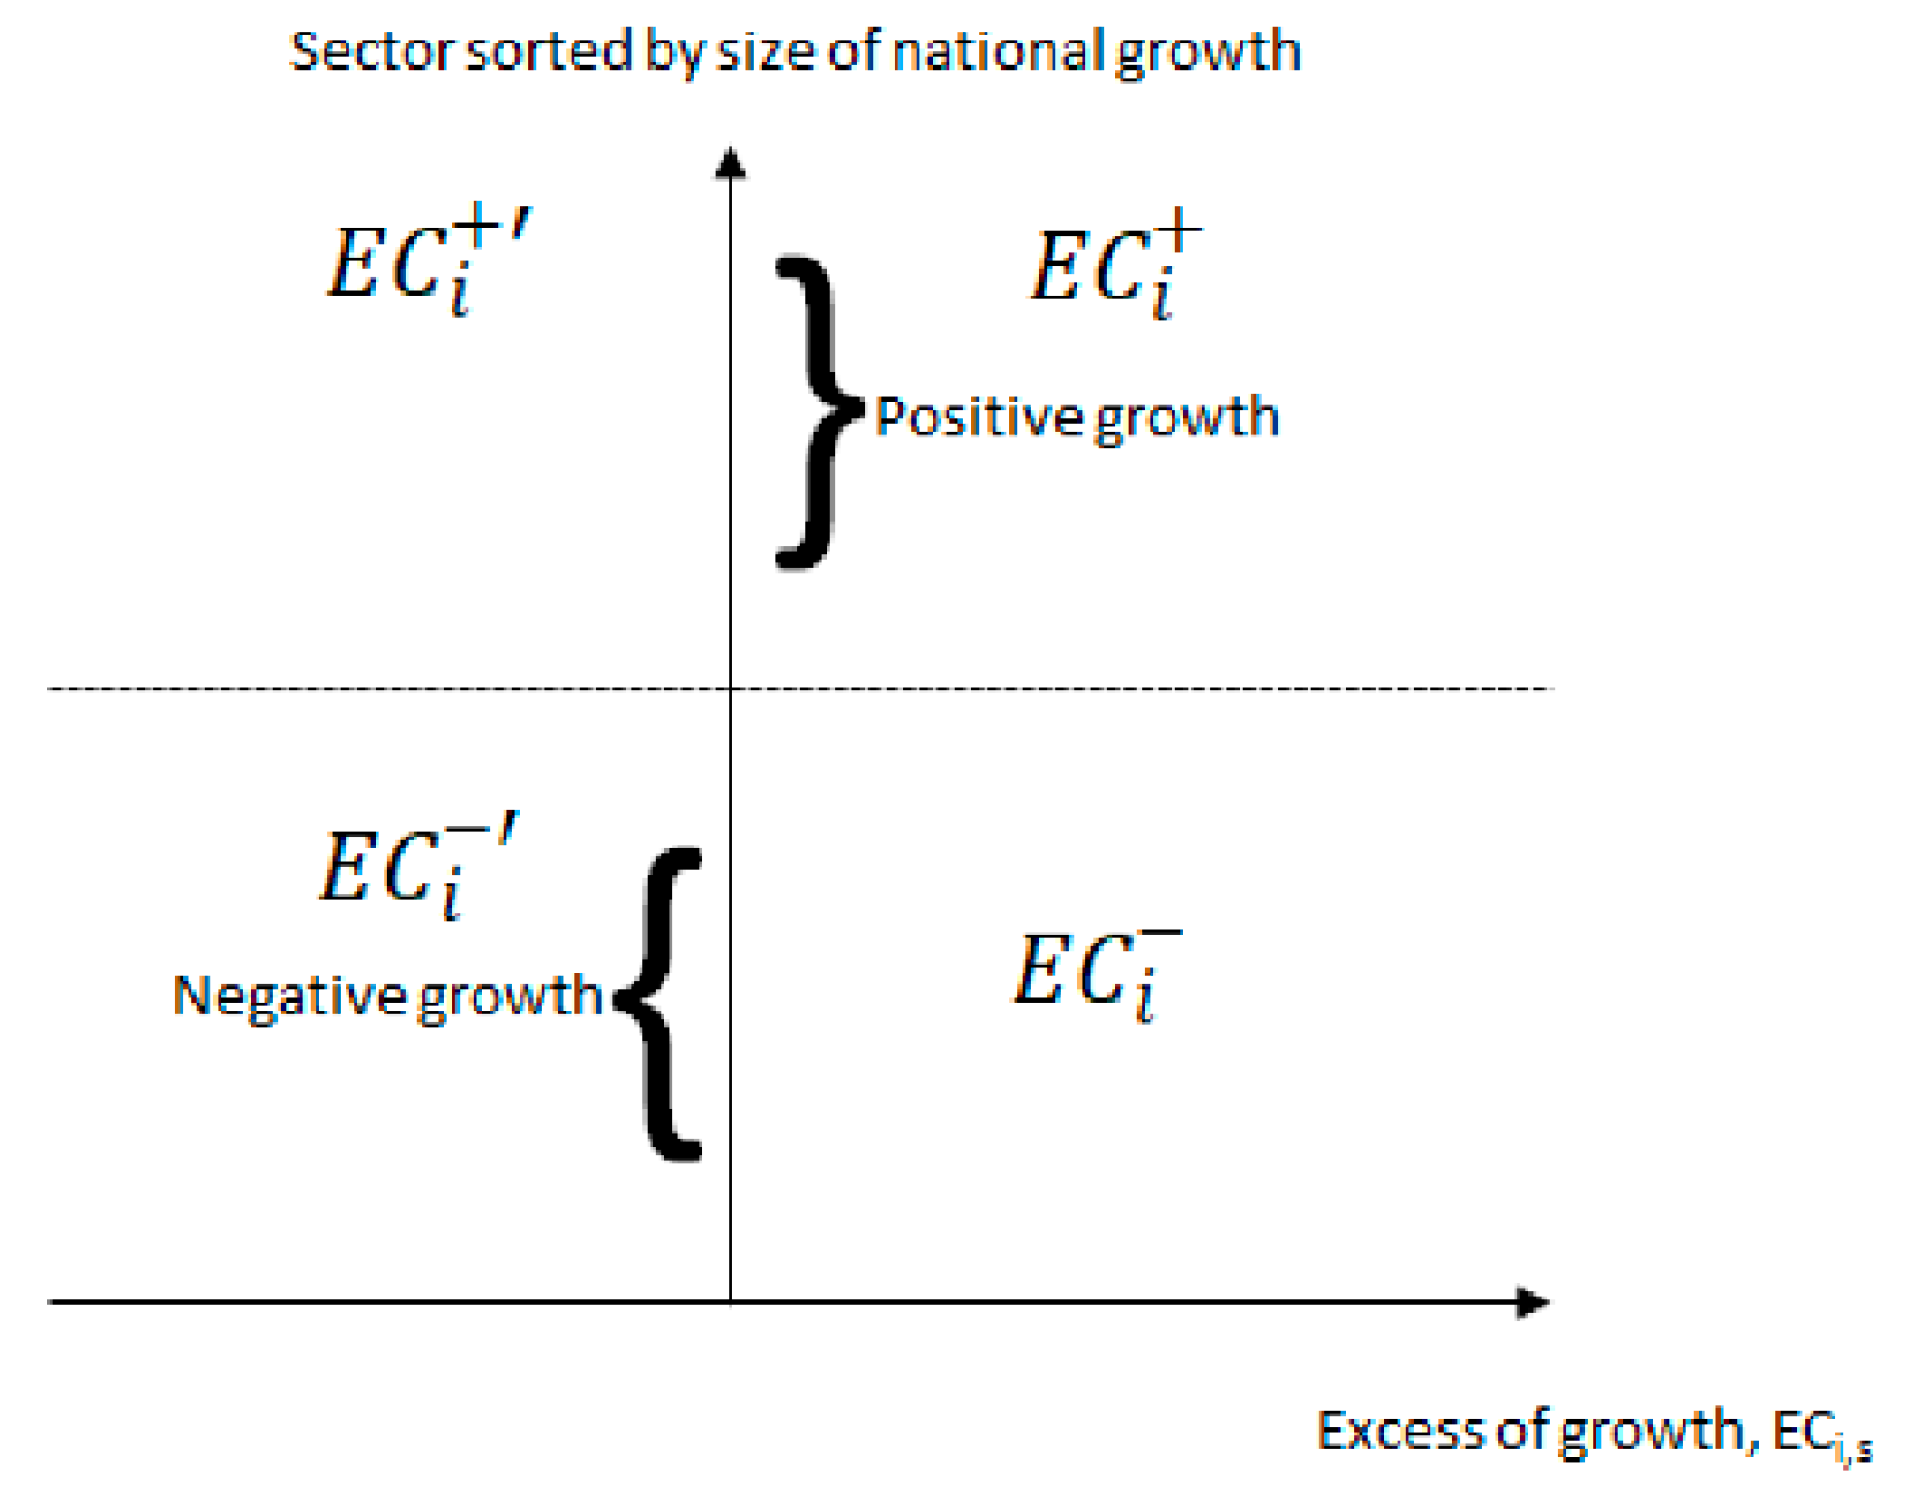
If we divide the excess of change according to sectoral national growth, we take the null sector,
s0, as the benchmark (see
Figure 2) to obtain four different areas:
if
if
if
if
All amplitudes for area imply excess growth in sectors that at the national level have expressed positive growth in municipality i, whereas amplitudes in area imply excess growth in nationally declining sectors. On the contrary, it is possible to see above-average decline in increasing and declining industries for area and , respectively.
In order to take into consideration the peculiarities of different inner areas, with particular reference to the distinction between urban and rural areas and in line with Dauth and Suedekum (2016) [
38], we applied this idea to the different municipalities classified by SNAI categories (six from A (center) to F (ultra-peripheral)). Therefore, for each group
a = {
A,
B,
C,
D,
E,
F} with above- and below-average growth,
g = {+,−}, we computed the average excess change according to their reference group and average growth (
).
We then calculated the following shares for every municipality:
Finally, we calculated the average of these shares
,
,
,
. The optimal rules of thumb in order to assess if the municipalities were pro-trend or anti-trend are as follows (see [
16]):
Pro-trend:
if g = +: and
if g = −: and
Anti-trend:
if g = +: and
if g = −: and
Figure 2, presented above, can help us distinguish areas as pro-trend vs anti-trend in this way:
- -
If a municipality grows more than the nation in growing sectors at the national level (Area ), and declines in declining sectors at the national level (Area ) then it is “pro-trend”.
- -
Oppositely, if most of the excess of change lines are in the Areas and , municipalities are defined as “anti-trend”.
- 3.
Detecting the Switch—We applied Step 2 to the pre-crisis (2004–2008) and post-crisis (2009–2014) periods, identifying whether or not the industrial composition of each Italian municipality followed the national trend. We then compared the pre- and post-shock periods to define municipalities that switched in terms of their direction of trend.
- 4.
Finding its Determinants—Finally, we inferred which characteristics affected the pro-trend and anti-trend municipalities, and which “switched” between the two through a logit model.
3. Results
Drawing on previous empirical evidence [
46] resulting from an examination of employment trends (Step 1), we found that peripheral areas had a two-year delay and a deeper recession. This double dip could be a testament of two crises of different natures: a first, financial one, more strongly affecting urban areas; and a second, economic one (namely concerning the proper real economy), more severely impacting peripheral areas. Among the poles, it was actually the areas surrounding the big cities (Outlying areas in the SNAI’s nomenclature) that performed the best. This is compatible with Faggian et al. [
37], but also Dijkstra et al. [
47], who found that, in fact, the intermediate regions in Europe responded to the economic crisis the best. Some other studies, however, point to the underperformance of peri-urban hinterland areas compared with city cores as contrary to what could be expected from a favorable combination of urbanization economic (available in proximity to metropolitan cores) and lower prices [
48,
49]. Even more interesting, metropolitan cores proved to be resilient partly by pushing the recessionary shock to the outlying areas [
48]. It must be acknowledged thus that, at the European level, there was no clear, uncontroversial pattern of economic growth or decline in response to the Great Recession, in regards to urban vs outlying regions.
Looking at inner areas, intermediate (D) and peripheral (E) areas showed a similar behavior, with two specular drops in growth rate in 2011 and 2013. More interesting is the trend of ultra-peripheral areas (F), which deviated from the other inner areas. In fact, the Great Recession seems to have affected them with a one-year delay, and the decline in employment growth, once started (in 2009), lasted longer (two years) and had a greater magnitude. However, recovery occurred at the same pace as the remaining inner areas, although in contrast with them (and with urban areas as well) the positive trajectory remained unaltered by the subsequent recession of 2013.
Looking at the difference in employment growth before and after the Great Recession (Step 2) of the six SNAI classes as compared with the national one, the poles clearly showed very similar trends to the national ones. This is not surprising, given that urban areas represented about 44% of the entire national employment. Moving along the urban hierarchy, from outlying and peripheral areas to ultra-peripheral ones, the differences appear to have been larger and larger. Comparing the pre- and post-shock periods, poles and peripheral areas showed a similar sectoral composition over time, with positive and significant Spearman correlation coefficients (0.24 and 0.22, respectively) between the rankings of the sectors pre- and post-recession. The recessionary disturbance did not change the economic base of urban areas, or of close belt/intermediate areas in the immediate post-shock phase. In contrast, all remaining areas showed a change in their sectoral mix due to the financial–economic crisis.
Was this change to re-align with the national trend, or to move farther away? Answering this question might pose interesting insights into policy, and hence it is the focus of the next section.
3.1. The Geography of Pro-Trend and Anti-Trend Municipalities
Table 1 shows the distribution of “pro-trend”, “not-significant” and “anti-trend” municipalities before and after the Great Recession.
The recessionary shock caused a reshuffling of the Italian municipalities within the 3 classes we are considering, with a reduction (−13.1%) of Pro-trend areas almost completely in favor of Not Significant ones.
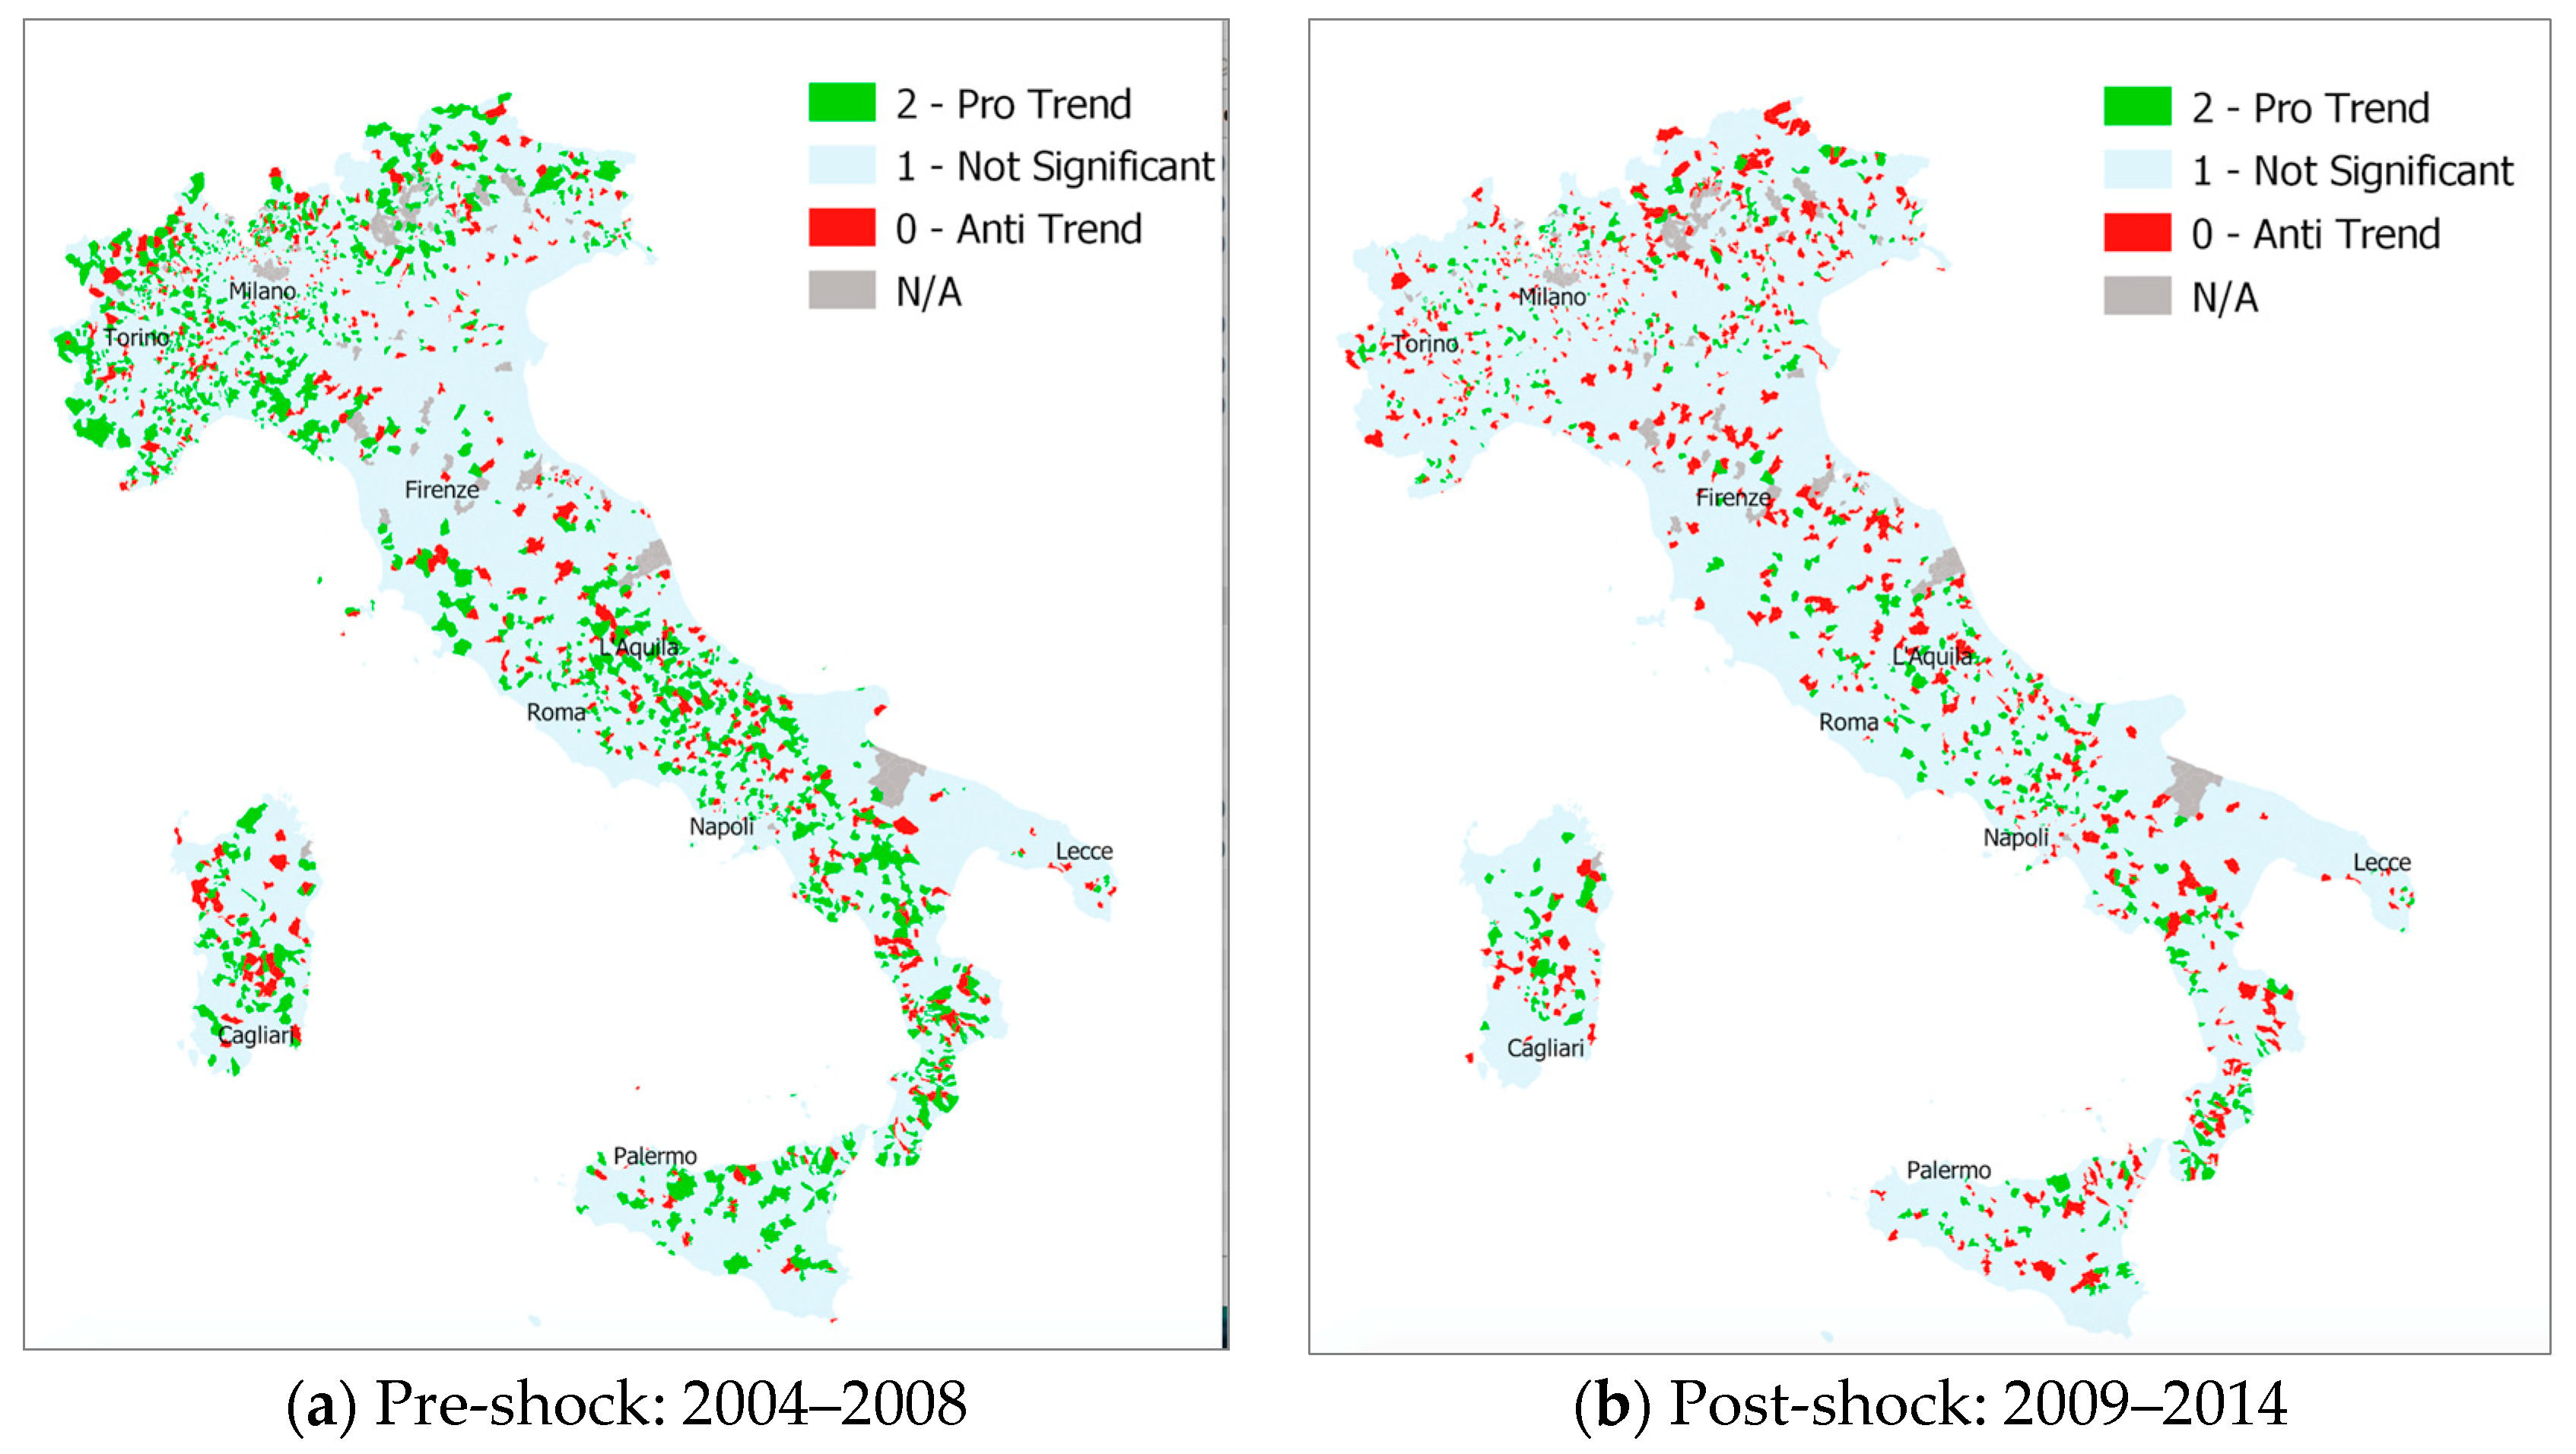
Figure 3 illustrates the geographical distribution of pro-trend, not-significant and anti-trend municipalities in the two sub-periods we identified: (a) pre-shock (2004–2008), and (b) post-shock (2009–2014).
More specifically,
Figure 3a shows how in the pre-shock period, pro-trend municipalities were mainly located along the two mountain ranges in Italy (i.e., the Alps and the Apennines), where many inner areas are located (see
Figure 1). Many of the not-significant municipalities were located in regions leading the Italian economic system (namely Veneto, Lombardy, Emilia Romagna and Tuscany). Anti-trend areas were slightly more heterogeneously distributed across the country, but with similar patterns as in the pro-trend areas.
Following the Great Recession, the geography of pro-trend and anti-trend municipalities changed dramatically in favor of anti-trend areas and, to a lesser extent, to not-significant ones. In other words, the number of municipalities that grew more than the country in nationally growing sectors, and that declined in nationally declining sectors, dropped considerably after the shock, especially in inner areas. What is worth noting is that municipalities that showed opposite trajectories with respect to the national ones grew most significantly in the Northern–Central part of the country, which was the one closest to the national sectoral composition before the global financial–economic crisis.
These results call for a deeper investigation to understand whether—and where—the recessionary shock produced a shift in terms of local industrial profile trends.
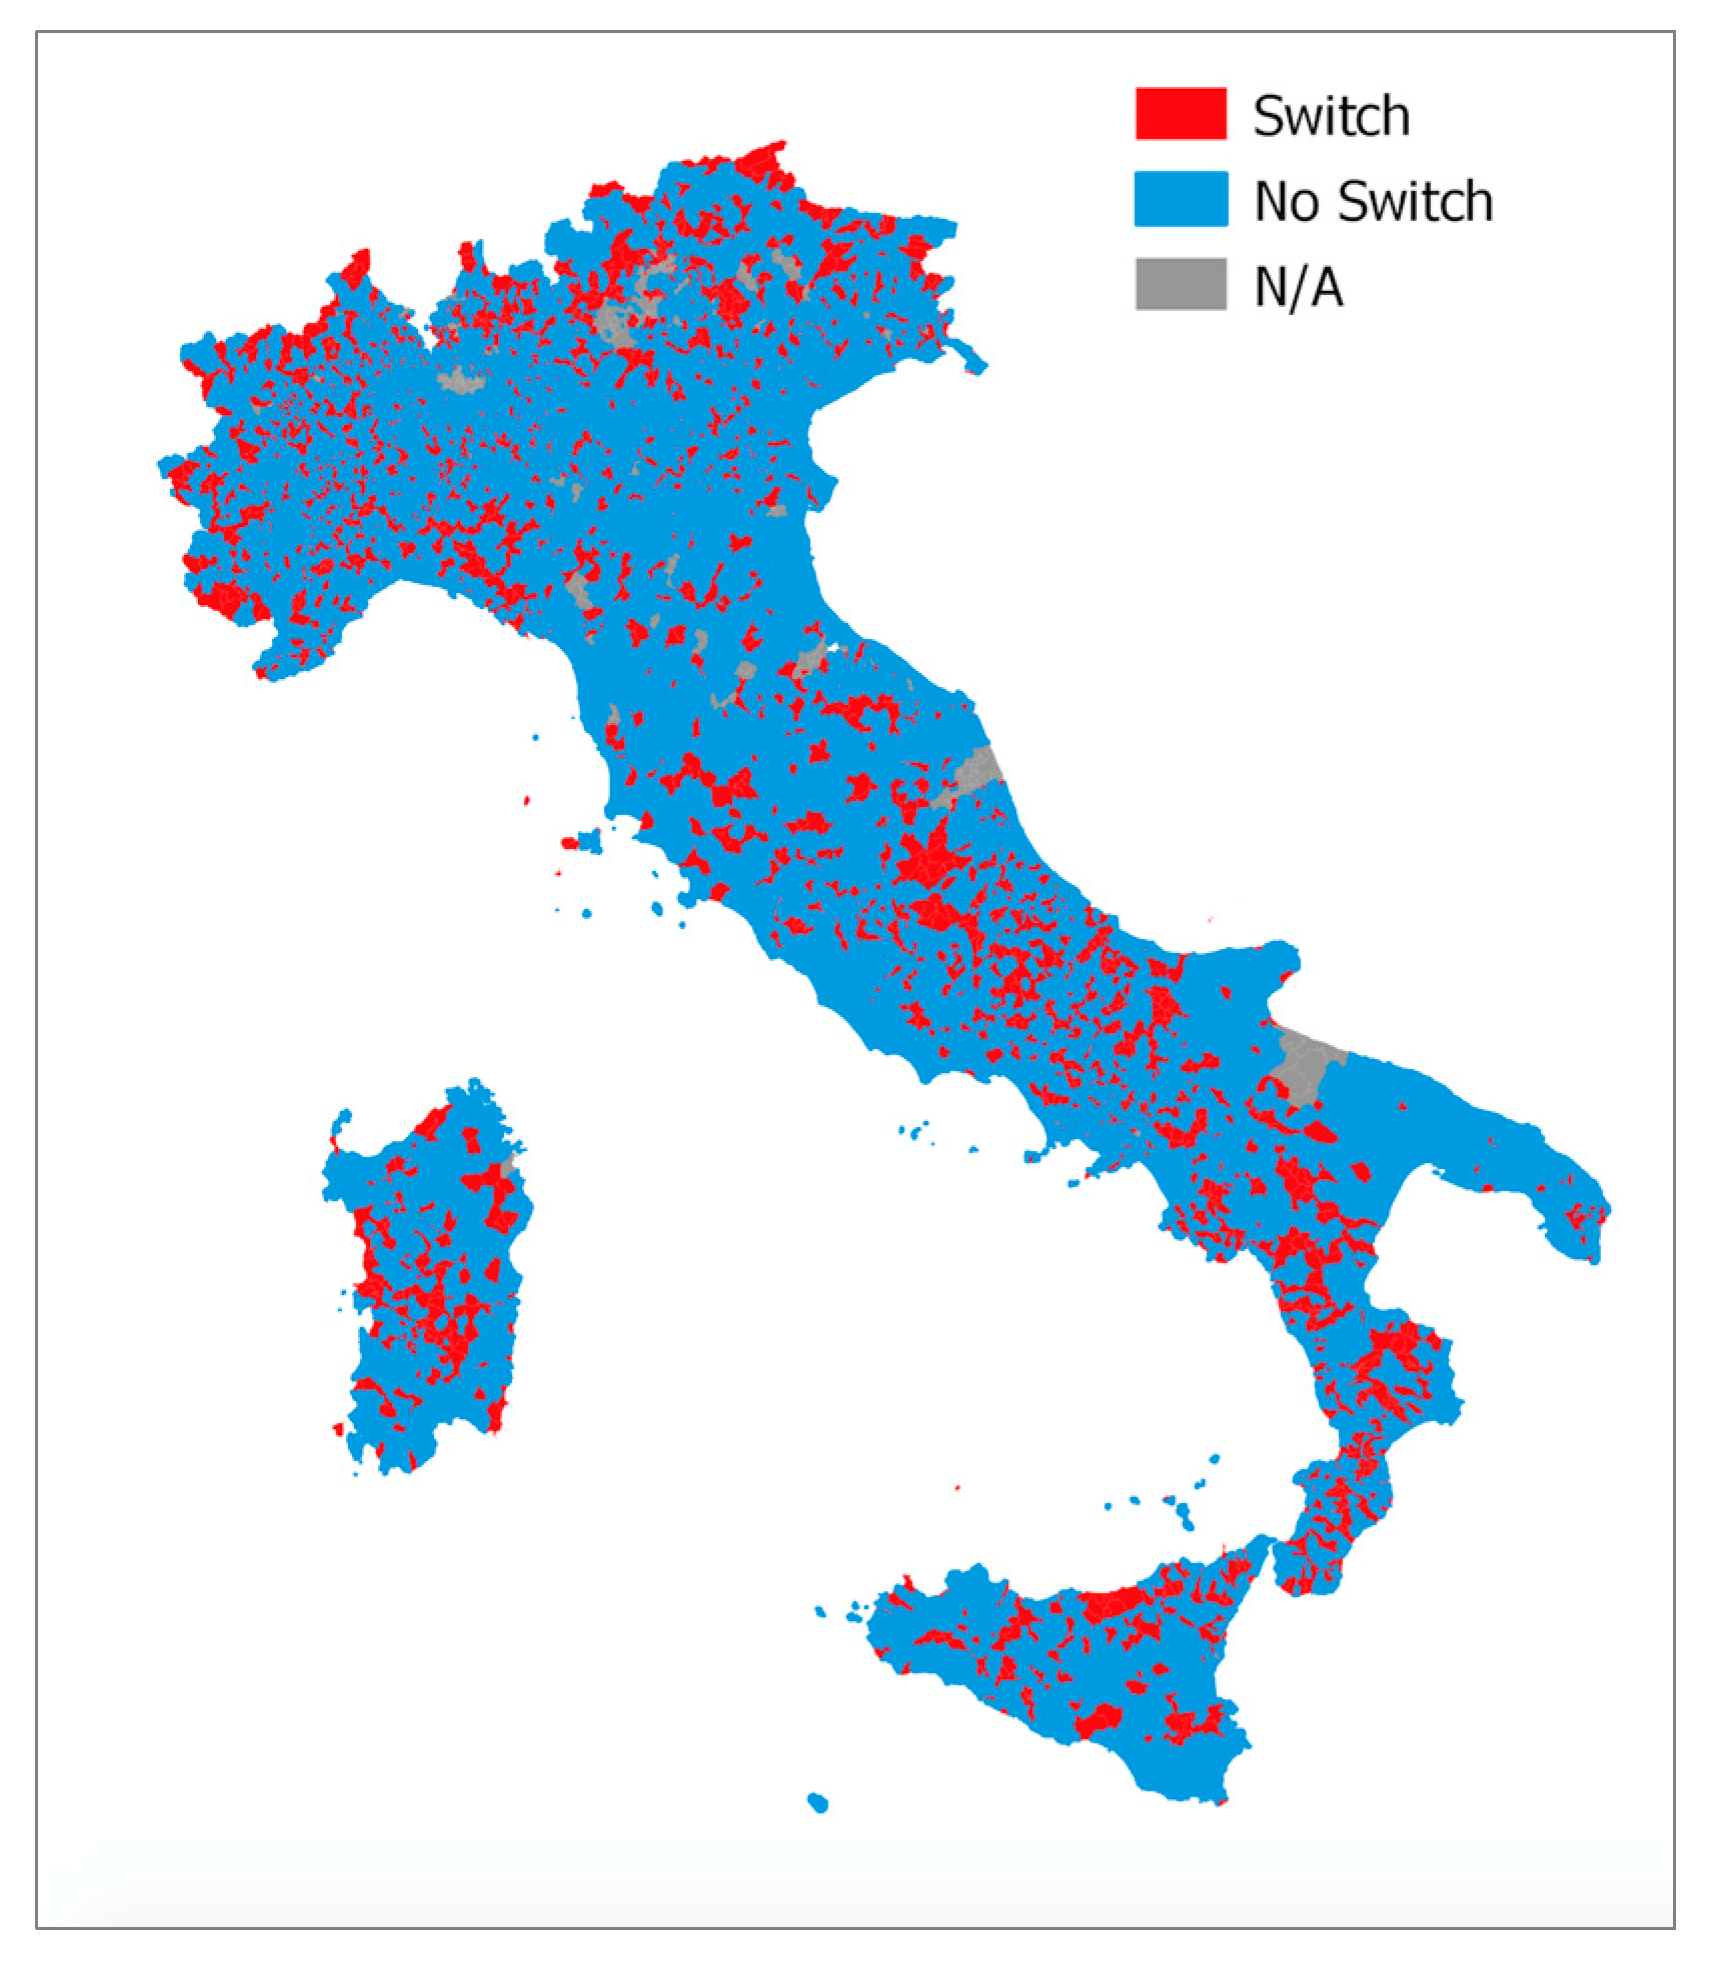
3.2. A Geography of the “Switch”
Figure 4 shows the geography of “switching” municipalities; that is, those municipalities that moved from their initial state towards another one after the Great Recession as compared with “not-switching” municipalities, which remained stable following the shock. 36.3% of the municipalities (
Table 2) changed the direction of their trend (pro- vs. anti- the national trajectory) after the crisis.
Most of the switching municipalities were located in inner areas, as shown in
Figure 4.
4. Discussion
Having mapped the spatial distribution of the switching vs not-switching areas, the next step of analysis is to try and uncover what were the factors underlying the “geography of the switch”.
In the previous section, we showed the industrial composition changes of Italian municipalities by differentiating the peripheral gradient of the areas. We found that inner areas seemed to be more prone to reconfiguring their sectoral mix due to the Great Recession. However, we have not yet provided any explanation of this switch. The aim of this section is therefore to shed light on the determinants of this switch between the two periods. Thus, our dependent variable is the switch, which might be seen as a proxy of the restructuring of economic sectoral composition following to the shock.
We start by looking at the switch with a logit model whose dependent variable was simply 1 if the area switched, or 0 otherwise.
Our control variables included geographical, economic, social and political factors. In particular:
Dummies for different degrees of peripherality (SNAI categories);
Population and population density: number of inhabitants and inhabitants per km2 (Census 2011);
Share of employment in public services: composite indicator (Atlante Prin-Postmetropoli 2011) including employees in the public administration over total population, employees in state education over total population, employees in public health;
Education: percentage of people aged 15–24 who did not attend a regular course of study (Census 2011);
Poverty: households with potential economic discomfort (Census 2011);
Income (log): average income per household (Ministry of Economy and Finance 2011);
Female condition: male employment rate over female employment rate (Census 2011);
Social capital (Composite indicator from Nannicini et al., 2012);
Density of business: number of local units per km2 (Atlante Prin-Postmetropoli 2011);
Dependency ratio: age–population ratio between population in, and population not in, the labor force (Census 2011);
Affordability index: percentage of average annual income needed to pay an average mortgage annual payment (own calculations on Ministry of Economy and Finance 2011);
Inequality index: Gini index (Atlante Prin-Postmetropoli 2011);
Political rights: turnover of 2014 EU Parliament election (Ministry of Interior 2014);
Dependency on agriculture: number of cattle per person (Agricultural Census 2010).
Summary statistics are provided in
Table 3 (correlation matrix available upon request).
We estimated the following logit model:
Results are provided in
Table 4. It is interesting to note that the probability of switching, namely the probability for a greater magnitude of change in local industry composition over time, compared with the average national pattern of structural change, increases with the degree of peripherality of the municipality (i.e., 0.9 for outlying areas and 1.4 for ultra-peripheral areas). In other words, the more peripheral the area, the more likely it is to switch. This probability is clearly higher when looking at the basic model (model 1) in
Table 4, as including more controls attenuates the effect.
Our results show that places are more likely to switch if they are smaller (in terms of population size), if they have a lower share of employment in public services, if they have a lower level of education and if they have a lower level of social capital. It is worth noting that the main determinants for switching are also the main features of Italian Inner areas, where poor institutions, prolonged high-skilled out-migration of young people and a scarce endowment, or dissipation over time, of relational capital are part and parcel of—or co-evolve with (to use an expression proper to the Evolutionary Economic Geography approach)—their long-term often precarious development trajectories.
These results show an inherent potential weakness of peripheral areas: they suffer the most from the depopulation process and youth migration, as they are not poles of attraction for the people who are more likely to confront economic shocks.
According to what we underlined above, we know that inner areas show a local industry composition that is not in line with the nationally booming sectors (i.e., manufacturing sectors are quite relevant in peripheral areas, while other key sectors at the national level are not). However, so far, we only know that one of the impacts of the Great Recession on inner areas was to promote a change in local industry composition, with no clue as to the direction of change. This could be an intriguing research path to follow in the future, given the straightforward policy implications of such an analysis.
5. Conclusions
The search for new paths to resilience of peripheral regions is a fascinating research topic from a transdisciplinary and also a policy-oriented perspective. The ultimate objective of our study is to provide insights into the diversity, variety and also unevenness of the multifaceted processes underpinning the capacity of places to restructure their sectoral composition following a recessionary shock.
Our results encourage further analysis by addressing questions into what kind of resilience these areas can cultivate, and by investigating the role played by prolonged slow-burn challenges that are often corrosive to the ability of regions to adapt or (more desirably) anticipate change.
We found that inner areas showed a higher probability to switch from the pre-shock structure of their industrial profile to another. This is very interesting, in that it indicates a higher capacity to adapt to, or a lower propensity to resist, the disturbance produced by the Great Recession. The relevant weight of manufacturing on the overall economic base of Italian inner areas, however, may underline a low propensity to innovate and transition quickly into another sectoral composition under the new conditions—in other words, it may result in a scarce ability to answer to a recessionary shock.
This calls for special academic and policy attention. If we acknowledge the idea that shocks, and the magnitude of their impact, are often closely intertwined with the unfolding of broader, long-run slow-burn processes of change [
7]—which have a high spatial differentiation—then proper, tailored policies are needed to improve regions’ abilities to rapidly react to unforeseen disruptions. Focusing on the notion of resilience could enhance our understanding of the factors influencing the development of regions and the scope for appropriate policy responses, not only in the emergency post-crises phase, but rather in helping regions find and strengthen what could be the drivers of their context-specific abilities to react. In a word, a place-based resilience strategy is needed.
Building on this work, several extensions and research avenues open up. Aside from refining the model, some future steps may include: studying the direction of the switch and all the possible combinations (we do not know a priori since we should look at the direction of change); progressing further in the investigation of the characteristics of the different areas and, in particular, of the differences by sub-groups classified according the degree of peripherality. Moreover, the post-crisis period is not so “post” in reality. It could therefore be useful to expand our dataset so as to account for longer post-shock times. We could divide these further in two sub-periods, to test and better explore the effects of the double dip on peripheries, and to better disentangle the impact of a first disturbance, more financial in nature, and a second one, more economic in its character. This might explain the lag in the decline of inner areas after the first financial crisis.
Knowing how the sectoral composition of these areas changes following this kind of shock could give us a clue on the untapped potential of the resistance of industrial sectors that have so far been ignored for not performing better at the national level and, within inner areas themselves, on how and to what extent the geography of a switch overlaps or interacts with the geography of resilience.


