Article

Evaluating the Cooling Potential of Urban Green Spaces to Tackle Urban Climate Change in Lisbon

Universidade de Lisboa, Institute of Geography and Spatial Planning (IGOT), Centre of Geographical Studies, Rua Branca Edmée Marques, Cidade Universitária, 1600-276 Lisboa, Portugal
*
Author to whom correspondence should be addressed.
Sustainability 2019, 11(9), 2480; https://doi.org/10.3390/su11092480
Submission received: 10 March 2019 / Revised: 17 April 2019 / Accepted: 22 April 2019 / Published: 27 April 2019
(This article belongs to the Special Issue Urban Green Infrastructure and Climate Adaptation)

Abstract

:
The increase and optimization of urban vegetation has been considered an effective mitigation measure of an urban heat island (UHI), with positive effects on human thermal comfort. In this study, the cooling potential of all green spaces in Lisbon was estimated. For that, several mobile measurements of air temperature data were made in a single park (Gulbenkian’s Garden). These measurements were used for the interpolation of air temperature. Furthermore, urban biomass was estimated using remote sensing products, namely Landsat satellite images. Ultimately, a linear regression model was built from the relation between vegetation density and air temperature. Results regarding the estimation of biomass (AGB) in the city of Lisbon were higher in winter than in summer. The urban green spaces cooling potential model showed that for every decrease of 1 °C in air temperature between a measuring point and a reference station we need to increase the area covered by vegetation by 50 m2 (planar measure). This methodology can be applied in other urban areas for the quantification of the cooling effect provided by vegetation in order to improve urban climate thermal conditions and human well-being and, consequently, to mitigate some consequences of future climate change.

Graphical Abstract

1. Introduction

The fast process of urbanization has caused drastic changes in soil use and, especially in urban areas. The most pronounced modification is the increase of temperatures within cities, comparatively to the surrounding countryside. One of the most effective mitigation measures is the increase and optimization of urban green spaces. In fact, vegetation has been considered a key element for the quality of life of urban population, especially considering climate change scenarios induced by anthropogenic activities, with several consequences in health and human thermal comfort.
Green spaces provide other ecosystem services in addition to urban climate improvements on bioclimatic comfort: maintenance and conservation of biodiversity, air quality (absorption of atmospheric pollutants and particles; reduction of CO2 levels; release of oxygen; fixing of dust) and water quality, protection from strong winds, reduction of noise levels, hydrological benefits (decrease in surface runoff and in the frequency of floods through interception of precipitation and increase of soil water retention), reduction in risk of soil erosion and sociocultural (recreation areas, aesthetic appreciation of landscape) and economic benefits (for example, valuation of real estate) [1,2,3,4,5]. However, in this study, the focus is on urban vegetation thermal benefits, namely the reduction of air and surface temperature through two physical processes: on one side, the shadow effect that consists in the interception of solar radiation, reflecting it in larger quantities and reducing the absorption and storage of energy by urban surfaces and, consequently, the atmospheric heating [5,6,7,8]. On the other side, evapotranspiration consists in the loss of water to the atmosphere from a plant [9]. Then, there is an energy consumption of the surrounding environment, increasing latent heat and humidity and, consequently, reducing air temperatures [10]. Thanks to these two processes urban green spaces are, in general, cooler than their surroundings and this effect is called Park Cool Island (PCI), also known as Cool Island Effect, that is, the difference between air temperature inside and urban green space and the built area around.
Several studies evaluated the factors that influence the development and intensity of PCI [11,12,13,14,15,16,17] and concluded that one of the key elements corresponds to the type and characteristics of vegetation inside green areas. For that purpose, Normalized Difference Vegetation Index (NDVI) is usually used to quantitatively assess urban vegetation. NDVI corresponds to a normalized index that allows for the detection and quantification of vegetation trough a difference ratio between near infrared band and the red band of the electromagnetic spectrum. This index has a range between −1 and 1 (surfaces completely covered by vegetation) and the intermediate values represent areas with weak or no plant cover, namely water bodies, sand, snow, etc. However, its interpretation is vague at a dimensionless scale of analysis. For this reason, Above Ground Biomass (AGB) can overcome some of these disadvantages. According to [18], vegetal biomass corresponds to the biologic material from living organisms, mainly plants. Therefore, it´s a very useful indicator in urban planning since the relation between NDVI and AGB allows to estimate the amount of vegetation necessary to reduce 1 °C in urban air temperature [19].
AGB can be estimated using destructive and non-destructive methods with remote sensing products. Considering the difficulties in the implementation of traditional methods, several researchers chose to monitor and mapping vegetation using remote sensing methods. Even though they’re still in an experimental phase, several studies confirmed that the use of satellite images can be very effective in the estimation of AGB with acceptable errors (e.g., [20]).
Concerning the quality of remote sensing information, several types of platforms can be used to estimate AGB at national, continental and global scale [21,22]: radar images and high-resolution data like aerial photographs; satellite images with high resolution (e.g., IKONOS and Quickbird platforms), medium resolution (e.g., Landsat platforms, with 15 to 100 meters) and low resolution (superior to 100 meters, like SPOT (Systeme Probatoire d’Observation de la Terre) Vegetation and MODIS (Moderate Resolution Imaging Spectroradiometer) platforms) can be used. The most commons models based on these types of products are multiple regression analysis, artificial neural networks, non-parametric techniques using the nearest neighbor method, and, above all, vegetation indexes derived from the spectral reflectance properties of plants. This is due to the confirmation in several studies of a significant positive relationship between these and biomass (e.g., [23]), so vegetation indexes enable the interpretation of countless characteristics of plant cover in a given area.
Of all the indexes, NDVI has been the most tested [20,24,25,26,27]. According to Lopes [28], high values of NDVI correspond to areas where plant cover is very dense, thus AGB is high.
Focusing only on the AGB estimation in urban areas using remote sensing products, the number of attempts is scarce [29,30] and the spatial distribution of vegetation is very heterogenous and fragmented, due to rapid modifications of land use at short distances. Furthermore, the amount of materials and man-made objects is high and influences strongly the growth and phenology of vegetation [29,31].
Lately, the contribution of vegetation and green spaces to the reduction of urban temperatures has received great attention [14,32], especially in the temperate zone of the globe [17]. Despite the great volume of studies, comparing and applying their results tends to be a difficult task [2,9]. First, there are often analyzed only a few green spaces (in most studies, normally one green space); the period of data collection is generally very short, limited to a few days or even a day, especially during summer [33]; and, lastly, the results obtained regarding the cooling potential of vegetation differ considerably. This is due to the climatic variable analyzed, the characteristics of urban green spaces and their surroundings, that is, the climatic and topographic framework of each garden, and the different methodologies that were used [2,34].
In view of these limitations, the definition of specific recommendations for planning, management and optimization of urban green spaces is an obvious requirement to mitigate UHI effects.
Therefore, the purpose of this study is to quantify the cooling effect of urban green spaces in the urban canopy layer (UCL) in Lisbon and to estimate the amount of AGB needed to reduce 1 °C in air temperature and to fight climate change in the near future and reduce urban vulnerability.

2. Materials and Methods

2.1. Study Area

The city of Lisbon is located on the west coast of Portugal, about 30 km east of Atlantic Ocean, on the right bank of Tagus river (Figure 1a).
Regarding the topographic features of the region, maximum altitudes range between 160 m, on the urbanized area, and 226 m, on the Monsanto hill (west part of the city). This hill is a vast forest park (990ha) created in 1934 with the primary function of leisure of the Lisbon population and constitutes a major obstacle to the penetration of maritime air [28].
The city has a temperate climate, with a moderate winter and the hot season is the driest period of the year, since precipitation concentrates between October and April. According to Alcoforado and Andrade [2,35], this type of climate (Köppen Csa) is modified by the rough relief and the proximity to the Tagus estuary and the Atlantic Ocean. These features, along with the latitudinal position, give the city a certain thermal amenity.
Currently, the available space for new vegetated areas is very limited in Lisbon, even though this scenario was very different in the past decades. The abundance and spatial distribution of green spaces has suffered notable alterations until now and it is far from being homogeneous throughout the county. According to Franco & McDonald [36], this city has over 120 local parks and gardens plus 13 urban forests with denser vegetation, from where stands out the Monsanto hill, which cover about 10% of the city’s total area. In 2006, public urban green spaces in Lisbon occupied 1303.6 ha, whereas the area covered by tree canopy and dense shrub spots corresponded to 1558 ha [37]. Mendes et al. in 2015 [38] estimated that 16.8% of the city is covered by trees.
Focusing only on trees, there are over 600 000 specimens in Lisbon belonging to about 200 different species, indigenous and, especially, exotic [37,39]. According to Soares [3], in 2011 there were about 41,000 trees in public spaces (streets and avenues), having increased in number since then. Furthermore, of the 1500 km of roads in the city, 500 km (33%) have trees. Soares [3] prepared a record of the main street trees in Lisbon and concluded that the majority are deciduous, along with 42% of trees in public gardens.
Gulbenkian’s garden (Figure 1b), the green space selected as sample in this study, has an area of 8.5 ha and is composed by several buildings (2.5 ha), while vegetated area covers the rest of the area [40]. Regarding vegetation, 34.4% corresponds to shrubs, 30.8% to trees, 29.3% to herbaceous species and only 5.5% are climbing plants. Perennial species account for 74% of total vegetation, while only 25.3% corresponds to deciduous plants.

2.2. Acquisition and Treatment of Climatic Data

In order to obtain climatic data for the analysis of the thermal behavior of urban green spaces and to interpolate air temperatures, several mobile measurements were made within and around Gulbenkian’s garden (Figure 1b). Four measurement routes (north, south, west and east) were prepared outside the green space and only one on the inside, covering distinct thermal conditions (shading vs in the sun; points with very dense vegetation vs open and wide spaces covered only with lawns; points near water bodies). All these routes took less than an hour to complete, so that the data recorded derive from different types of urban morphology, urban materials, street orientation topographic position and, mostly, the presence or absence of green spaces, and not from normal daily variation of meteorological variables [41]. A thermocouple (type k) was used to measure air temperature. All the measurements were taken, as much as possible, on days with clear sky (cloud cover equal or less than 4/8), since these conditions promote great thermal differences between urban green spaces and the surrounding built area. The data correction procedure was based on the estimation of the difference between each air temperature and relative humidity value registered in every measuring point and the same data recorded, at the same time, on a reference meteorological station (IGOT-University of Lisbon—Figure 1a).
The obtained results correspond to air temperature and relative humidity local anomalies (Δ) and were used for the interpolation of Gulbenkian’s garden thermal behavior (Figure 2 and Table 1).
A day with the least cloud cover was selected (20 May 2018) and air temperatures registered inside and in the surrounding area were spatialized in a GIS (Geographic Information System) environment, using ArcGIS software (v. 10.5.1): a shapefile with several points referring to all measuring locations was generated and air temperature data already corrected were introduced. For the interpolation the geostatistical method of kriging was chosen because it is based on the principle that points relatively close in space have a similar behavior than points that are away from each other and, for that, less correlated in space.

2.3. Estimation of Urban Biomass in Lisbon

For the determination of AGB, data from remote sensing products (Landsat 8 images) were used. This satellite was launched in February of 2013, in a polar and sun synchronous orbit at an altitude of about 705 km. This platform is composed by two sensors, OLI (Operational Land Imager) and TIRS (Thermal Infrared Sensor). Concerning the reasons of its choice, Landsat 8 images have been widely used for the determination of biomass at local and regional scales and this satellite has the most complete data series, especially available to the public [22,42,43,44,45]. Taken this into account, two Lansdat 8 images with the least cloud cover possible over Lisbon, representing summer (17 July 2017) and winter (5 February 2016), were chosen and the determination of green volume consisted in an extensively search of models based in remote sensing products that were already tested in areas with some climatic proximity to this city, with relatively simple calculations and using vegetation indexes like NDVI, previously tested and validated for this type of applications. Only three models were selected since they were the most feasible, simple and quick to test: Filella et al. [46], Pereira et al. [47] and Chang & Shoshany, 2016 [48]. [47] proposed a model for the estimation of biomass in Aire and Candeeiros Hill Natural Park (Portugal), using satellite images from Landsat 5. On the other side, [46] applied an empirical model to bushes on Northeast Spain (typical Mediterranean climate). Lastly, [48] presented a model for the estimation of Mediterranean shrub biomass from the fusion of Sentinel-1 and Sentinel-2 images. The equations presented in each study are synthetized in Table 2 and the results of their application were, then, used in a simple linear regression model to estimate the urban green spaces cooling potential of Lisbon.
For the application of these models, NDVI (Equation (1)) was calculated from the following formula:
N D V I = ( N I R R e d ) ( N I R + R e d )
where,
  • NIR corresponds to near-infrared band and;
  • Red represents the red band.
The NDVI values below 0.15 were excluded in both summer and winter situations since according to [49] this threshold is the value representative of green areas in Lisbon. The two outputs of NDVI are presented in Figure 3. For the application of all three biomass models, it should be noted that the measure units differ, reason why all results were converted to a common measure unit (kg/m2).
In general, NDVI values in Lisbon are unexpectedly higher in winter (Figure 3a) than in summer (Figure 3b). In both maps, Monsanto Hill stands out as the “lung of the city”. However, in a more detailed analysis, some of the areas with higher NDVI values (>0.6) in winter, for example on the airport surroundings, correspond to lawns that aren’t irrigated and, for that, present lower values in summer season (on most cases lower than 0.41). Furthermore, other areas (especially streets, for example Avenida da Liberdade) covered by trees present lower NDVI values in winter (less than 0.41) and slightly higher in summer.

2.4. Estimation of Cooling Potential of Green Spaces

In order to evaluate the influence of vegetation on the behavior of air temperatures, several attempts to build a simple linear regression model were made:
  • On a first attempt, the correlation between AGB and the temperature differences at Gulbenkian’s Garden was tested and turned out not statistically significant for both seasons (R = 0.6).
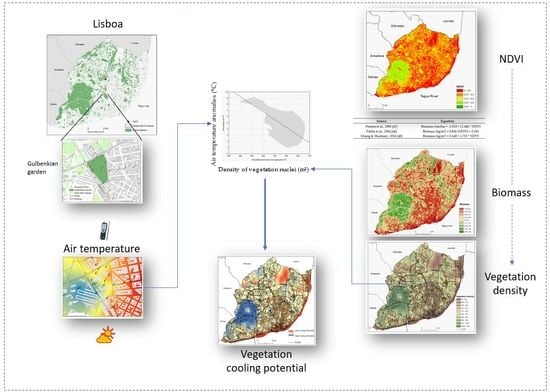
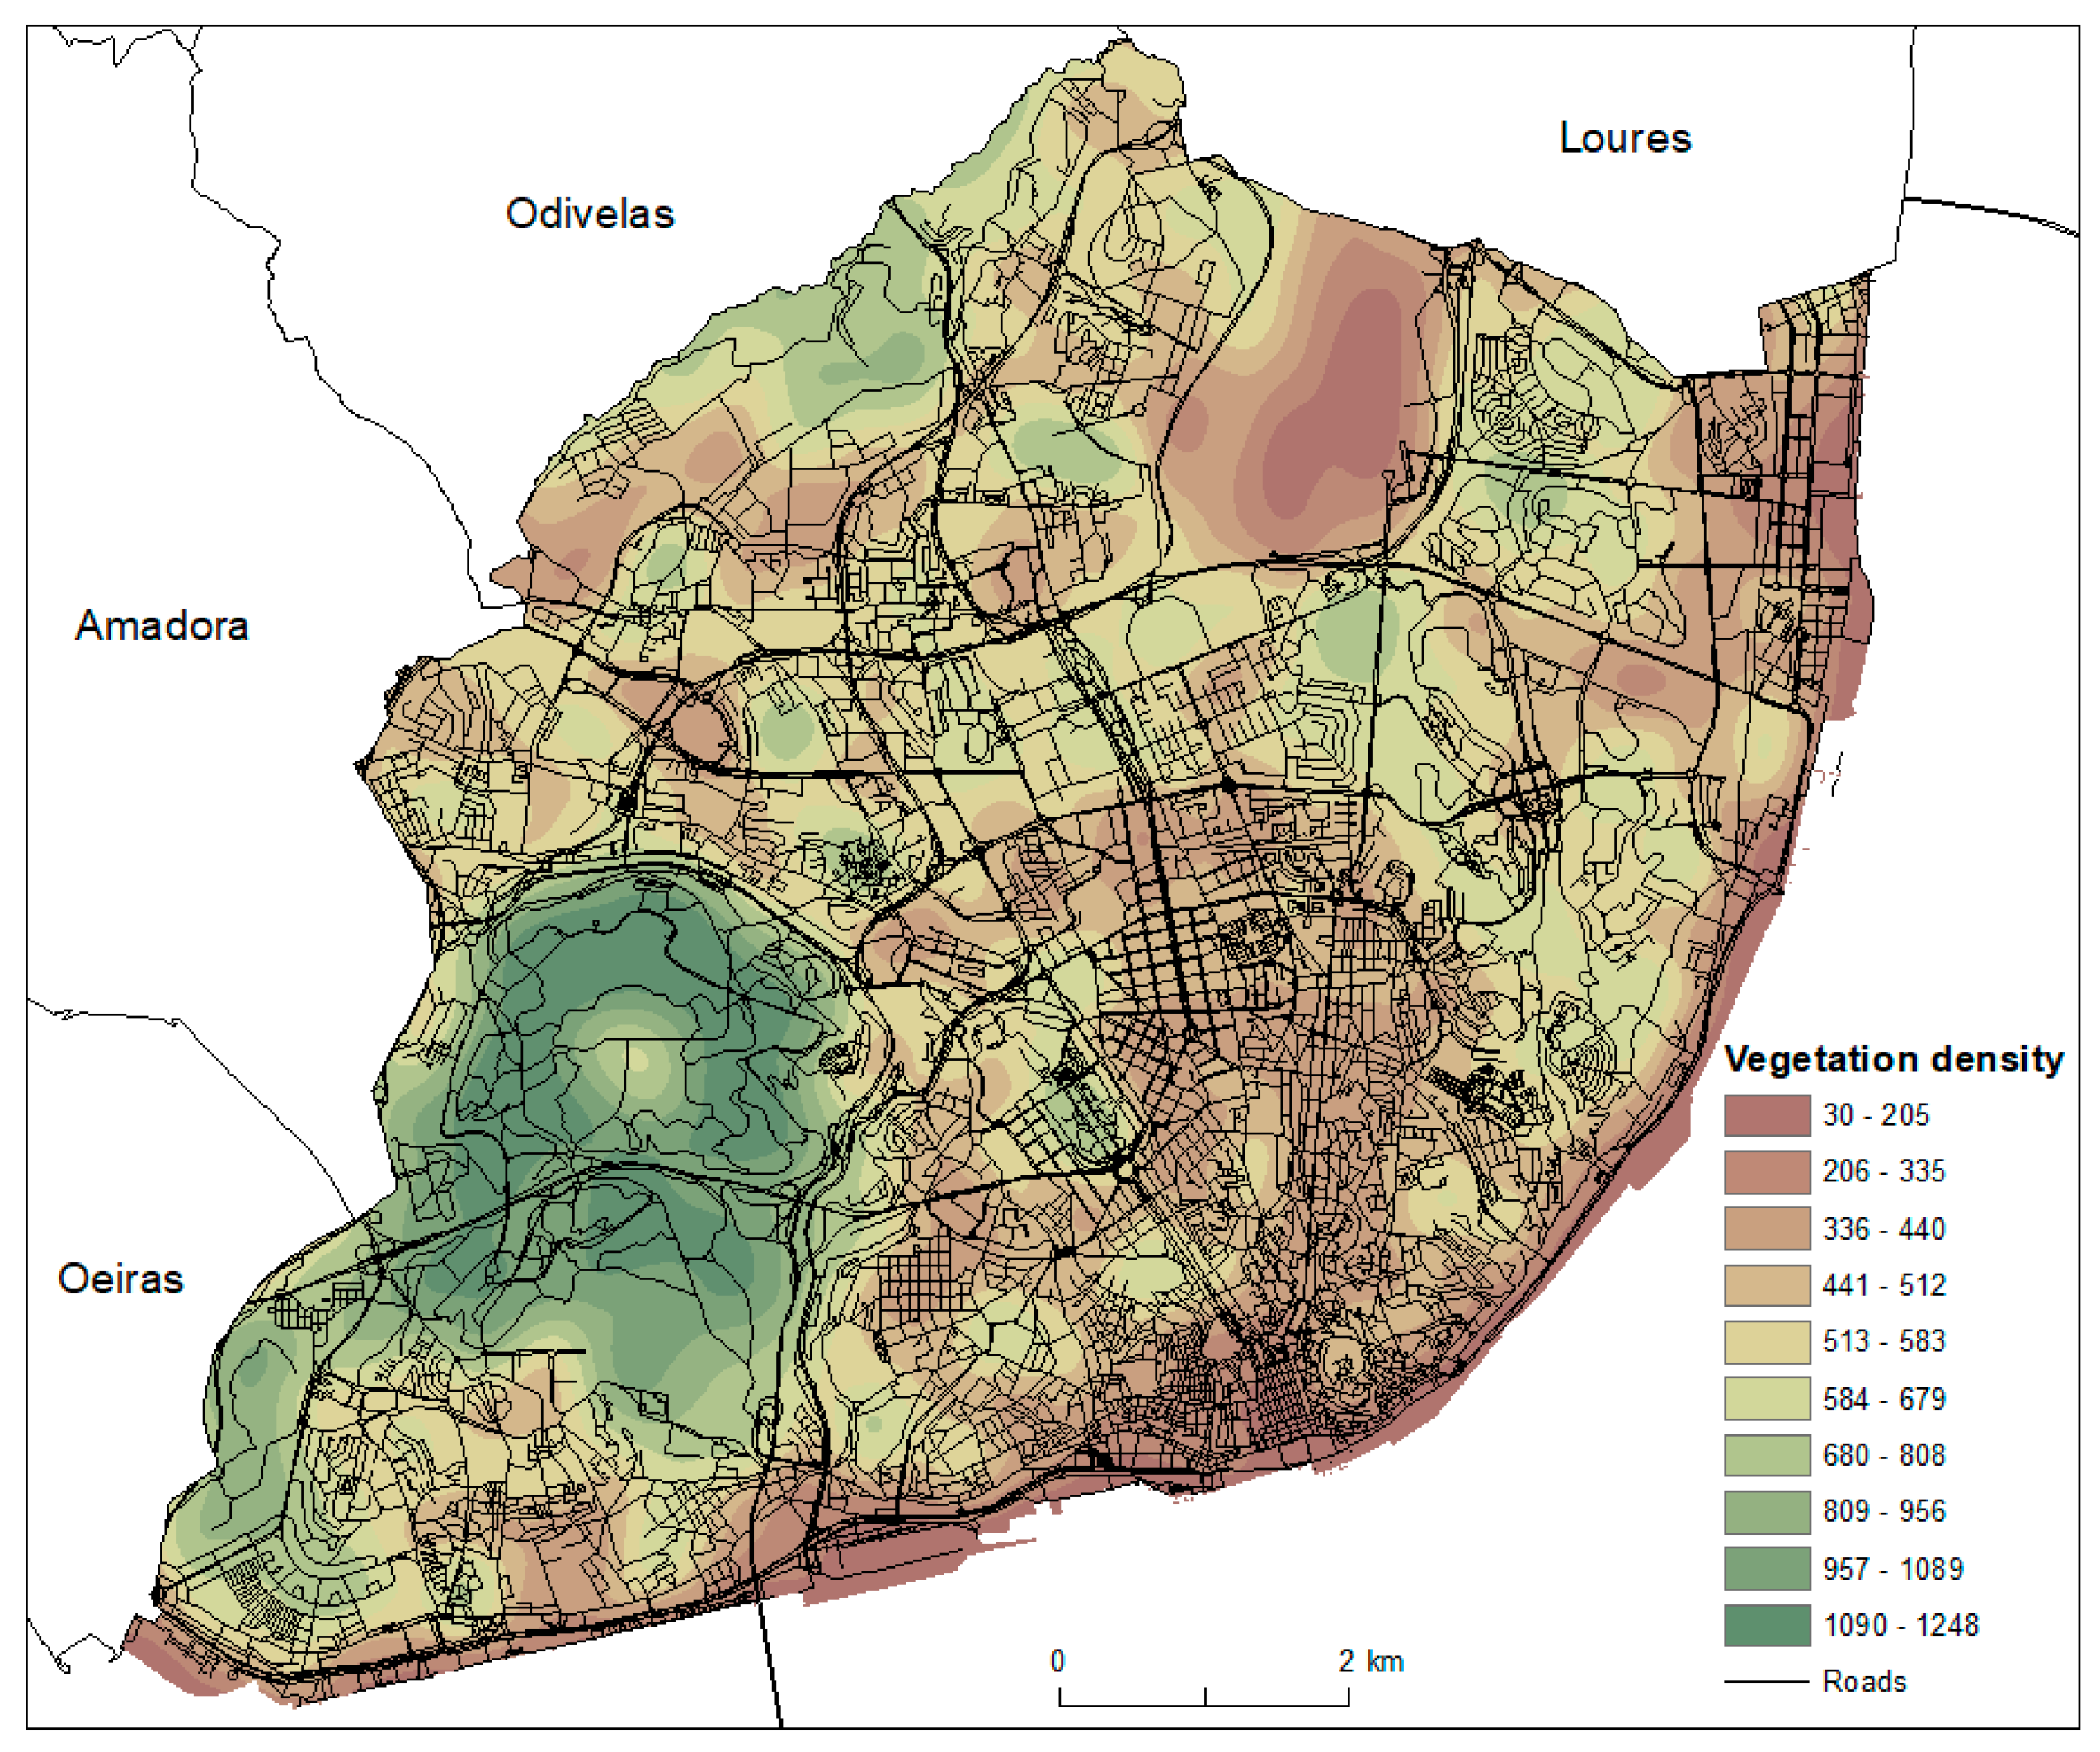
  • On a second and final attempt, the linear regression model incorporated a map with the density of vegetation produced from green volume estimations of the city instead of AGB. This parameter was calculated for both winter and summer (Figure 4) using the Kernel density, which estimates the magnitude of green mass per area.
Two different linear regression models were generated (condition of vegetation in summer and in winter), having previously been verified the correlations between the variables.

3. Results

3.1. Biomass in Lisbon

The amount of AGB estimated in Lisbon is higher in winter than in summer (Figure 5 and Figure 6), as for the NDVI.
For a better interpretation of the obtained results, Table 3 presents some of the characteristics of AGB for the whole city, green spaces and street trees (source: City Hall of Lisbon).
It is possible to verify that the average biomass for the whole city and the average biomass of green spaces are higher in winter than in summer in all models tested (positive differences reach 0.3 kg/m2 using the model as described in [48]). However, the total green volume estimated is considerably higher in summer than in winter (positive differences reach 16.5 ton using the model described in [47]), even though the summer season in Lisbon is usually dry (Csa) and only foliage and irrigated green areas are more active. Furthermore, if one considers only the biomass of street trees in the city, the results are similar for all models in both winter and summer.

3.2. The Cooling Potential of Green Spaces in Lisbon

The correlation coefficients referring to the cooling potential model in Gulbenkian’s Garden for both summer (−0.74) and winter (−0.83) are negative and strong, especially during winter (time of the year when the amount of vegetation in the garden is slightly lesser than in summer). However, since air temperatures are higher in summer and UHI is more pronounced in Lisbon in this season [50], with negative effects of comfort and human health, only the regression model for this season (Figure 7 and Table 4) is presented in this paper.
As one might see, the distribution of variables is close to the line in summer, especially in higher temperature differences and, consequently, lower densities of vegetation. With the slope of the line is possible to calculate the amount of vegetation (in the plane and not in volume) required for every increase or decrease of 1 °C in air temperature. Since the slope is negative, for every decrease of 0.02 °C in air temperature we need an increase of 1 m2 of vegetation, in both models. Thus, the greater the density of vegetation, the lower the air temperature. Besides, the correlation (R) between air temperature and vegetation is negative and very strong, that is, 83% of variation of air temperature anomalies in winter and 74% in summer is due to vegetation. Still, the determination coefficient (R2) shows that more than half (about 70% in winter and 55% in summer) of air temperature variation inside and in the surroundings of Gulbenkian’s Garden is explained by the presence of vegetation.
Using this equation, an extrapolation of the cooling potential of green spaces was made for the whole city (Figure 8a).
The distribution of areas with high and low potential has some similarities with the behavior of UHI in this city (Figure 8b). In fact, the areas with the fewest amount of vegetation and, for that, the lowest cooling potential, mainly the riverside front, correspond to the areas with the highest intensities of UHI (>1.5 °C) and vice-versa. Only the city airport (NE) presents a different behavior because in summer the surrounding area is covered by dry lawns, so vegetation cooling potential is low but UHI is also weak because of its location on the city fringe.

4. Discussion

In general, all models of biomass in Lisbon estimated higher values in winter than in summer. However, according to Soares [3], street trees in the city are mostly deciduous, along with about 42% of trees in public gardens. In order to better understand the reasons that explain this result, it’s important to analyze the characteristics of each biomass model tested and the vegetation characteristics of the city. First, all authors used field samples, either to generate the model or to calibrate it. Regarding the satellite images, only Filella et al. [46] didn’t use this type of data, while Pereira et al. [47] used Landsat 5 images and, lastly, Chang & Shoshany [48] used two different types of satellite images, Santinel-1 and Sentinel-2, generating a final fusion model. Regarding the area features where these investigations were made, all studies were applied in areas with Mediterranean climates, one of them tested in Portugal.
Concerning the models tested outside the country, on one side, Filella et al. [46], whose model generated the least amount of biomass for Lisbon in both seasons, estimated biomass of Mediterranean forest on Garraf’s Natural Park in Barcelona. More recently, Chang and Shoshany [48] performed the mapping of Mediterranean forests in climatic transition zones that represent several Mediterranean environments. In these areas, the annual total precipitation varies between 200 and 600 mm, being, then, in most cases, lesser than annual average precipitation recorded in Lisbon. Nevertheless, they generated a robust model with a correlation coefficient of 0.86.
Concerning the studies made in Portugal, Pereira et al. [47] estimated the amount of biomass in Aire and Candeeiros’ Hill Natural Park, with an area of 37,000 ha, altitudes ranging between 50 and 680 m, annual air temperatures of 14.8 °C and precipitation (846 mm) higher than the annual average in Lisbon. They concluded that the best green mass estimation (R = 0.76) can be obtained using NDVI.
Furthermore, all three models were applied to the hole vegetation in this city. By analyzing the values of total green volume and biomass of green spaces, the unexpectedly higher amounts in winter and lower in summer are influenced by extensive areas of smaller species/lawn and some of them aren’t irrigated frequently. For that, they drier in summer (biomass in lower in this season) than in winter. Still, the estimation of biomass was based only on one case/satellite image per season. In this case, the satellite image used for winter is from the end of the season/ beginning of spring, so the amount of biomass is relatively higher than in peak winter (December or January). At the same time, the green volume of only street trees is theoretically similar in summer and in winter, even though in this latter season fall foliage occurs, so it’s expected a fewer amount of biomass. For these reasons, it is important to estimate the volume of vegetation per stratum or specie.
In order to establish a parallel with other investigations that have estimated biomass in urban areas, Raciti et al. [30] produced a high-resolution map of tree biomass in Boston (EUA). During the estimation process, the authors excluded NDVI values inferior to 0.1 considering that above this threshold the amount of vegetation is sufficiently significant to be included in the analysis. They estimated an average biomass of 1.3 kg/m2 for the city and this result is similar to the average of Filella et al.; Pereira et al. and Chang and Shoshany [46,47,48] models for both seasons. According to the same authors, the mapping of urban vegetation might give relevant information to urban planning, especially concerning UHI mitigation and thermal comfort improvement.
Likewise, Goh et al. [31] presented a method for the estimation of biomass in large metropolitan areas from SPOT 5 satellite images. For that, they used as study area all green spaces managed in Singapura, corresponding to more than 42,000 ha, having concluded that total biomass of these areas (excluding trees on streets and natural reserve areas) is 4 kg/m2—much higher than average biomass estimated for Lisbon in every model (summer and winter). Besides this, studies that have estimated total biomass of an urban area are scarce, mainly not making distinction between species.
The indicator of vegetation (density of vegetation nuclei) introduced in the model of estimation of green spaces cooling potential proved to be useful and productive. In fact, many of the studies that sought to estimate the influence of vegetation on air temperature reduction used NDVI to represent it. For example, Feyisa et al. [34] studied 21 green spaces in Addis Abba (Ethiopia) and sought to evaluate the relation between vegetation characteristics and air temperature recorded, having found a positive relation between PCI and NDVI. Therefore, they concluded that the cooling effect is determined mainly by the specie type, tree cover, dimension and shape of green spaces. In the case of generated models, a major part of air temperature variation inside and in the surroundings of Gulbenkian’s Garden is due to the amount of vegetation represented by the Kernel density. In Lisbon, it is clear that the larger the green volume, the lower air temperature and the bigger the Park Cooling Effect. For these reasons, the choice of vegetation type to integrate in a green space is very important since different species generate different amounts of biomass. Indeed, the characteristics of vegetation have proved determinant factors on cooling effect of green spaces. Monteiro et al. [51] highlighted the area occupied by tree species and by lawn, while Potchter et al. [16] verified that green spaces composed by wide, dense and tall tree covers provide a bigger cooling effect during the moments of the day with higher temperatures, unlike green spaces composed by lawn and fewer trees, which were hotter than the surrounding area, especially during the day [52].
Regarding the linear regression models that were generated, it was verified that the use of a statistical method adjusted to biomass generate more satisfactory results than the volume of vegetation (for a vegetation increase of 1 m2 air temperature will reduce about 0.02 °C). In fact, Kernel density allowed a statistical transformation of biomass spatialization and generated a vegetation gradient which is better correlated with air temperature. Thus, it’s important to investigate deeper the relation between these two variables in order to apply this methodology to other urban areas.
The green spaces cooling potential map generated for Lisbon showed that the areas with the highest intensities of UHI (>1.5 °C) had the least amount of biomass and, therefore, the lowest cooling potential. In fact, these areas correspond mainly to the city historic center and the riverside front, with high density of buildings and the lowest amount of available space for increasing vegetation. As one might expect, here the climatic modifications are more pronounced, and this explain the highest densities of UHI and the lowest wind velocity [53].
Several studies have explored the relation between urban green space coverage and some characteristics of urban spaces like city area and population size in order to see if there is enough vegetation for the effective improvement of urban microclimate. Fuller and Gaston [54] evaluated this relationship across 386 European cities and concluded that South European and Mediterranean cities have lowest percentages of green space coverage and per capita green space provision (m2 per person) compared to North European cities, even though future climate change scenarios anticipate an increase of temperatures in the former regions.

5. Conclusions

The present study estimated that the amount of AGB in Lisbon is slightly higher in the winter, contrary to what could be expected since the leaf fall occurs at the time of year in which higher volumes were found. Such results can be explained by the fact that biomass was estimated combining all layers of vegetation (arboreal, shrub and herbaceous), so the extensive areas occupied by lawn which are very dry in summer contributed to the apparent reduction on vegetation volume in this season. In a future work we recommended that the estimation of biomass should consider vegetation layers or species.
It was found that an area of 50 m2 covered by vegetation can cool the air by 1 °C. So, this area can be considered the minimal size of a green space in order for it to make a significant contribution to the improvement of urban microclimate. In fact, the improvement of urban climate is one of the ecosystem services provided by vegetation which contributes to the sustainability of cities. With an increase of vegetation, it was concluded that the urban green spaces cooling potential would be higher, with positive feedbacks on human thermal comfort, contributing for healthier and more resilient cities. Therefore, the authors recommend that this measure should be taken into account when planning new green areas in the city.
Considering that the areas with the highest intensities of UHI (>1.5 °C) correspond to the ones with relatively low cooling potential, we acknowledge that the green space area currently existent in Lisbon is not enough to promote sufficient cooling, especially during summer.
In addition, it is relevant to enumerate the limitations of this work. Regarding AGB, firstly, the models used weren’t built considering the topographic and climatic features of the city of Lisbon, so adjustments will be necessary in order to better fit the study area, since the amount and type of vegetation vary geographically. Besides this, it’s relevant to collect field samples in the future that would allow the validation of results and the calibration of models. Still, the estimation of AGB from models based on satellite images and other remote sensing products entails numerous limitations associated to the characteristics of satellite/platform, spatial and temporal resolution, etc. In this case, the spatial resolution of Landsat 8 Images (30 m on the visible spectrum) is too coarse for the effective estimation of the volume of vegetation. Lastly, the estimation of the urban green spaces cooling potential for the whole city is based on an extrapolation of a model built with data from only one green space.
This work presents a new methodology for the quantification of the amount of vegetation in urban areas considering their height and volume (aboveground biomass), which was applied in a few cities and is still in the experimentation phase due to its challenges related to the heterogeneity of soil use and fragmentation of green areas. This parameter can be used as a model to quantify the effective reduction on air temperature provided by vegetation.
Considering the present work can be a starting point for the estimation of the cooling potential of urban green spaces in other cities, it would be interesting to hereafter evaluate the quality of ABG estimations, with field data and LIDAR images (height of vegetation), and the quality of the cooling potential, using a mesoscale meteorological network installed in Lisbon This network could also be useful for a further analysis of the green spaces cooling potential and the validation of the cooling potential map generated in this study in order to build a set of recommendations for planning, management and optimization of urban green spaces: What would be a good ratio between the built up area and the green spaces? Is there an optimal spatial configuration of green spaces (e.g., alignments, etc.), including ensuring their spatial contiguity?; Is there a certain structure of vegetation needed for a significant contribution to the improvement of urban microclimate? Are different categories (trees, shrubs, grassland) more efficient than others?

Author Contributions

The authors contributed equally to this study.

Funding

This research was funded by FCT—Fundação para a Ciência e Tecnologia, I.P. (CEG project number: UID/GEO/00295/2019).

Acknowledgments

The authors would like to thank the anonymous reviewers and the editor for their helpful and constructive comments that greatly contributed to improving the final version of this paper.

Conflicts of Interest

The authors declare no conflicts of interest.

References

  1. Alcoforado, M.J.; Andrade, H.; Oliveira, S.; Festas, M.J.; Rosa, F. Alterações Climáticas e Desenvolvimento Urbano; Política de Cidades—4. 2009. Available online: http://www.forumdascidades.pt/content/alteracoes-climaticas-e-desenvolvimento-urbano (accessed on 27 April 2019).
  2. Andrade, H.J.N. Bioclima humano e temperatura do ar em Lisboa. Ph.D. Thesis, Physical Geography, College of Languages, University of Lisbon, Lisbon, Portugal, 2003. [Google Scholar]
  3. Soares, A.L.B.S.S.S.L. O valor das árvores—Árvores e Floresta Urbana de Lisboa. Ph.D. Thesis, Landscape Architecture, Instituto Superior de Agronomia, University of Lisbon, Lisbon, Portugal, 2006. [Google Scholar]
  4. Streilling, S.; Matzarakis, A. InFluen of single and small clusters of trees on the bioclimate of a city: A case study. J. Arboric. 2003, 929, 309–316. [Google Scholar]
  5. Voogt, J.A.; Oke, T.R. Thermal remote sensing of urban climates. Remote Sens. Environ. 2003, 86, 370–384. [Google Scholar] [CrossRef]
  6. Doick, K.; Hutchings, T. Air temperature regulation by urban trees and green infrastructure. For. Res. 2013, 12, 1–10. [Google Scholar]
  7. Gago, E.J.; Roldan, J.; Pacheco-Torres, R.; Ordónez, J. The city and urban heat islands: A review of strategies to mitigate adverse effects. Renew. Sustain. Energy Rev. 2013, 25, 749–758. [Google Scholar] [CrossRef]
  8. Shashua-Bar, L.; Hoffman, M.E. Vegetation as a climatic component in the design of an urban street. An empirical model for predicting the cooling effect of urban green areas with trees. Energy Build. 2000, 31, 221–235. [Google Scholar] [CrossRef]
  9. Bowler, D.E.; Buyung-Ali, L.; Knight, T.M.; Pullin, A.S. Urban greening to cool towns and cities: A systematic review of the empirical evidence. Landsc. Urban Plan. 2010, 96, 147–155. [Google Scholar] [CrossRef]
  10. Venhari, A.A.; Tenpierik, M.; Hakak, A.M. Heat mitigation by greening the cities, a review study. Environ. Earth Ecol. 2017, 1, 5–32. [Google Scholar] [CrossRef] [Green Version]
  11. Bueno-Bartholomei, C.L.; Labaki, L.C. How much does change of species of trees affect their solar radiation attenuation? In Proceedings of the International Conference on Urban Climate, Lodz, Poland, 1–5 September 2003; Available online: http://meteo.geo.uni.lodz.pl/icuc5/text/O_1_4.pdff (accessed on 23 April 2019).
  12. Fung, C.K.W.; Jim, C.Y. Assessing the cooling effect of different vegetation settings in a Hong Kong golf course. Procedia Environ. Sci. 2017, 37, 626–636. [Google Scholar] [CrossRef]
  13. Leuzinger, S.; Votg, R.; Kömer, C. Tree surface temperature in an urban environment. Agric. For. Meteorol. 2010, 150, 56–62. [Google Scholar] [CrossRef]
  14. Shashua-Bar, L.; Pearlmutter, D.; Erell, E. The cooling efficiency of urban landscape strategies in a hot dry climate. Landsc. Urban Plan. 2009, 92, 179–186. [Google Scholar] [CrossRef]
  15. Lin, B.-S.; Lin, Y.-J. Cooling effect of shade trees with different characteristics in a subtropical urban park. HortScience 2010, 45, 83–86. [Google Scholar] [CrossRef]
  16. Potchter, O.; Cohen, P.; Bitan, A. Climatic behavior of various urban parks during hot and humid summer in the Mediterranean city of Tel Aviv, Israel. Int. J. Climatol. 2006, 26, 1695–1711. [Google Scholar] [CrossRef]
  17. McDonald, R.; Kroeger, T.; Boucher, T.; Longzhu, W.; Salem, R. Planting Healthy Air. A global Analysis the Role Urban Trees in Addressing Particulate Matter Pollution Extreme Heat; The Nature Conservancy: Arlington, VA, USA, 2013. [Google Scholar]
  18. Long, H.; Li, X.; Wang, H.; Jia, J. Biomass resources and their bioenergy potential estimation: A review. Renew. Sustain. Energy Rev. 2013, 26, 344–352. [Google Scholar] [CrossRef]
  19. Alves, E.D.L.; Lopes, A. The Urban Heat Island Effect and the Role of Vegetation to Address the Negative Impacts of Local Climate Changes in a Small Brazilian City. Atmoshpere 2017, 8, 18. [Google Scholar] [CrossRef]
  20. Hentz, A.M.K.; Ruza, M.S.; Corte, A.P.D.; Sanquetta, C.R. Enciclopédia Biosfera; Centro Científico Conhecer: Goiânia, Brazil, 2014; Volume 10, pp. 2810–2823. [Google Scholar]
  21. Kumar, L.; Sinha, P.; Taylor, S.; Alqurashi, A.F. Review of the use of remote sensing for biomass estimation to support renewable energy generation. J. Appl. Remote Sens. 2015, 9, 1–28. [Google Scholar] [CrossRef]
  22. Lu, D. The potential and challenge of remote sensing-based biomass estimation. Int. J. Remote Sens. 2006, 27, 1297–1328. [Google Scholar] [CrossRef]
  23. Das, S.; Singh, T.P. Correlation analysis between biomass and spectral vegetation indices of forest ecosystem. Int. J. Eng. Res. Technol. 2012, 1, 1–3. [Google Scholar]
  24. Coltri, P.P.; Ramirez, G.M.; Walter, M.K.C.; Junior, J.Z.; Pinto, H.S.; Nascimento, C.R.; Gonçalves, R.R.V. Utilização de índices de vegetação para estimativas não-destrutivas da biomassa, estoque e sequestro de carbono do Cafeeiro Arábica. In Proceedings of the Anais XIV Simpósio Brasileiro de Sensoriamento Remoto, Natal, Brazil, 25–30 April 2009. INPE 121–128. [Google Scholar]
  25. Garroutte, A.I.; Hansen, A.J.; Lawrence, R.L. Using NDVI and EVI to Map Spatiotemporal Variation in the Biomass and Quality of Forage for Migratory Elk in the Greater Yellowstone Ecosystem. Remote Sens. 2016, 8, 404. [Google Scholar] [CrossRef]
  26. Formica, A.F.; Burnside, R.J.; Dolman, P.M. Rainfall validates MODIS-derived NDVI as an index of spatio-temporal variation in green biomass across non-montane semi-arid and arid Central Asia. J. Arid Environ. 2017, 142, 11–21. [Google Scholar] [CrossRef] [Green Version]
  27. Fernández-Manso, O.; Fernández-Manso, A.; Quintano, C. Estimation of aboveground biomass in Mediterranean forestsby statistical modelling of ASTER fraction images. Int. J. Appl. Earth Obs. Geoinf. 2014, 31, 45–56. [Google Scholar] [CrossRef]
  28. Lopes, A. Modificações no clima de Lisboa como consequência do crescimento urbano. Ph.D. Thesis, Physical Geography, Institute of Geography and Spatial Planning, University of Lisbon, Lisbon, Portugal, 2003. [Google Scholar]
  29. McHale, M.R.; Burke, I.C.; Lefsky, M.A.; Peper, P.J.; McPherson, E.G. Urban forest biomass estimates: Is it important to use allometric relationships developed specifically for urban trees? Urban Ecosyst. 2009, 12, 95–113. [Google Scholar] [CrossRef]
  30. Raciti, S.M.; Hutyra, L.R.; Newell, J.D. Mapping carbon storage in urban trees with multi-source remote sensing data: Relationships between biomass, land use, and demographics in Boston neighborhoods. Sci. Total Environ. 2014, 500–501, 72–83. [Google Scholar] [CrossRef] [PubMed]
  31. Goh, J.Y.; Miettinem, J.; Liew, S.C.; Kwoh, L.K. Estimating biomass in managed urban greenery areas using canopy cover percentages derived from NDVI. In Proceedings of the 32nd Asian Conference on Remote Sensing, Taipei, Taiwan, 3–7 October 2011; Volume 3, pp. 1716–1721. [Google Scholar]
  32. Zoulia, I.; Santamouris, M.; Dimoudi, A. Monitoring the effect of urban green areas on the heat island in Athens. Environ. Monit. Assess 2009, 156, 275–292. [Google Scholar] [CrossRef]
  33. Yu, Z.; Guo, X.; Jorgensen, G.; Vejre, H. How can urban green spaces be planned for climate adaptation in subtropical cities? Ecol. Indic. 2017, 82, 152–162. [Google Scholar] [CrossRef]
  34. Feyisa, G.L.; Dons, K.; Meilby, H. Efficiency of parks in mitigating urban heat island effect: An example from Addis Ababa. Landsc. Urban Plan. 2014, 123, 87–95. [Google Scholar] [CrossRef]
  35. Alcoforado, M.J. O Clima da Região de Lisboa. Contrastes e Ritmos Térmicos; Centro de Estudos Geográficos: Lisboa, Portugal, 1993; Volume 15, p. 347. [Google Scholar]
  36. Franco, S.F.; Macdonald, J.L. Measurement and valuation of urban greenness: Remote sensing and hedonic applications to Lisbon, Portugal. Reg. Sci. Urban Econ. 2018, 72, 156–180. [Google Scholar] [CrossRef]
  37. Santos, M.; Cruz, C.S.; Alves, F.L.; Metelo, I.; Bogalho, V. Câmara Municipal de Lisboa. Biodiversidade na Cidade de Lisboa: Uma Estratégia Para 2020; Documento técnico. 3ª Edição (Digital)-Versão Digital (Revista); Câmara Municipal de Lisboa: Lisboa, Portugal, 2015. [Google Scholar]
  38. Mendes, F.H.; Filho, D.F.S.; Lopes, A.M.S. Proposta de Metodologia Para A Quantificação da Cobertura Arbórea na Cidade de Lisboa a Partir de Imagem de Alta Resolução; Enciclopédia Biosfera; Centro Científico Conhecer: Goiânia, Brazil, 2015; Volume 11, pp. 3254–3265. [Google Scholar]
  39. Câmara Municipal de Lisboa. Guia Ilustrado de Vinte e Cinco Árvores de Lisboa; Câmara Municipal de Lisboa: Lisboa, Portugal, 2010. [Google Scholar]
  40. Quintal, R. Jardim da Fundação Calouste Gulbenkian; Calouste Gulbenkian Foundation’s Garden: Flora; Fundação Calouste Gulbenkian: Lisboa, Portugal, 2014. [Google Scholar]
  41. Oke, T.R. Initial Guidance to Obtain Representative Meteorological Observations at Urban Sites; World Meteorological Organization: Geneva, Switzerland, 2004; Volume 81, p. 51. [Google Scholar]
  42. Eisfelder, C.; Kuenzer, C.; Dech, S. Derivation of biomass information for semi-arid areas using remote-sensing data. Int. J. Remote Sens. 2012, 33, 2937–2984. [Google Scholar] [CrossRef]
  43. Galidaki, G.; Zianis, D.; Gitas, I.; Radoglou, K.; Karathanassi, V.; Tsakiri–Strati, M.; Mallinis, G. Vegetation biomass estimation with remote sensing: Focus on forest and other wooded land over the Mediterranean ecosystem. Int. J. Remote Sens. 2017, 38, 1940–1966. [Google Scholar] [CrossRef]
  44. Lu, D. Aboveground biomass estimation using Landsat TM data in the Brazilian Amazon. Int. J. Remote Sens. 2005, 26, 2509–2525. [Google Scholar] [CrossRef]
  45. Zhu, X.; Liu, D. Improving forest aboveground biomass estimation using seasonal Landsat NDVI time-series. ISPRS J. Photogramm. Remote Sens. 2015, 102, 222–231. [Google Scholar] [CrossRef]
  46. Filella, I.; Peñuelas, J.; Llorens, L.; Estiarte, M. Reflectance assessment of seasonal and annual changes in biomass and CO2uptake of a Mediterranean shrubland submitted to experimental warming and drought. Remote Sens. Environ. 2004, 90, 308–318. [Google Scholar] [CrossRef]
  47. Pereira, J.M.C.; Oliveira, T.M.; Paul, J.C.P. Satellite-based estimation of mediterranean shrubland structural Urban Foresty and Urban Greenery parameters. EARSeL Adv. Remote Sens. 1995, 4, 14–20. [Google Scholar]
  48. Chang, J.; Shoshany, M. Mediterranean shrublands biomass estimation using Sentinel-1 and Sentinel-2. In Proceedings of the IEEE International Geoscience and Remote Sensing Symposium (IGARSS), Beijing, China, 10–15 July 2016; pp. 5300–5303. [Google Scholar] [CrossRef]
  49. Andrade, H.; Lopes, A. A Utilização de um SIG Para A Estimação das Temperaturas em Lisboa. Clima Y Ambiente Urbano en Ciudades Ibéericas e IberoAmericanas; Parteluz: Madrid, Spain, 1998; pp. 85–91. [Google Scholar]
  50. Lopes, A.; Alves, E.; Alcoforado, M.J.; Machete, R. Lisbon Urban Heat Island Updated: New Highlights about the Relationships between Thermal Patterns Wind Regimes; Hindawi: London, UK, 2013; p. 11. [Google Scholar] [CrossRef]
  51. Monteiro, M.V.; Doick, K.J.; Handley, P.; Peace, A. The impact Greenspace Size on the Extent Local Nocturnal Air Temperature Cooling in London. Urban For. Urban Green. 2016, 16, 160–169. [Google Scholar] [CrossRef]
  52. Reis, C.E. A eficiência térmica no potencial de arrefecimento de dois espaços verdes em Lisboa. Master’s Thesis, Physical Geography and Spatial Planning, Institute of Geography and Spatial Planning, University of Lisbon, Lisbon, Portugal, 2018. [Google Scholar]
  53. Alcoforado, M.J.; Lopes, A.; Andrade, H.; Vasconcelos, J. Orientações Climáticas Para o Ordenamento Em Lisboa; Centro de Estudos Geográficos da Universidade de Lisboa: Lisbon, Portugal, 2005. [Google Scholar]
  54. Fuller, R.A.; Gaston, K.J. The scaling of green space coverage in European cities. Biol. Lett. 2009, 5, 352–355. [Google Scholar] [CrossRef] [Green Version]
Figure 1. (a) Administrative boundaries and green spaces of Lisbon. (b) Detailed area and mobile measuring routes at Gulbenkian’s Garden: I—points inside the green space; N—points north; S—points south; W—points west; E—points east. Source: Geodados, Lisbon City Hall, CML (theme: Green Spaces).
Sustainability 11 02480 g001
Figure 2. Air temperature anomalies on Gulbenkian’s Garden on a clear day (20 May 2018).
Sustainability 11 02480 g002
Figure 3. (a) NDVI in Lisbon: winter (5 February 2016). (b) NDVI in Lisbon: summer (17 July 2017). Source: Landsat 8 OLI/TIRS images (https://earthexplorer.usgs.gov/).
Sustainability 11 02480 g003
Figure 4. Urban vegetation density of Lisbon in summer (17 July 2017).
Sustainability 11 02480 g004
Figure 5. Biomass in Lisbon: average situation in winter (5 February 2016). Source: Landsat 8 OLI/TIRS images (https://earthexplorer.usgs.gov/).
Sustainability 11 02480 g005
Figure 6. Biomass in Lisbon: average situation in summer (17 July 2017). Source: Landsat 8 OLI/TIRS images (https://earthexplorer.usgs.gov/).
Sustainability 11 02480 g006
Figure 7. Air temperature anomalies vs density of vegetation nuclei (summer) in Gulbenkian’s Garden. Note: thermal anomalies correspond to temperature differences between each value measured and reference station (IGOT).
Sustainability 11 02480 g007
Figure 8. (a) Urban green spaces cooling potential in Lisbon (summer); (b) Nocturnal UHI of Lisbon: normalized air temperatures referring to nights with moderate north wind. Source: [2].
Sustainability 11 02480 g008
Table 1. Air temperature anomalies in all measuring points at Gulbenkian’s Garden on days with clear sky. See measuring point locations in Figure 2.
Measuring PointsAir Temperature Anomalies (Δ)(°C)
24/0420/0518/0625/0607/0709/0723/07
I14.66.03.86.82.60.42.2
I21.54.32.66.35.63.44.9
I30.73.71.94.83.41.22.2
I41.22.40.03.82.40.20.9
I52.44.00.35.83.41.20.7
I64.46.03.95.13.41.21.0
I74.57.43.47.64.82.62.3
I83.04.73.26.14.82.63.5
N11.73.91.42.23.33.40.5
N24.67.21.22.82.73.21.8
N34.46.91.12.51.61.40.6
W13.91.02.57.63.12.60.7
W27.71.06.28.24.78.02.9
W35.13.55.07.85.67.83.6
S15.26.52.83.84.65.02.6
S26.88.44.15.53.12.33.0
S35.07.85.48.51.81.12.1
E14.95.13.94.24.34.54.5
E210.06.64.76.15.94.82.7
E39.08.95.68.46.95.32.8
E47.19.26.37.25.43.54.5
Table 2. Biomass models tested in Lisbon.
SourceEquation
Pereira et al.; 1995 [47]Biomass (ton/ha) = −2.923 + 21.486 * NDVI
Filella et al.; 2004 [46]Biomass (kg/m2) = 0.856 (NDVI) + 0.183
Chang & Shoshany, 2016 [48]Biomass (kg/m2) = 0.148 + 1.735 * NDVI
Table 3. Estimated AGB in Lisbon.
Winter (5 February 2016)Summer (17 July 2017)
Whole CityGreen SpacesStreet TreesWhole CityGreen SpacesStreet Trees
ᾱ (kg/m2)Total (ton)ᾱ (kg/m2)ᾱ (kg/m2)ᾱ (kg/m2)Total (ton)ᾱ (kg/m2)ᾱ (kg/m2)
[46]0.610.20.70.40.521.10.60.5
[47]0.719.40.90.30.535.90.60.3
[48]1.047.11.10.70.857.50.90.7
Average Biomass0.723.10.90.50.637.40.70.5
Table 4. Simple linear regression model (air temperature vs density of vegetation nuclei-summer): results (Gulbenkian’s Garden).
VariablesResults
EquationY = 19.2162 − 0.0249 * x (P < 0.001)
Correlation Coefficient (R)−0.74
Determination Coefficient (R2)0.55

