5.1. DEA Results
DEA CCR model is used to evaluate the efficiency of sustainable banks (SBs) and non-sustainable banks (NSBs). The efficient sustainable banks for the whole period of 2010 to 2018 are: Itau Unibanco Holdings Sa, Brazil, Itausa- Investimentos Itau S.A., Brazil and Banco De Chile, Chile. And the efficient non-sustainable banks for the whole period are: Koc Holding A.S., Turkey, LeasePlan Corporation NV, Netherland, Bank Mendes Gans NV, Netherlands and Allfunds Bank SA, Spain.
Table 2 shows the statistical summary of DEA efficiency scores of 33 sustainable Banks and 247 non-sustainable Banks for 9 years period. This table explain the minimum and efficiency for each period with its mean and standard devision (
).
The input-oriented and output-oriented CCR, BCC and Scale efficiency of sustainable and non-sustainable banks is used to assess the economies of scale on the performance. The study uses the results of 2018 due to its recentness and compatibility. The statistical summary of input oriented, output oriented CCR, BCC, Scale efficiency and returns to scale category (RTS) (i.e., increasing returns to scale (irs) and decreasing returns to scale (drs)) for SBs and NSBs for year 2018 is presented in
Table 3. The table shows the minimum, maximum values of input-oriented CCR, BCC and Scale efficiency with mean and standard deviation for sustainable and non-sustainable banks.
The input-oriented CCR and output-oriented CCR efficient sustainable banks are: Commonwealth Bank Of Australia, Australia, Itau Unibanco Holdings Sa, Brazil, Itausa- Investimentos Itau S.A., Brazil, Royal Bank Of Canada, Banco De Chile Sa, Chile, Grupo Security, Chile, Abn Amro Group N.V., Netherlands and Dbs Group Holdings Ltd., Singapore. The input-oriented CCR and output-oriented CCR efficient non-sustainable banks are: Koc Holding A.S., Turkey, LeasePlan Corporation NV, Netherlands, Banca March SA, Spain, Lansforsakringar Bank AB (Publ), Sweden, Bank Mendes Gans NV, Netherlands, Allfunds Bank SA, Spain, Yapi Kredi Bank Nederland N.V, Netherlands, Norinchukin Trust and Banking Co. Ltd., Japan and BNP Paribas Dealing Services SA, France.
In the input-oriented, output-oriented BCC-O model, which assumes Constant Returns to Scale (CRS) efficient sustainable banks based on Pure Technical Efficiency (PTE) are: Commonwealth Bank Of Australia, Australia, Royal Bank Of Canada, Canada, Banco De Chile Sa, Chile and Grupo Security, Chile. In the BCC-input oriented, output-oriented model, which assumes Decrease Returns to Scale (DRS) efficient sustainable banks based on Pure Technical Efficiency (PTE) are: Westpac Banking Corporation, Australia, Itau Unibanco Holdings Sa, Brazil, Banco Do Brasil S.A., Brazil, Toronto Dominion Bank, Canada, Bank Of Nova Scotia (The) Scotiabank, Canada, Bank Of Montreal, Canada, Bnp Paribas Sa, France, Societe Generale Sa, France, Ing Groep Nv, Netherlands, Abn Amro Group N.V., Netherland, Dbs Group Holdings Ltd., Singapore, Banco Santander Sa, Spain and Banco Bilbao Vizcaya Argentaria Sa, Spain In the BCC-input oriented, output-oriented model, which assumes Increase Returns to Scale (IRS) efficient sustainable banks based on Pure Technical Efficiency (PTE) are: Australia And New Zealand Banking Group Limited, Australia, Canadian Imperial Bank Of Commerce, Canada, Banco Santander Chile, Chile, Bancolombia S.A., Colombia, Banco Davivienda, Colombia, Yes Bank Limited, India, Caixabank, S.A., Spain, Bankinter Sa, Spain, Skandinaviska Enskilda Banken Ab, Sweden, Ctbc Financial Holding Co. Ltd., Taiwan, E. Sun Financial Holding Co. Ltd., Taiwan, Taishin Financial Holding Co., Ltd Taiwan and Turkiye Garanti Bankasi A.S.,Turkey. The sustainable bank BCC input-oriented assuming increase return to scale (CRS) and-output oriented assuming decrease returns to scale are: National Australia Bank Limited, Australia and Sumitomo Mitsui Trust Holdings, Inc Japan. The BCC input-oriented assuming decrease return to scale (CRS) and-output oriented assuming constant to scale sustainable bank is Itausa- Investimentos Itau S.A. Brazil.
In the BCC-input oriented output-oriented model, which assumes Constant Returns to Scale (CRS) efficient non-sustainable banks based on Pure Technical Efficiency (PTE) are: Koc Holding A.S., Turkey, LeasePlan Corporation NV, Netherlands, Lansforsakringar Bank AB (Publ), Sweden, Bank Mendes Gans NV, Netherlands, Allfunds Bank SA, Spain, Yapi Kredi Bank, Nederland, N.V, Netherlands, Norinchukin Trust and Banking Co. Ltd., Japan and BNP Paribas Dealing Services SA, France. In the BCC-input oriented and output-oriented model, which assumes Decrease Returns to Scale (DRS) the efficient sustainable banks based on Pure Technical Efficiency (PTE) are: Mitsubishi UFJ Financial Group Inc, Japan, Sumitomo Mitsui Banking Corporation, Japan, HDFC Bank Ltd., India, Macquarie Group Ltd., Australia, National Bank of Canada, Canada, RCI Banque SA, France and Criteria Caixa, Spain. In the BCC input oriented output model, which assumes Increase Returns to Scale (IRS) are non-sustainable banks are: Caisse de Refinancement de l’Habitat SA, France, TD Bank NV, Netherlands, Vimmerby Sparbank AB, Sweden and Banque Revillon SA, France. The non-sustainable bank BCC input oriented assuming constant return to scale (CRS) and output oriented assuming decrease returns to scale is Bencha March SA, Spain.
The results indicate that the efficiency reached 1.000 when some banks have constant returns to scale, and some have decreasing returns to scale. The input-oriented, output-oriented and scale efficient SBs with constant returns to scale are as follows: Commonwealth Bank of Australia, Australia; Royal Bank of Canada, Canada; Banco De Chile Sa, Chile; and Grupo Security, Chile. Meanwhile, the input-oriented output-oriented scale efficient banks with decreasing returns to scale are as follows: Itau Unibanco Holdings Sa, Brazil; Abn Amro Group N.V., Netherlands; and Dbs Group Holdings Ltd., Singapore. The scale efficient bank Itausa-Investimentos Itau S.A. in Brazil decreased returns to scale as input-oriented and showed constant returns to scale in output-oriented. The input-oriented, output-oriented and scale efficient NSBs with constant returns to scale are as follows: Koc Holding A.S., Turkey; LeasePlan Corporation N.V., Netherlands; Lansforsakringar Bank AB (Publ), Sweden; Bank Mendes Gans NV, Netherlands; Allfunds Bank SA, Spain; Yapi Kredi Bank Nederland N.V., Netherlands, Norinchukin Trust and Banking Co. Ltd., Japan; and BNP Paribas Dealing Services SA, France. The Banca March SA Spain has input-oriented scale efficiency 1 with constant returns to scale and output-oriented efficiency 1 with decreasing returns to scale. The scale efficient SBs have the most productive scale size (MPSS) because these banks have an efficiency score 1 in terms of technical efficiency CCR, pure technical efficiency BCC, and scale efficiency.
5.2. Analysis of the Malmquist Productivity Model
The MPI consists of three main components: technical efficiency change (TEC), technical change (TC), and total factor productivity (TFP). This study calculates each component independently. The statistical summary of commutated productivity changes of SBs and NSBs is presented in
Table 4. The productivity trend of SBs and NSBs from 2010 to 2018 is illustrated in
Figure 1.
5.2.1. Outline of Banks Productivity
The TC is often triggered by external factors, such as shifts in government policies, advances in technology, and changes in economic environments, whereas, TEC is produced by internal factors, such as a firm’s ability to use its own resources [
70]. The productivity trend for SBs and NSBs for the period is presented below.
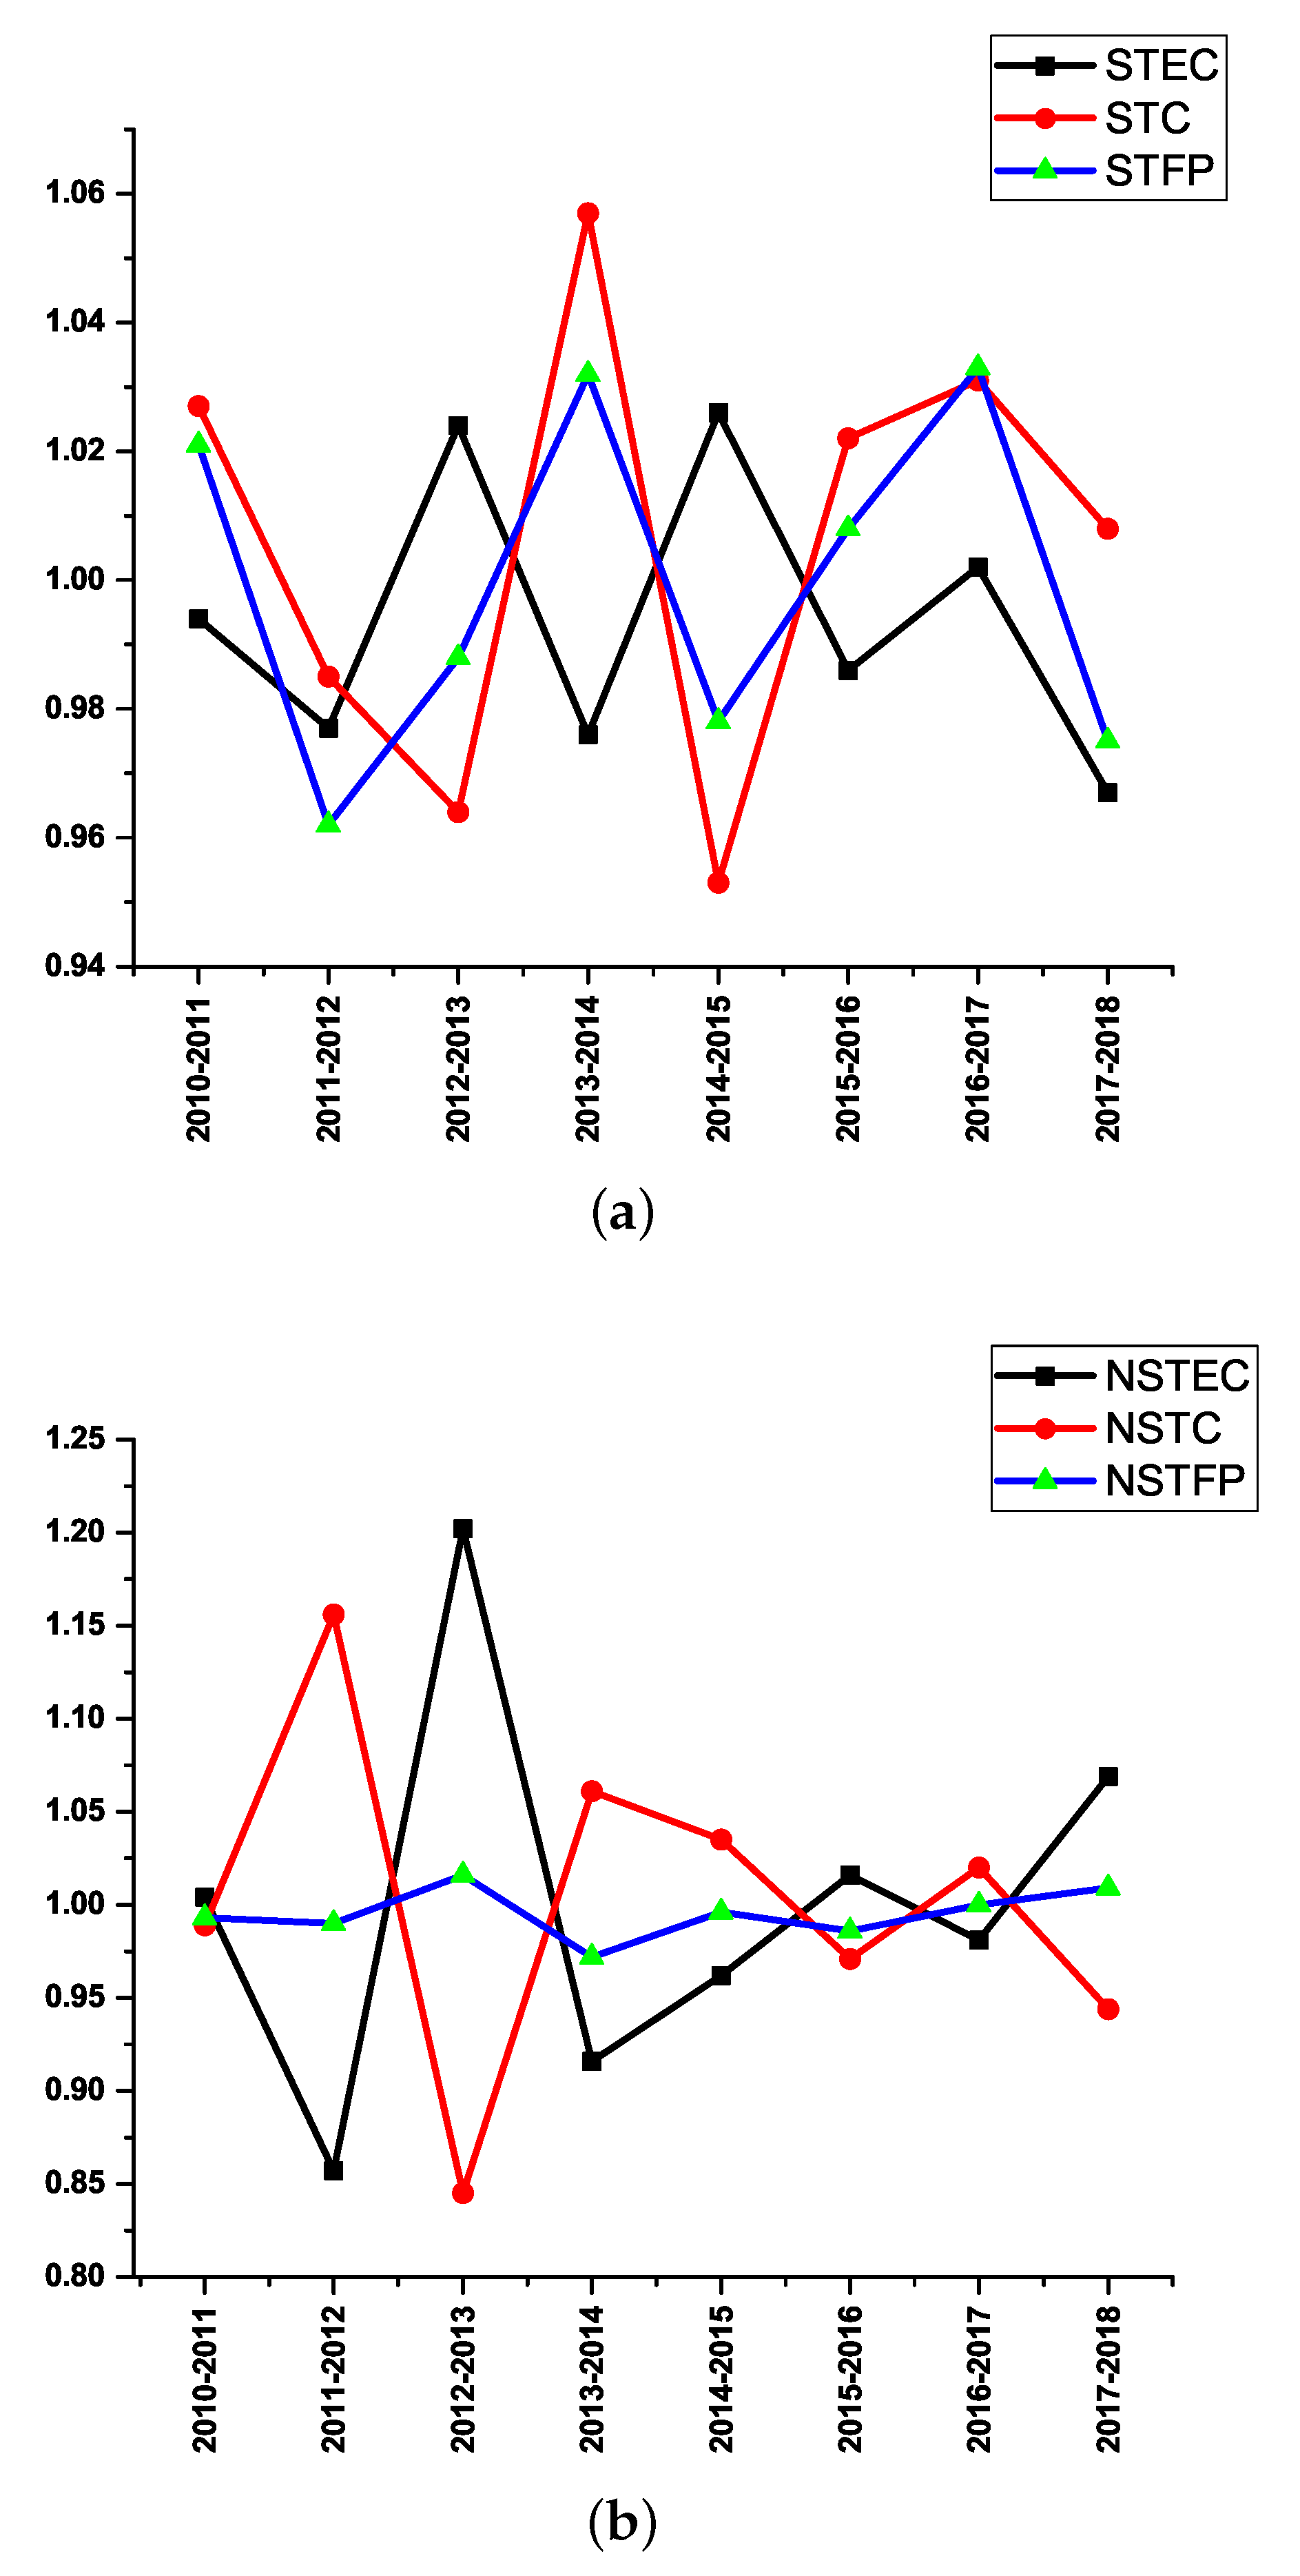
In
Figure 1a, TEC, TC, and TFP are represented as STEC, STC, and STFP, respectively, for SBs. As shown in
Figure 1a, TEC has more similar patterns with STF during the 9-year span. The productivity of SBs for nine years is presented in two sub-figures:
Figure 1a and
Figure 1b. Both figures are generated with different scales based on their data. In
Figure 1a, the minimum scale is 0.94, and maximum scale is 1.06. Meanwhile, in
Figure 1b, the minimum scale is 0.80, and maximum scale is 1.25.
In
Figure 1a, TEC, TC, and TFP are represented as STEC, STC, and STFP, respectively, for SBs.
Figure 1a shows that TEC has more similar patterns with STF during the 9-year span, which indicates that the productivity of SBs is influence by TC rather than TEC. The analysis affirms that the bank’s capacity to accept changing external business environments can significantly affect its operating efficiency. Similarly, TEC, TC, and TFP are represented as NSTEC, NSTC, and NSTFP, respectively, for NSBs in
Figure 1b. As shown in
Figure 1b, NSTC and NSTF have different patterns, while NSTEC have similar patterns with NSTFP, which indicates that the bank’s efficiency is triggered by its own ability to use its resources through improvements in managerial practices.
5.2.2. Total Factor Productivity
The statistical summary of changes in TFP over time is presented in
Table 5, which shows the minimum and maximum values of means, medians and standard deviation represented by
for SBs and NSBs for the period between 2010 and 2018. The TFP < 1 shows a decrease in productivity; TFP = 1 indicates no change in productivity; while TFP > 1 signifies an increase in productivity. The TFP of SBs decreased by 4.4%, which is calculated by subtracting the TFP of the first year from the last period (i.e., 2017–2018) from period 1 (i.e., 2010–2011). The weighted average TFP during this period is 103%. From 2010–2011 to 2011–2012, the TFP of SBs decreased by 5.5%; between 2011–2012 and 2012–2013, it increased by 3.6%; in 2012-2013 to 2013–2014, it increased by 3.1%; from 2013–2014 to 2014–2015, it decreased by 4.9%; between 2014–2015 and 2015–2016, it decreased by 3.5%; for 2016–2017, it increased by 1.9%; and in the 2016–2017 to 2017–2018, it decreased by 6.1%. During these periods, 8 banks decreased their productivity, while 25 banks increased their productivity.
The TFP for NSBs increased by 3%, and the unweighted average for the whole period is 99.1%. The TFP of NSBs during the period 2010–2011 to 2011–2012 decreased by 0.11%; in 2011–2012 to 2012–2013, it increased by 2.93%; between 2012–2013 and 2013–2014, it decreased by 4.41%, in 2013–2014 to 2014–2015, it increased by 2.36%; from 2014–2015 to 2015–2016, it decreased by 0.91%; for 2016–2017, it increased by 2.07%; and in the 2016–2017 to 2017–2018, it decreased by 1.09%. During these periods, 74 NSBs increased their productivity; 137 decreased their productivity; and 3 had no change in their productivity.
5.2.3. Technical Efficiency Change
The statistical summary of changes in TEC over time is presented in
Table 6, which shows the minimum and maximum values of means, median, and standard deviation represented by
for SBs and NSBs from 2010 to 2018. The TEC < 1 shows decreased TEC; TEC = 1 denotes no change, while TEC > 1 indicates increase in TEC.
The TEC of SBs decreased by 2.5%, which is calculated by subtracting the TEC of the first year from the last period (i.e., 2017–2018) from period 1 (i.e., 2010–2011). The unweighted average of TEC during this period is 96%. From 2010–2011 to 2011–2012, the TEC of SBs decreased by 1.7%; in 2011–2012 to 2012–2013, it increased by 4.7%; between 2012–2013 and 2013–2014, it decreased by 4.8%; from 2013–2014 to 2014–2015, it increased by 5%; in 2014–2015 to 2015–2016, it decreased by 4%, for 2016–2017, it increased by 1.6%, and in 2016–2017 to 2017–2018, it decreased by 3.5%. During these periods, 19 banks decreased their TEC; 10 banks increased their TEC; and 4 banks did not change their TEC.
The TEC of NSBs increased by 7.6%, and the unweighted average for the whole period is 100%. Overall, the TEC of NSBs from 2010–2011 to 2011–2012 decreased by 14.3%, while in 2011–2012 to 2012–2013, it increased by 35.5%, which is the highest increase. In 2012–2013 to 2013–2014, it decreased by 29.5%; between 2013–2014 to 2014–2015, it increased by 4.5%; from 2014–2015 to 2015–2016, it increased by 5.4%; for 2016–2017, it decreased by 3.1%, and in the 2016–2017 to 2017–2018, it increased by 9%. During these periods, the TEC increased for 105 NSBs; it decreased for 100 NSBs, while there is no change in TEC for 9 NSBs.
5.2.4. Technical Change
The statistical summary of changes in TC over time is presented in
Table 7, which shows the minimum and maximum values with means, median, and standard deviation represented by
for SBs and NSBs for the period of 2010 to 2018. Here, TC < 1 indicates decreased TC; TC = 1 denotes no change; and TC > 1 shows increase in TC.
The TC of SBs decreased by 1.9%, which is calculated by subtracting the TC of the first year from the last period (i.e., 2017–2018) from period 1 (i.e., 2010–2011). The unweighted average TC during this period is 107.4%. During the period of 2010–2011 to 2011–2012, the TC of SBs decreased by 4.1%; in 2011–2012 to 2012–2013, it decreased by 1.6%; between 2012–2013 and 2013–2014, it increased by 8.6%; in 2013–2014 to 2014–2015, it decreased by 10%; it increased by 6.8% in 2014–2015 to 2015–2016; for 2016–2017, it increased by 0.8%; and in 2016–2017 to 2017–2018, it decreased by 2.4%. During these periods, 2 banks decreased their TC, while 31 increased their TC. The TC for NSBs decreased by 3.39%, and the unweighted average for the whole period is 99.2%. Overall, the TC of NSBs from 2010–2011 to 2011–2012 increased by 17.1%, whereas in 2011–2012 to 2012–2013, it decreased by 30.7%. In 2012–2013 to 2013–2014, it increased by 21.2%; between 2013–2014 and 2014–2015, it decreased by 2.8%; from 2014–2015 to 2015–2016, it decreased by 6.3%; for 2016–2017, it increased by 5.7%; and in 2016–2017 to 2017–2018, it decreased by 7.7%. During these periods, TC increased for 73 NSBs; it decreased for 139 NSBs, while there is no change in TC for 2 NSBs.


