1. Introduction
Since the late 1970’s, levees have been constructed adjacent to rivers to protect people and industries from flooding and to provide residential areas or cultivated land behind the levees. While levees accompanied by ongoing levee reinforcement are a viable method to reduce the risk of flooding, any flooding that does occur will have an even greater impact on the low-lying land behind the levees. For example, if a breach in the levees occurs during flooding season, the damage will be catastrophic, as occurred for the levee failures in New Orleans in the U.S. (2005). Fourteen billion dollars have been spent to shore up New Orleans’ levee system and a total of $135 billion dollars have been spent to restore and repair the damages. More recently, in 2017, Tropical Storm Harvey overwhelmed the entire levee system near Houston, TX and resulted in at least 18 deaths and a total of $125 billion in damages in the southeast of Texas.
The term ‘failure’ is defined as inability to achieve a defined performance threshold. Thus, in the case of levees, failure includes (1) deterioration-process over time, such as an overtopping over the levee during large flooding and internal/external erosion by hydraulic loading, and (2) a resulting breach in the end. The main cause of levee deterioration process leading to a breach is geotechnical stability. Geotechnical stability of a levee is outside the scope of this paper, but the example failure shown in the previous paragraph is a sobering reminder that the levee structure can fail with catastrophic consequences. For the case of New Orleans, a number of contributing factors have been identified by several external reviews in the aftermath of the failures. These include inadequate geotechnical design of the concrete I-wall foundations intended to strengthen the levees, elevations of the tops of the levees that were below storm design levels with resultant overtopping and erosion of the outer toe of the levees, lack of soil protection in the event of overtopping, and failure to account for seepage under the levees. These various mechanisms are characterized and may be combined in a failure scenario, but the ultimate breaching of the levees occurred really quickly [
1]. Even though reasons for failure are still a matter of some controversy with many other contributing factors identified, perhaps one of the main lessons of Katrina is that when levees are the last line of defense against the floods, catastrophe is bound to occur at some time. Thus, for reducing the potential risk from a levee failure, an accurate estimation of flood inundation zone based on the correct amount of discharge by a levee breach is required to prepare an evacuation plan and to establish a Flood Alarming System.
For dam break analysis, initial discharge amount through the opening can be estimated with the conventional format of weir equation with corresponding discharge coefficient because the volume of the water constrained by a dam can be considered as static. However, in case of a levee breach, flow characteristics from the opening are more complex than in a regular dam break because flow velocity and flow depth as well as geometric variables in the approach section play an important role in deciding the discharge amount over the breached section and, therefore, approach variables should be considered when a discharge coefficient is formulated. Based on several recent studies, similar flow characteristics in a levee breach can be found to that over a side weir (also called to lateral weir). A side weir is usually installed along the side of a channel for irrigation and flood protection when water depth within the channel is too high. Researchers including Subramanya and Awasthy [
2], Ranga Raju et al. [
3], Hager [
4], Cheong [
5], Singh et al. [
6], Borghei et al. [
7], and Ji et al. [
8] have extensively studied the subject of a side weir. They applied energy and momentum conservation to flow over a sharp-crested rectangular side weir and derived a theoretical discharge rating equation. Then, corresponding discharge coefficient was given by laboratory experiment. Several proposed formulas for discharge coefficient
are as follows,
where,
is the Froude number based on the approach channel velocity (
and approach channel water depth (
),
is the side weir height measured from the bottom of the channel to the crest of the weir,
is the bottom width of the weir, and
is the approach channel width. The detailed schematics for the variables are shown in
Figure 1 and
Figure 2.
The discharge per unit width (
of a sharp crested rectangular side weir [
9,
10] is as follows and total discharge can be estimated by integration of Equation (7) with respect to the width of weir.
In which
is the upstream head relative to the crest of weir. As shown in the equations above, most of investigators selected approach Froude number (
) as an important parameter to account for hydraulic characteristics in the approach channel on the side weir discharge coefficient. In addition to the approach Froude number, Singh et al. [
6] included the effect of the relative weir height (
), and Borghei et al. [
7] included effect of the ratio between bottom width of a weir and a channel width (
) as well on their discharge coefficient. Recently, Cosar and Agaccioglu [
11] found that discharge coefficient of a triangular side-weir located on a curved channel is a function of approach Froude number, and the discharge coefficients are greater than a coefficient in a straight channel.
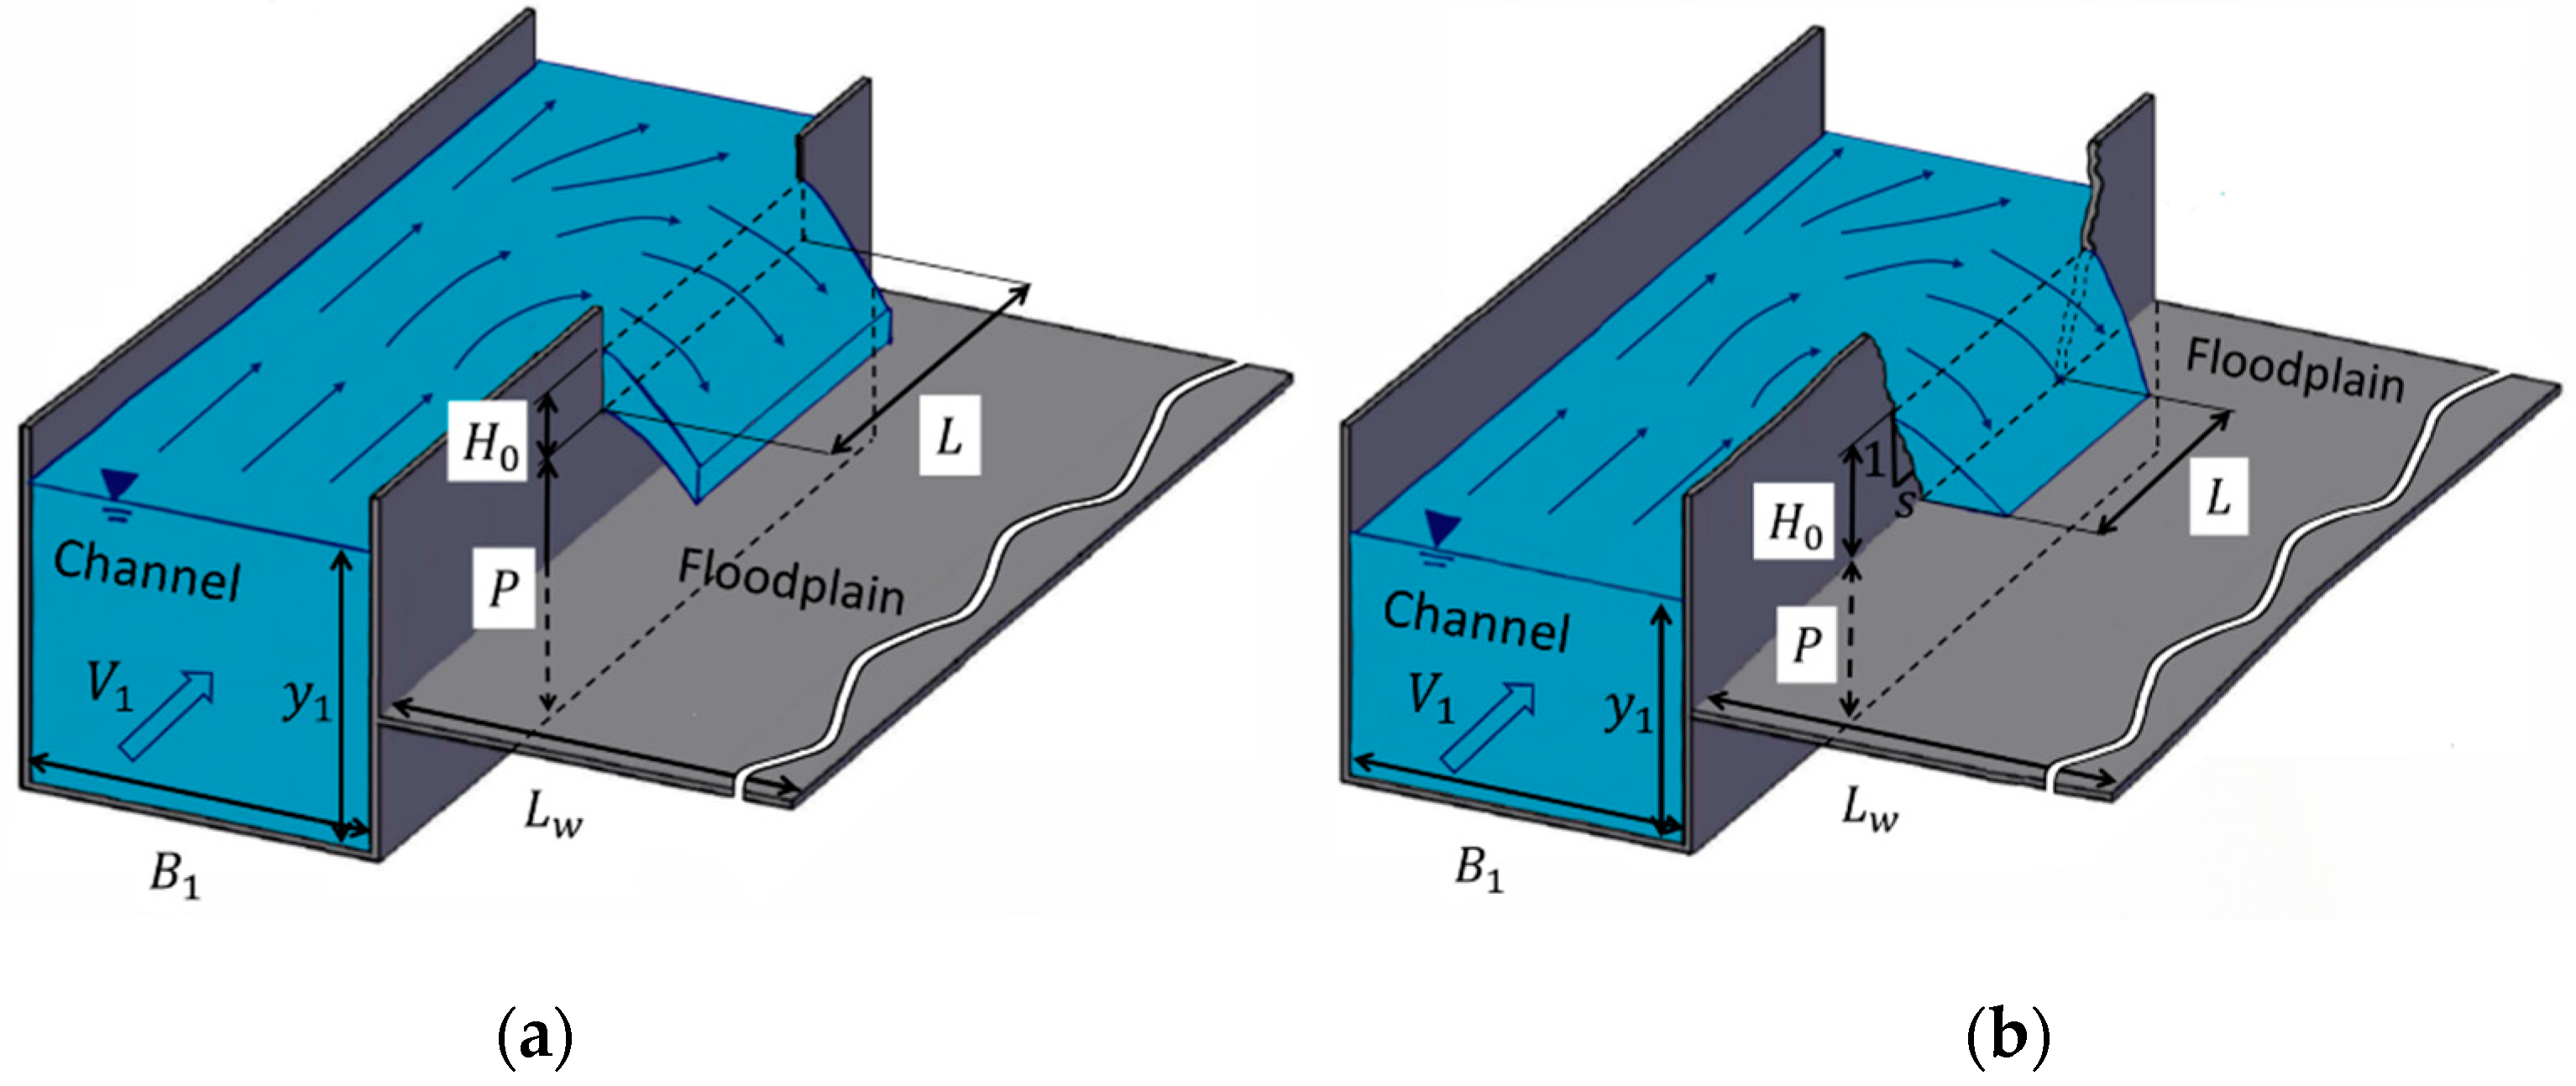
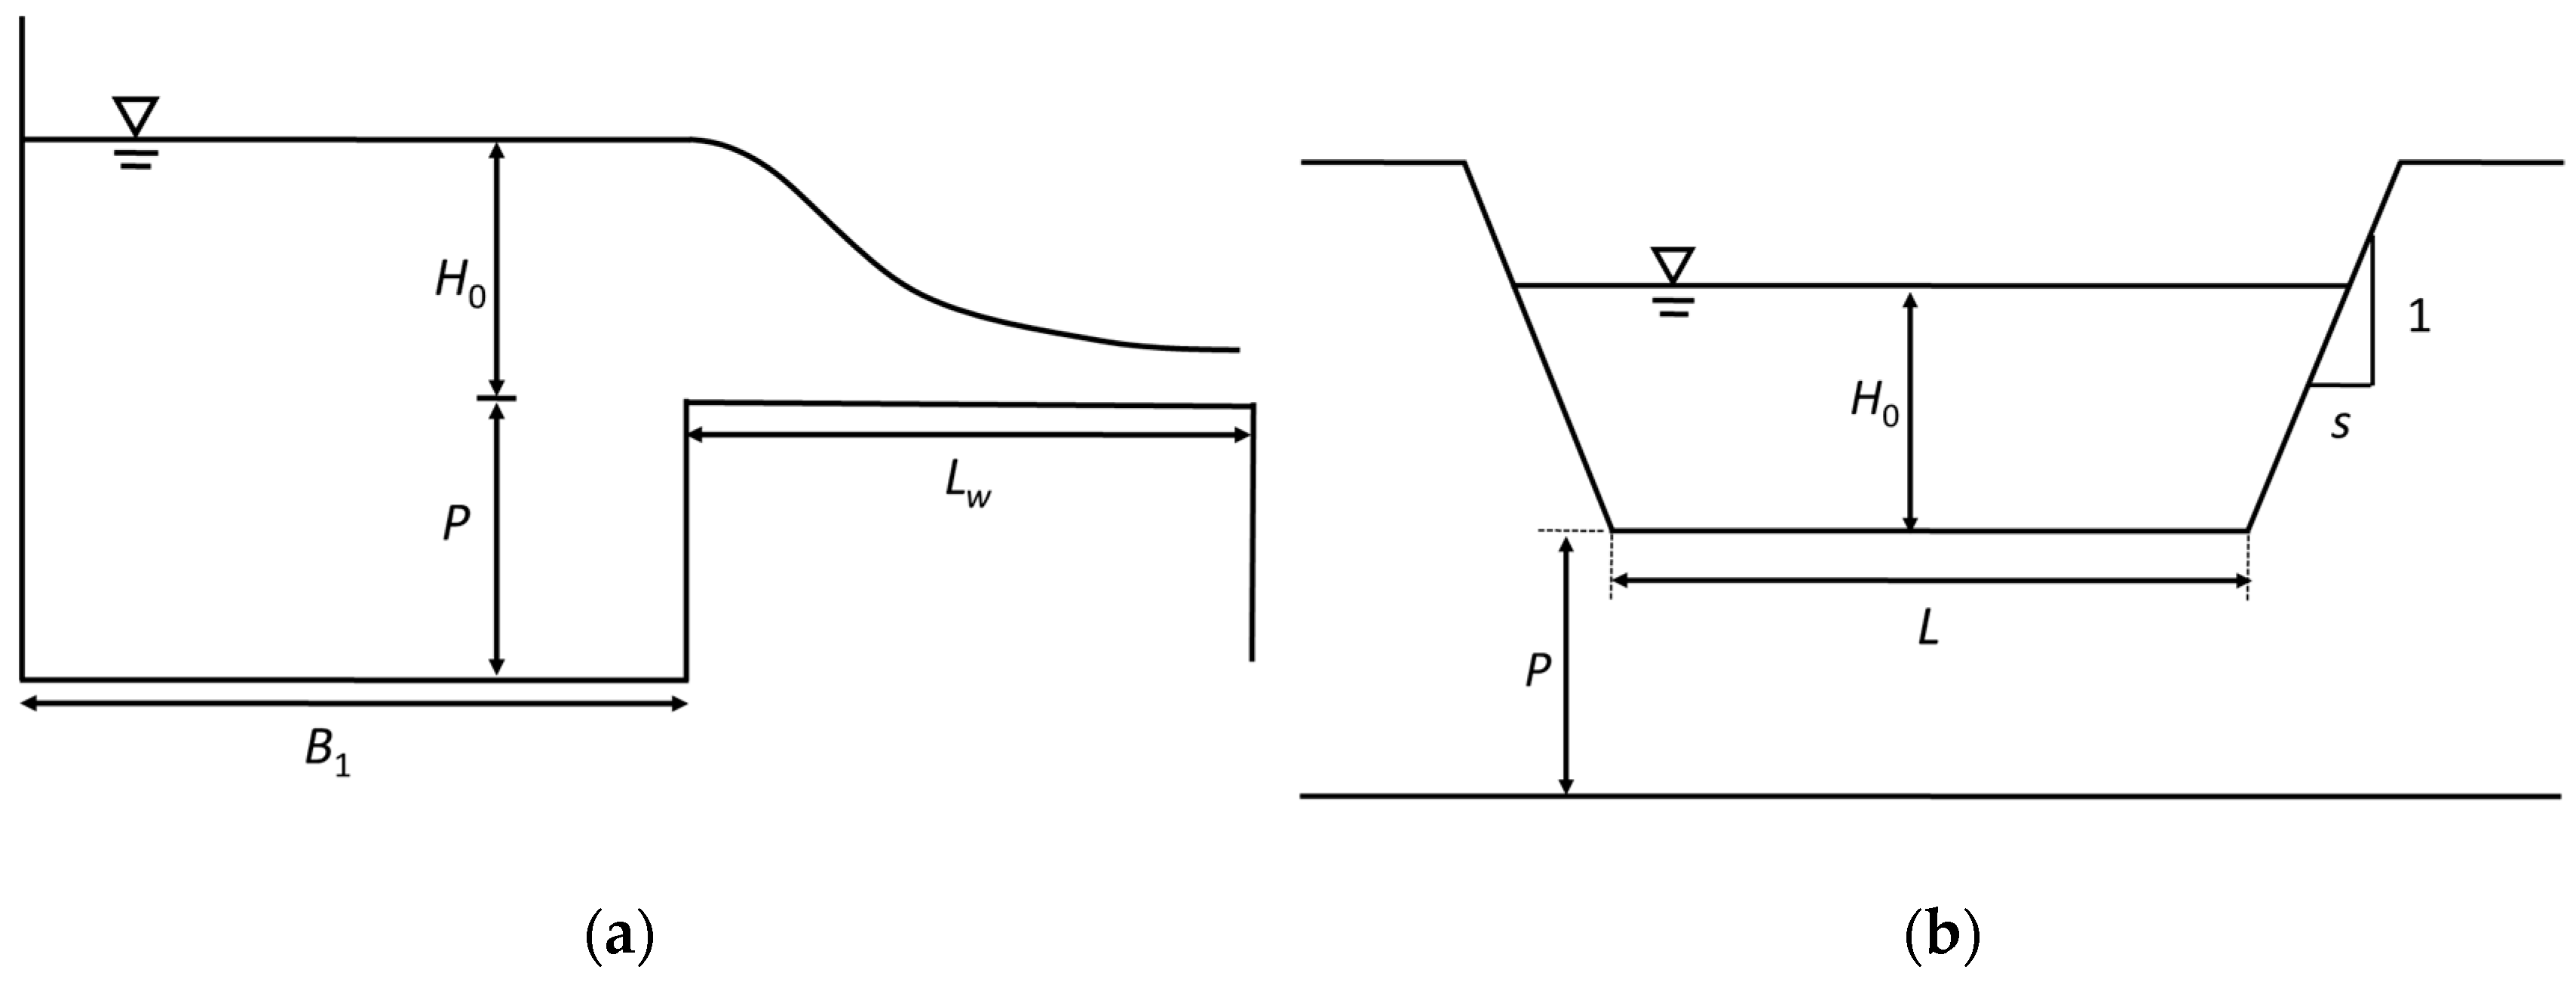
Many side weirs are constructed within levee systems to maintain water level in a channel for irrigation and flood protection. As shown in
Figure 1a, the shape of a side weir is mostly a rectangular sharp crested weir for easier operation and construction. When water overtops over a side weir, shallower and faster moving flow over the side weir adjacent to the slower moving flow in the channel results in a complex interaction that includes strong transverse transfer of longitudinal momentum from the levee to the channel flow. This phenomenon is more pronounced in the immediate interface region between the channel and the corner of the levee, where there exists a strong transverse gradient of the longitudinal velocity. A similar flow field can be found in the very beginning of levee failure during the deterioration process as explained in the previous paragraph. However, as explained by Heerden and Li [
1], time required to reach total breach of a levee is short. Thus, after a short period of time when a levee starts to fail, the resulting geometry and flow types are similar to that over a broad crested weir as shown in
Figure 1b because the floodplain (inundation) area is long enough that parallel flow and critical depth occur at some point in the floodplain as in a broad crested weir [
12]. Furthermore, the shape of a levee failure zone is site-specific and closer to a trapezoidal shape, which has a wide top and narrow bottom, not a rectangular shape. Thus, the application of empirical discharge coefficient shown in Equations (1) to (6) to rate discharge over an opening caused by a levee breach is questionable.
In this study, to suggest new or modified discharge coefficient formula applicable to levee breach (similar to the broad crested weir) with respect to different approach flow conditions (reservoir type and river type), laboratory experiments are conducted with different opening shapes including rectangular and trapezoidal shape under various flow conditions. To overcome possible flaws stemming from scale effect, all of the tests are conducted in a large test basin, instead of using a small scale flume for the experiment. The experimental results show that the dimensional parameter (head above bottom of the opening and the opening width) has a dominant effect on the formula determining discharge coefficient of a levee breach in a reservoir type approach, but approach Froude number should also be considered for a river type approach as well. Comparisons between measured and predicted discharge values using suggested discharge coefficient formula show good agreements.
3. Results and Discussion
Opening bottom width (
L), head above the opening (
Ho), approach velocity (
V1), approach water depth (
y1), and total discharge into the channel (
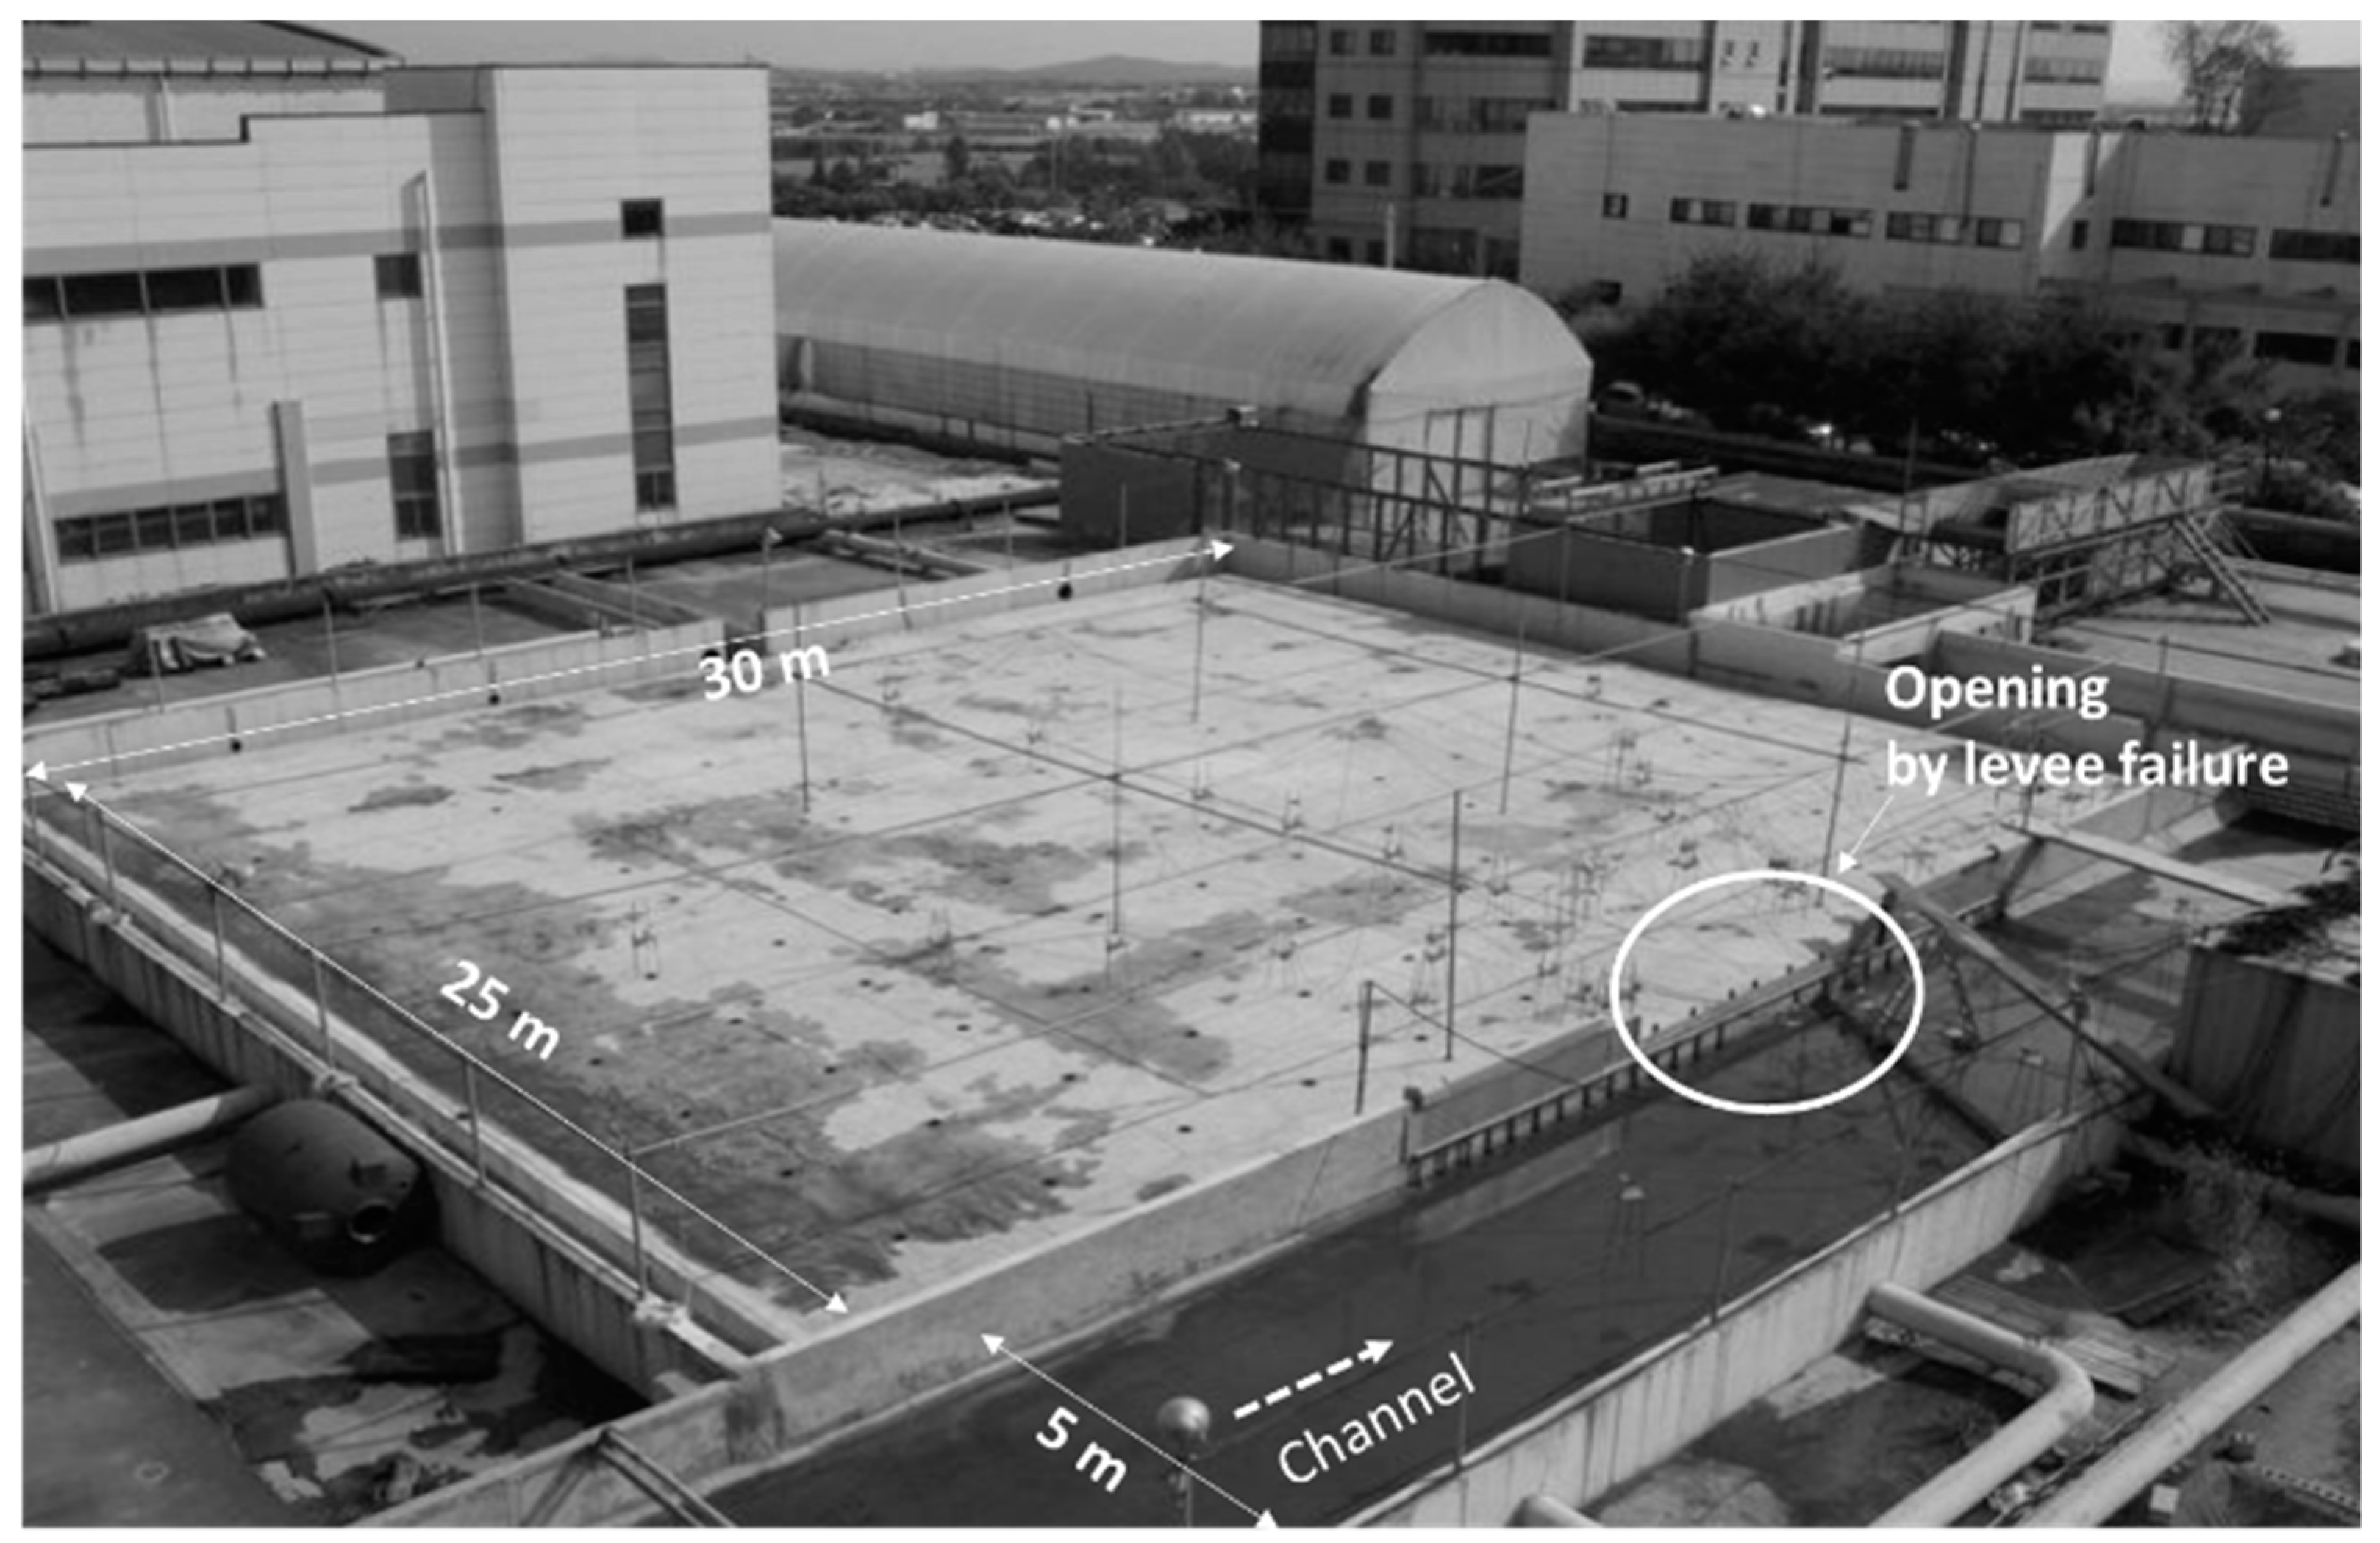
QT) are measured for two different types of approach conditions in the channel that are expected to cause a levee failure: (a) reservoir type approach and (b) river type approach. The chosen values of
Ho satisfied the recommendation with a minimum value of head of 0.07 m recommended for spillway models [
19,
20] to eliminate surface tension as well as viscous effects. Flow depths in the model are generally greater than 0.07 m, which is another criterion for avoiding surface tension effects manifested by capillary waves in free-surface flow models [
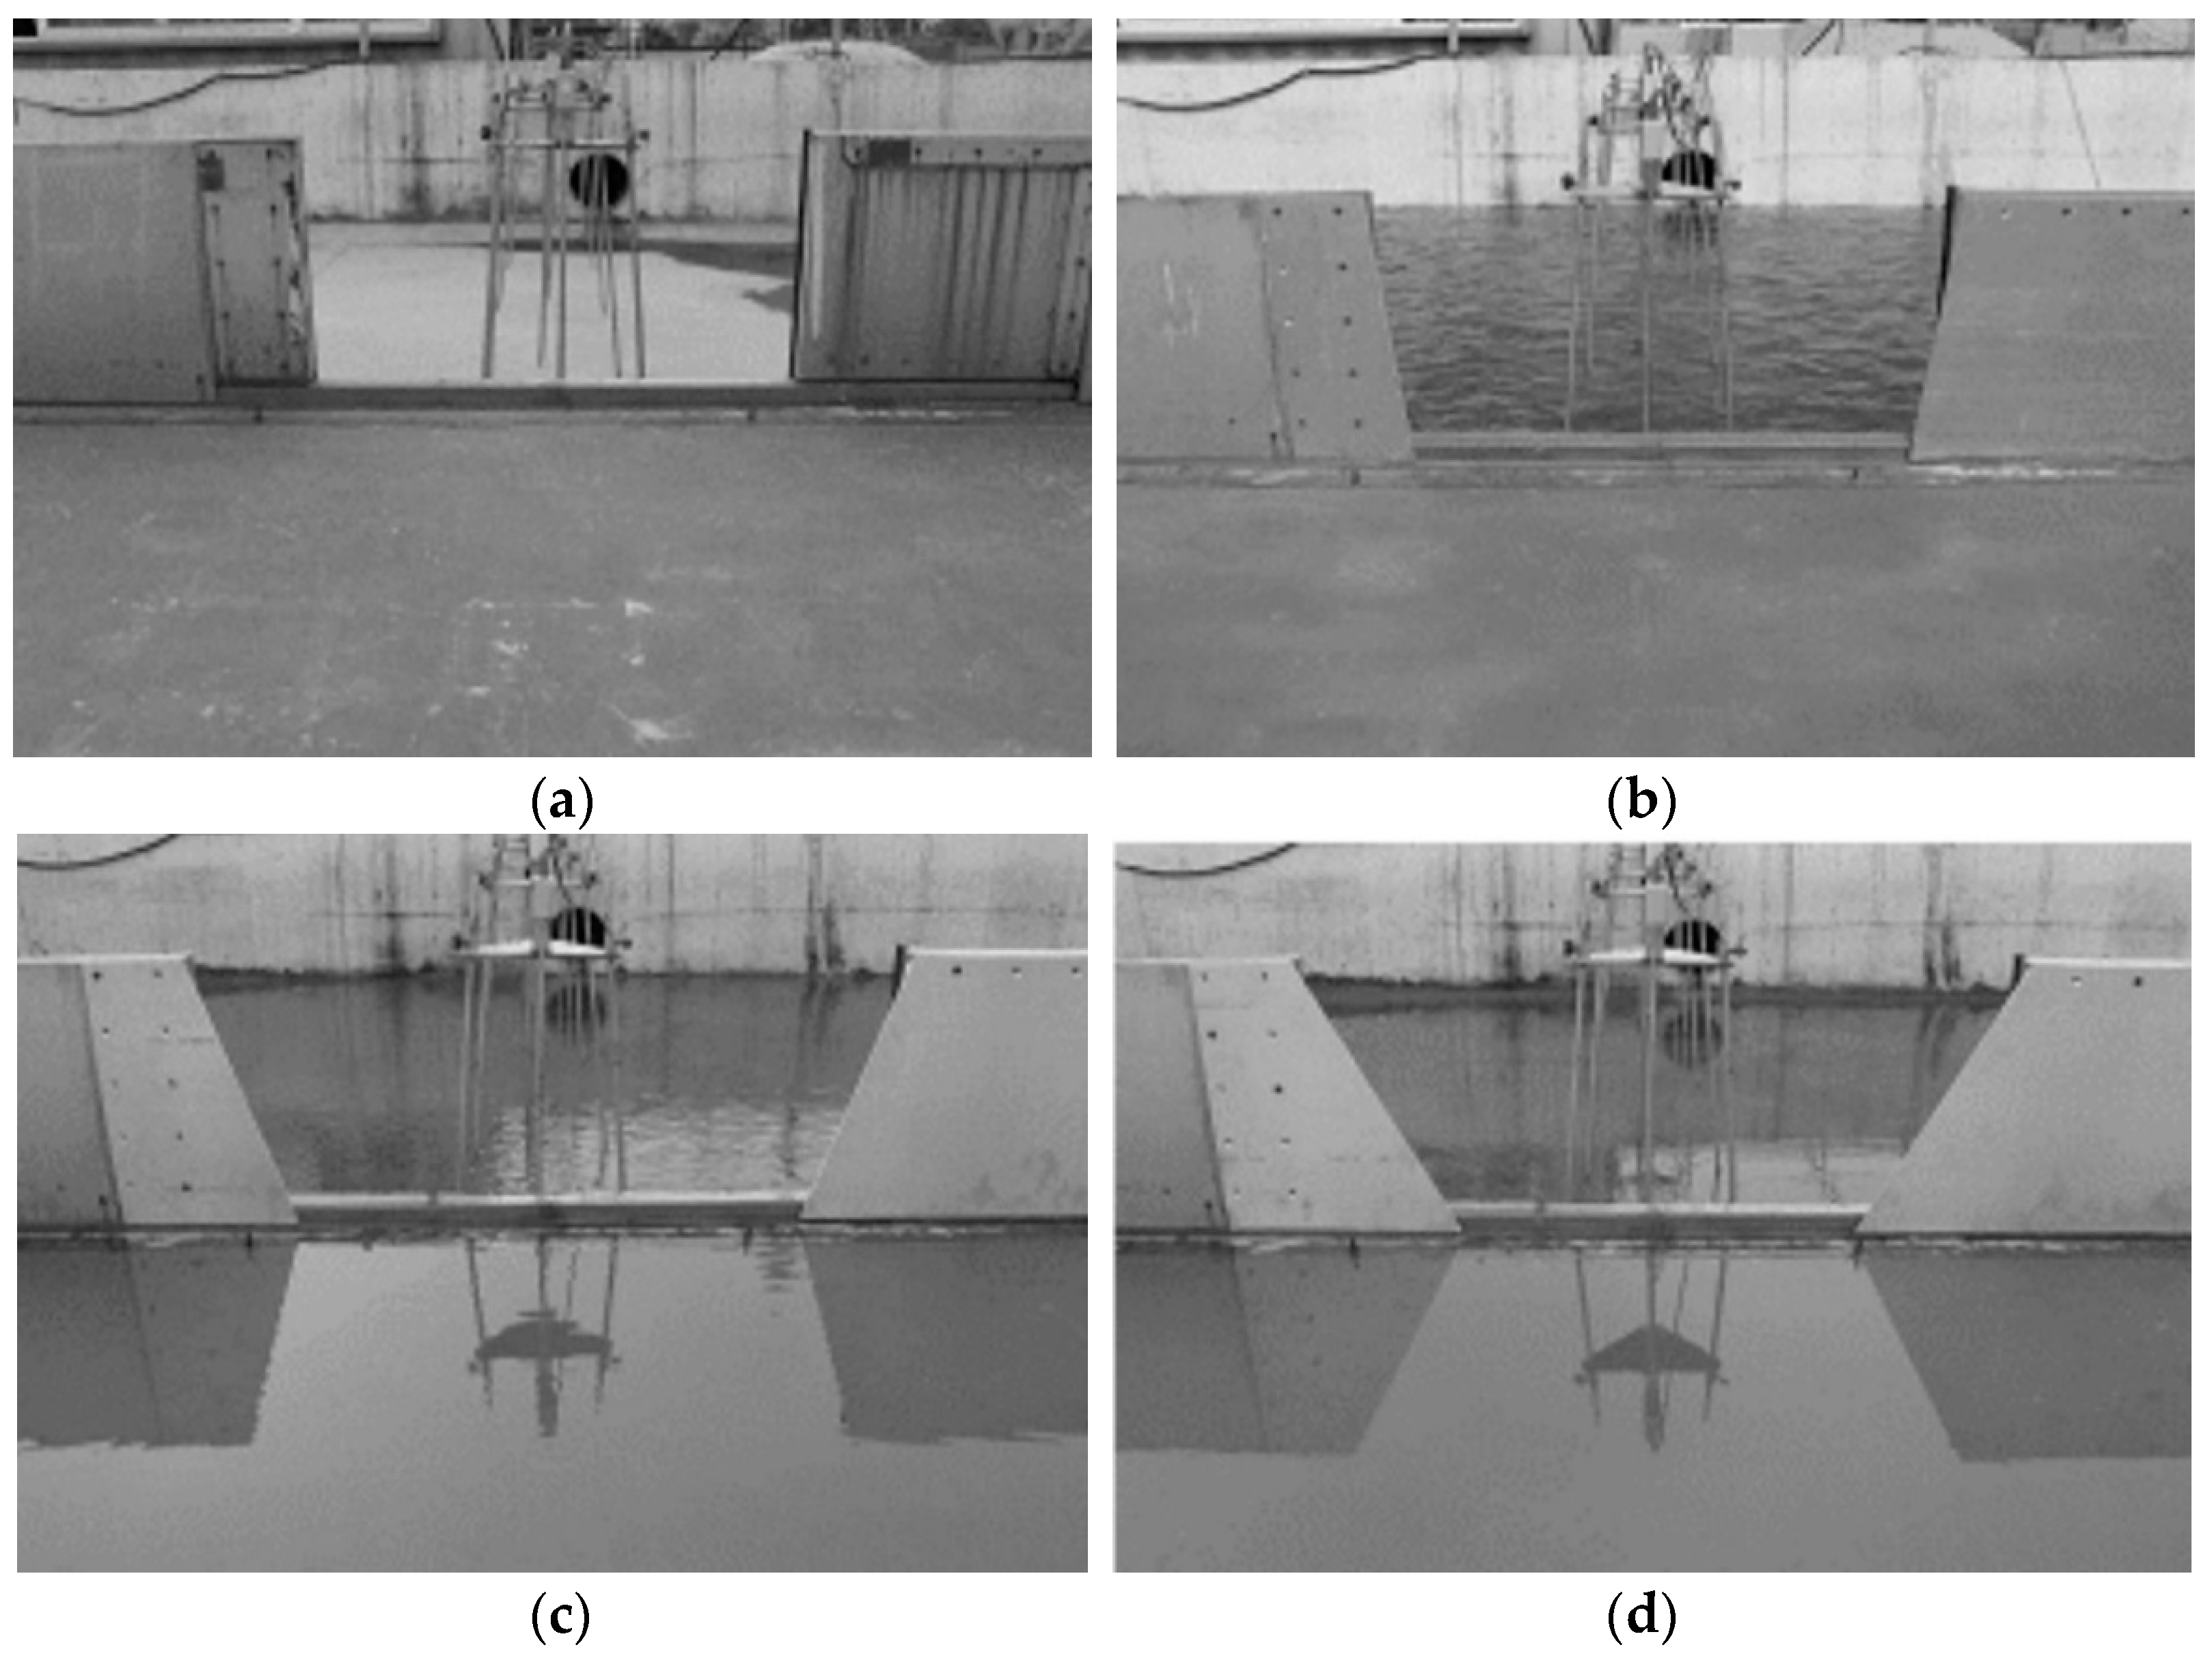
13]. The reservoir type approach stands for where velocity in a channel is lower, such as a channel in which water resources are controlled by series of spillways. A good example can be found along Kissimmee River in Florida [
21]. The South Florida Water Management District operates a series of five ogee spillways through Kissimmee River to maintain a certain water depth for irrigation and transportation. Thus, the average velocity is lower than in a natural river except for emergency conditions when the gates of all five structures should be open at the same time. To establish reservoir type in the laboratory channel similar as in the Kissimmee River, the tail gate is raised up to its maximum and then the flowrate is gradually increased until the target head over the opening is achieved. During the procedure, increment of flow rate should be small enough not to make any overflow through the downstream tailgate. When the
Ho has been stabilized with the target value, approach velocity and approach water depth are measured 7.5 m upstream from the opening. In the reservoir type approach experiments, discharge amount over the levee breach opening (
Q) is the same as the total inflow discharge (
QT) through the channel inlet. Contrary to the reservoir type approach, the river type approach stands for where a decent value of velocity can be found in the approach flow. Thus, to set up the river type approach in the channel, flow rate is gradually increased up to 0.8 m
3/s with the tailgate raised until the head over the opening is higher than the target value. Then, the tailgate is adjusted to produce a required target value of
Ho over the levee opening. After setting up each experimental condition, all of the required data are measured in a similar way as in the reservoir type. In addition to the approach water depths and velocities, velocities and water depths are measured 10 m downstream from the opening by using an ADV and capacitive wave height meters to predict the discharge amount at the downstream section in the river type approach experiments. Then, the actual amount of the discharge over the opening can be calculated by using continuity between inflow from the inlet and outflow at the exit section. The range of experimental parameters has been summarized in
Table 1.
In case of a rectangular shape of an opening, flow rate per unit width is essentially constant across the opening. Thus, the discharge coefficient can be directly decided by using Equation (7). However, for a case of trapezoidal shape, flow distribution across the cross section is non-uniform and dependent on geometries, particularly on the side slope. Thus, to account for the effect of shape on discharge coefficient, side slope,
s, in Equation (10) is absorbed in the flow area calculation, and the corresponding discharge coefficient for the trapezoidal shape of a breach opening is given below [
22,
23].
A theoretical discharge coefficient over a typical broad crested weir is 1.0, but friction losses reduce the value of the discharge coefficient,
, to 0.848. In addition to the friction losses, in the case of levee breach, flow over the opening is curvilinear to the entire crest of the opening, as shown in
Figure 1b, leading to additional energy losses, therefore, the value of discharge coefficient in case of the levee breach is even lower than 0.848. Degree of energy losses associated with the flow curvature around the opening is related to the approach flow characteristics. Thus, in this study, the behavior of discharge coefficient over the broad crested side weir as in a levee breach are explored with respect to the different approach flow conditions and the results are summarized below.
The significant non-dimensional parameters affecting value of discharge coefficient are obtained by dimensional analysis as shown in Equation (10).
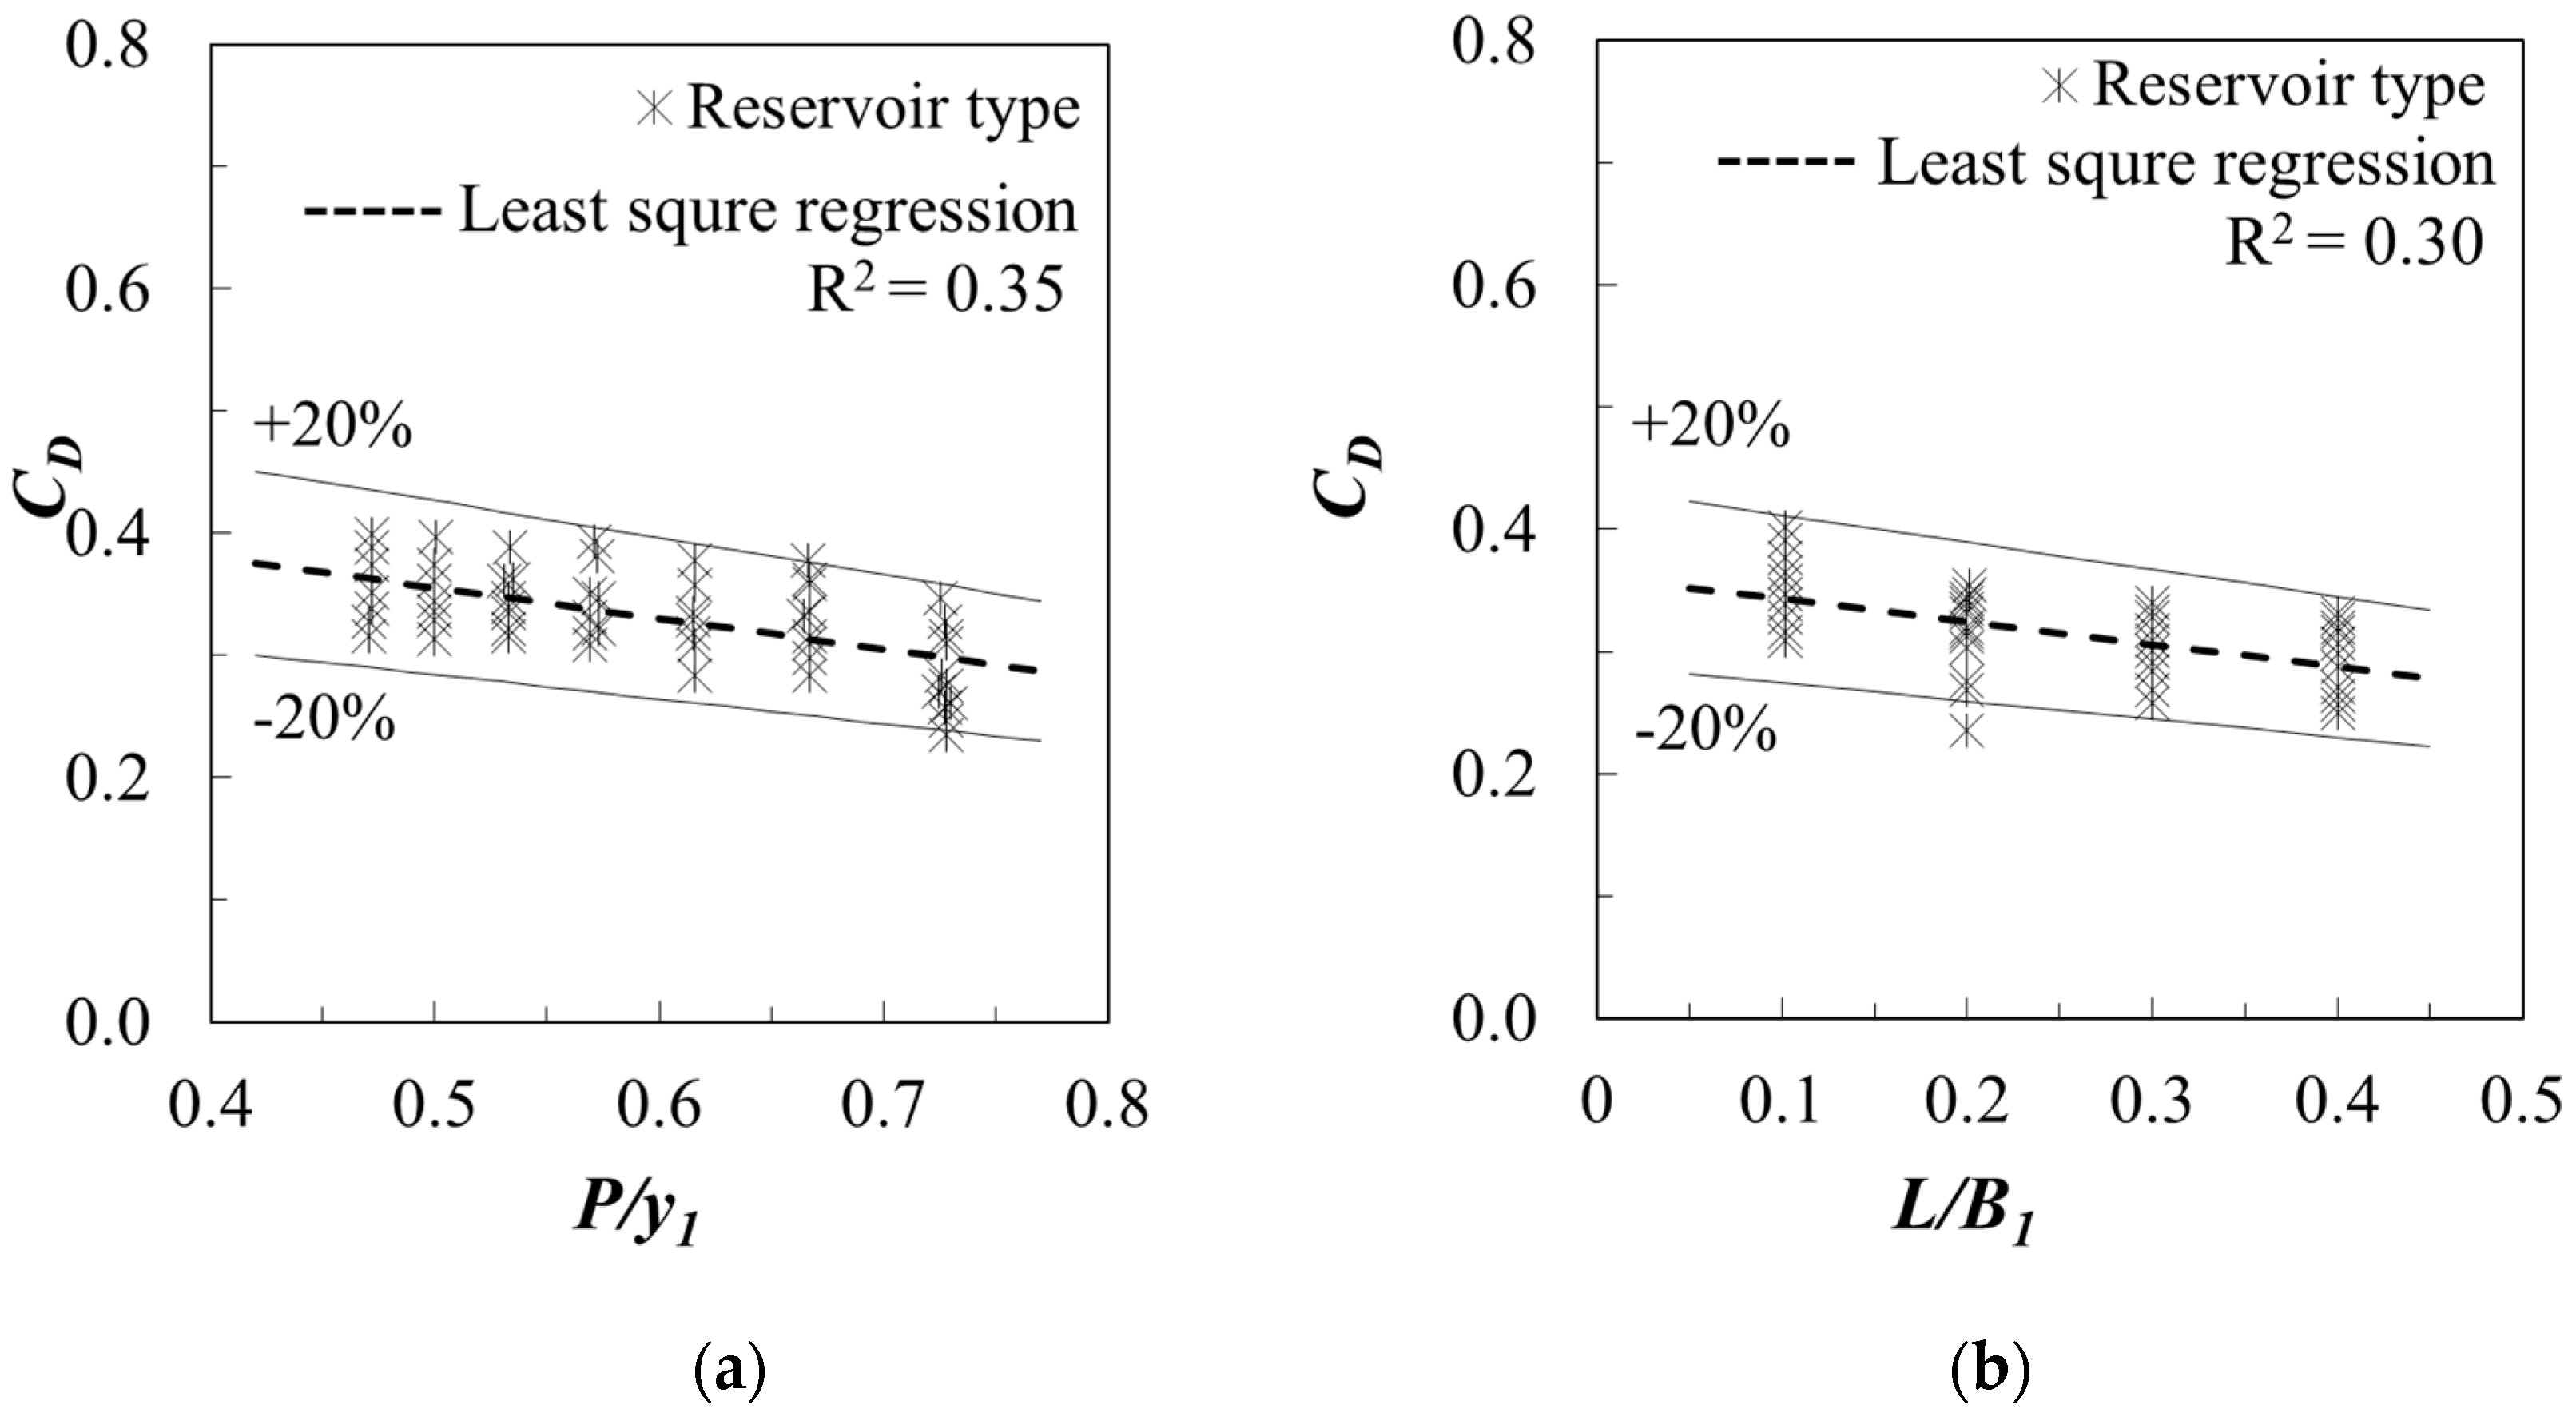
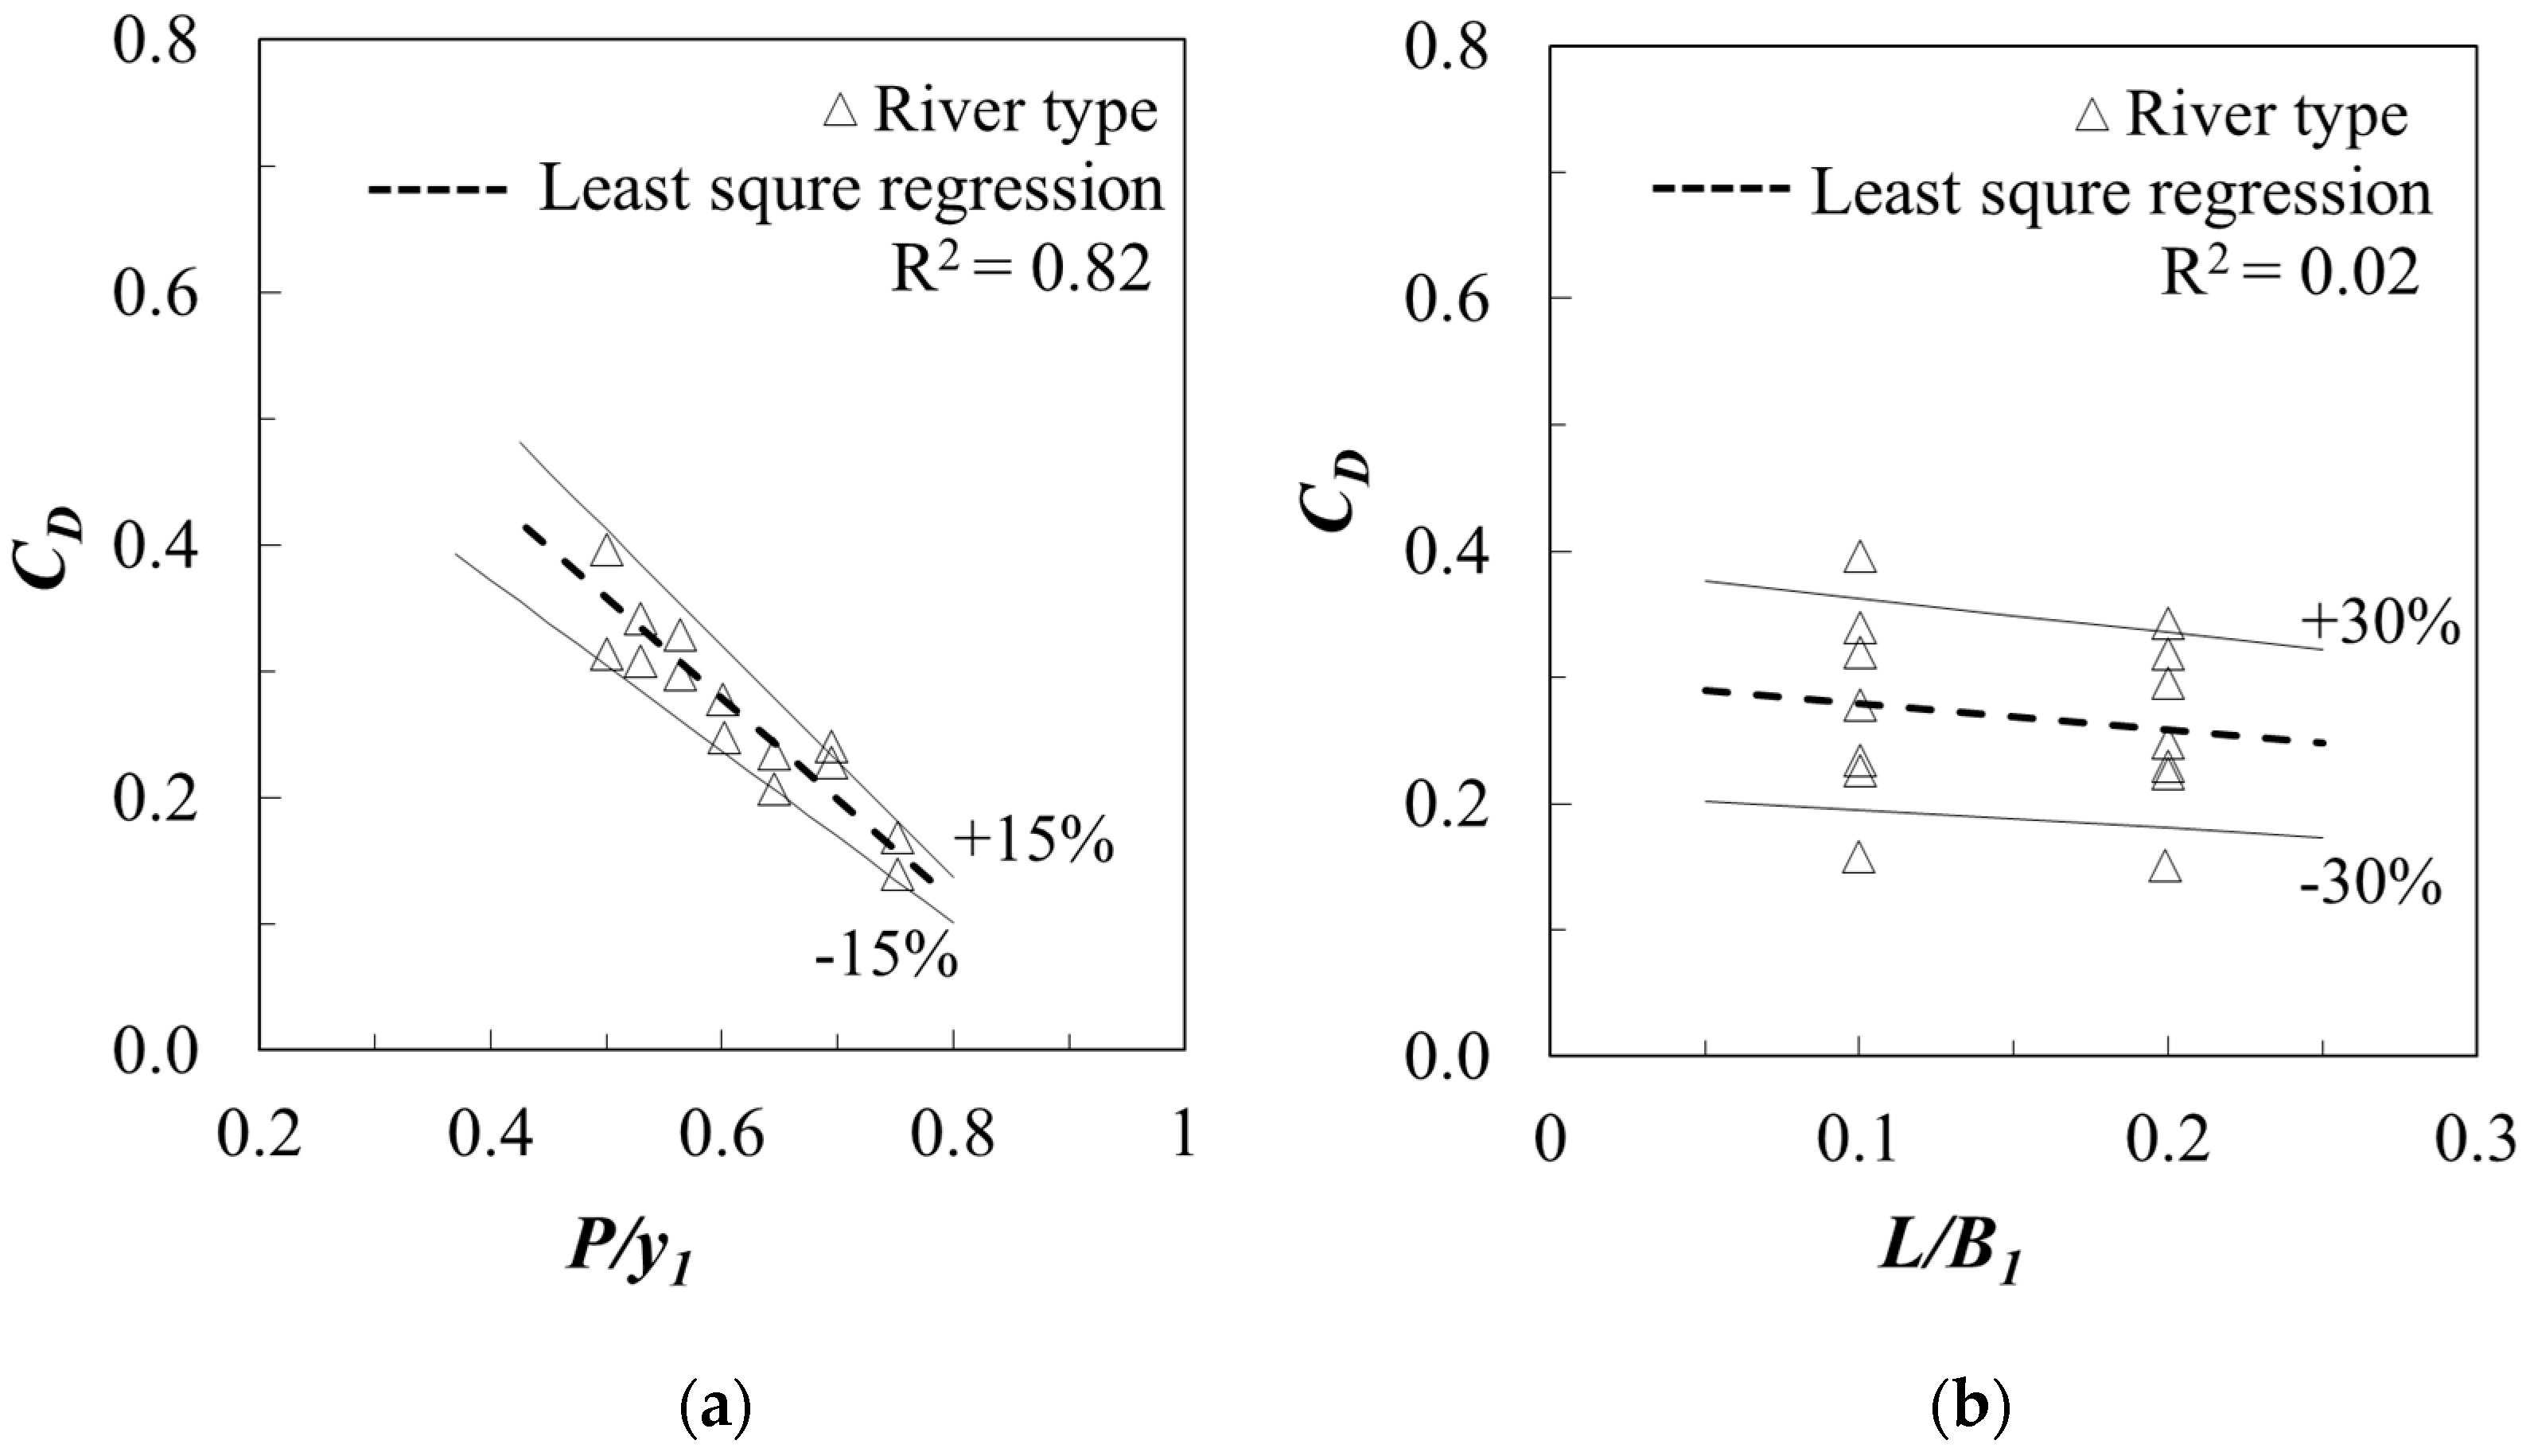
Figure 5 and
Figure 6 shows the relationship between discharge coefficients and dimensionless parameters (
P/
y1 and
L/
B1) for the reservoir type approach and the river type approach, respectively. As shown in
Figure 5 and
Figure 6, values of
P/
y1 and
L/
B1 for discharge coefficient (
CD) under different approach flow types do not show any functional relationships based on the value of coefficient of determination (
R2). Even if any comprehensive relationship cannot be determined from
Figure 5 and
Figure 6, results show that the discharge coefficient slightly decreases as the value of
P/
y1 and
L/
B1 increased. Since the value of relative weir height (
P/
y1) and relative opening width (
L/
B1) determines ratio of the surface flow to the bed flow that is deflected through the weir, it influences the discharge coefficient. In this experiment, height of weir (
P) and width of channel (
B1) is constant. Therefore, the value of
CD for both approach flow types decreases as the value of opening width (
L) increases, but increases when the water depth (
y1) increases. However, to develop any functional relationships between discharge coefficients (
CD) and the values of
P/
y1 and
L/
B1, additional experiments should be conducted with various geometries; this is a point that deserves further studies in detailed hydrodynamic simulations.
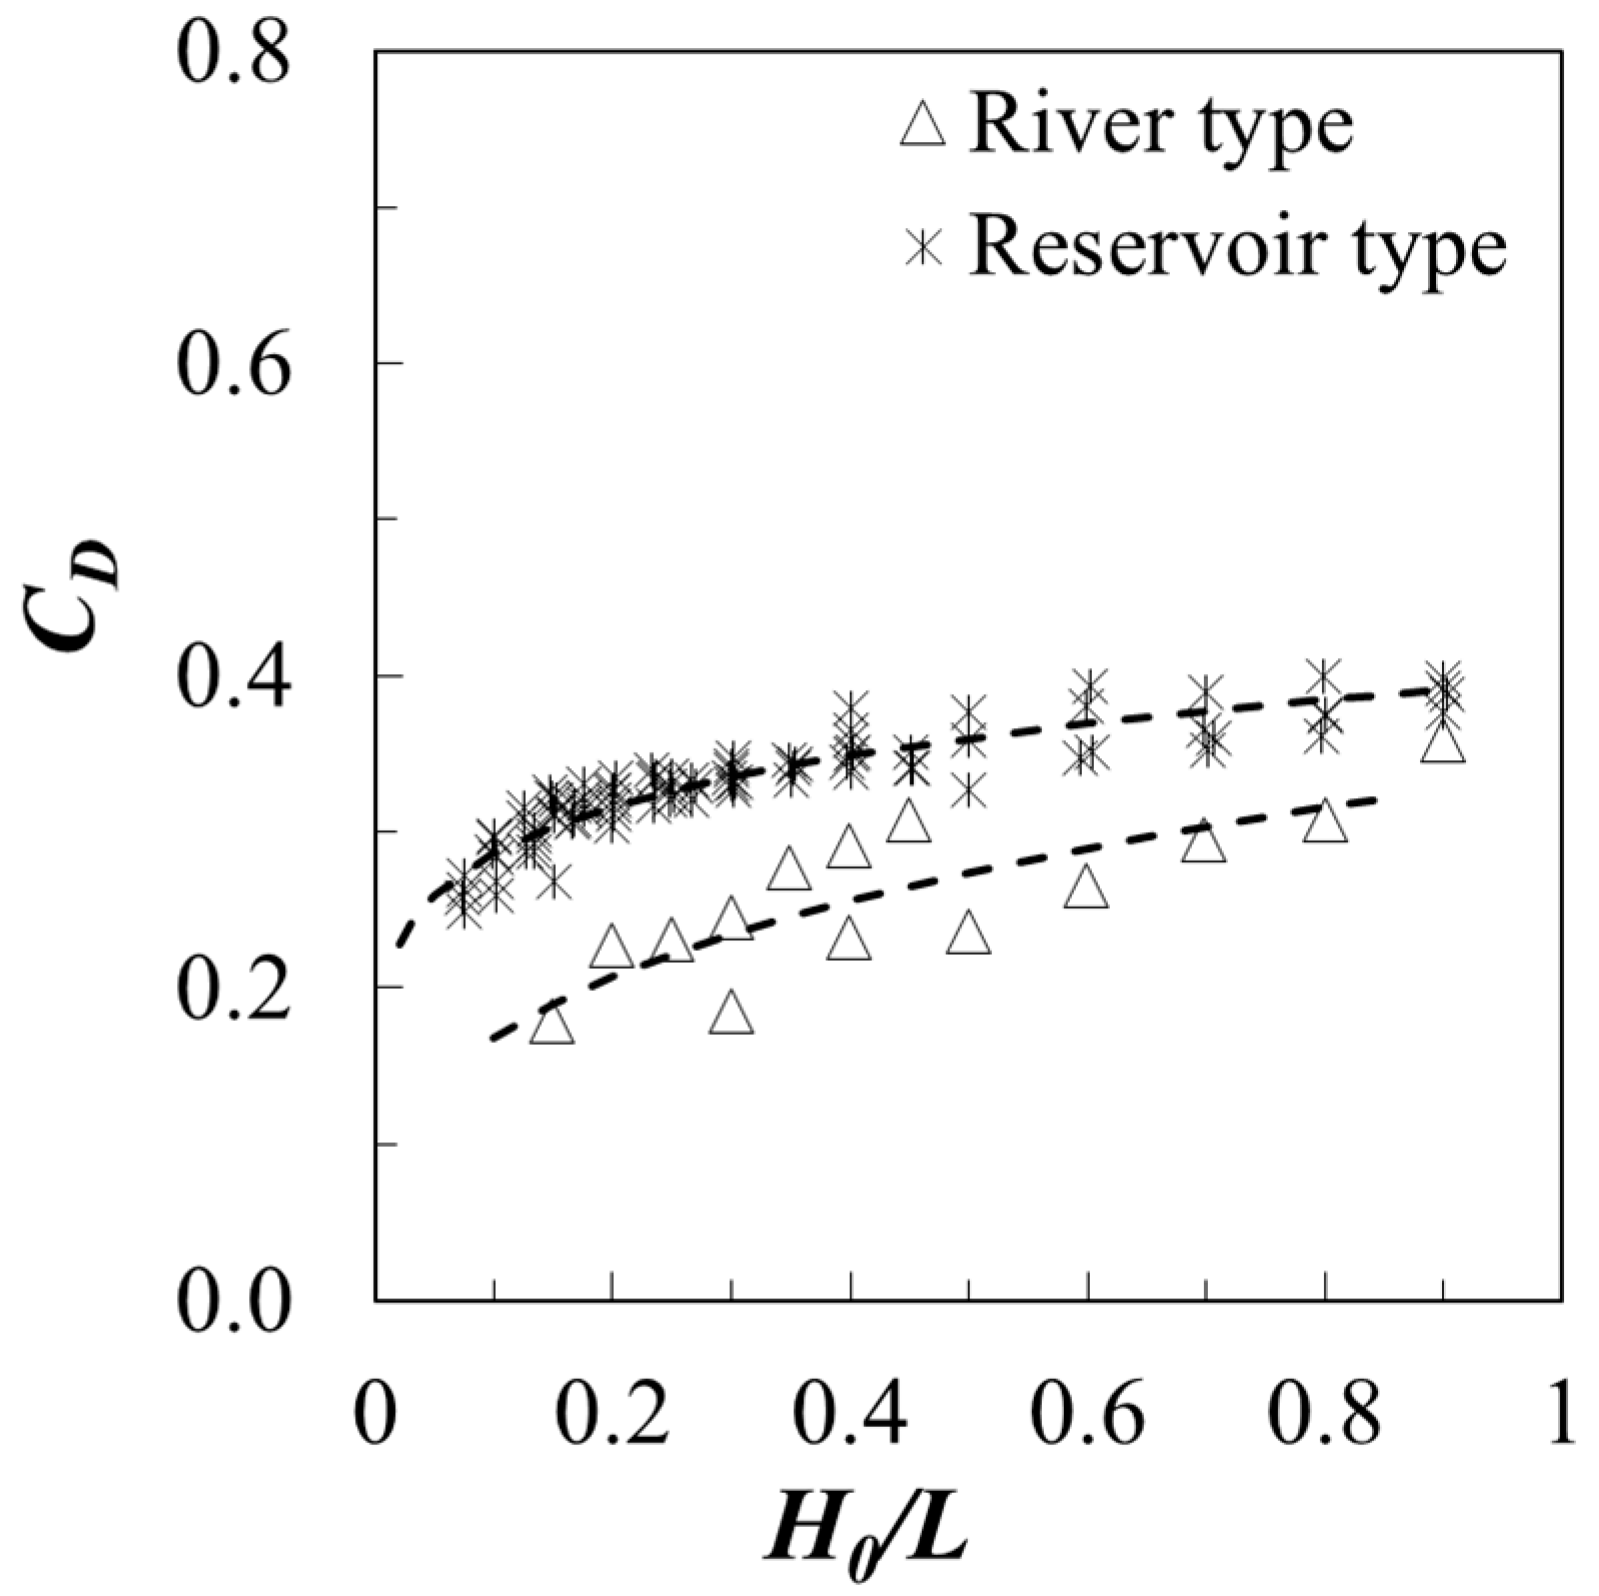
As shown in Equation (10), another influential parameter is
H0/
L. Thus, the measured discharge coefficients for both approach types are plotted in
Figure 7 according to the values of
H0/
L. Based on the classical researches including Kindsvater and Carter [
24] and Bos [
19], there is a negligible influence of
H0/
L on discharge coefficient. However, as shown in the
Figure 7, as the dimensionless variable,
H0/
L, in the
x-axis increases, the value of discharge coefficient gradually increases. Thus, power function is used in the regression analysis and the results clearly reveal that the discharge coefficient has strong relationship with the value of
H0/
L for the reservoir type approach. For the river type approach, the value of
CD increases as
H0/
L increases, but they are a slightly lower range than for the reservoir approach flow type. However, it seems that higher value of scatter can be found based on the value of coefficient of determination with respect to the regression line. Hence, it can be assumed that this preliminary results for the river type approach is over-simplified and additional variables should be considered for the analysis. This point will be discussed in next paragraph. The best-fit equation on the data given in
Figure 7 is given by
with coefficients of determination of 0.92 and 0.65 for the reservoir type approach and the river type approach, respectively.
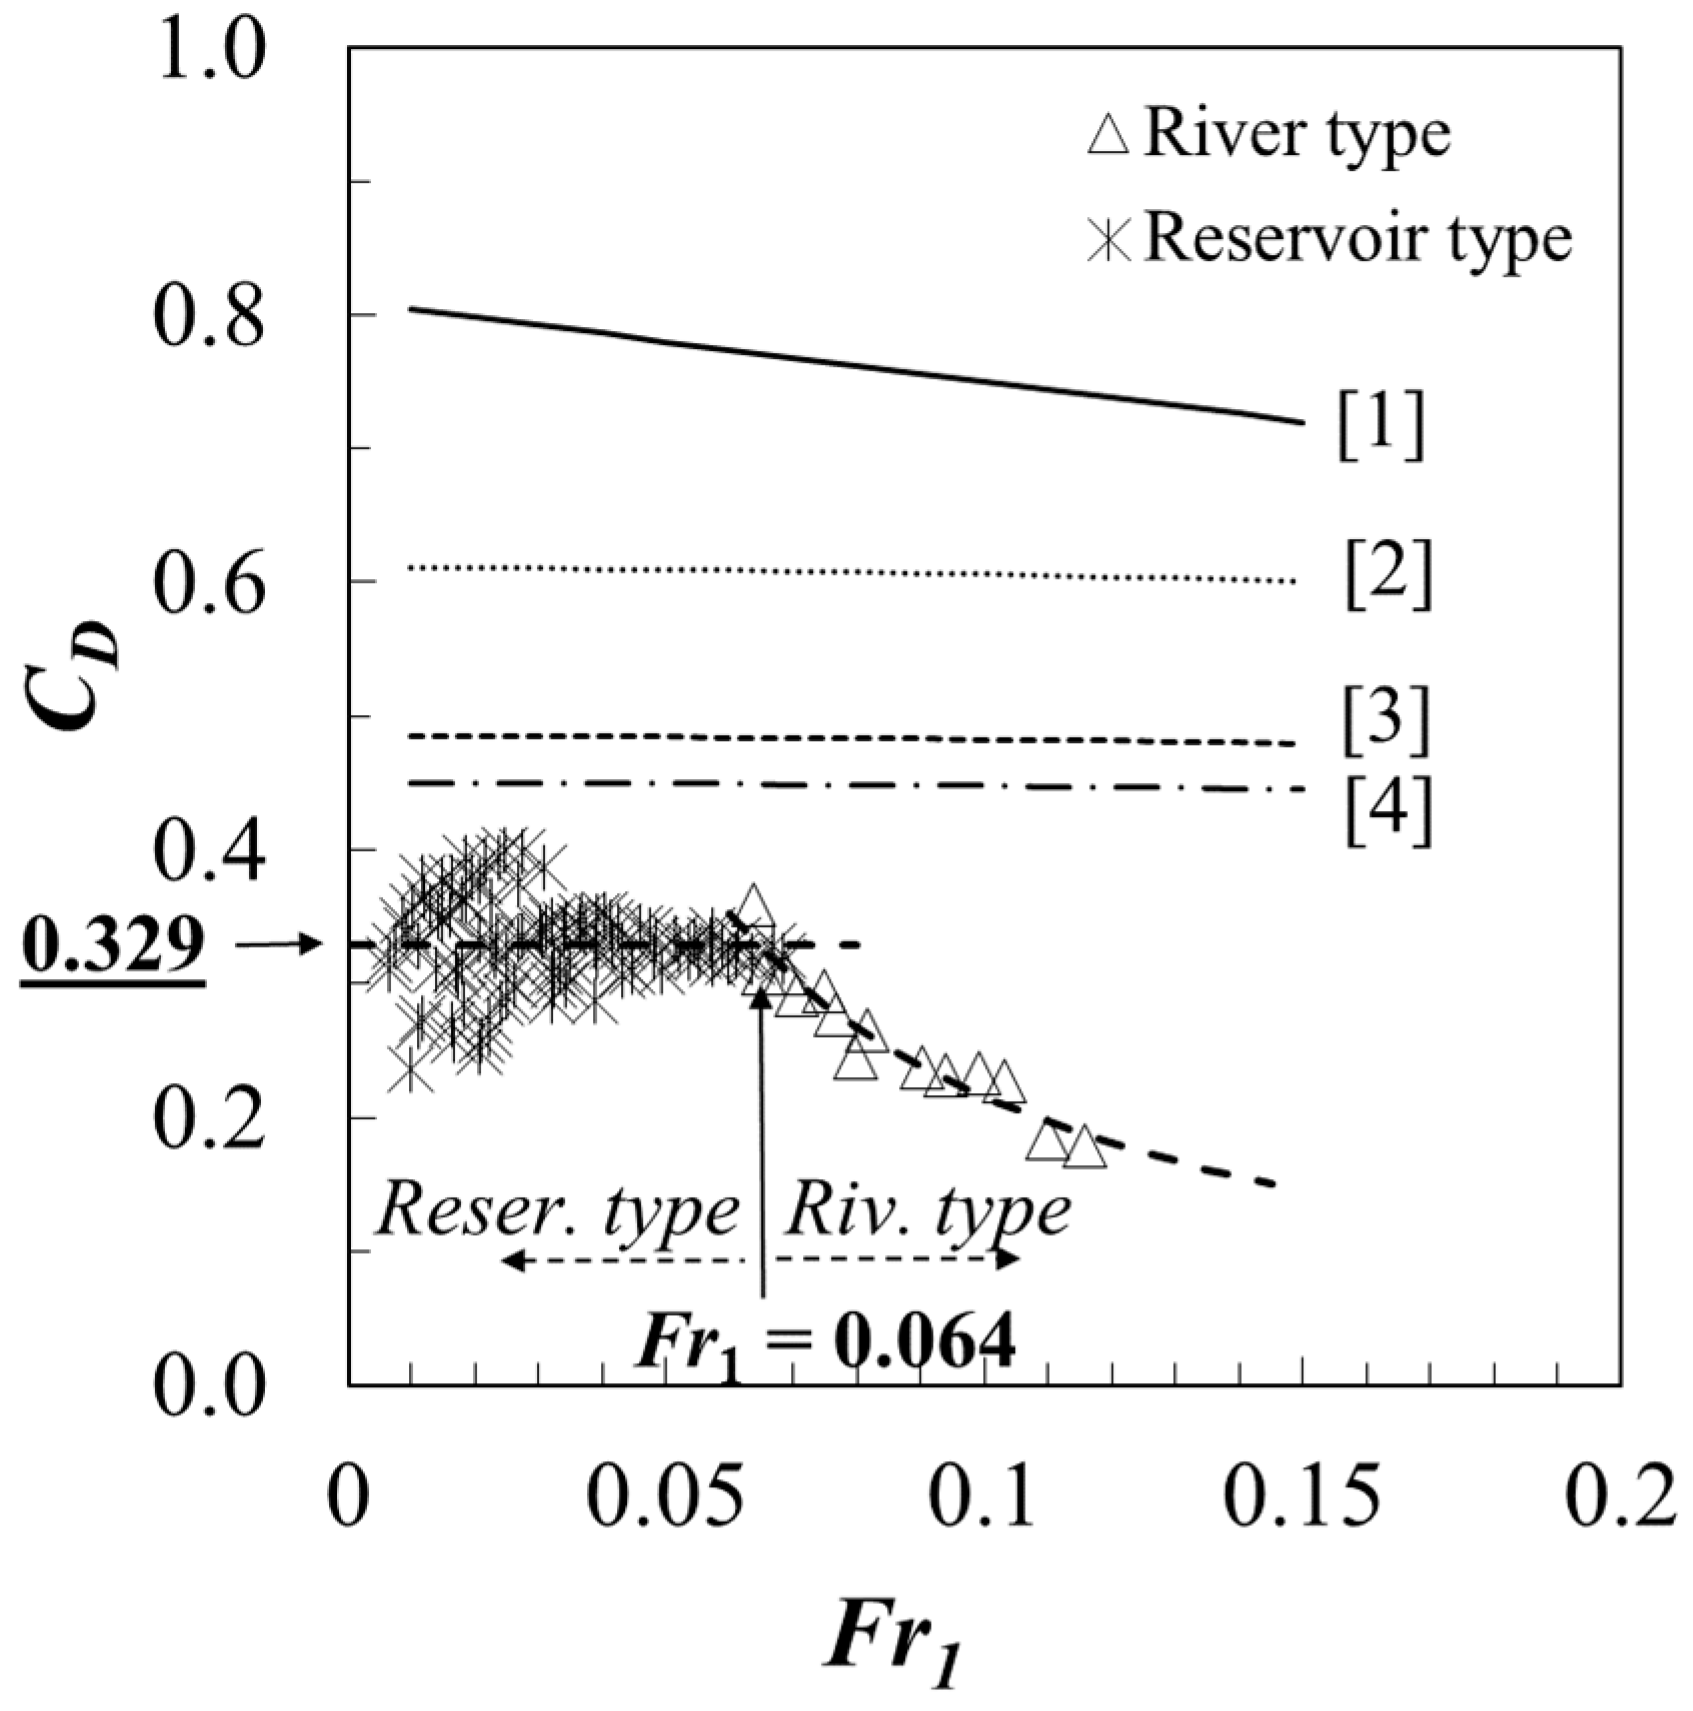
The other important parameter for the problem of discharge coefficient is approach Froude number. Usually, reservoir can be characterized as deep water depth and very low flow velocity. Thus, the corresponding value of
Fr1 for a reservoir type approach is “close to zero” and the effect of approach Froude number can be negligible. Therefore, as shown in Equation (12), discharge coefficient can be correctly estimated without considering the effect of
Fr1. However, for the river type approach, approach Froude number is important variable for the problem of rating discharge in levee breach. Thus, the effect of approach Froude number (
Fr1) on the discharge coefficient is plotted in
Figure 8. The flow curvature around the sharp edged side wall resulted in higher pressure at the control section leading to lower values of the discharge coefficient. Furthermore, due to the strong adverse pressure gradient imposed by the opening along the curved flow, the boundary layer separates at the edge of the side wall and the separation resulted in the formation of large turbulent structure. The higher turbulence also lowered the value of the discharge coefficient. Those symptoms become higher when the value of
Fr1 increase. As shown in
Figure 8, as the value of
Fr1 increases, the coefficient of discharge gradually decreases for the river type approach. However, there is no direct relationship between discharge coefficients for the reservoir type and the values of
Fr1.
As shown in
Figure 7 and
Figure 8, the discharge coefficient for river type approach shows a relationship with both of the values of
H0/
L and
Fr1. Thus, based on the multi variable regression analysis, the best-fit regression equation on the data given in
Figure 7 and
Figure 8 for the river type approach is
The value of coefficient of determination (
R2 = 0.95) for Equation (14) shows higher that the coefficient of determination (
R2 = 0.65) on Equation (13). Furthermore, Equation (14) shows that the function of
H0/
L has a relatively small dependence in the regression equation based on the value of the exponent.
Discharge coefficient can be calculated by using Equations (12) and (14) applicable to a reservoir type approach and a river type approach, respectively. However, approach flow type for given conditions must be identified first to ensure that appropriate discharge coefficient formulas is used. Thus, to suggest the transition criteria, data in
Figure 8 are examined further. As explained in the previous paragraph, the value of
CD is independent of
Fr1 for a reservoir type approach, and thus, varies from 0.23 to 0.4 in the lower bound of the
x-axis in
Figure 8. However, values of
CD are aggregated as
Fr1 increases and approached to arithmetic mean of discharge coefficient (=0.329); hence, it can be assumed that the value of
CD at the transition from the reservoir type approach to the river type occurs at the value of
CD = their arithmetic mean (0.329). Then, the regression line for the discharge coefficient of the river type approach is plotted in the figure.
Figure 8 shows when the
Fr1 < 0.064, the approach section can be considered as a reservoir type and the corresponding discharge coefficient formula is Equation (12); when the Froude number is larger than 0.064, the approach flow type is a river type, then Equation (14) should be used.
The calculated values of discharge coefficient in this study with respect to the Froude numbers are compared with the calculated discharge coefficient using formulas from four other investigators [
2,
3,
4,
5]. As shown in
Figure 8, values in this study are lower than the data set published in the previous researches. One of the possible reasons is the broad-crested shape of the weir used in this study resulting in higher amount of friction over the crest compared to a sharp-crested rectangular weir in their study. Another possible reason can be found from scale effect. Lopardo [
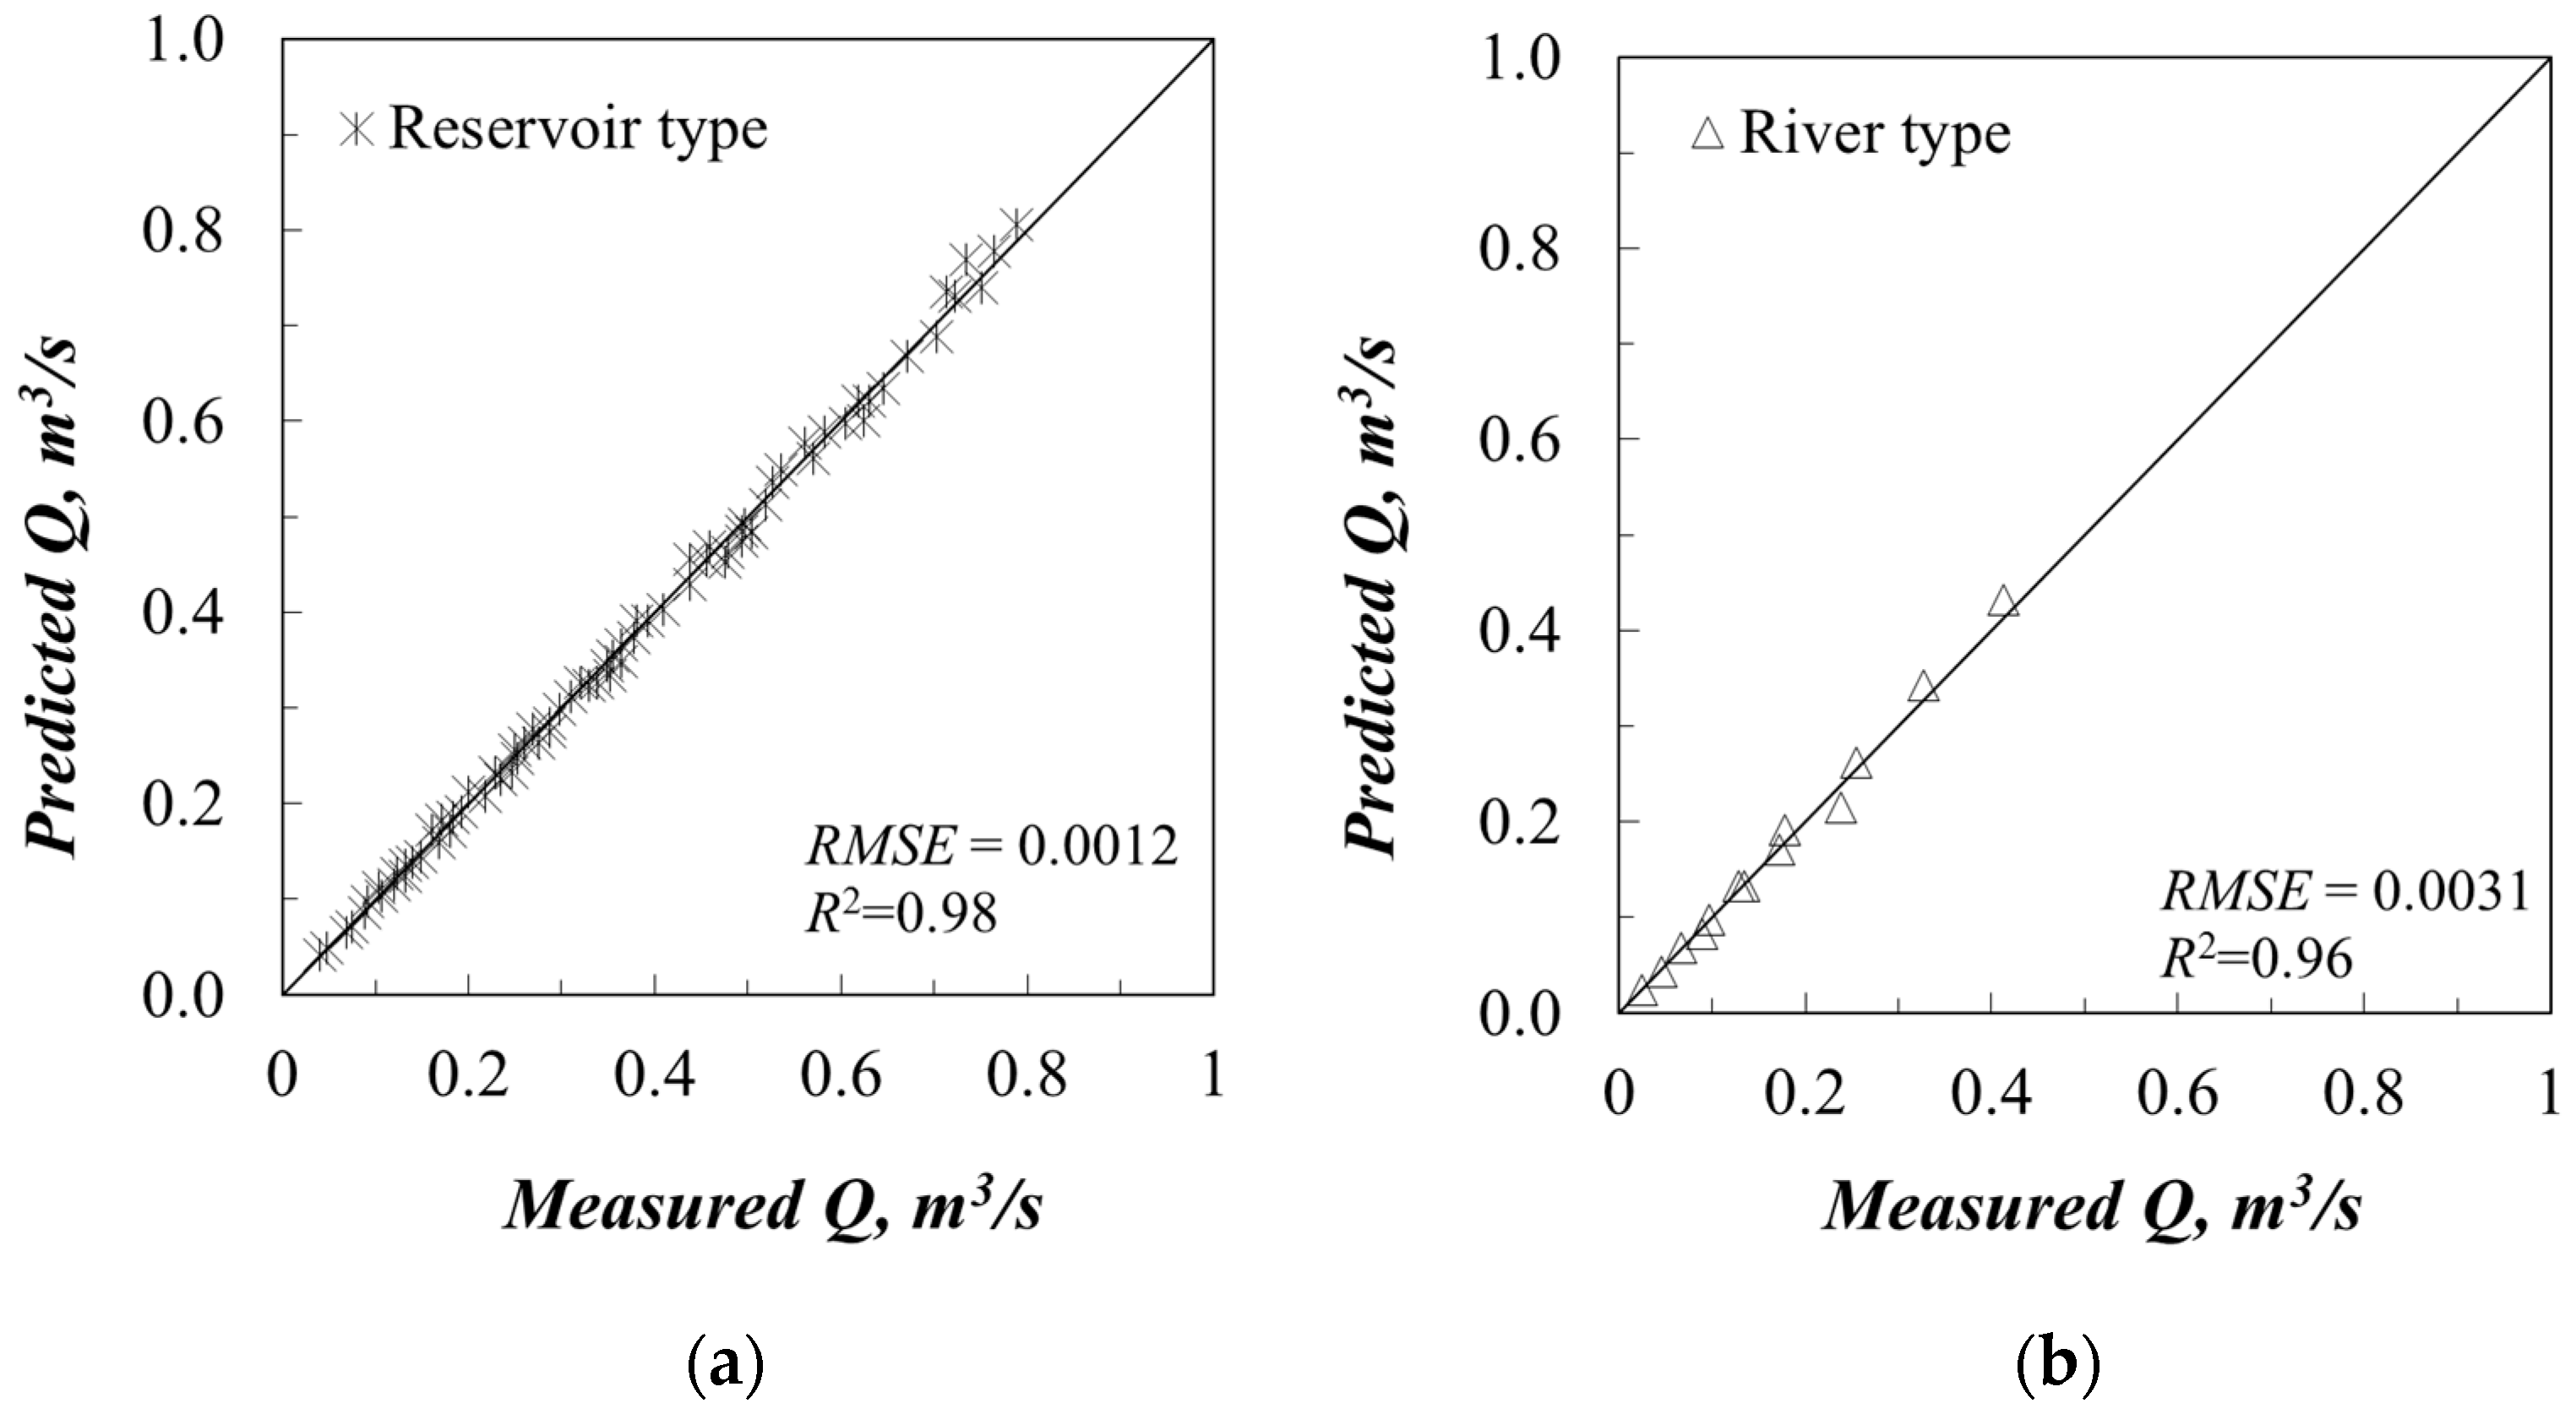
25] made an interesting model-prototype comparison that showed the limits of Froude scale models. The extreme values in a scale model were overestimated by a 1/50, due to the absence of aeration. When flow passes through the opening, the local flow motion around the vertical wall include a separated shear layer adjacent to the wall, formation of bubbles within the shear layer, and a wake region immediately downstream of the wall. The unique flow characteristics cannot be reproduced in small scale model as explained by Lopardo. Finally,
Figure 9 shows correlation between the measured and the calculated discharge over the opening. The value of stand error was 0.0012 and 0.0031 and the value of
R2 = 0.98 and 0.96 for the reservoir type approach and the river type approach, respectively, and the comparison shows good agreement between the measured and the predicted discharge.


