Article

Conversion of Secondary Forests into Chestnut Forests Affects Soil Nutrients in Anji County, China

1
Institute of Subtropical Forestry, Chinese Academy of Forestry, Hangzhou 311400, China
2
Anji Department of Forestry, Anji 313300, China
*
Author to whom correspondence should be addressed.
Sustainability 2019, 11(8), 2373; https://doi.org/10.3390/su11082373
Submission received: 17 March 2019 / Revised: 8 April 2019 / Accepted: 12 April 2019 / Published: 21 April 2019

Abstract

:
The maintenance of drinking water safety is a major environmental issue. It is necessary to strengthen environmental protection in water source areas and establish good vegetation coverage. This study examined the effects of secondary forests transformation on chestnut forests on soil nutrient changes in the Fuji Reservoir, Anji County, Zhejiang province, China. Plots were set up in a chestnut plantation and a nearby secondary forest to measure the nutrient contents of soil samples that were collected from different soil depths. Differences of soil nutrient content from the two stands were significant at 0–20 cm soil depth. There were no significant differences in the contents of total phosphorus and total potassium between the two forests; however, the available phosphorus content in chestnut stands was 2.73 mg/kg higher than in secondary forests. Overall, the soil nutrient contents under chestnut stands were lower than those under secondary forests. Some of the soil surface is exposed due to the low diversity of the chestnut forest. The soil nutrients in the chestnut forest are usually carried and transferred in soil particle form and they become dissolved in the runoff during rainfall and lost, which explains the lower soil nutrient contents in the chestnut forest than the secondary forest. Therefore, for economic forests, such as chestnut forests, measures should be taken to protect understory vegetation and enhance soil and water conservation capacity, which is conducive to retaining soil nutrients.

1. Introduction

Plants and soil are major components of ecosystems and they greatly interact with each other. Plant roots absorb nutrients in the soil to meet the needs of growth and development, and the soil also receives plant-returning organisms throughout the plant growing season. Therefore, the replacement or loss of aboveground vegetation inevitably affects the physical and chemical properties of the soil. Moreover, the forest water body has a direct impact on the hydrological process in the basin, and the impact of the forest land on the water body is the main aspect. In general, among the different forms of land use, the water output from forest land has the highest quality [1,2]. In waters with a high proportion of forests, the content of nutrients and sediments is low and the water quality is high. For example, 50–70% of the population in the United States relies on forests to provide sufficient quality water for life [3]. However, changes to forest structure may have a negative impact on water quality [4]. More substantial runoff can be produced when forest management activities cause changes in forest soil exposure and soil physical structure. Runoff can entrain a large amount of sediment, chemical fertilizers, and pesticides into the water body, causing soil erosion and non-point source pollution [5,6].
Many experts at home and abroad have studied soil nutrients [7,8,9]. In the Loess Plateau, the soil organic carbon (SOC) and available phosphorus (AP) contents of Robinia pseudoacacia Linn. forest soil and Populus tomentosa Carr. forest soil were lower than those before afforestation, and the contents of soil total nitrogen (TN), total phosphorus (TP), and total potassium (TK) were increased. Robinia pseudoacacia Linn. forest increased the content of available nitrogen (AN) and potassium (AK) in soil, but it decreased the content of Populus tomentosa Carr [10]. Liu et al. [11] found that soil alkali-hydrolyzed nitrogen and organic matter content significantly increased after potato intercropping with broad bean, whereas the soil AP, TN, and organic matter contents were significantly increased by intercropping buckwheat. Hua et al. [12] found that the soil organic matter in a tea garden in Shangnan county was deficient with an average content of 8.25 g/kg, and the AP and AK in the tea garden were also deficient.
Liu et al. [13] studied the characteristics of forest soil nutrients under different densities, and found that the contents of soil organic matter, alkali-hydrolyzed nitrogen, and AK at soil depths of 0–10 cm and 10–20 cm all showed a trend of increasing initially and then decreasing with the increase of forest density within the range of 650–2500 plants/hm2, and the contents were the highest at 1900 plants/hm2. The AP content decreased with the increase of stand density. Oladele et al. [14] found that soil pH, TN, AP, and AK content at the soil depth of 0–10 cm were significantly (p < 0.05) increased in both sandy clay loam Oxic Paleustalf and sandy loam Oxic Paleustult. However, most of the studies on soil nutrients have focused on agriculture, and to our knowledge, no studies have studied on soil nutrient changes after stand changes for this area.
In recent years, the key development of the chestnut (Castanea mollissima BL.) and white tea industry around the Fushi Reservoir (Anji County, Zhejiang Province, China) has caused the destruction of the original secondary forests, which has had a major impact on the forest soil, affects the water quality of the reservoir, and alters soil nutrients [6]. With the change of stand type, soil nutrients also changed, a large number of soil nutrients enter the water body, which affected the water quality of the Fushi reservoir. The safety of drinking water is related to the health of residents and is therefore of major importance [15]. When the nitrogen content in water is high, the excessive accumulation of nitrate in drinking water is likely to endanger human health [16]. Another consequence of the reduction of soil nutrients is non-point source pollution. The Yangtze River Delta region is rich in water resources, but non-point source pollution is widespread, especially in the Taihu Lake Basin [17,18,19,20,21,22,23,24,25,26,27]. As one of the important water sources in the Yangtze River Delta, Fushi Reservoir provides nearly 20 million cubic meters of drinking water per year for Anji County and Huzhou. Hence, its water quality is directly related to resident health in these cities. Therefore, the study of soil nutrient changes after stand change is of major importance to human health and the control of non-point source pollution.
About 20 years ago, some original secondary forests at the end of the reservoir were artificially replaced and planted with intensively managed chestnut pure forest to improve the economic conditions for local people. However, it remains unclear what changes have taken place in soil nutrients after this secondary forest was transformed into a chestnut forest and whether this change will cause non-point source pollution. Therefore, we hypothesized that secondary forests are more conducive to soil nutrient retention than chestnut forests. In this study, the chestnut forest in Fushi reservoir was selected as the research object, and the undamaged secondary forests were used as a contrast to study the change of soil nutrients in the Fushi reservoir area. The findings of this study will not only be beneficial to control non-point source pollution, but will also have important practical relevance to the management of the water source.

2. Materials and Methods

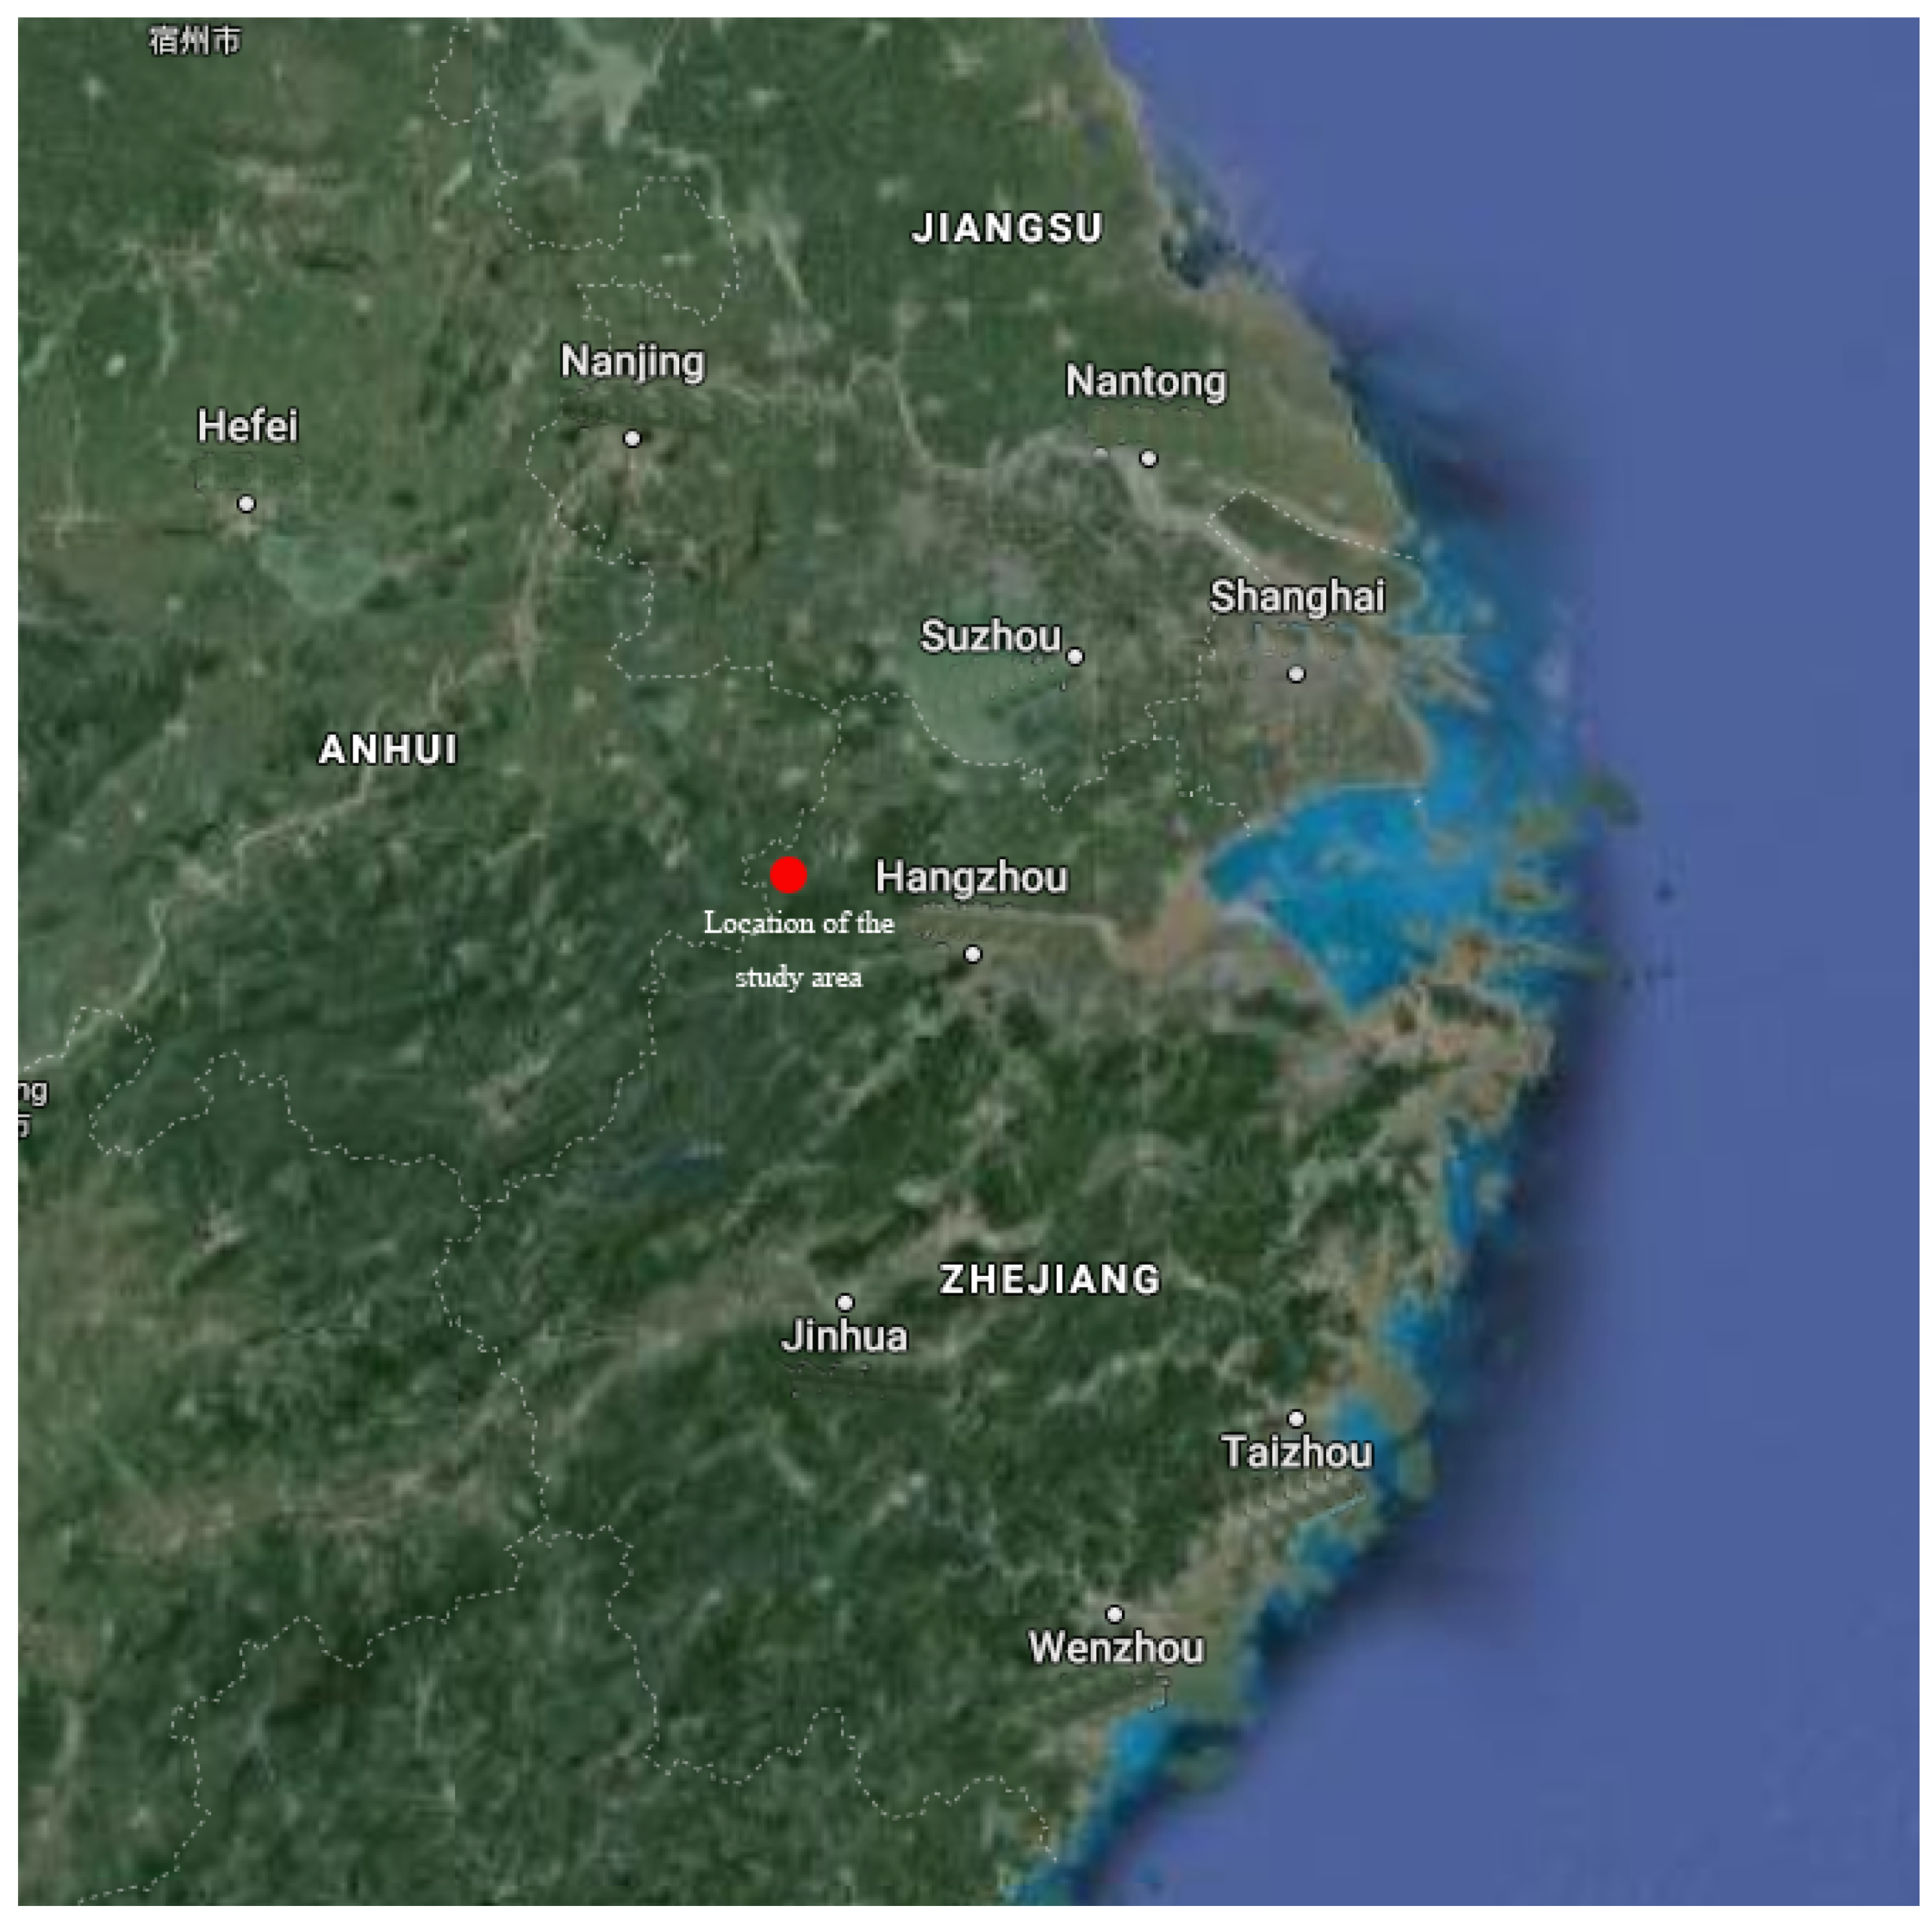
2.1. Description of Site

Anji County is located in the northwest of Zhejiang province in the western part of the Yangtze River Delta Economic Zone, between 119°14′–119°53′ east and 30°23′–30°53′ north latitude, covering an area of 1886.6 km2. Anji County is rich in bamboo. It is a known as the “Chinese Bamboo Township” and “Hometown of White Tea”. The county has a forest coverage rate of 71.1% and it is the first national ecological county. Xitiao River is the main water system in the county, with a total length of 110.75 km and a drainage area of 1806 km2. It is an important tributary of the upper reaches of Taihu Lake.
Anji County has a subtropical maritime monsoon climate, being warm and humid, with four distinct seasons [28]. The annual average temperature is between 12.2 °C and 15.6 °C, the annual rainfall is between 1100 and 1900 mm, the average annual rainfall period is 164 days, and the average annual sunshine time is 2015 h. Fushi Reservoir, also known as “Tianfu Lake”, is located 20 km west of Anji County, and it is the largest reservoir in the northern part of Zhejiang. The reservoir was built in 1970 with a storage capacity of 218 million m3. The reservoir was originally mainly intended for flood control, but it has many secondary functions, including irrigation, power generation, water supply, aquaculture, and tourism. It is also a very important source of drinking water, with an annual supply of 20 million m3 to Anji and Huzhou. The watershed of the Fushi Reservoir belongs to the comprehensive agricultural economic zone of hilly mountain grain, tea, mulberry, fruit, and forest. The soil types are mainly red soil and yellow soil. In the basin, typhoon and plum rains are likely to cause floods. After the Fushi Reservoir discharges, the water flows into the Xitiao River through the diversion channel and it finally enters Taihu Lake.
The test plot is located at the end of Fushi Reservoir (Figure 1). It has a mountainous terrain. Pure bamboo stand and chestnut pure forest dominate the vegetation, and there are some secondary forests distributed across four nearby hills. Shrub-grass structure dominate the secondary forests, but the composition of the four secondary forest plants is not completely the same, and a considerable part of each secondary forest has been cut to establish chestnut plantations. These chestnut forests have been intensively operated for more than 20 years, with pesticide weeding and fertilization every year. However, in recent years, chemical fertilization has been reduced and organic fertilizer has been used as a replacement. The plant spacing is 5 m × 5 m, the average diameter is 13 cm, the average height is 5.5 m, and the coverage is about 70%.

2.2. Details of the Secondary and Chestnut Forests

Secondary forests: 20 years old, the trees are mainly composed of Cunninghamia lanceolata (Lamb.) Hook, Castanopsis sclerophylla (Lindl.) Schott., and Brachystachyum densiflorum (Rendle) Keng. The tree heights on average are 8–10 m, 9–13 m, and 6–7.5 m, respectively. The average diameter at breast height (DBH) is 15, 20, and 5 cm, respectively, with an average branch height of 2.5, 2.5, and 2 m, respectively. Understory vegetation is sparse with no shrubs. The herbs are mainly Trachelospermum jasminoides (Lindl.) Lem., Plantago asiatica L., Plantago major L., and Plantago depressa Willd.
Chestnut forests: 20 years old, the planting density is 5 m × 5 m, the average DBH is 8.43 cm, the average tree height is 7.29 m, and the average diameter is 13.0 cm. In 2011, plants such as Torreya grandis Fort. ex Lindl. cv. Merrillii., and Photinia fraseri Dress were planted to renovate single-operated chestnut stands. Lycium chinense Mill. and Lonicera japonica Thunb. were planted in the chestnut forest. Plants, such as Lycium chinense Mill. and Lonicera japonica Thunb., were planted at intervals of 5 m × 5 m.

2.3. Soil Sample Collection and Determination of Nutrient Contents

The secondary forests and chestnut forests plots were paired and placed nearby for each plot. Chestnut forests and adjacent secondary forests were selected as the sampling points on the same hillside. The slope, slope direction, topography, and other natural conditions of each sampling point were consistent. Soil samples were collected in chestnut forests and secondary forests in June 2017. The forest soil plots for sampling were positioned at three locations below the mid-slope of the site and three sampling points were selected for each location. Soil samples were taken at 0–20 cm and 20–40 cm soil depth with soil drills. After mixing, the soil samples were placed into bags, marked, and then brought back to the laboratory for air drying, grinding, and sieving prior to determination of the soil nutrients. Table 1 shows the basic conditions for each forest soil.
The determination of soil organic matter was carried out by the potassium dichromate oxidation-external heating method. The Kjeldahl method determined the soil total nitrogen (TN). The alkaline hydrolysis-diffusion method determined the soil hydrolyzable nitrogen. The soil total phosphorus (TP) was determined by the molybdenum antimony colorimetric method; available soil phosphorus (AP) was determined by the 0.05 mol/L HCl–0.025 mol/L H2SO4 extraction method. Sodium hydroxide alkali fusion-flame photometry assigned the determination of total potassium (TK) in soil. Soil available potassium (AK) was determined by 1 mol/L ammonium acetate leaching–flame photometry. The above nutrient determination methods were all based on measurement standards [29].
Statistical and one-way ANOVA analyses were performed with SPSS 19.0 software (IBM, Armonk, NY, USA), and the figures were made in OriginPro 8.6 (OriginLab, Northampton, MA, USA).

3. Results

3.1. Soil Organic Matter Content Change

Figure 2 shows that, in plot No. 1–3, the organic matter content at 0–20 cm and 20–40 cm soil depth in the chestnut forest was lower than that in the secondary forests, and the soil organic matter content of plot No. 4 ground chestnut forest was high. There was a significant difference between the two stands at 0–20 cm soil depth in plots No. 1–3, where the chestnut stands had 13.30, 4.47, and 14.67 g/kg less soil organic matter than the secondary forests, respectively. This indicates that, since the secondary forests of plots No. 1–3 were planted with chestnut forest, which significantly reduced the content of organic matter in 0-20cm soil depths. In plot No. 4, the secondary forests of Brachystachyum densiflorum (Rendle) Keng was planted during reclamation. After the chestnut forest was planted, the soil organic matter content slightly increased. The organic matter content in the 0–20 cm soil depth of the same plot was significantly higher than that of the 20–40 cm soil depth in both chestnut forest and secondary forests. In plots No. 1, No. 2, and No. 3, the difference in soil organic matter content between the chestnut forest and the secondary forests at 0–20 cm soil depth was larger than that at 20–40 cm soil depth.

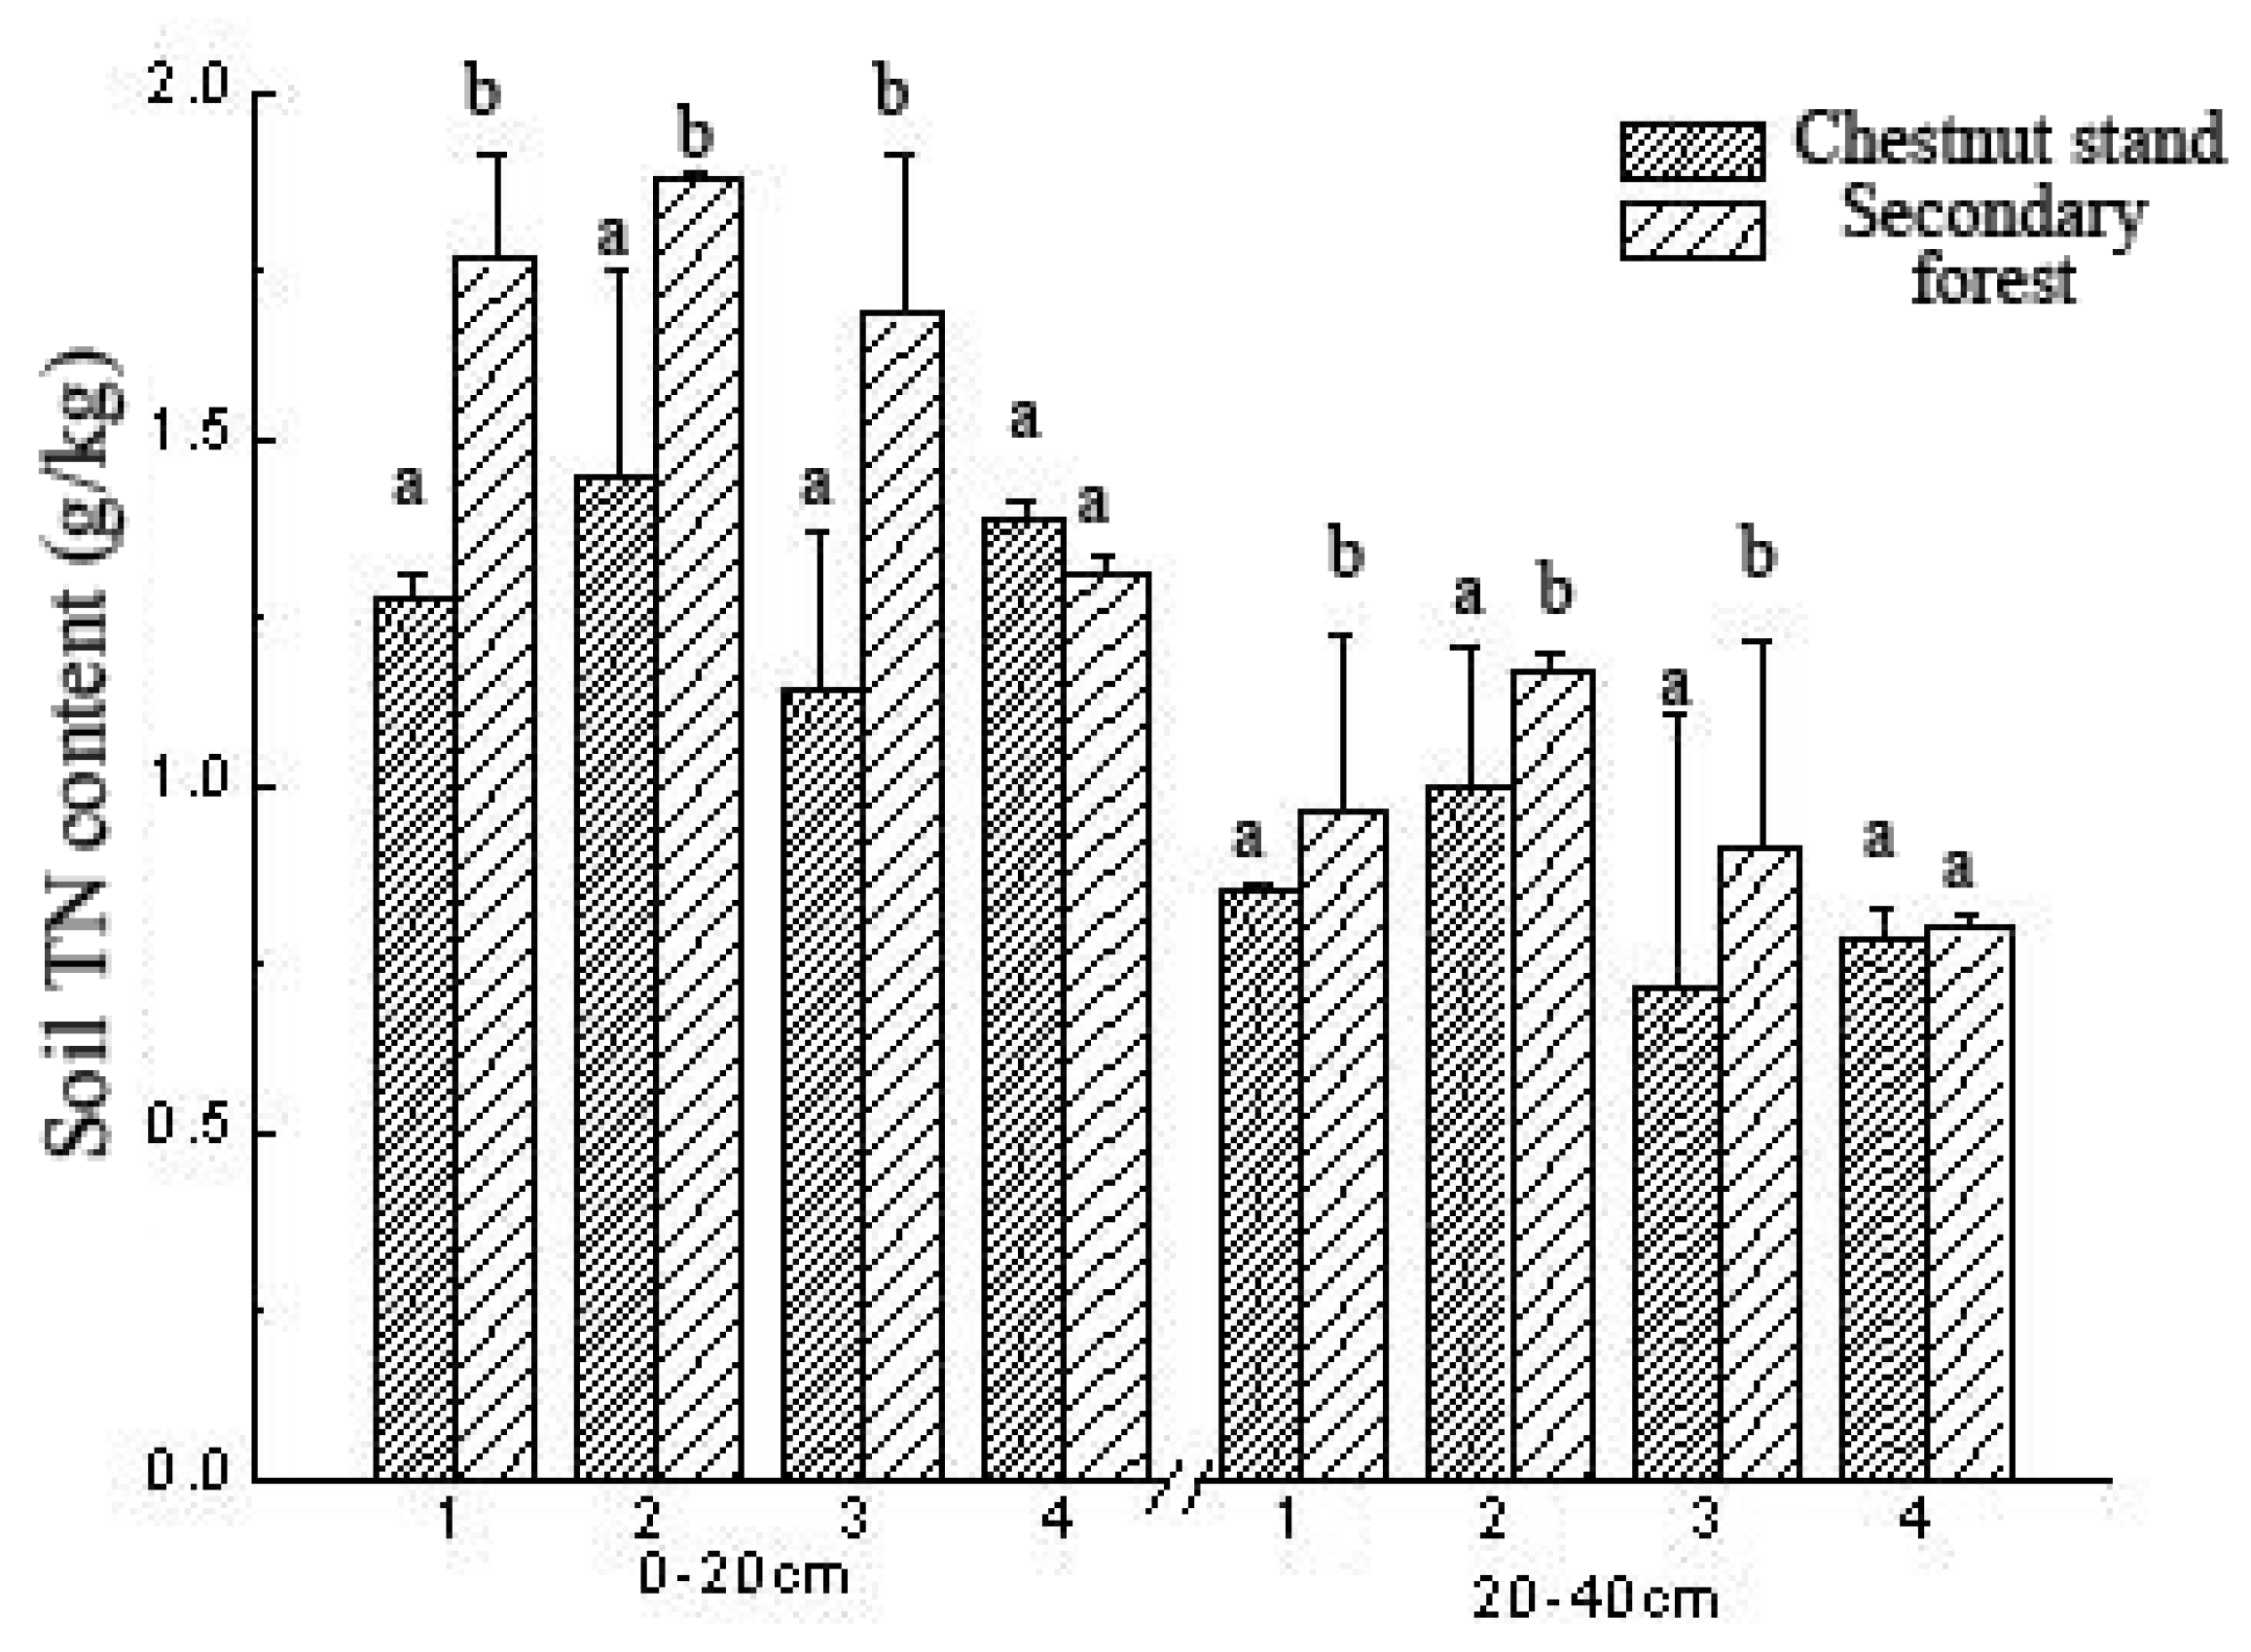
3.2. Comparison of Soil TN Content

Figure 3 shows that, in plots No. 1–3, the TN contents of the 0–20 cm and 20–40 cm soil depths in the chestnut forest were lower than those in the secondary forests. In plot No. 4, the TN content at 0–20 cm soil depth in the chestnut forest was higher than that in the secondary forests, and the TN content at 20–40 cm soil depth was slightly lower than that in the secondary forests. There was no significant difference between the two stands for the TN content at both soil depths of plot No. 4. This indicates that the cultivation of chestnut forest in the secondary forests reduced the TN content at both soil depths in plots No. 1–3. After the chestnut forest was planted in the secondary Brachystachyum densiflorum (Rendle) Keng forests, the TN content at 0–20 cm soil depth increased slightly, and decreased slightly at the 20–40 cm soil depth. The TN content at the 0–20 cm soil depth of the same plot was significantly higher than the TN content at 20–40 cm in both the chestnut forest and secondary forests. The TN content of 0–20 cm soil depth of chestnut forest was 0.42, 0.45, 0.43, and 0.61 g/kg higher than that of 20–40 cm in plots No. 1–4, respectively. The difference of TN content between the two soil depths in secondary forests was 0.79, 0.71, 0.77, and 0.51 g/kg in plots No. 1–4, respectively. These findings indicate that in plots No. 1–4, the difference in soil TN content was different between the 0–20 cm soil depth and the 20–40 cm soil depth in the chestnut forest and the secondary forests in these plots. This further indicates that, after the secondary forests were reclaimed and planted in chestnut forest, the change in TN content at 0–20 cm soil depth was larger than that at 20–40 cm soil depth.

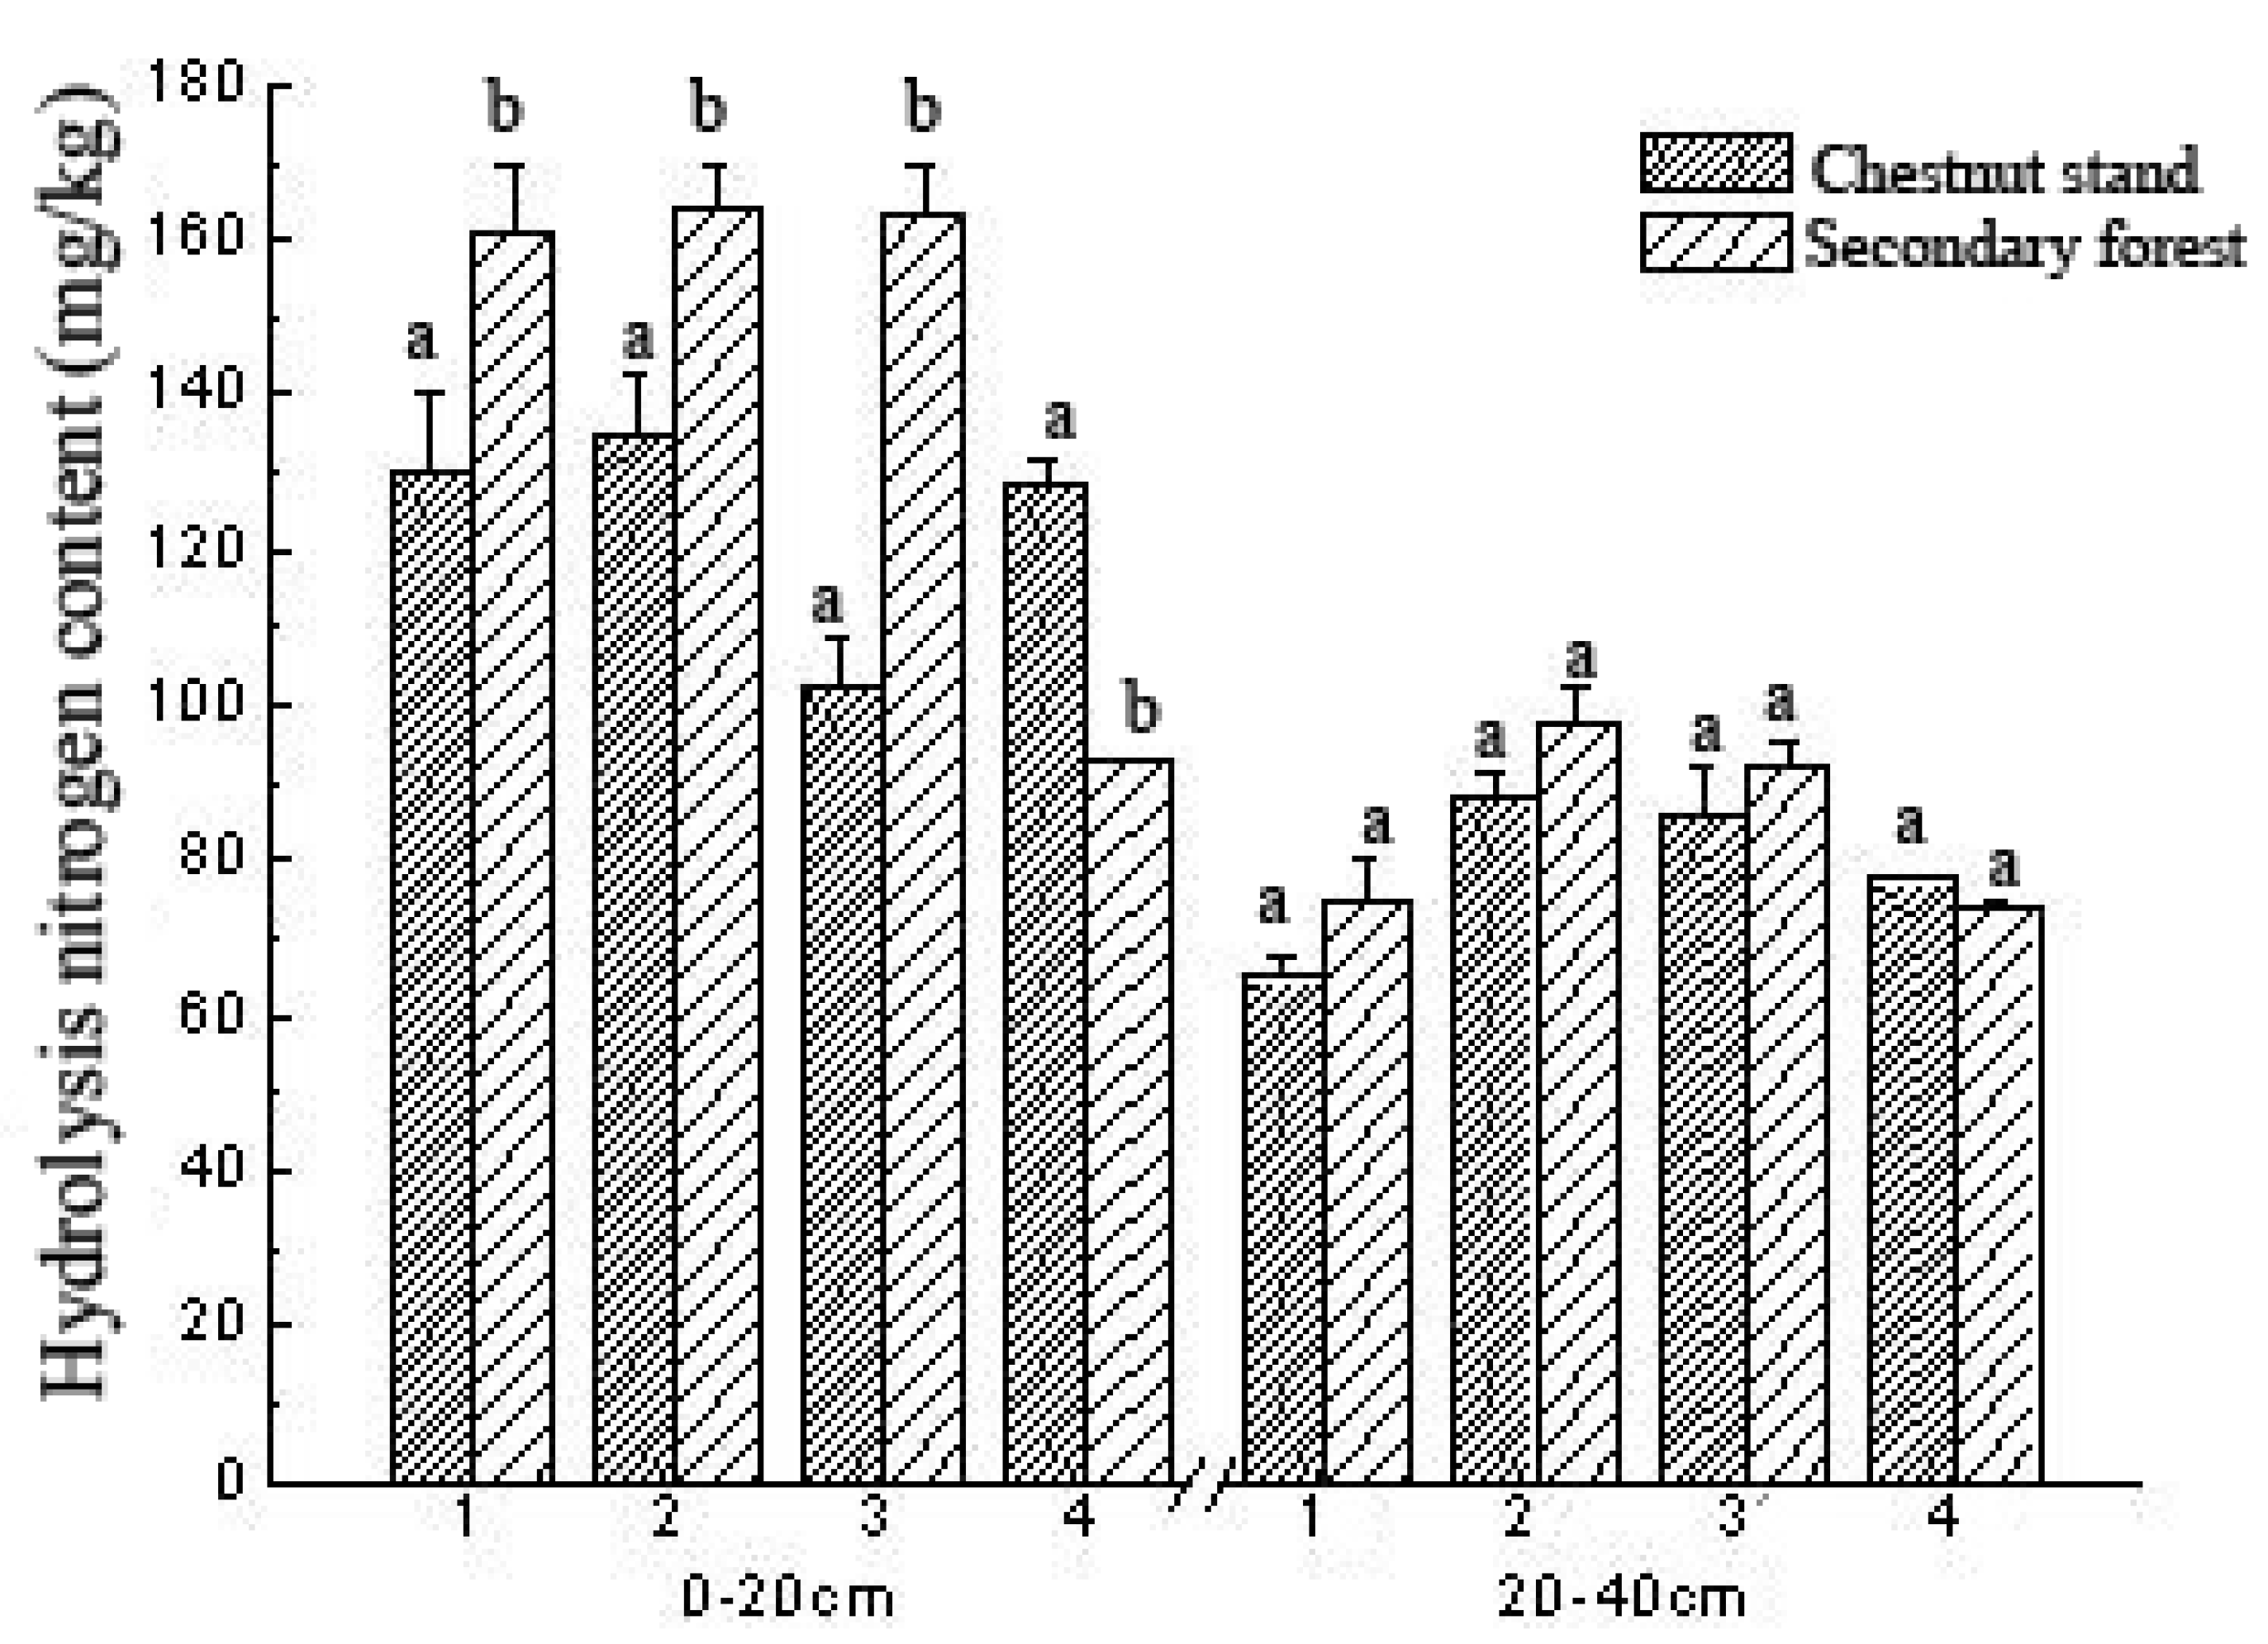
3.3. Comparison of Soil Hydrolyzable Nitrogen Content

Figure 4 shows that, in plots No. 1–3, the hydrolyzable nitrogen content of the 0–20 cm and 20–40 cm soil depths in the chestnut forest was lower than that in the secondary forests. However, plot No. 4 was the opposite, the soil hydrolyzable nitrogen content in chestnut forest land was higher than that in secondary forests at both soil depths. The hydrolyzable nitrogen content at 0–20 cm soil depth was significantly different between the chestnut forest and secondary forests in all the plots. The hydrolyzable nitrogen content of chestnut forest at 0–20 cm soil depth of plots No. 1–4 was 31.00, 29.00, 60.77, and 35.56 mg/kg lower than that of the secondary forests, respectively. There were no significant differences between the chestnut and secondary forests at 20–40 cm soil depth. These findings indicate that planting with chestnut forest reduced the content of hydrolyzable nitrogen in the two soil depths in plots No. 1–3. The change was significant at 0–20 cm soil depth and not significant at 20–40 cm. For the chestnut forest and secondary forests, the content of hydrolyzable nitrogen at 0–20 cm soil depth in the same plot was significantly higher than that at 20–40 cm. In plots No. 1–4, the difference in soil hydrolyzable nitrogen content between the 0–20 cm soil depth was different in the chestnut forest and the secondary forests in these plots. These findings indicate that, after the secondary forests were reclaimed and replanted as chestnut forest, the change in hydrolyzable nitrogen content at 0–20 cm soil depth was larger than that at the 20–40 cm soil depth.

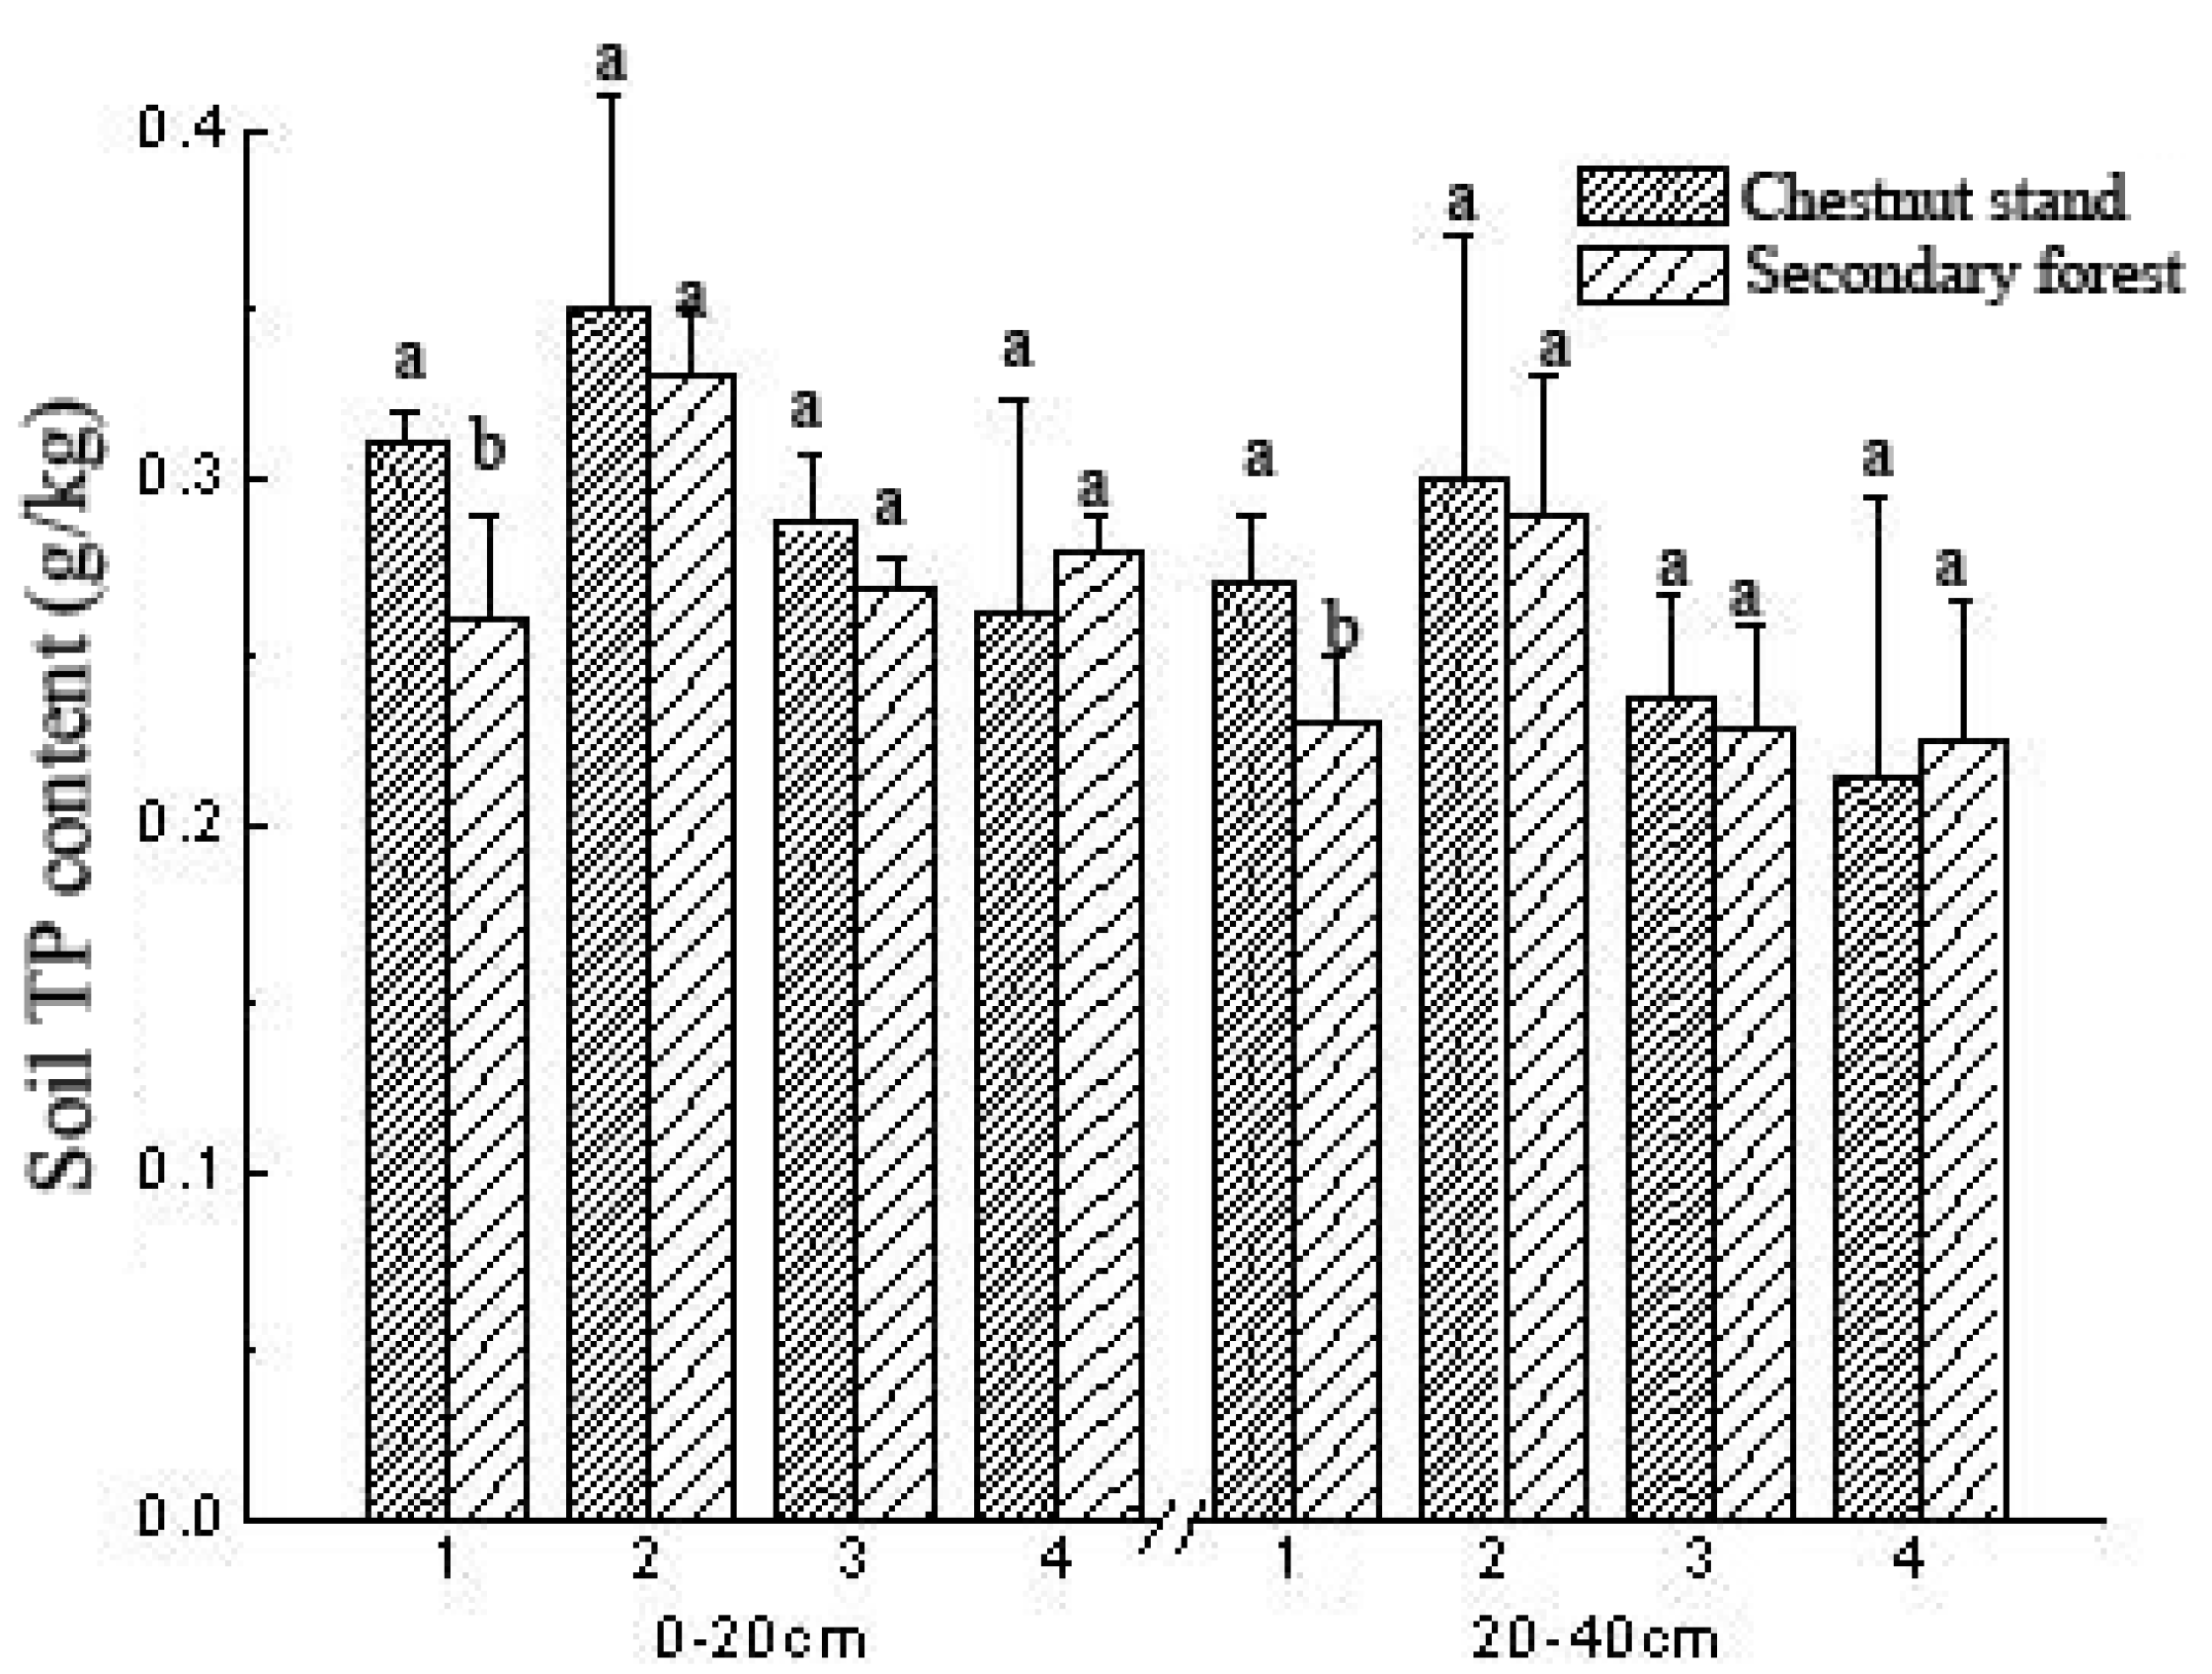
3.4. Comparison of Soil TP Content

Figure 5 shows that, in plots No. 1–3, the TP content of the 0–20 cm and 20–40 cm soil depths of the chestnut forest was higher than that of the secondary forests, whereas plot No. 4 was the opposite, showing a lower TP content in the soil of chestnut forest than the secondary forest. At both soil depths, the TP content of the two soil depths in plot No. 1 was significantly different between the chestnut forest and the secondary forest. These findings indicate that planting with chestnut forest in plots No. 1–3 increased the content of TP at both soil depths; however, only the TP content of plot No. 1 significantly increased. The TP content reduced at both soil depths in plot No. 4. For the chestnut forest and secondary forest, the TP content at 0–20 cm soil depth in the same plot was significantly higher than that in 20–40 cm, and the TP content at 0–20 cm soil depth of chestnut forest was 0.04, 0.05, 0.05, and 0.04 g/kg higher than that at 20–40 cm in plots No. 1–4, respectively, and the difference of TP content in the two soil depths of secondary forest was 0.03, 0.04, 0.04, and 0.05 g/kg, respectively. This indicates that there was little change in soil TP content following the planting of secondary forests with chestnut forest at either soil depth.

3.5. Comparison of Soil AP Content

Figure 6 shows that, in plots No. 1–4, the AP at 0–20 cm and 20–40 cm soil depths were higher in the chestnut forest than in the secondary forest, and the difference was significant at 0–20 cm soil depth. This indicates that, since the secondary forests of plots No. 1–4 were planted with chestnut forest, the AP content has increased at 0–20 cm soil depth. This change was significant at 0–20 cm soil depth, but not at 20–40 cm. Moreover, for the chestnut forest and secondary forest, the AP content at 0–20 cm soil depth in the same plot was significantly higher than that at 20–40 cm. The AP content at 0–20 cm soil depth in the chestnut forest was 2.16, 1.69, 1.91, and 1.45 mg/kg higher than that of the 20–40 cm soil depth, respectively. The difference of AP content between the two soil depths of secondary forest was 1.29, 0.87, 0.93, and 0.89 mg/kg for plots No. 1–4, respectively. In summary, in plots No. 1–4, the difference in soil AP content between the 0–20 cm and 20–40 cm soil depths in the chestnut forest and the secondary forest in these plots was different. Moreover, after the secondary forest was reclaimed and then planted with chestnut forest, the change in AP content at 0–20 cm soil depth was larger than that at 20–40 cm.

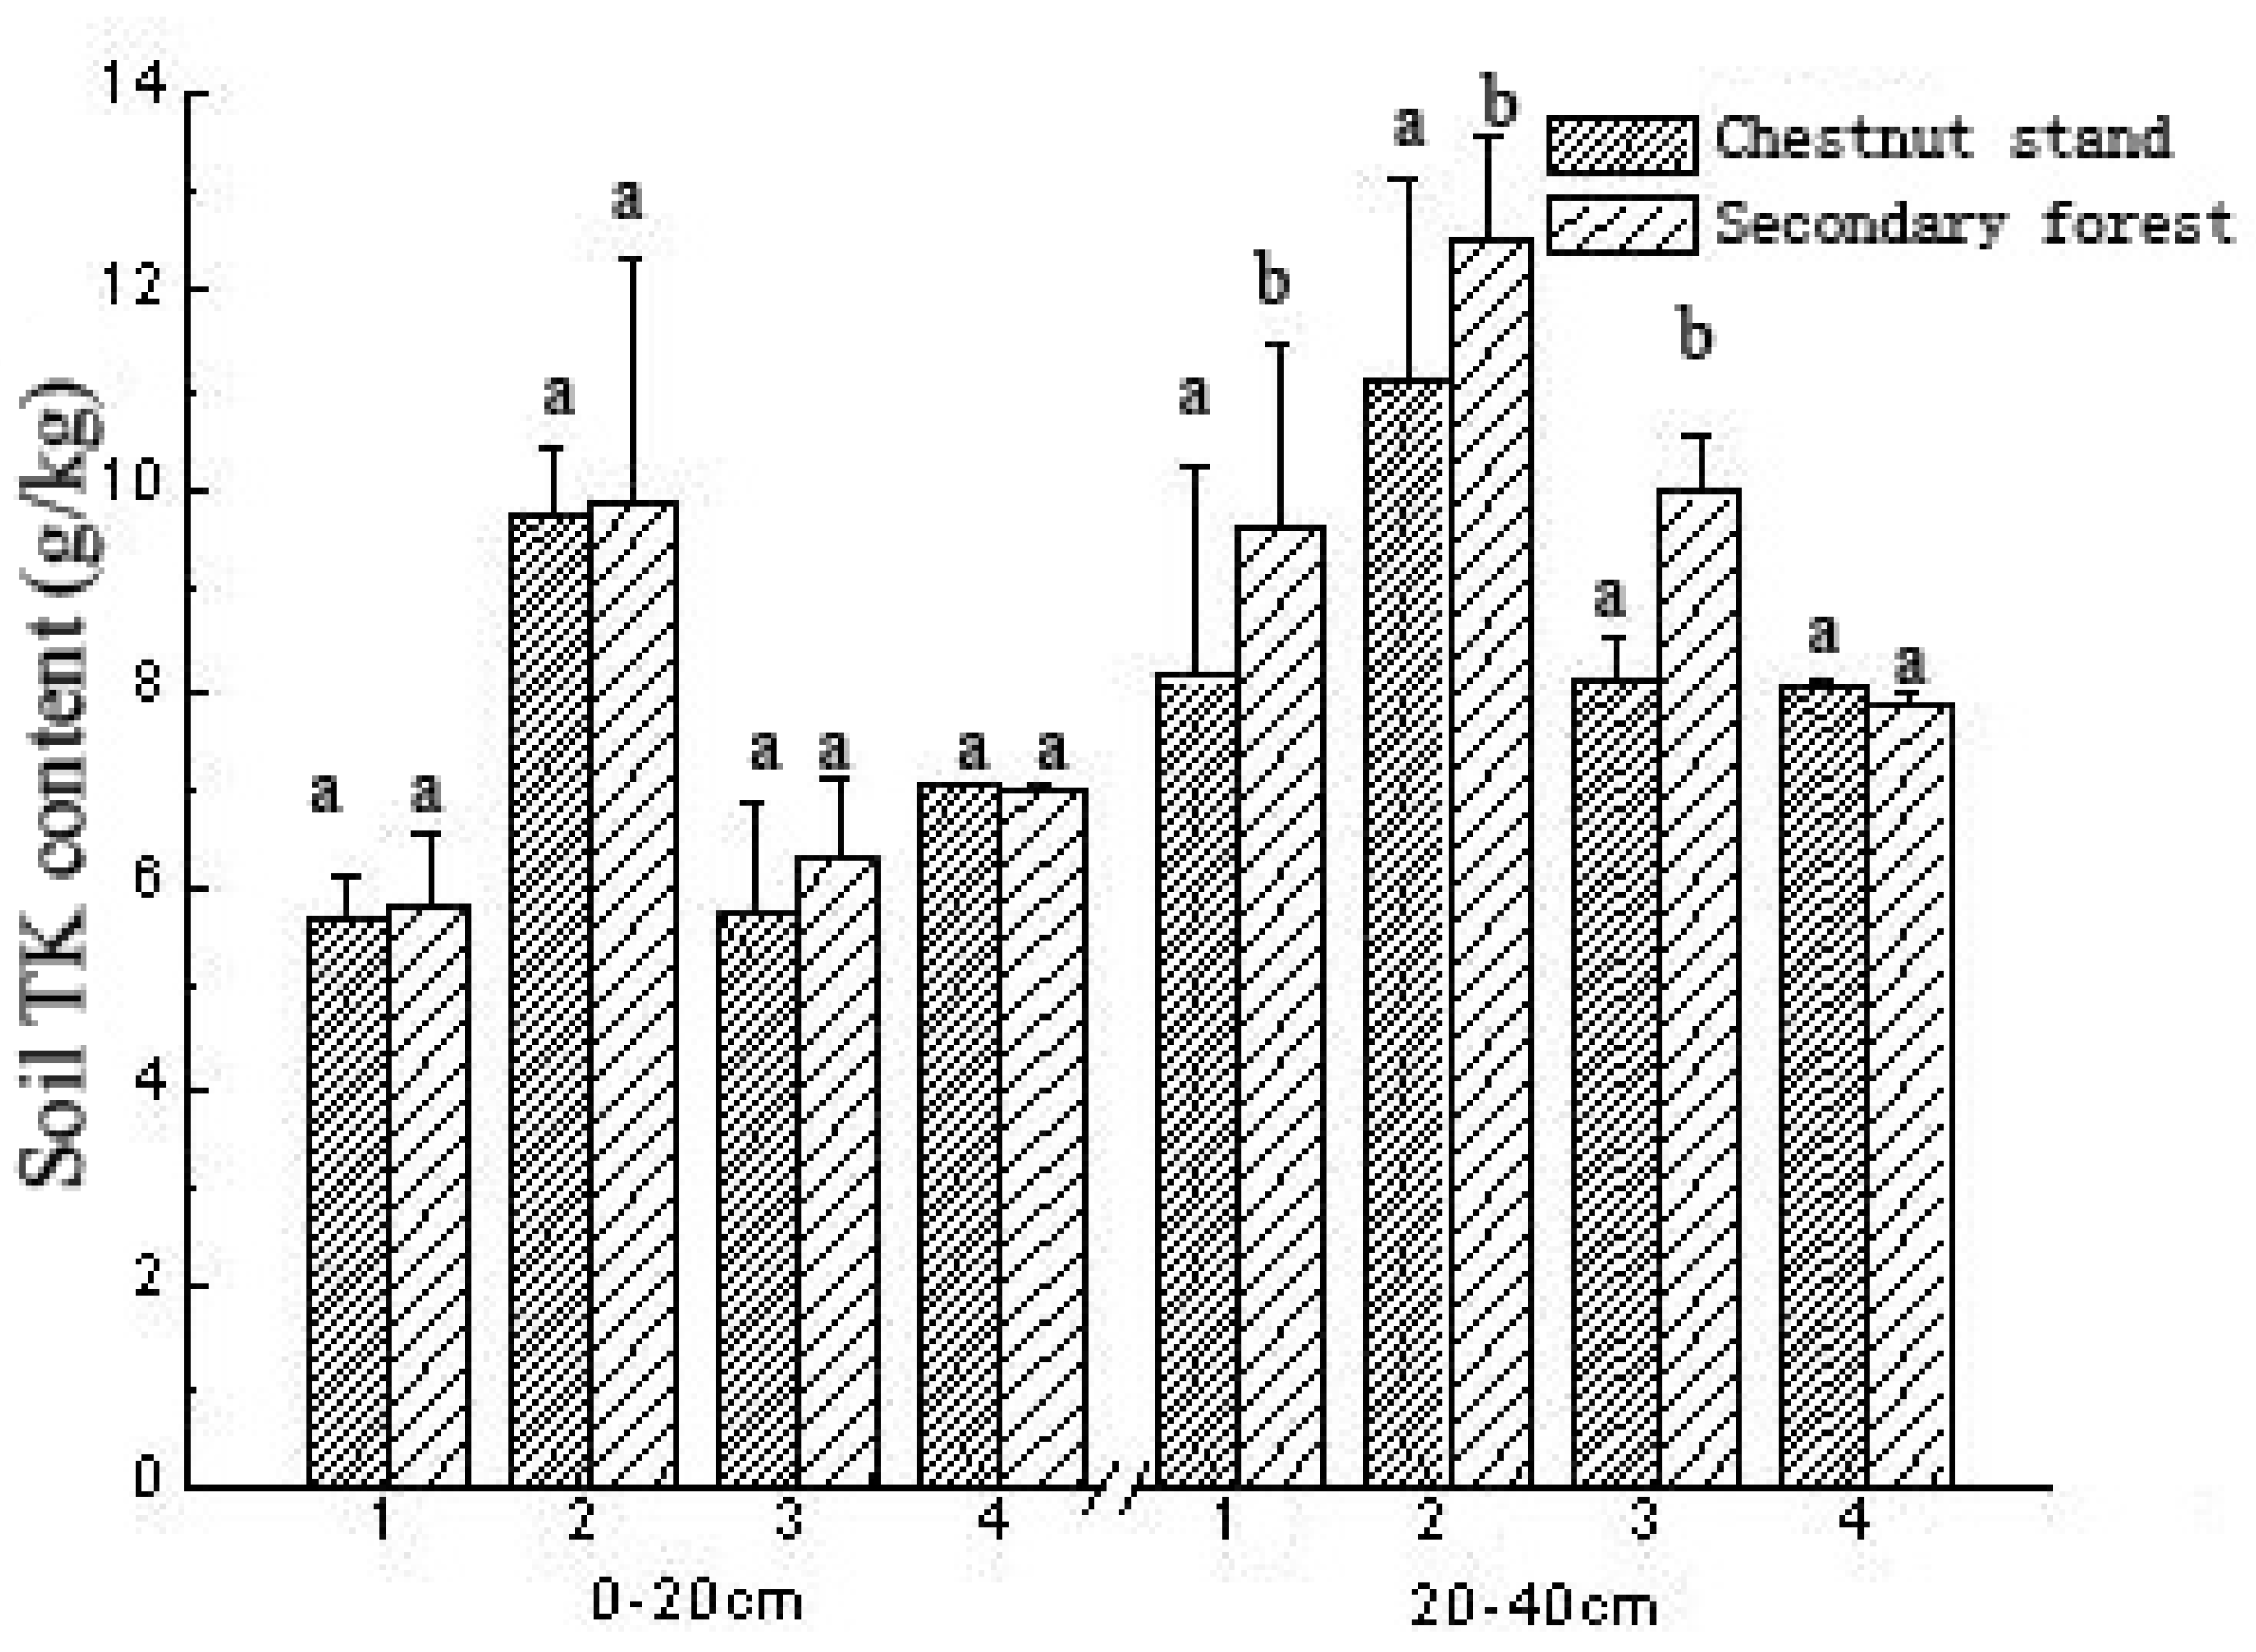
3.6. Comparison of Soil TK Content

Figure 7 shows the TK content results. In plots No. 1–3, the TK content of both soil depths of the chestnut forest was lower than that of the secondary forest, whereas the opposite was found for plot No. 4, in which the TK content in the soil of chestnut forest was higher than that in the secondary forest. The difference of TK content in the 0–20 cm soil depth between the chestnut forest and the secondary forest was not significant, plots No. 1–3 showed a significant difference in TK content at 20–40 cm soil depth. This indicates that the planting of the secondary forests with chestnut forest reduced the TK content at both soil depths in these plots. In contrast, the TK content of the two soil depths increased in plot No. 4. This change occurred at 0–20 cm soil depth, but the change was not significant, whereas it was significant at 20–40 cm soil depth. The TK content at 0–20 cm soil depth of chestnut forest was 2.41, 1.35, 2.36, and 1.00 g/kg lower than that of 20–40 cm soil depth in plots No. 1–4, respectively. The difference of TK content between the two soil depths of secondary forest was 2.41, 1.35, 2.36, and 1.00 g/kg in plots No. 1–4, respectively. These findings indicate that, in plots No. 1–3, the difference in soil TK content was different between the 20–40 cm soil depth in the chestnut forest and the secondary forest. This further indicates that, after the secondary forest was reclaimed and planted with chestnut forest, the change in TK content at 0–20 cm soil depth was lower than that at 20–40 cm.

3.7. Comparison of Soil AK Content

Figure 8 shows that in plots No. 1–3, the AK content at both soil depths in chestnut forest was lower than those in the secondary forest. In contrast, plot No. 4 is the opposite, the soil AK content in the chestnut forest land was higher than that in the secondary forest at both soil depths. The AK content in the 0–20 cm soil depth of the four plots was significantly different between the chestnut forest and the secondary forest, and the difference between the two forests was 12.25, 14.97, 9.53, and 17.73 mg/kg in plots No. 1–4, respectively. However, there was a significant difference in AK content at 20–40 cm soil depth in plot No. 4, whereas there was no significant difference in AK content at this depth in plots No. 1–3. This indicates that, since the secondary forests of plots No. 1–3 were planted with chestnut forest, the AK content reduced at both soil depths. The AK content increased at both soil depths in plot No. 4. The change was significant at 0–20 cm soil depth in all four plots and at 20–40 cm soil depth in plot No. 4, but not in the other three plots. The AK content at 0–20 cm soil depth in the same plot was significantly higher than that at 20–40 cm for both forest types. These findings indicate that in plots No. 1–3, the difference in soil AK content between the 0–20 cm and the 20–40 cm soil depths was different in the chestnut forest and the secondary forest. Furthermore, after the secondary forest was reclaimed and planted with chestnut forest, the change in AK content at 0–20 cm soil depth was higher than that at 20–40 cm.

4. Discussion

Owing to population growth and socio-economic development, the conversion of forest land happens all over the world, which not only resulted from forests reduction, but also led to soil deteriorations and other environmental problems. In Anji County, the transformation of secondary forest into economic stands much more occurred. What is its influence? Especially, what does it mean in water source areas? We performed field study eight years ago. Through our previous studies, it has been found that rainfall is the main factor causing the loss of nutrient elements, such as nitrogen and phosphorus in soil [28,30]. The difference in nutrient contents between plot No. 4 chestnut forest and the secondary forest was basically the opposite of the difference between plots No. 1–3 in the current study. In plot No. 4, the nutrient contents in the chestnut forest land were generally higher than those in secondary forest. This might be due to the high coverage rate of chestnut forest in plot No. 4; the chestnut forest canopy reduced the erosion of the surface by rain water; moreover, the slope of plot No. 4 was lower than that of the other plots, so the soil erosion was not as serious. These findings were consistent with previous results that were reported by us [28,30].
Therefore, the main purpose of this study is to study the effects of soil depth on the spatial distribution of nitrogen, phosphorus, and other nutrients, and the effects of different forests on the spatial distribution of nitrogen, phosphorus, and other nutrients. This study showed that, after the secondary forest Cunninghamia lanceolata (Lamb.) Hook. in plot No. 1 and Castanopsis sclerophylla (Lindl.) Schott. in plots No. 2 and No. 3 were harvested and the chestnut was planted, the decreased vegetation diversity and coverage rate reduced the species and quantity of plant litter returned to the surface, and this decreased coverage rate led to a bare soil surface, allowing for topsoil to be easily washed away by rain. In addition, the slopes of plots No. 1–3 were high and the vegetation cover of the chestnut forest was significantly lower than that of the secondary forest, thus the chestnut litter on the surface was easily migrated downslope under the influence of gravity and rain erosion. Moreover, activities, such as weeding and pruning during the management of chestnut forest, also reduced the return of some plant organic matter and other nutrients to the soil. In this way, the amount of organic matter and other nutrients in the chestnut forest was reduced, and thus the content of soil organic matter and other nutrients in the chestnut forest in the three plots was lower than that in the secondary forest. The process of litter return to the soil and decomposition was mainly carried out at the soil surface, thus the surface was the main area of accumulation of organic matter and other nutrients, and correspondingly the content of organic matter and other nutrients in the topsoil was much greater than that in the deeper soil. Li et al. [31] found that, in the Zhongtiao Mountains, the soil organic matter, TN, AP, and AK contents in the surface soil (0–10 cm) were significantly higher than at 10–30 and 30–60 cm soil depth. Wang et al. [32] also found in the Loess Plateau that the soil organic matter and TN was the highest at 0–10 cm soil depth and showed a clear surface aggregation effect. Zhou et al. [33] found that, in the desert oasis in the southern margin of the Taklimakan Desert, SOC, AN, and AP decreased with an increasing soil depth. These findings were similar to the results of our study.
The original secondary forest was transformed into an intensive chestnut forest, and the coverage of forest land decreased. In addition, weeding activities in the chestnut growing process led to some of the forest soil becoming directly exposed. When a certain intensity of rainfall occurs, the exposed land without the cushioning force and rainwater easily eroded the shunting of the canopy, and the surface runoff carried and migrated the fine particles of the soil, causing soil erosion. Runoff carried soil particles and also dissolved nutrients, which caused the loss of nitrogen, phosphorus, and potassium in the surface soil. However, our findings indicated that the TP and AP contents in the chestnut forest presented a different level, which may be due to the fertilization of chestnut forest. There are differences in the quantity of leaves and litter in different forest land, which will also lead to the difference of soil nutrient content in different forest land. The secondary forest of plot No. 4 was mainly bamboo forest, Brachystachyum densiflorum (Rendle) Keng, which was completely different from the secondary forest type of plots No. 1–3. As the biomass of secondary bamboo leaves was lower than that in chestnut forest, the amount of bamboo litter was less than that of chestnut forest, and the nutrient content of bamboo leaves decomposing into soil surface soil was lower, causing the content of organic matter and other nutrients that are accumulated by chestnut forest to be higher than that in the secondary bamboo forest of plot No. 4. Xiao et al. [34] studied litter decomposition rate for five forest types in the subtropical forest of China, and they found that there were differences in the litter decomposition rate among different forest lands. It also provides a basis to support the point of view, i.e., there is a difference in the litter decomposition rate between forest lands, which in turn affects the nutrient content of forest soil. Through the study, Meng et al. [35] found that, after forest conversion, it can influence soil bacteria communities. Wan et al. [36] studied on the effect of forest management methods on soil bacteria communities; they found that forest management method could affect soil bacteria community and soil nutrient. Different soil bacteria communities can cause differences in litter decomposition rates and thus affect soil nutrients. Jasso-Flores et al. [37] studied vegetation-soil systems drivers of ecosystem carbon contents in central Mexico, and they also found that there is a great difference in carbon storage among different forests.
Fan et al. [38] in the Jiangxi province studied different forest (broadleaved evergreen forest, slash pine plantation, bamboo forest, coniferous broadleaved mixed forest, Masson pine plantation, and Chinese fir plantation) and found that SOC, TP, AN, AP, and AK contents gradually decreased with the increase of soil depth. The descending order of soil fertility was bamboo forest > broadleaved evergreen forest > coniferous broadleaved mixed forest > Masson pine plantation > Chinese fir plantation > slash pine plantation. In addition, studies have shown that human activities, such as weeding, mulching, and farming also affect soil nutrients [39].
We found that, after the secondary forest was transformed into chestnut forest, the content of organic matter, TN, TK, and corresponding affective nutrients in the chestnut forest decreased, which not only reduced the fertility of the forest, but also increased the risk of soil erosion, and also threatened the water quality of the reservoir. Obviously, economic benefits drove this transformation of forest land. In view of the social and ecological interests, secondary forest growing in water source areas is ideal. Thus, it is necessary to help local villagers increase incomes in order to decrease or stop the transformation of secondary forest, also to secure drinking water safety.

5. Conclusions

At present, the conversion of forest land is hard to avoid due to driving economic interests. However, it is vital to retain fine vegetation coverage in water source areas, in order to maintain water environmental security, in which forests have high environmental quality requirements, and ecological restoration is the main management measure for controlling non-point source pollution, especially forestry ecological restoration. We found that differences of soil nutrient content from the chestnut and secondary forest stands were the greatest at 0–20 cm soil depth. The contents of organic matter, TN, hydrolyzed nitrogen, and AK at 0–20 cm soil depth of chestnut stands were lower by 10.81 g/kg, 0.45 g/kg, 40.26 mg/kg, and 12.25 mg/kg than those in secondary forests in plots No. 1–4, respectively. There was no significant difference in TP and TK contents among the forest types, and the AP content at 0–20 cm soil depth of chestnut stands was 2.73 mg/kg higher than in the secondary forests. Overall, the nutrient contents were lower in chestnut stands than secondary forests. Therefore, the secondary forest positioned at the end of the reservoir can effectively reduce the loss of soil nutrients and enhance protection and recovery. Normally, this transformation should be forbidden in water source areas. For economic forests, such as chestnut, measures should be taken to protect understory vegetation, increase forest coverage, and increase soil and water conservation capacity. When local farmers can obtain incomes from other jobs rather than cash trees growing, such as chestnuts, the conversion of economic forest into secondary forest is significant. At the same time, it is necessary to establish a certain width of vegetation buffer along the bank to intercept and purify surface runoff. Such measures to manage surface source contaminants from source to sink can greatly reduce the risk of deterioration of reservoir water quality.

Author Contributions

Conceptualization, J.Z.; methodology, S.S.; software, Z.L.; validation, S.S., Z.L. and Z.C.; formal analysis, S.S.; investigation, Z.L.; resources, J.Z.; data curation, P.C.; writing—original draft preparation, S.S.; writing—review and editing, R.W.; visualization, Z.L.; supervision, Z.C.; project administration, J.Z.; funding acquisition, J.Z.

Funding

This research was funded by Fundamental Research Funds of CAF, No. CAFYBB2016SY009.

Conflicts of Interest

The authors declare no conflict of interest.

References

  1. Creed, I.F.; van Noordwijk, M. (Eds.) Forest and Water on a Changing Planet: Vulnerability, Adaptation and Governance Opportunities. A Global Assessment Report; IUFRO World Series Volume 38; IUFRO: Vienna, Austria, 2018. [Google Scholar]
  2. Rosen, M.R.; Lapham, W.W. Introduction to the US Geological Survey National Water-Quality Assessment (NAWQA) of ground-water quality trends and comparison to other national programs. J. Environ. Qual. 2008, 37, 190–198. [Google Scholar]
  3. Neary, D.G.; Ice, G.G.; Jackson, C.R. Linkages between forest soils and water quality and quantity. For. Ecol. Manag. 2009, 258, 2269–2281. [Google Scholar] [CrossRef]
  4. Eriksson, L.O.; Löfgren, S.; Öhman, K. Implications for forest management of the EU Water Framework Directive’s stream water quality requirements-A modeling approach. For. Policy Econ. 2011, 13, 284–291. [Google Scholar] [CrossRef]
  5. Wang, R.J.; Gao, P.; Li, C.; Dong, X.D.; Jiang, Y.K.; Wang, J.X. Characteristics of Subsurface Runoff and Phosphorus Loss in QuercusAcutissimaand Robinia Pseudoacacia Forest in the Grain to Green Program. J. Soil Water Conserv. 2019, 33, 9–13. [Google Scholar]
  6. Wang, Q.B.; Cao, Y.N.; Zhang, J.F.; Chen, G.C.; Li, Z.B.; Wu, H.; Wang, L. Characteristics of nitrogen transportation in Castanea mollissima forest around the Fushi Reservoir watershed in north Zhejiang Province, China. Chin. J. Appl. Ecol. 2017, 28, 545–553. [Google Scholar]
  7. Sabine, Z.; Sabine, G.; Claus-Felix, T.; Karin, H.; Wilhelm, C. Effects of Reduced Tillage on Crop Yield, Plant Available Nutrients and Soil Organic Matter in a 12-Year Long-Term Trial under Organic Management. Sustainability 2013, 5, 3876–3894. [Google Scholar] [Green Version]
  8. Li, J.X.; Cao, F.F.; Wu, D.; Fu, X.; Tian, Y.; Wu, G. Determining Soil Nutrients Reference Condition in Alpine Region Grassland, China: A Case Study of Hulun Buir Grassland. Sustainability 2018, 10, 4666. [Google Scholar] [CrossRef]
  9. Shin, C.S.; Sharif, O.; Lee, H.Y. Evaluating the Effect of Bacterial Inoculation and Fertilization on the Soil Nutrient Status of Coal Mine Soil by Growing Soybean (Glycine max) and Shrub Lespedeza (Lespedeza bicolor). Sustainability 2018, 10, 4793. [Google Scholar] [CrossRef]
  10. Zhang, Y.H.; Zhang, J.Q.; Wang, C. Impact on Soil Nutrient of Populus tomentosa and Robinia pseudoacaia Plantations in Loess Plateau. J. Northwest For. Univ. 2011, 26, 12–17. [Google Scholar]
  11. Liu, Y.J.; Li, Y.; Ma, K.; He, W.S. Effects of potato, silkworm bean and buckwheat on soil were studied. Jiangsu Agric. Sci. 2018, 46, 79–83. [Google Scholar]
  12. Hua, D.W.; Li, J. Evaluation of Soil Nutrients in Tea Region of Shangnan County. Mod. Agric. Sci. Technol. 2018, 20, 184–185,194. [Google Scholar]
  13. Liu, J.M.; Yao, Y.; Liu, Z.L.; Lu, Y.D. Study on Nutrient Characteristics of Soil in Natural Corylus Forest Stands of Different Stocking Densities. For. Eng. 2018, 34, 1–5. [Google Scholar]
  14. Oladele, S.O.; Adeyemo, A.J.; Awodun, M.A. Influence of rice husk biochar and inorganic fertilizer on soil nutrients availability and rain-fed rice yield in two contrasting soils. Geoderma 2019, 339, 1–11. [Google Scholar] [CrossRef]
  15. Fu, B.J. Blue Skies for China. Science 2008, 321, 611. [Google Scholar] [CrossRef] [PubMed]
  16. Cai, Z.C.; Yan, X.Y.; Zhu, Z.L. A great challenge to solve nitrogen pollution from intensive agriculture. J. Plant Nutr. Fertil. 2014, 20, 1–6. [Google Scholar]
  17. Jeppesen, E.; Ndergaard, M.; Jensen, J.P.; Havens, K.E.; Anneville, O.; Carvalho, L. Lake responses to reduced nutrient loading-an analysis of contemporary long-term data from 35 case studies. Freshw. Biol. 2005, 50, 1747–1771. [Google Scholar] [CrossRef]
  18. Bunting, L.; Leavitt, P.R.; Gibson, C.E.; Mcgee, E.J.; Hall, V.A. Degradation of water quality in lough neagh, Northern Ireland, by diffuse nitrogen flux from a phosphorus-rich catchment. Limnol. Oceanogr. 2007, 52, 354–369. [Google Scholar] [CrossRef]
  19. Guo, L. Doing battle with the green monster of Taihu Lake. Science 2007, 317, 1166. [Google Scholar] [CrossRef]
  20. Stone, R. China aims to turn tide against toxic lake pollution. Science 2011, 333, 1210–1211. [Google Scholar] [CrossRef] [PubMed]
  21. Yamamoto, Y. Indirect impact of bluegillr, lepomis macrochirusr, on the development of cyanobacterial blooms in lake biwa, Japan. J. Freshw. Ecol. 2011, 26, 323–335. [Google Scholar] [CrossRef]
  22. Liu, Y.; Wang, Y.; Sheng, H.; Dong, F.; Zou, R.; Zhao, L.; Guo, H.C.; Zhu, X.; He, B. Quantitative evaluation of lake eutrophication responses under alternative water diversion scenarios: A water quality modeling based statistical analysis approach. Sci. Total Environ. 2014, 468–469, 219–227. [Google Scholar] [CrossRef] [PubMed]
  23. Higgins, S.N.; Paterson, M.J.; Hecky, R.E.; Schindler, D.W.; Venkiteswaran, J.J.; Findlay, D.L. Biological nitrogen fixation prevents the response of a eutrophic lake to reduced loading of nitrogen: Evidence from a 46-year whole-lake experiment. Ecosystems 2018, 21, 1088–1100. [Google Scholar] [CrossRef]
  24. Matisoff, G.; Watson, S.B.; Guo, J.; Duewiger, A.; Steely, R. Sediment and nutrient distribution and resuspension in lake winnipeg. Sci. Total Environ. 2017, 575, 173–186. [Google Scholar] [CrossRef]
  25. Paytan, A.; Roberts, K.; Watson, S.; Peek, S.; Chuang, P.C.; Defforey, D.; Carol, K. Internal loading of phosphate in lake erie central basin. Sci. Total Environ. 2017, 579, 1356–1365. [Google Scholar] [CrossRef] [PubMed]
  26. Wu, Z.; Liu, Y.; Liang, Z.; Wu, S.; Guo, H. Internal cycling, not external loading, decides the nutrient limitation in eutrophic lake: A dynamic model with temporal bayesian hierarchical inference. Water Res. 2017, 116, 231–240. [Google Scholar] [CrossRef]
  27. Wang, S.S.; Gao, Y.N.; Li, Q. Long-term and inter-monthly dynamics of aquatic vegetation and its relation with environmental factors in Taihu Lake, China. Sci. Total Environ. 2019, 651, 367–380. [Google Scholar] [CrossRef] [PubMed]
  28. Wang, Q.B.; Zhang, J.F.; Liu, G.Y.; Chen, G.C.; Pan, C.X.; Wu, H. Study on the Control of TN and TP for Agricultural Non-point Source Pollution by Ponds-Wetlands Combined System—An Example of Shenji River Watershed in Anji County. Chin. Agric. Sci. Bull. 2014, 30, 197–204. [Google Scholar]
  29. Lu, R.K. Soil Agro-Chemical Analysis Methods; China Agro-Science Press: Beijing, China, 1999. [Google Scholar]
  30. Li, Z.B.; Zhang, J.F.; Chen, G.C.; Wang, Q.B.; Pan, C.X.; Wu, H.; Wang, L. Research on Characteristics of Soil Erosion Pollutants in Chestnut (Castanea mollissima) Stands Around Fushi Reservoir in Anji County. J. Soil Water Conserv. 2013, 27, 90–94. [Google Scholar]
  31. Li, H.P.; Geng, Y.Q.; Wu, Y.J.; Zhang, X.J.; Duan, F.J.; Li, Y.C.; Ning, P. Study on Forest Soil Nutrient in the Middle Part of Zhongtiao Mountain. For. Sci. Technol. 2018, 9, 8–12. [Google Scholar]
  32. Wang, C.Y.; Yan, X.; Gu, M.H. The interaction effects of vegetation and soil nutrients on vegetation succession in abandoned farmland on the Loess Plateau. Acta Prataculturae Sin. 2018, 27, 26–35. [Google Scholar]
  33. Zhou, X.B.; Tao, Y.; Wu, L.; Li, Y.G.; Zhang, Y.M. Soil stoichiometry in different land-use categories in desert-oasis ecotones of the southern Taklimakan Desert. Acta Ecol. Sin. 2019, 39, 1–3. [Google Scholar]
  34. Xiao, W.Y.; Chen, H.Y.H.; Kumar, P.; Chen, C.; Guan, Q.W. Multiple interactions between tree composition and diversity and microbial diversity underly litter decomposition. Geoderma 2019, 341, 161–171. [Google Scholar] [CrossRef]
  35. Meng, M.J.; Lin, J.; Guo, X.P.; Liu, X.; Wu, J.S.; Zhao, Y.P.; Zhang, J.C. Impacts of forest conversion on soil bacterial community composition and diversity in subtropical forests. Catena 2019, 175, 167–173. [Google Scholar] [CrossRef]
  36. Wan, P.; Zhang, G.Q.; Zhao, Z.H.; Hu, Y.B.; Liu, W.Z.; Hui, G.Y. Short-term effects of different forest management methods on soil microbial communities of a natural Quercus aliena var. acuteserrata forest in Xiaolongshan, China. Forests 2019, 10, 161. [Google Scholar] [CrossRef]
  37. Jasso-Flores, I.; Galicia, L.; Garcia-Oliva, F.; Martinez-Yrizar, A. Are vegetation-soil systems drivers of ecosystem carbon contents along an elevational gradient in a highland temperate forest? Can. J. For. Res. 2019, 49, 296–304. [Google Scholar] [CrossRef]
  38. Fan, X.H.; Ge, H.Y.; Zhang, C.C.; Deng, W.P.; Chen, F.S.; Bu, W.S. Variations in soil fertility of typical non-commercial forest types in Jiangxi Province of eastern China. J. Beijing For. Univ. 2018, 11, 84–92. [Google Scholar]
  39. Yao, J.Y.; Qi, J.Q.; Zhang, L.H.; Wang, M.Z.; Li, T.T.; Zhang, X.Y.; Hao, J.F. Effects of anthropogenic disturbance on species diversity and soil physicochemical properties of Symplocos sumuntia secondary forest in Bifengxia. Chin. J. Ecol. 2018, 37, 2942–2950. [Google Scholar]
Figure 1. Geographical location of the study area.
Sustainability 11 02373 g001
Figure 2. Comparison of organic matter content between chestnut stands and secondary forests. Note: Bars with the same lowercase letter are not significantly different (p > 0.05), on the contrary, having significance (p < 0.05).
Sustainability 11 02373 g002
Figure 3. Comparison of TN content between chestnut stands and secondary forests at 0–20 and 20–40 cm soil depth. Note: Bars with the same lowercase letter are not significantly different (p > 0.05), on the contrary, having significance (p < 0.05).
Sustainability 11 02373 g003
Figure 4. Comparison of hydrolysis nitrogen content between chestnut stands and secondary forests at 0–20 and 20–40 cm soil depth. Note: Bars with the same lowercase letter are not significantly different (p > 0.05), on the contrary, having significance (p < 0.05).
Sustainability 11 02373 g004
Figure 5. Comparison of total phosphorus (TP) content between chestnut stands and secondary forests at 0–20 and 20–40 cm soil depth. Note: Bars with the same lowercase letter are not significantly different (p > 0.05), on the contrary, having significance (p < 0.05).
Sustainability 11 02373 g005
Figure 6. Comparison of available phosphorus content between chestnut stands and secondary forests at 0–20 and 20–40 cm soil depth. Note: Bars with the same lowercase letter are not significantly different (p > 0.05), on the contrary, having significance (p < 0.05).
Sustainability 11 02373 g006
Figure 7. Comparison of total potassium (TK) content between chestnut stands and secondary forest at 0–20 and 20–40 cm soil depth. Note: Bars with the same lowercase letter are not significantly different (p > 0.05), on the contrary, having significance (p < 0.05).
Sustainability 11 02373 g007
Figure 8. Comparison of available potassium (AK) content between chestnut stands and secondary forest at 0–20 and 20–40 cm soil depth. Note: Bars with the same lowercase letter are not significantly different (p > 0.05), on the contrary, having significance (p < 0.05).
Sustainability 11 02373 g008
Table 1. Basic conditions for sample plots within the chestnut stands and secondary forests.
Sample Plot NumberSlope (°)Vegetation Cover in Chinese Chestnut (%)Vegetation Cover in Secondary Forest Land (%)Plants in Chinese Chestnut ForestPlants in Secondary Forests
11380100Castanea mollissima BL., Hedyotis chrysotricha (Palib.) Merr., Smilax glabra Roxb., Setaria viridis (L.) BeauvCunninghamia lanceolata (Lamb.) Hook (dominant tree species), Diospyros kaki Thunb, Cinnamomum camphora (L.) Presl., Castanopsis sclerophylla (Lindl.) Schott., Litsea cubeba (Lour.) Pers.; Ilex chinensis Sims
21780100Castanopsis sclerophylla (Lindl.) Schott. (dominant tree species), Cinnamomum camphora (L.) Presl.; Ilex chinensis Sims
3109098Castanopsis sclerophylla (Lindl.) Schott. (dominant tree species), Cunninghamia lanceolata (Lamb.) Hook
468590Brachystachyum densiflorum (Rendle) Keng (dominant tree species), Lycium chinense Mill.

