Assessing Potential Climate Change Impacts and Adaptive Measures on Rice Yields: The Case of Zhejiang Province in China

 ,
,  ,
, 
Abstract
:1. Introduction
2. Materials and Methods
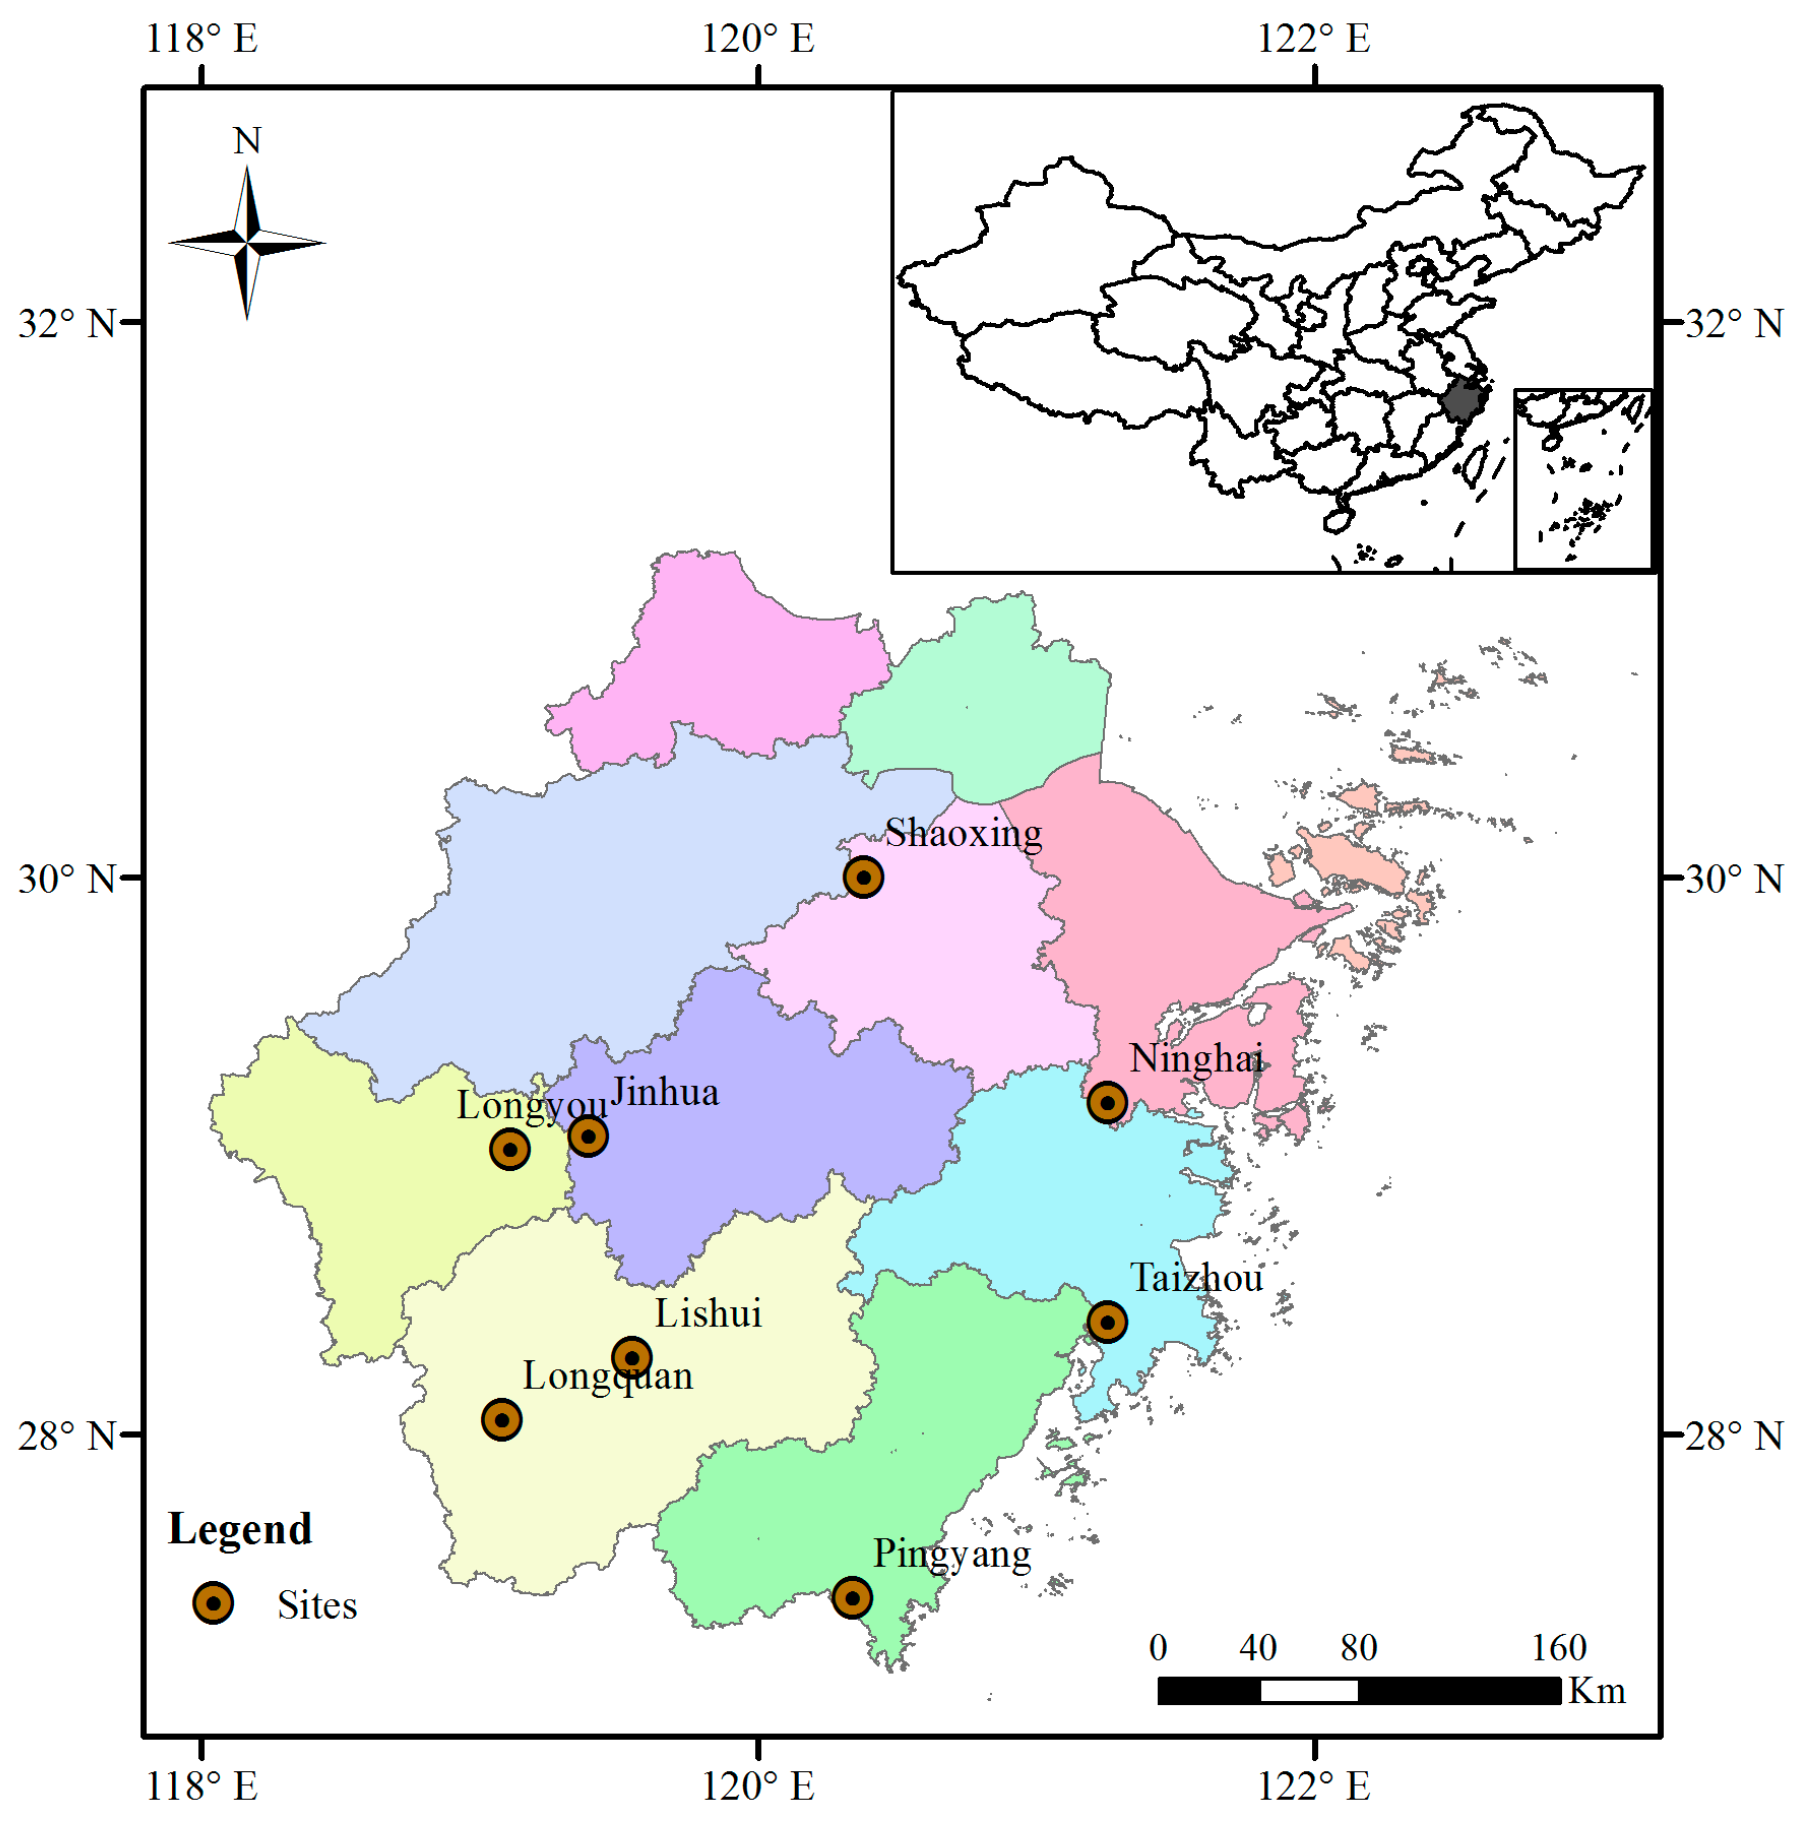
2.1. Study Area and Observation Sites
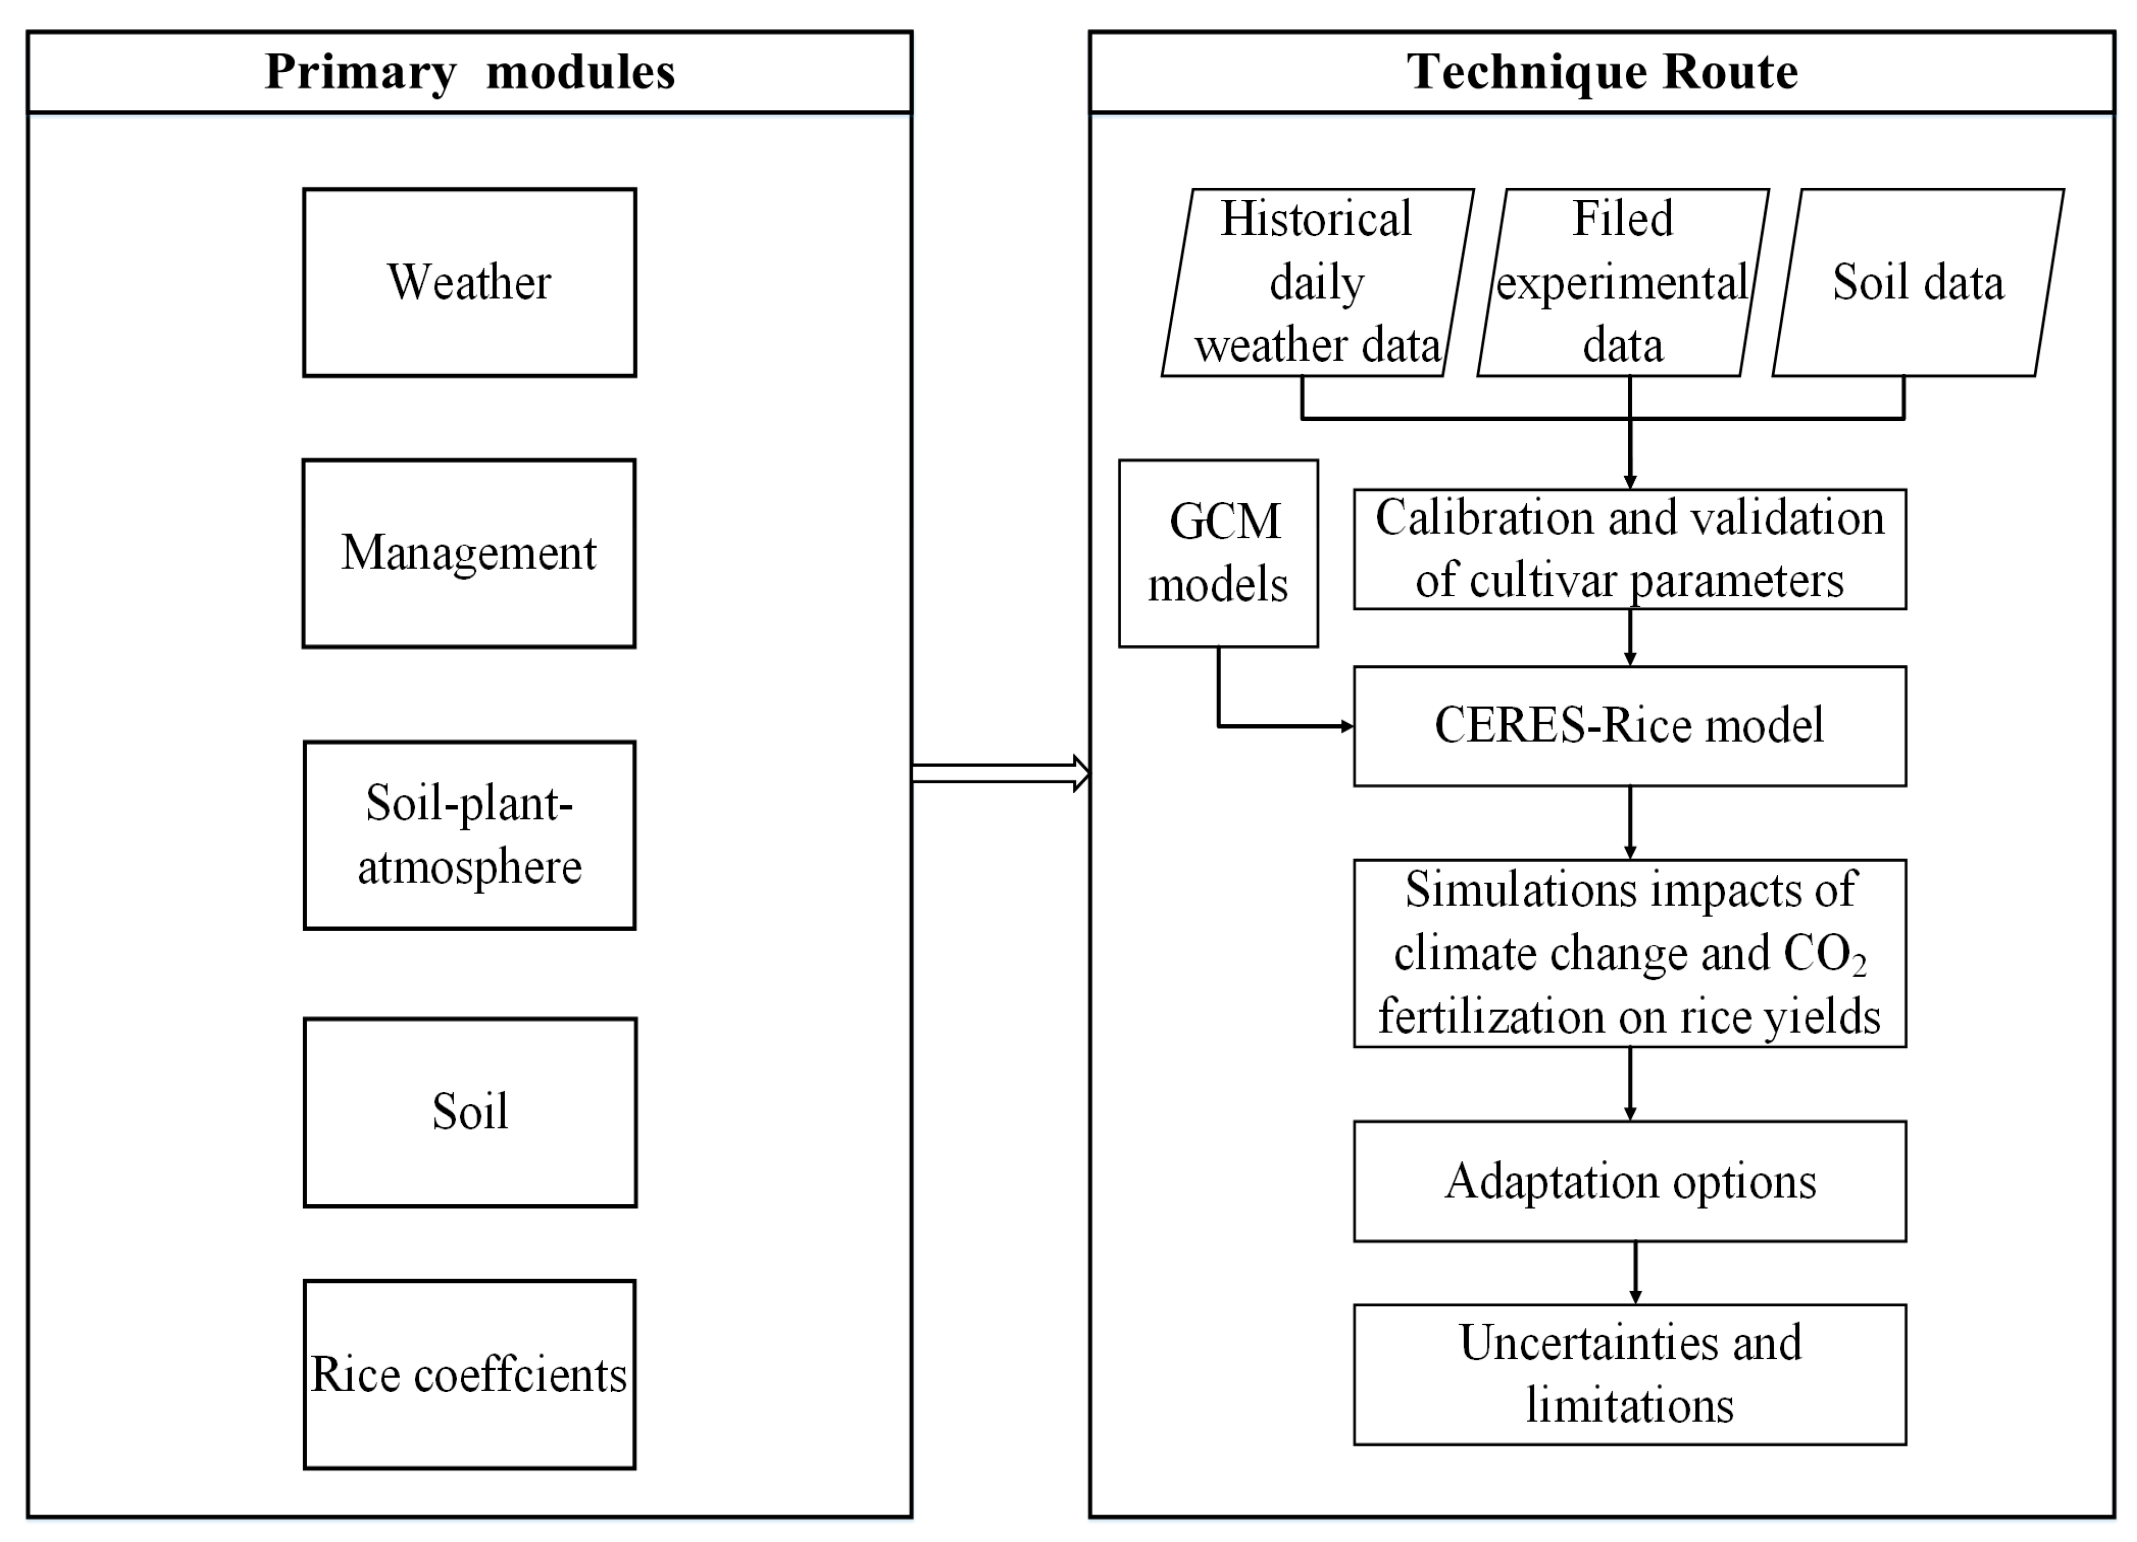
2.2. The CERES-Rice Model
2.3. Dataset for the DSSAT
2.3.1. Soil Data
2.3.2. Historical Weather Data
2.3.3. Cultivar Genetic Coefficients
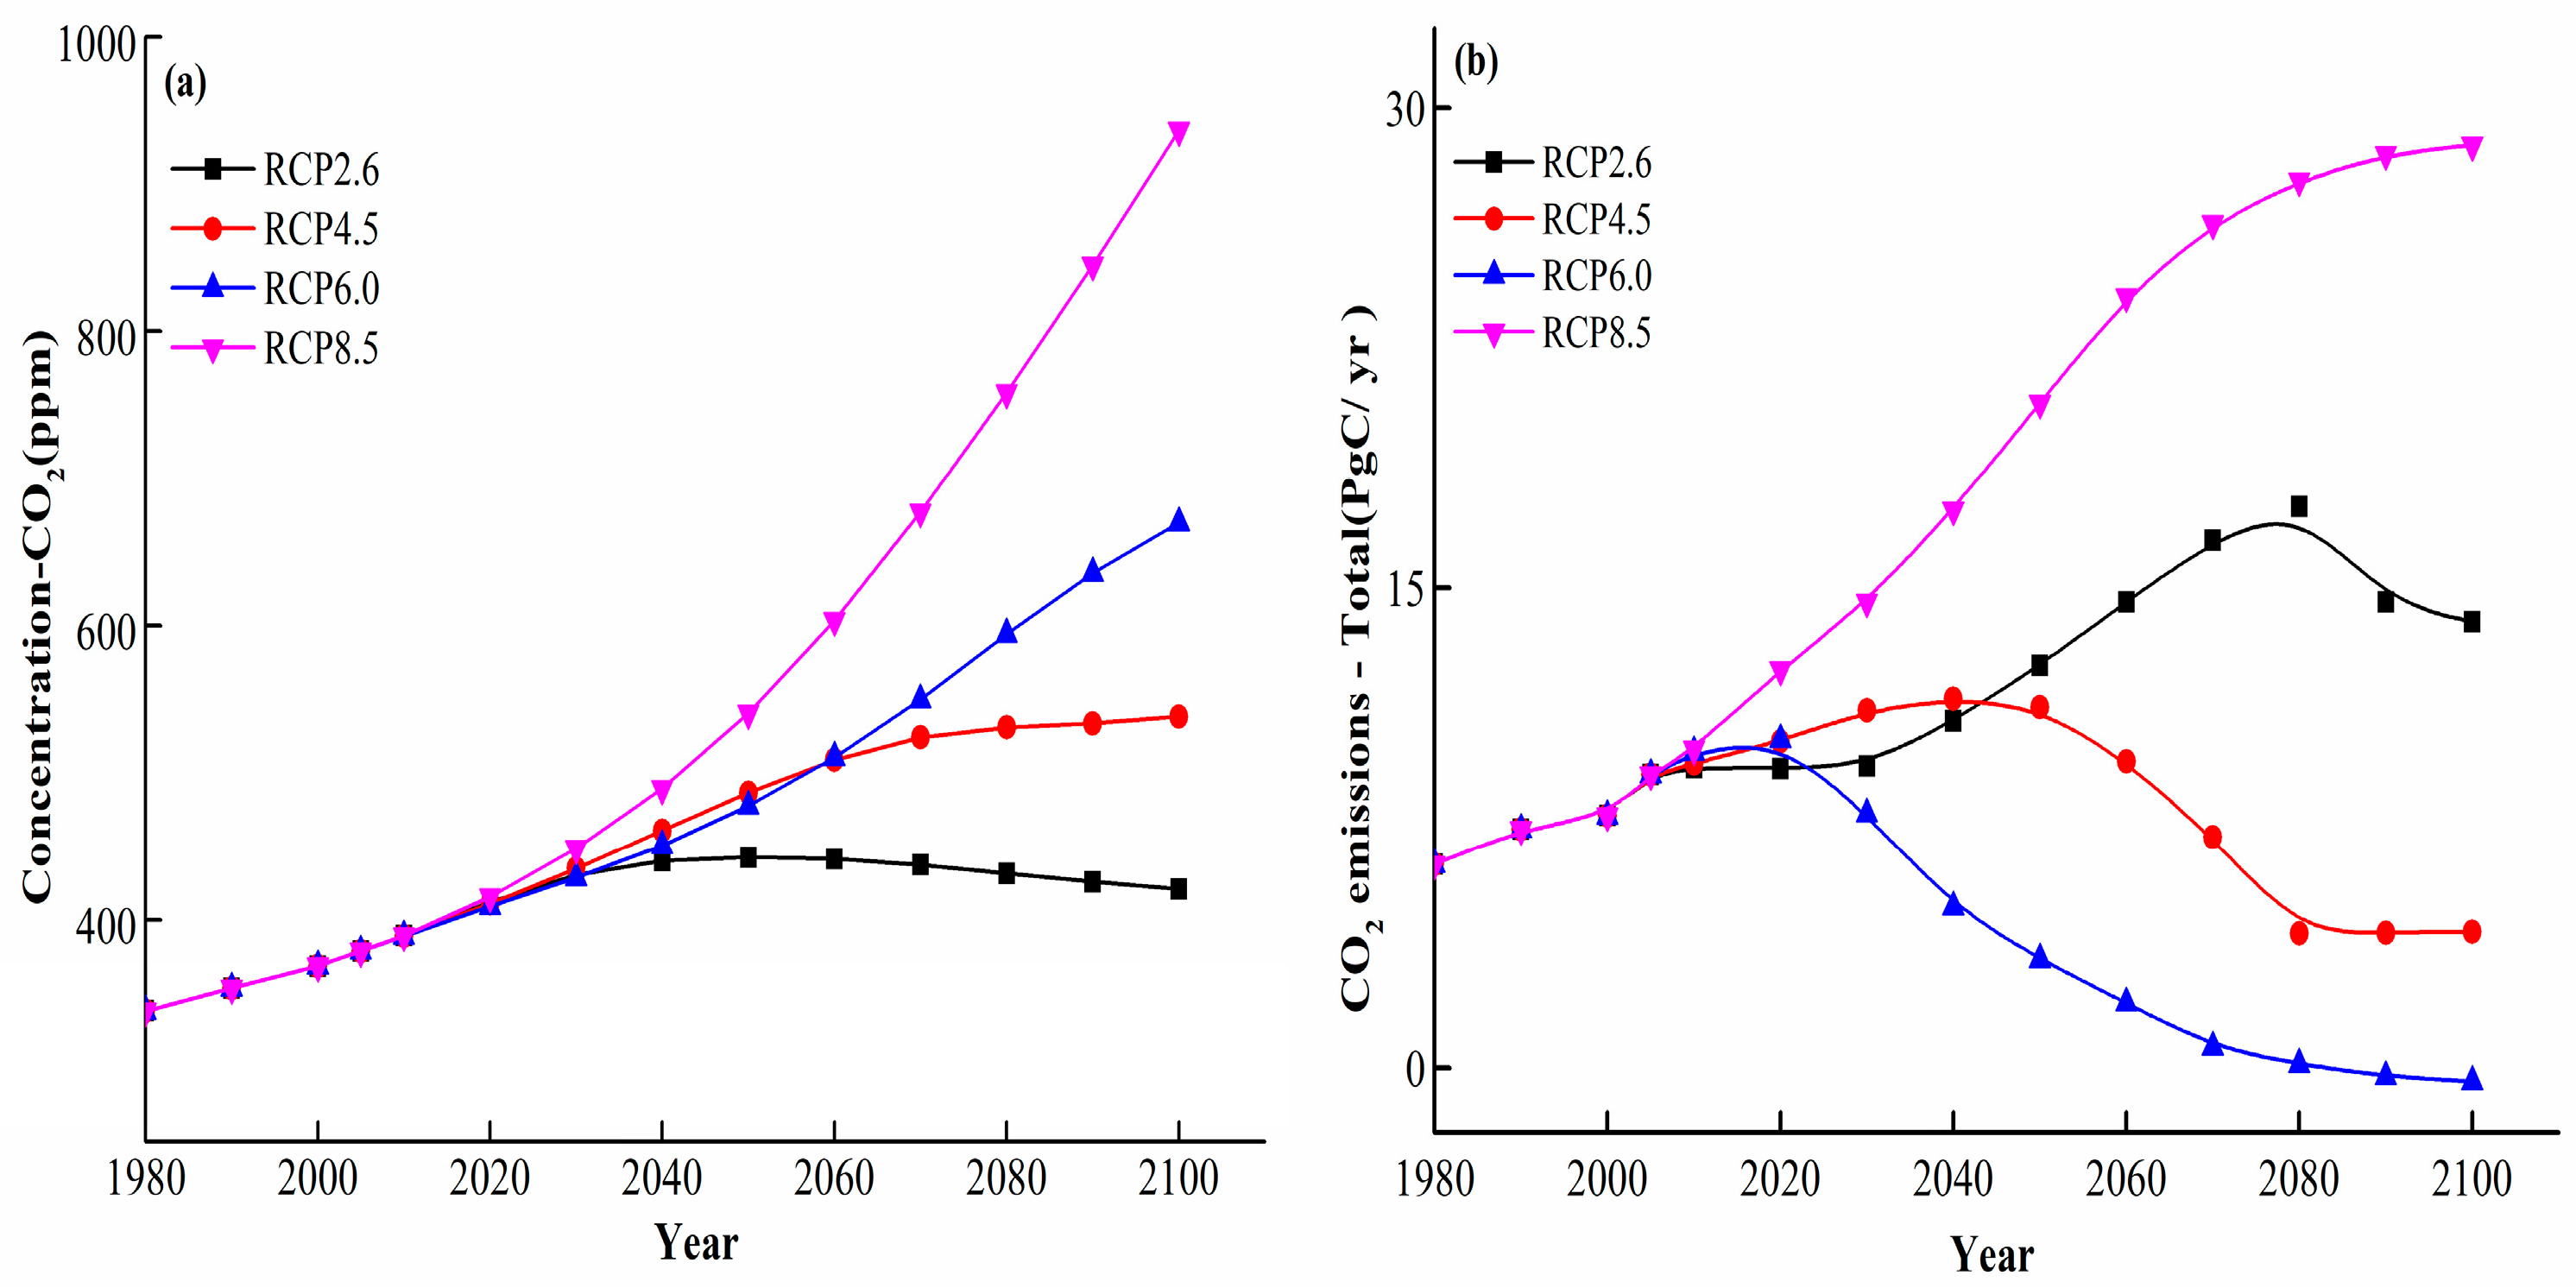
2.3.4. Climate Change Scenarios
2.4. Calibration, Validation, and Evaluation of the CERES-Rice Model
2.5. Model Application
2.5.1. Evaluation of the Impacts of Climate Change on Rice Yield
2.5.2. Adaptive Measures
3. Results
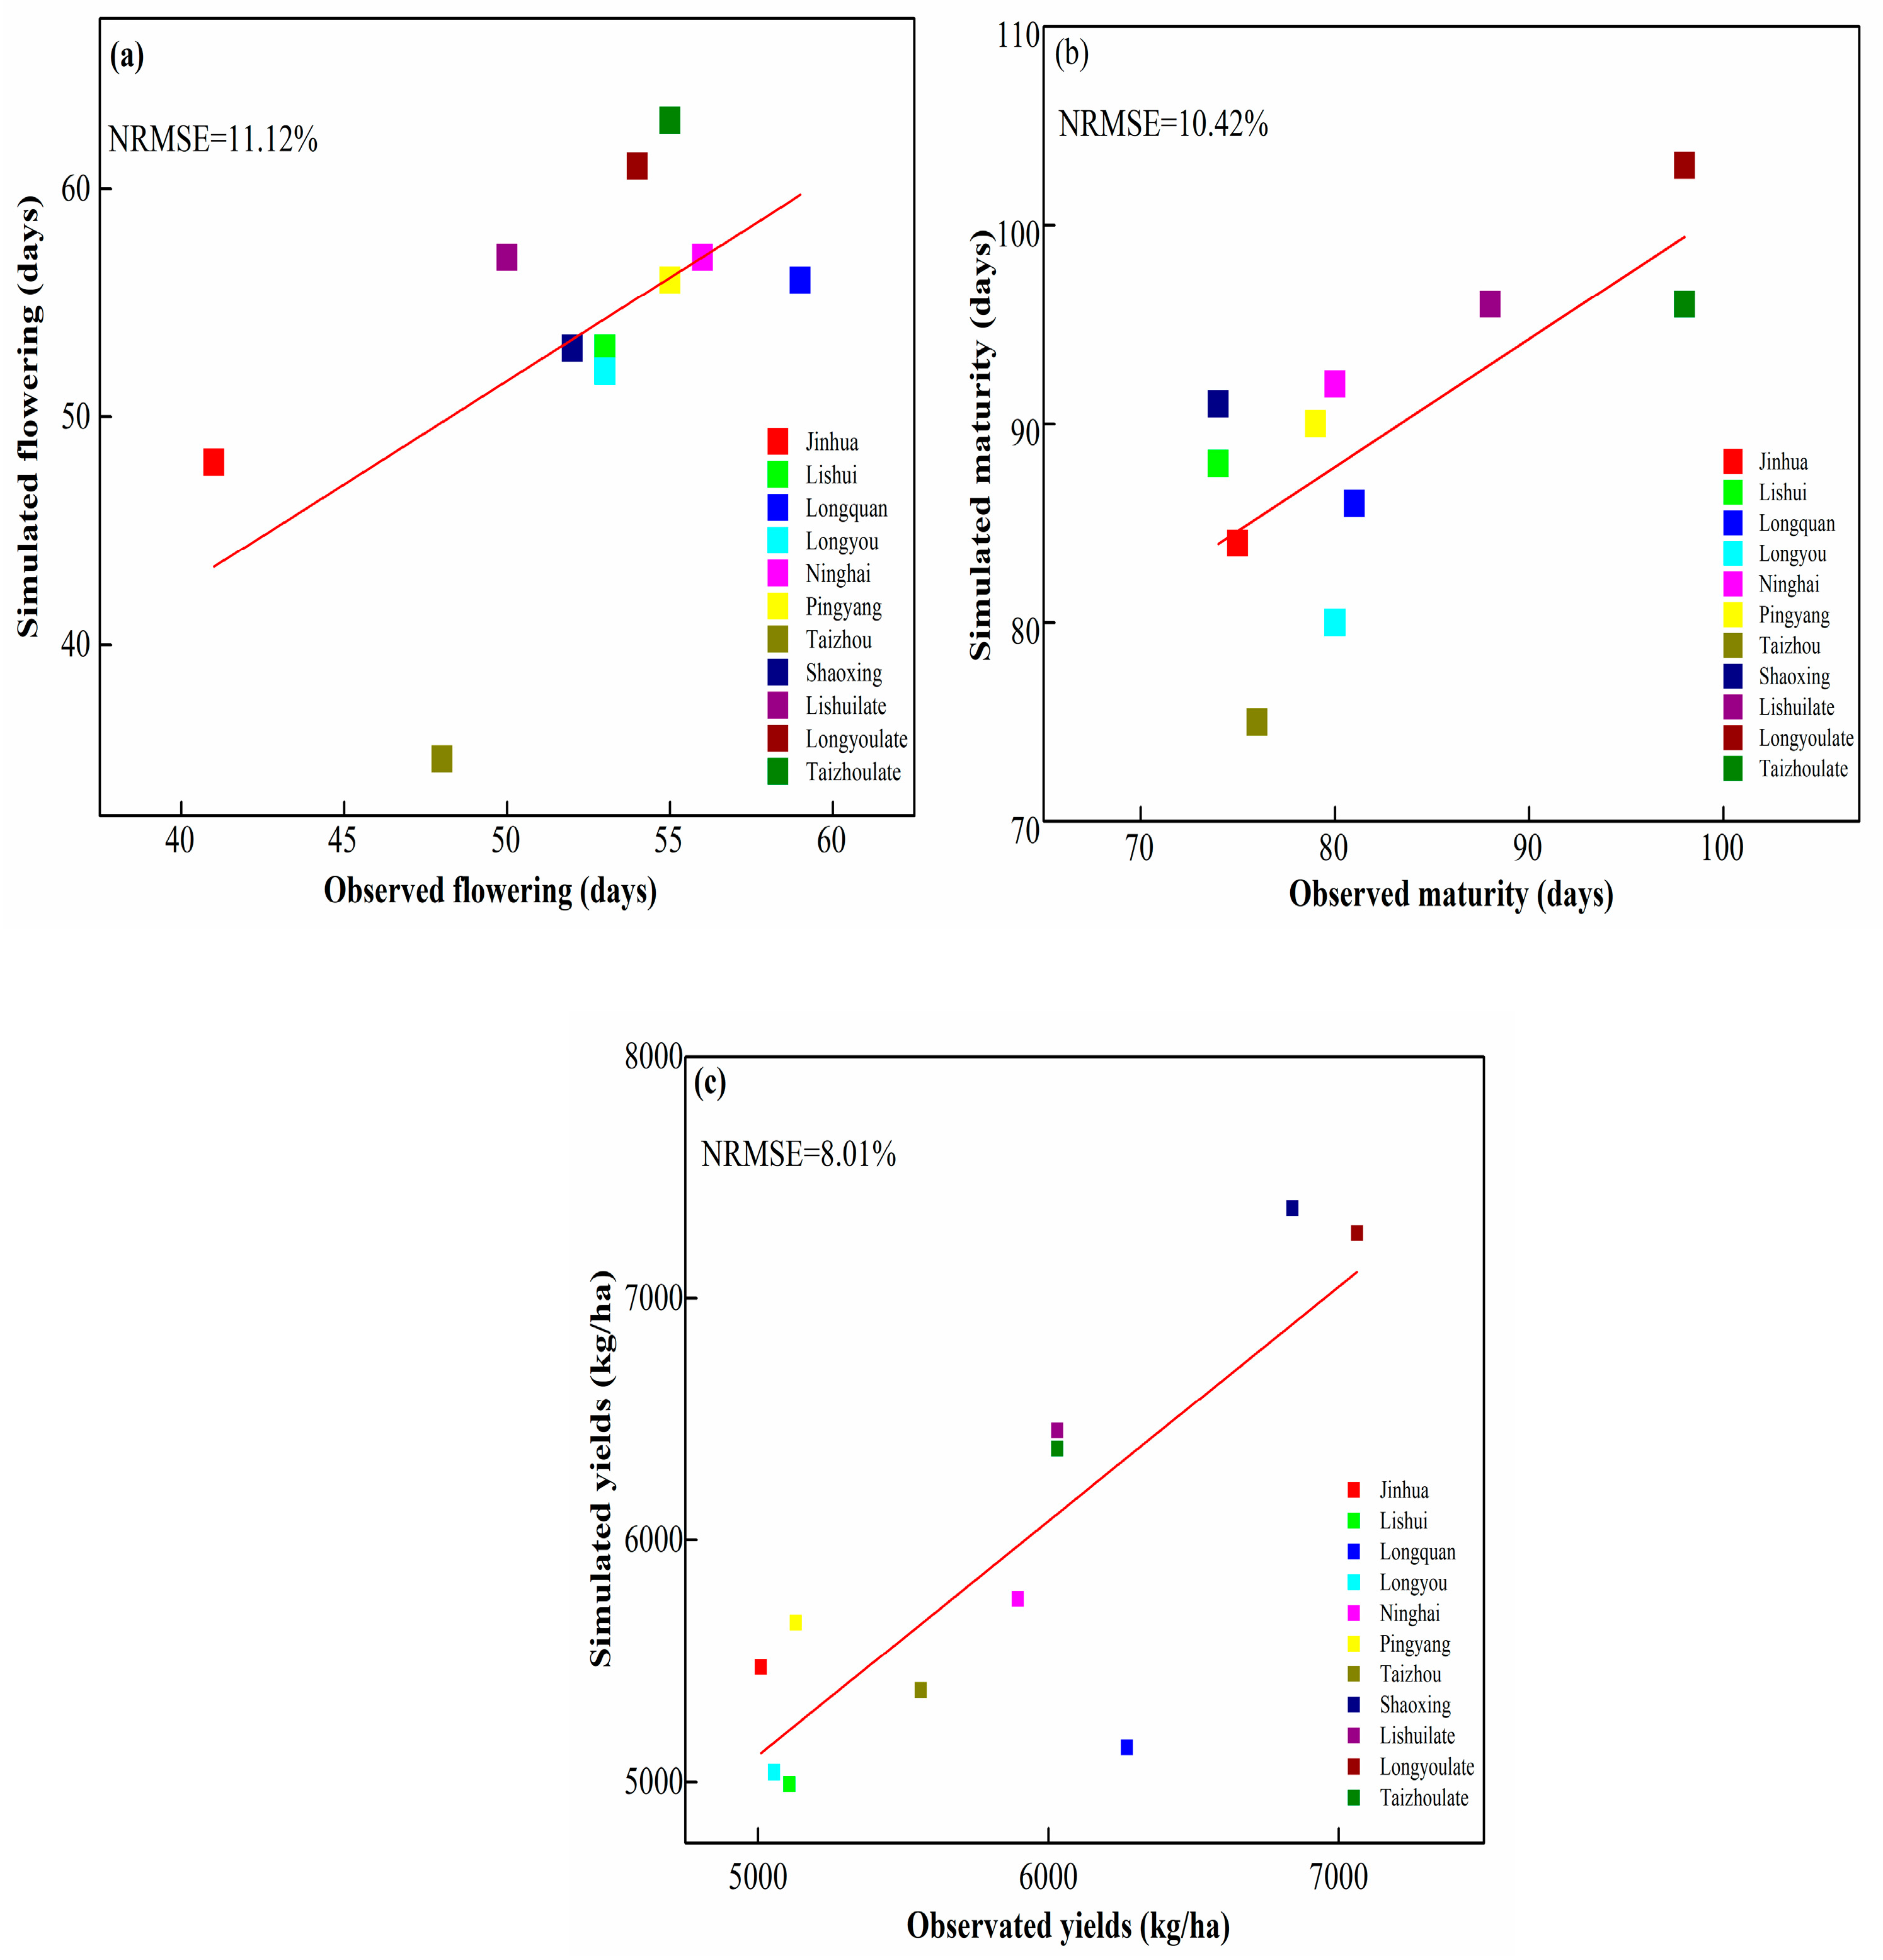
3.1. Calibration and Validation of the CERES-Rice Model
3.2. Projected Climate Change
3.3. Impacts of Climate Change on Rice Yields
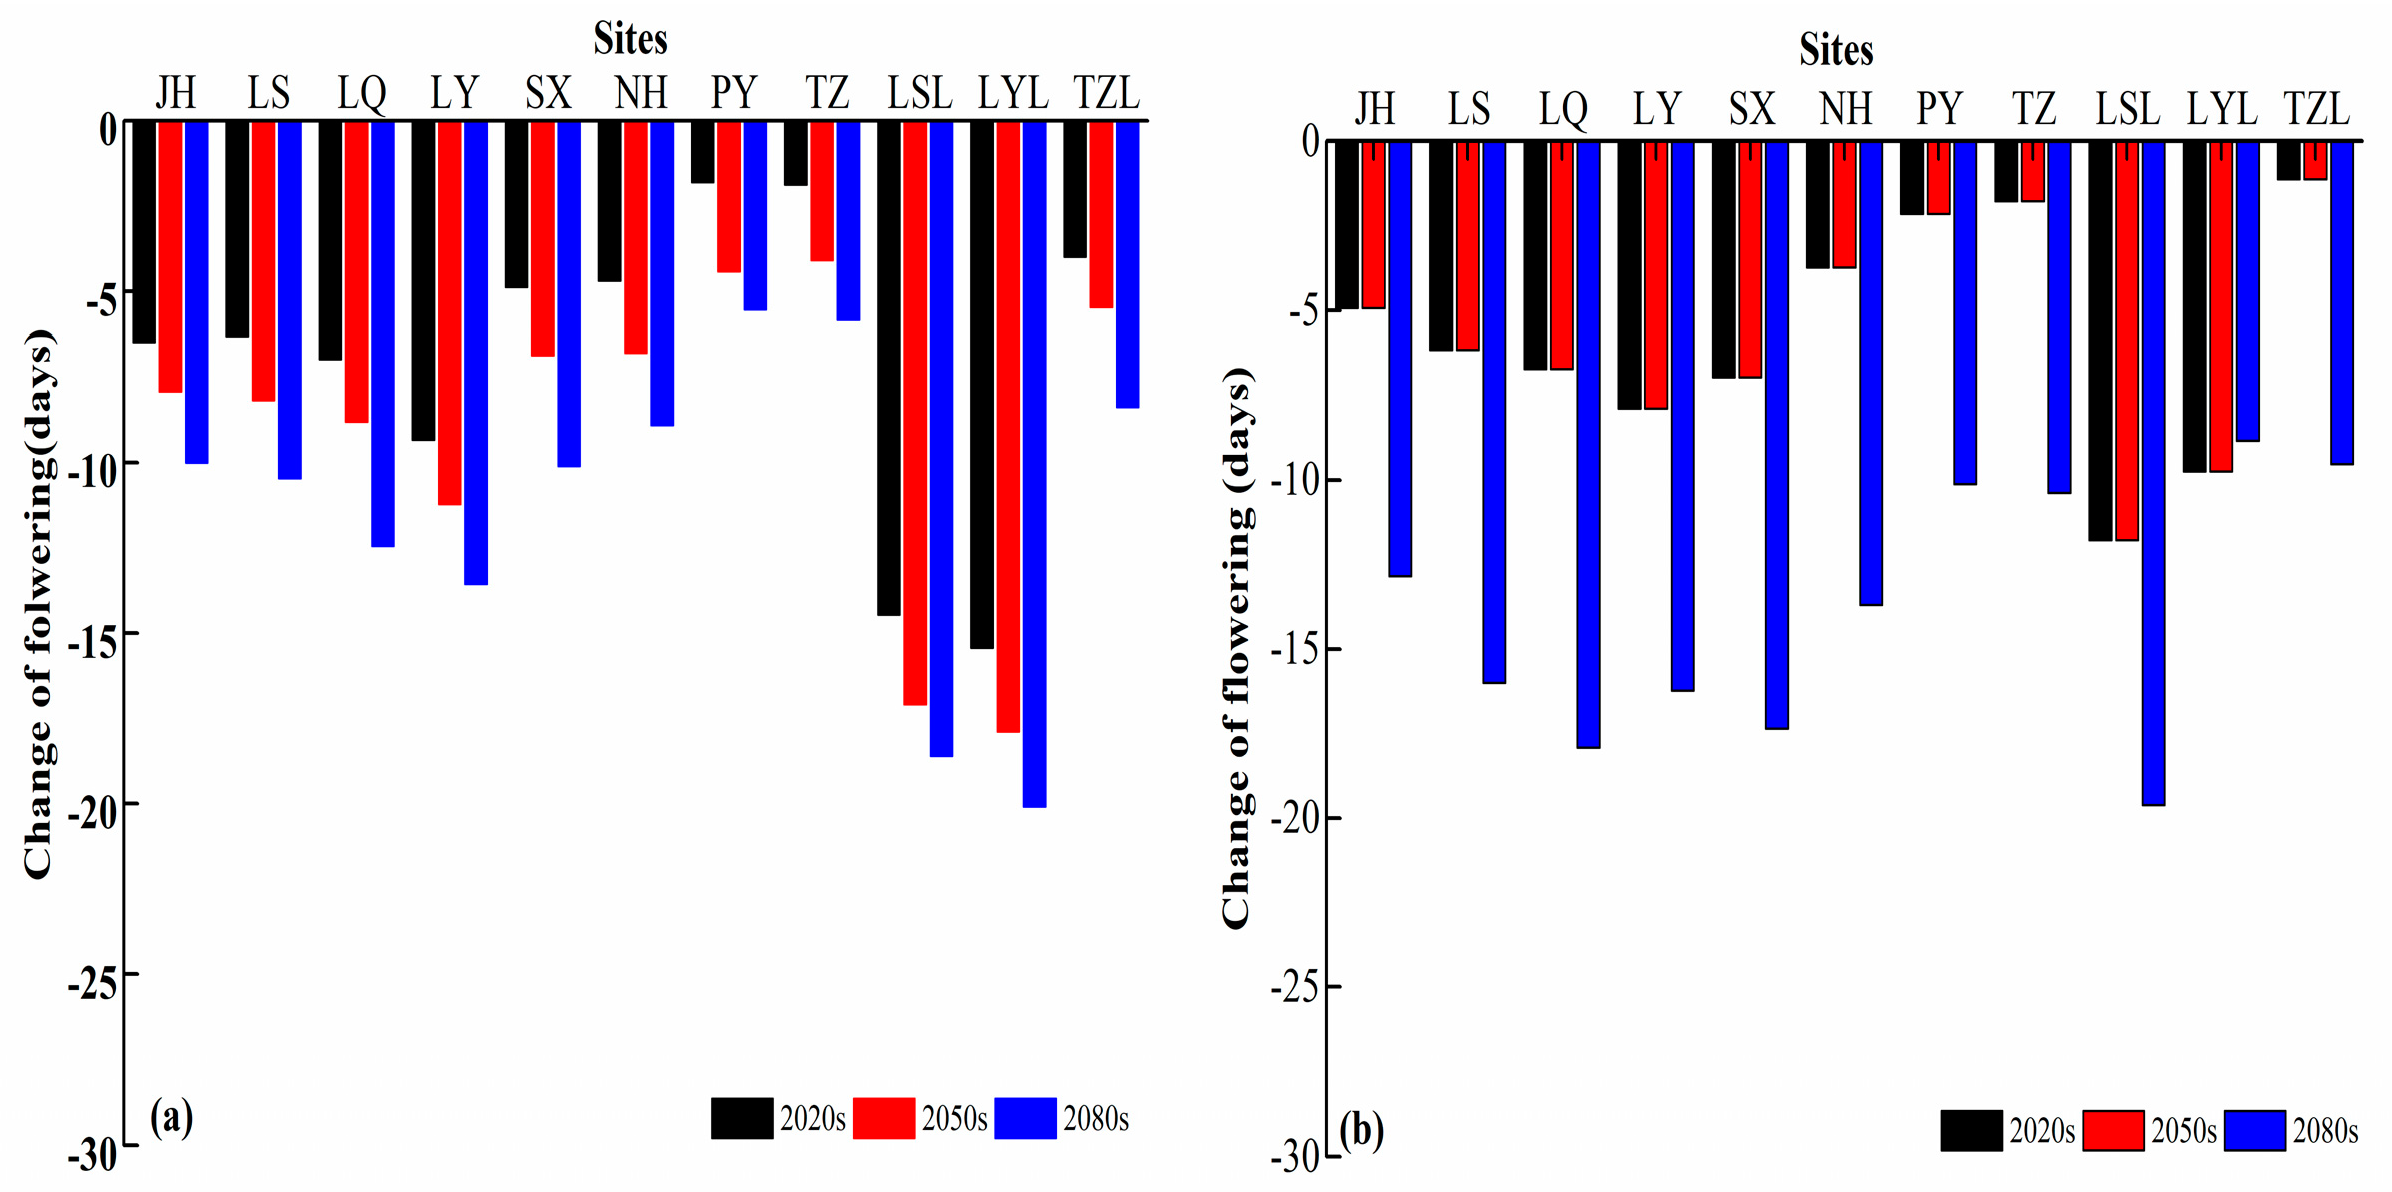
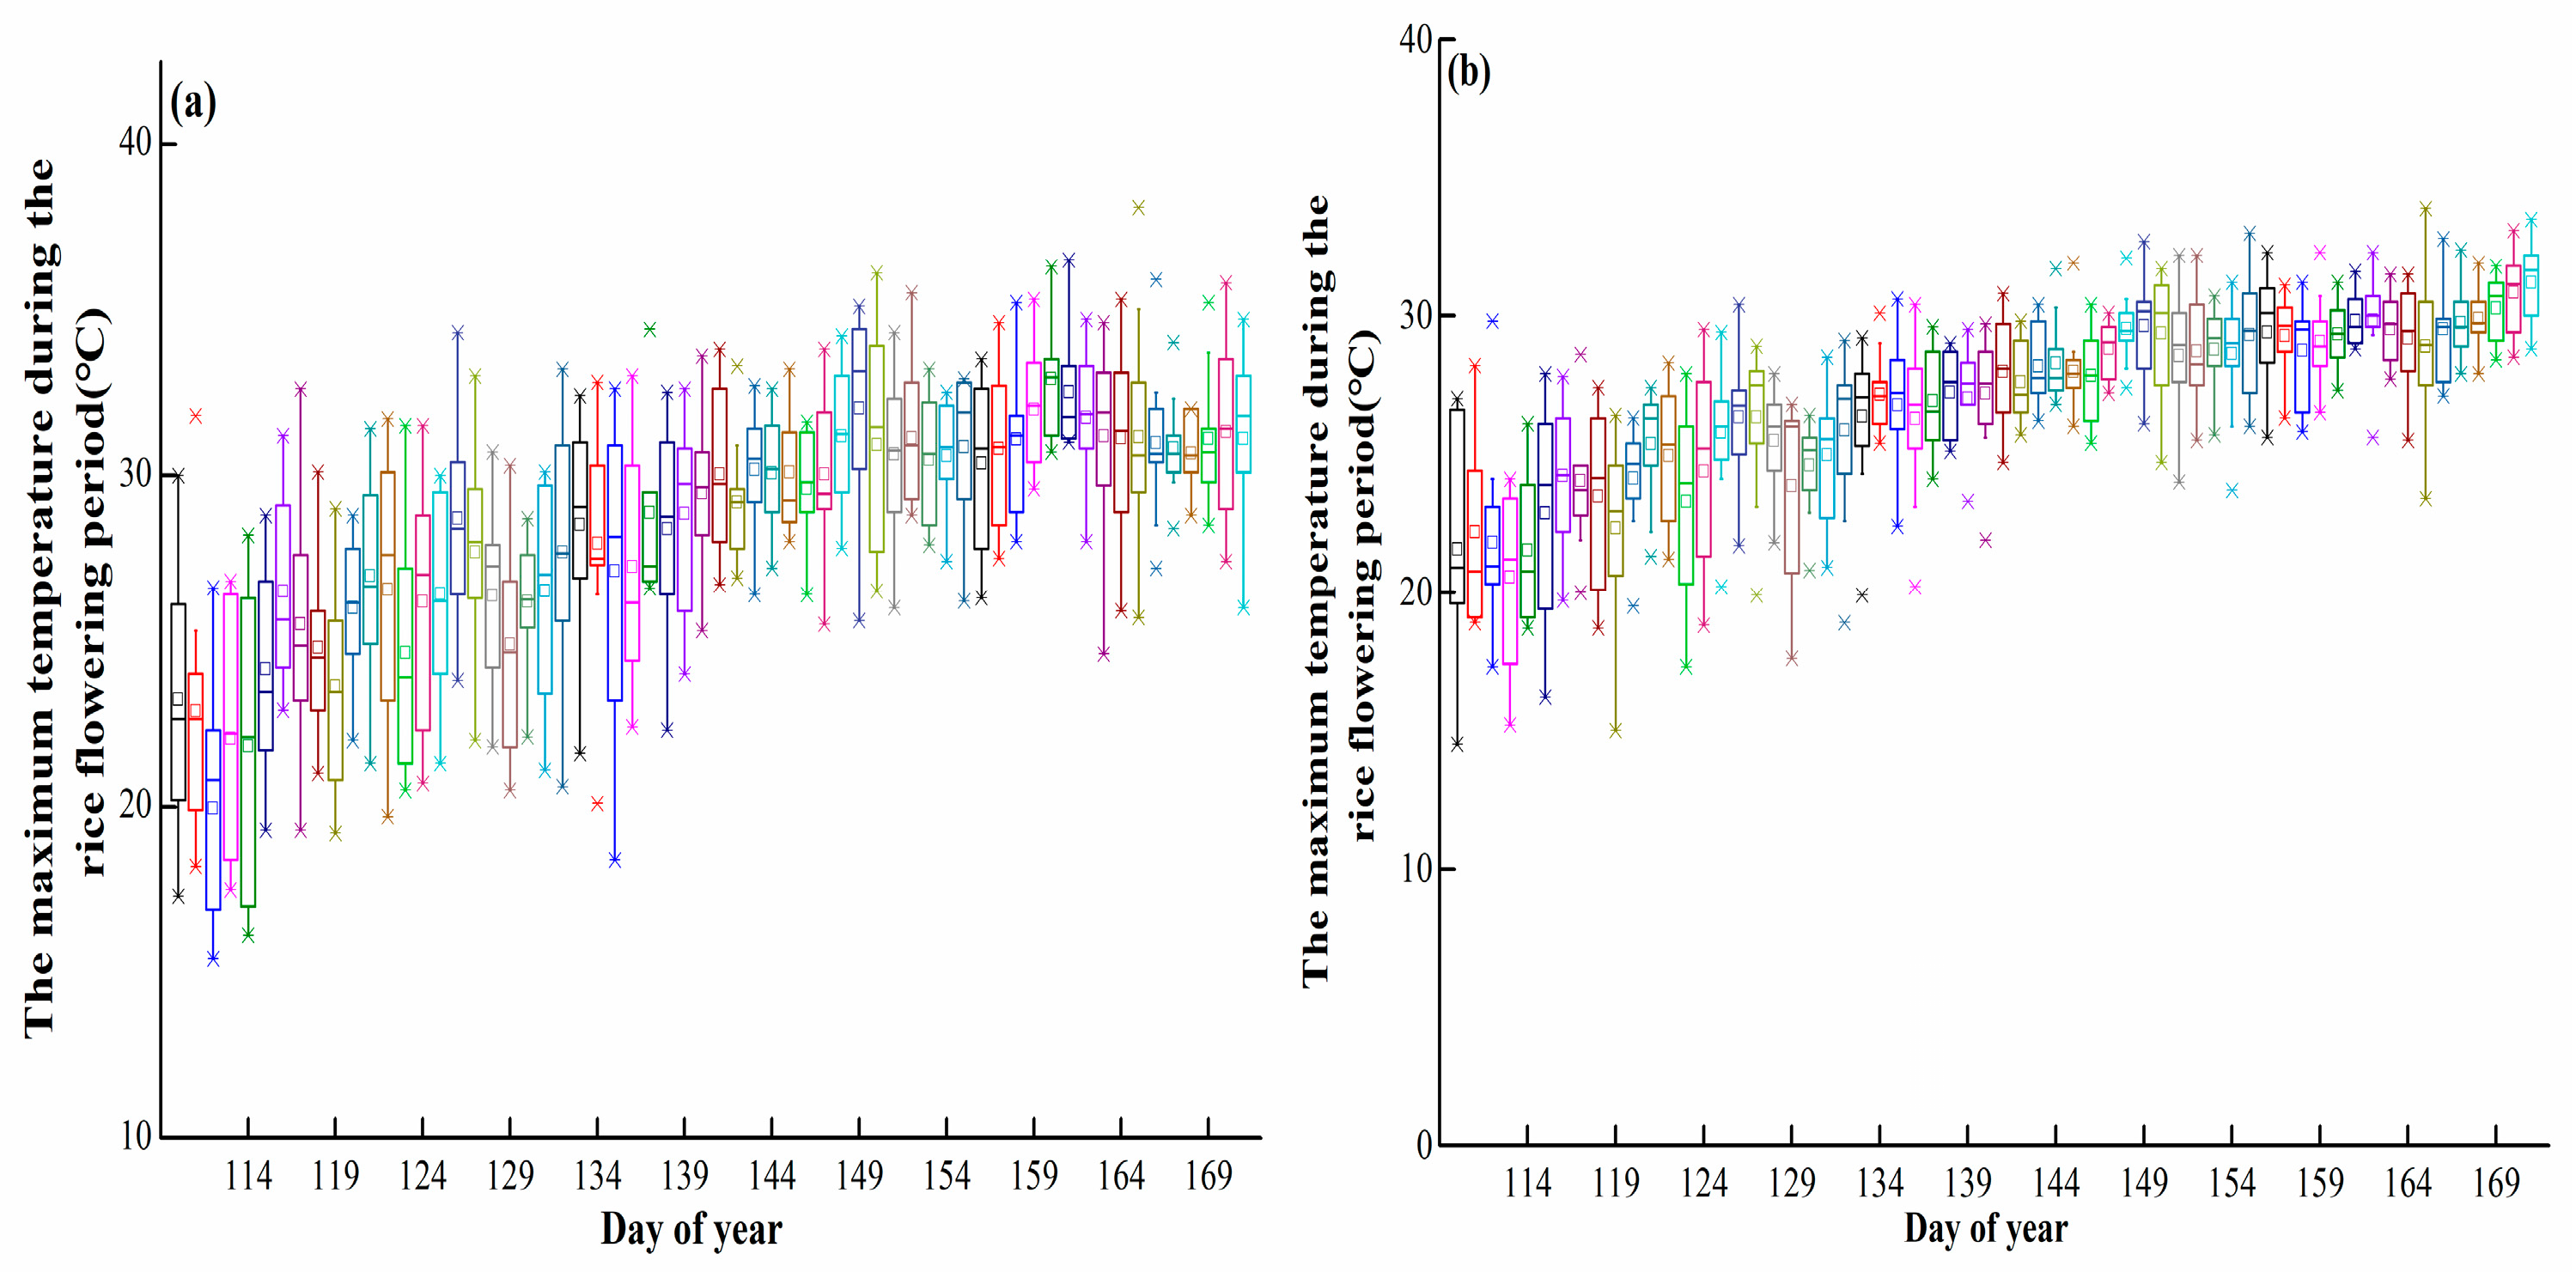
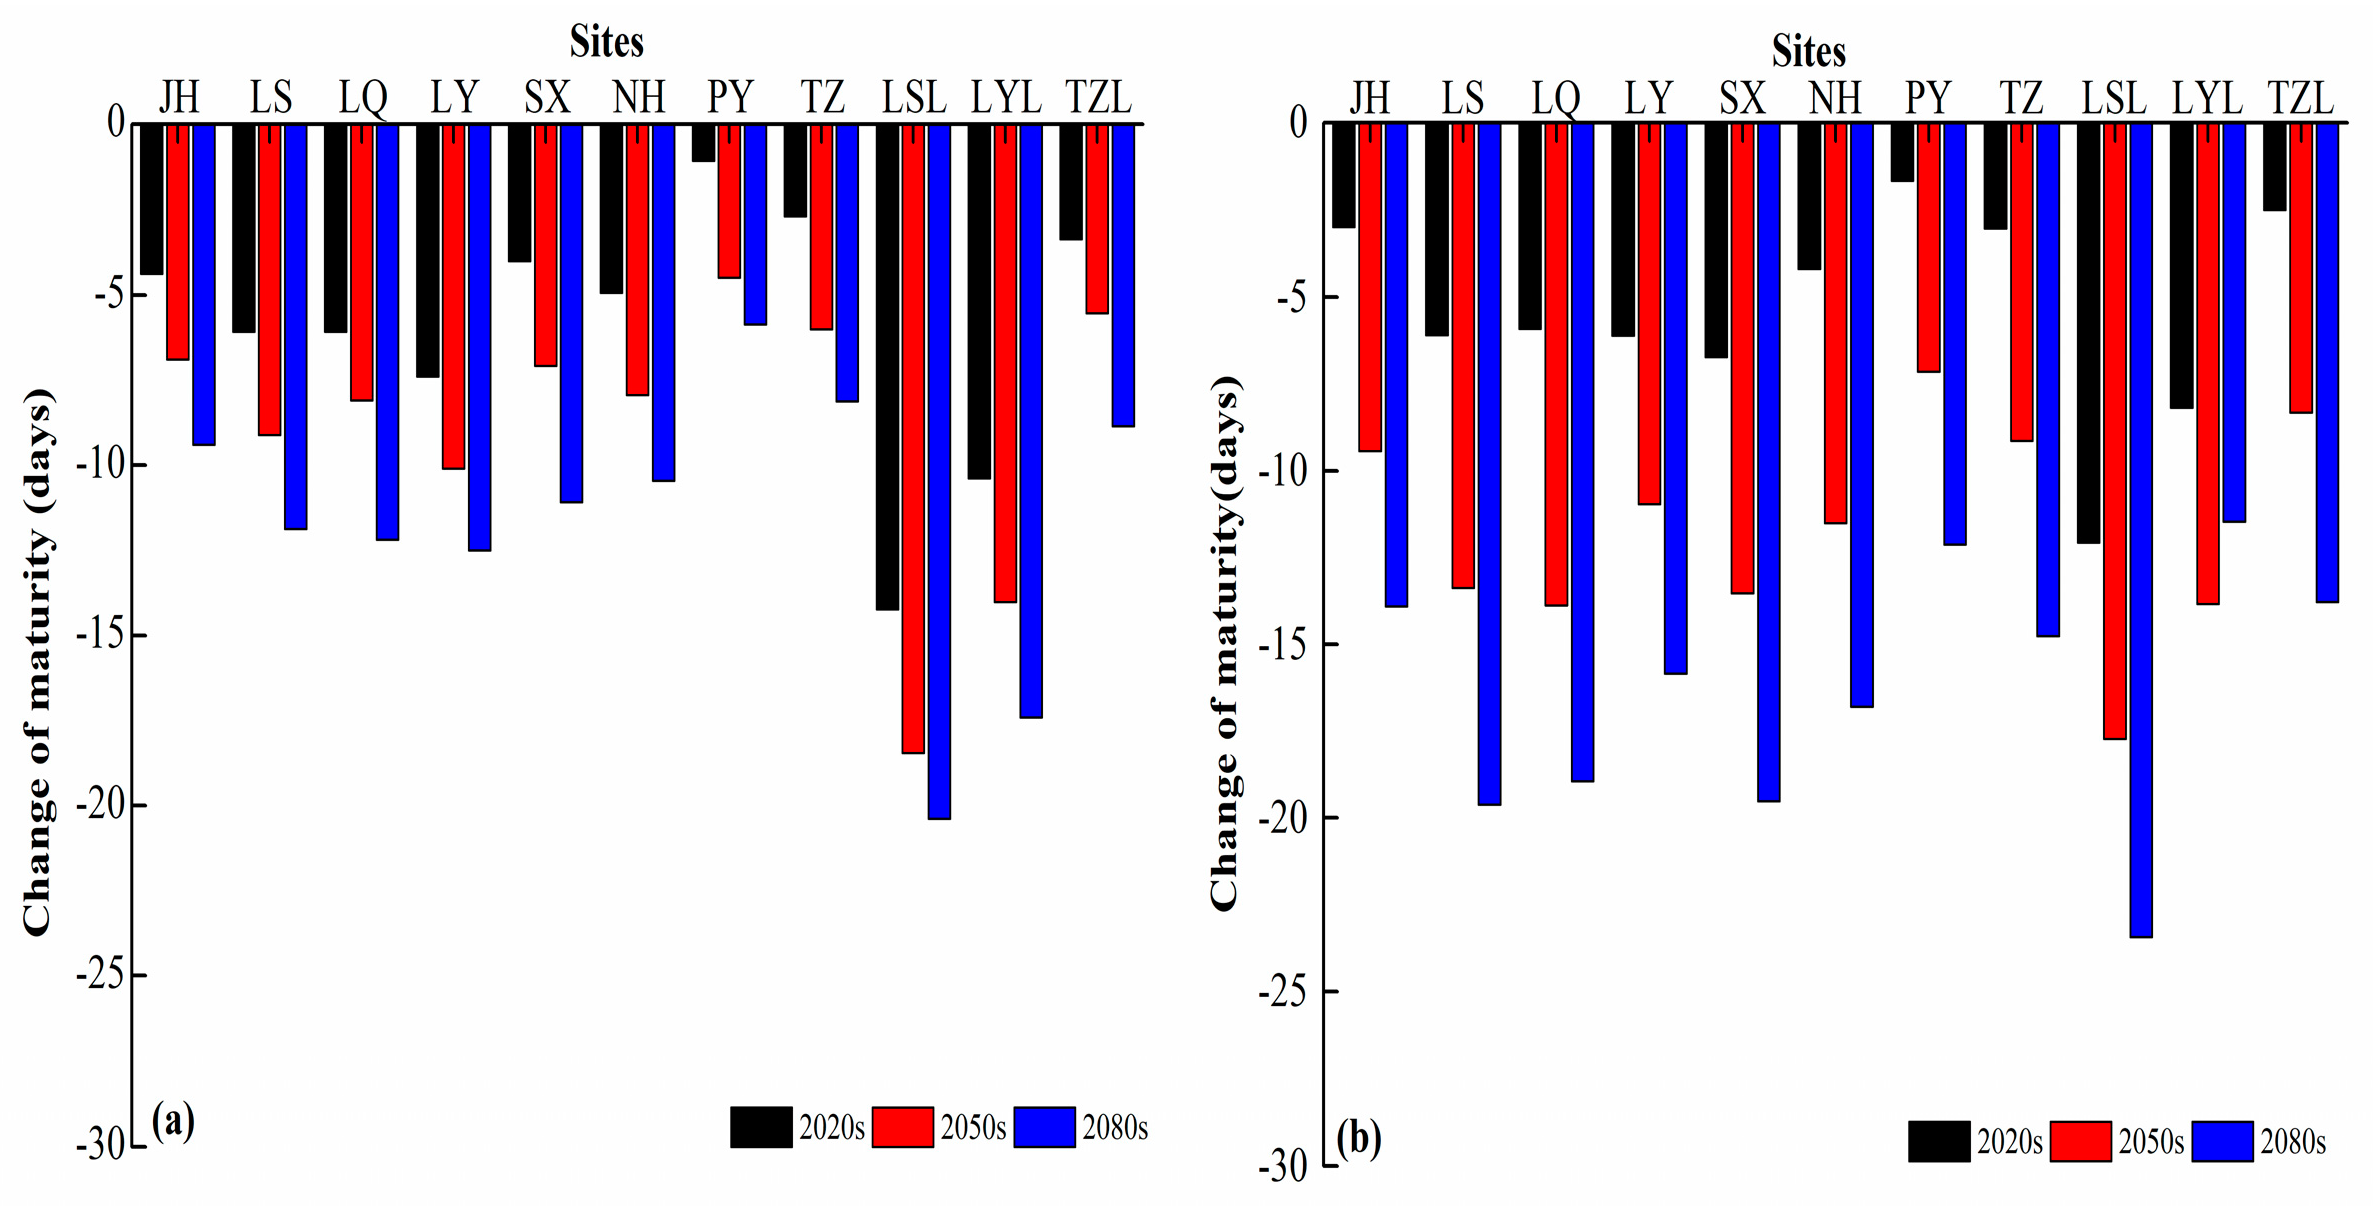
3.3.1. Impacts of Climate Change on Rice Phenology
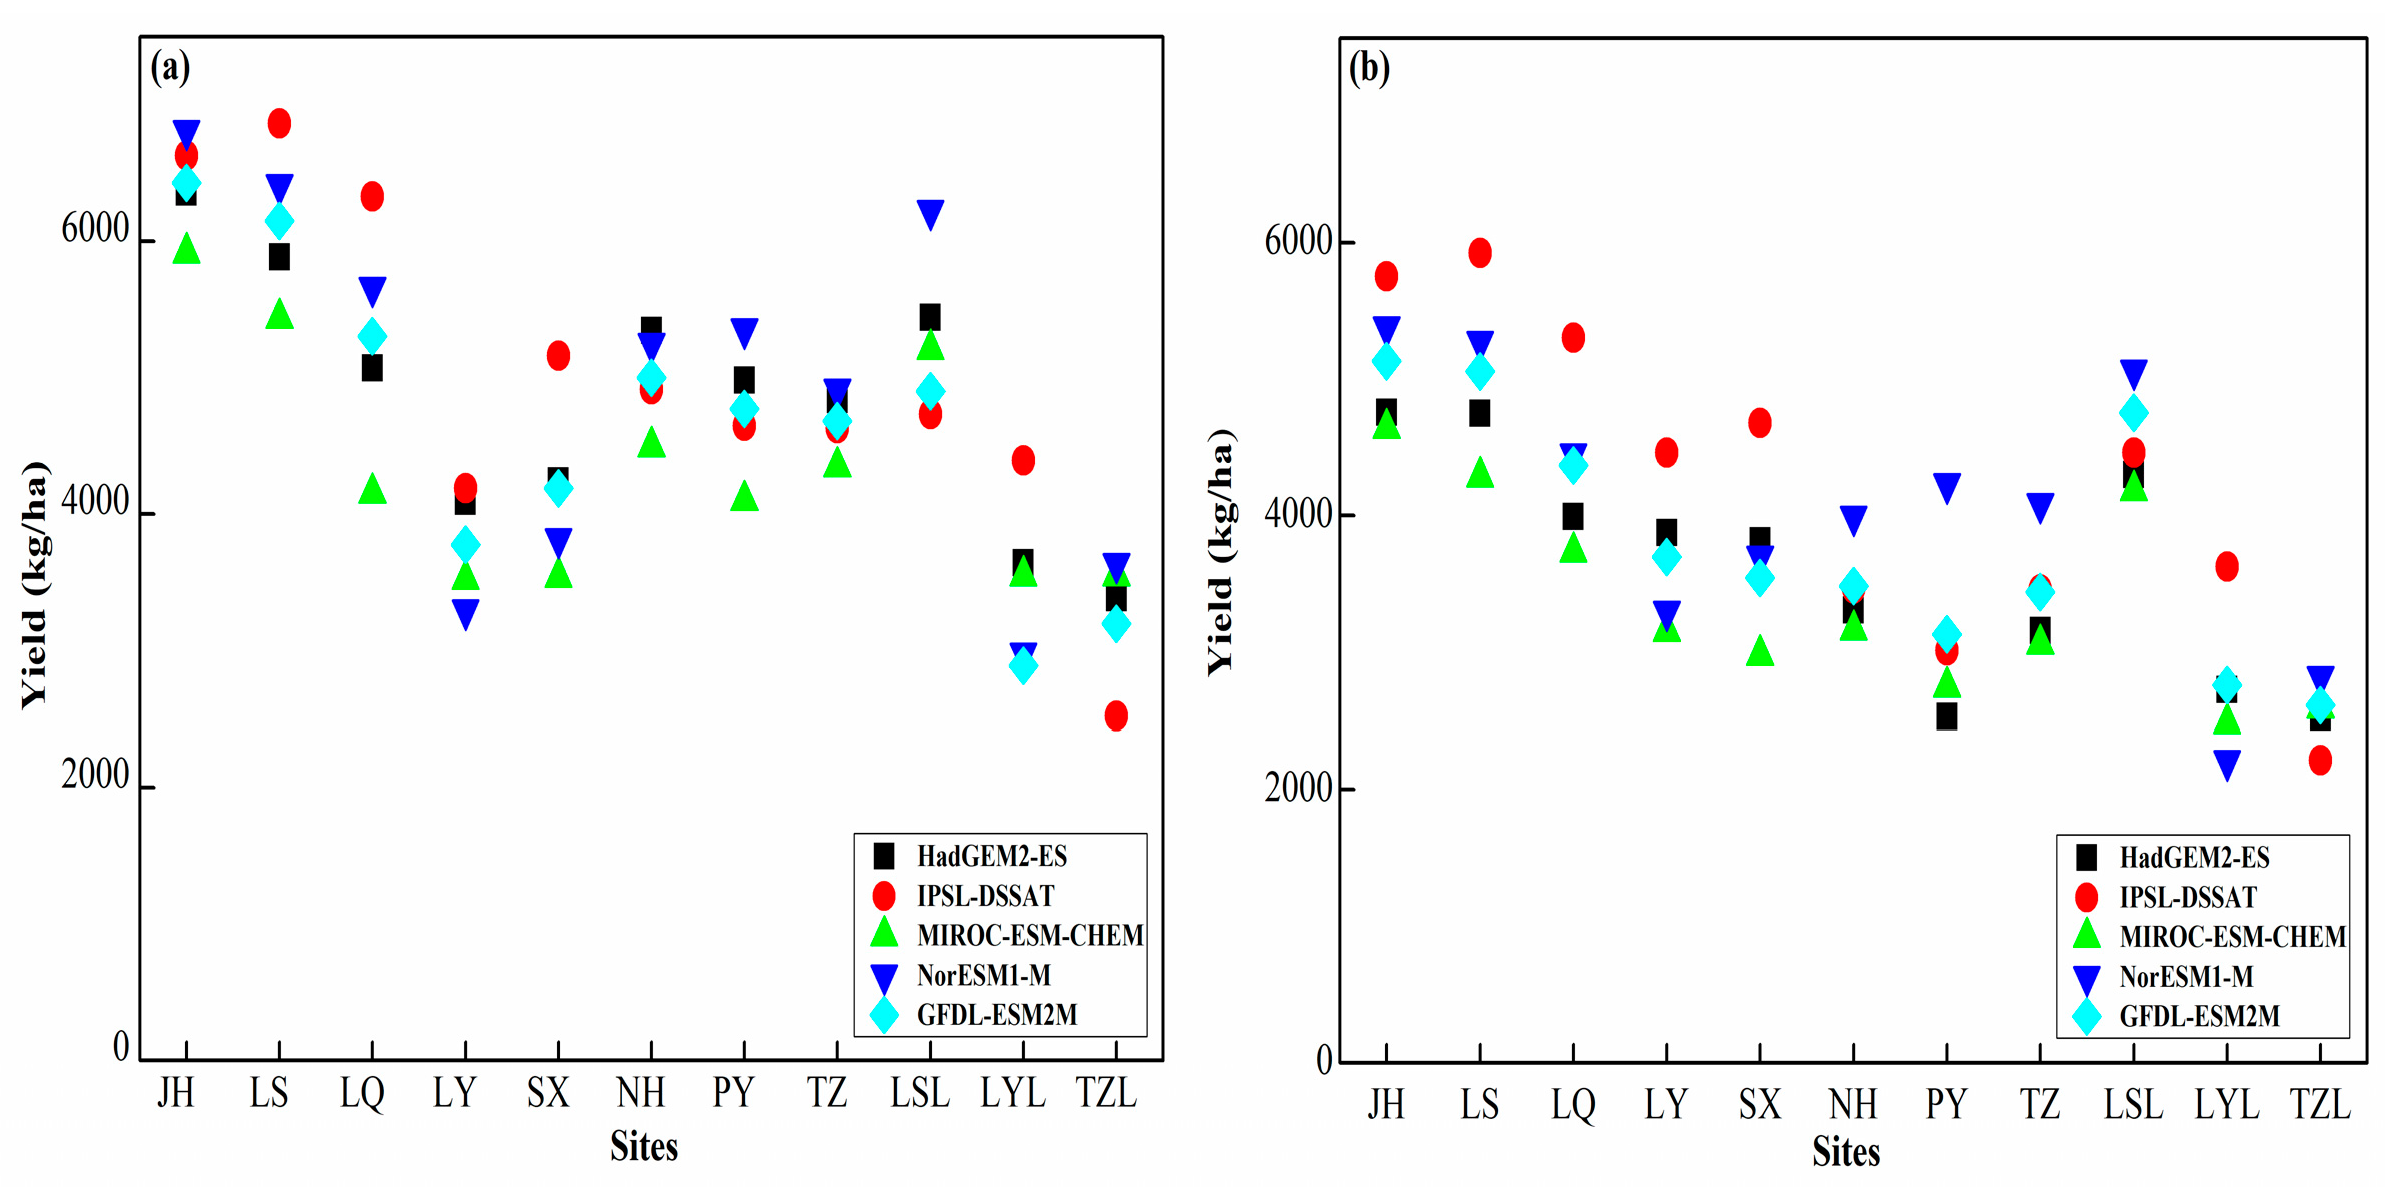
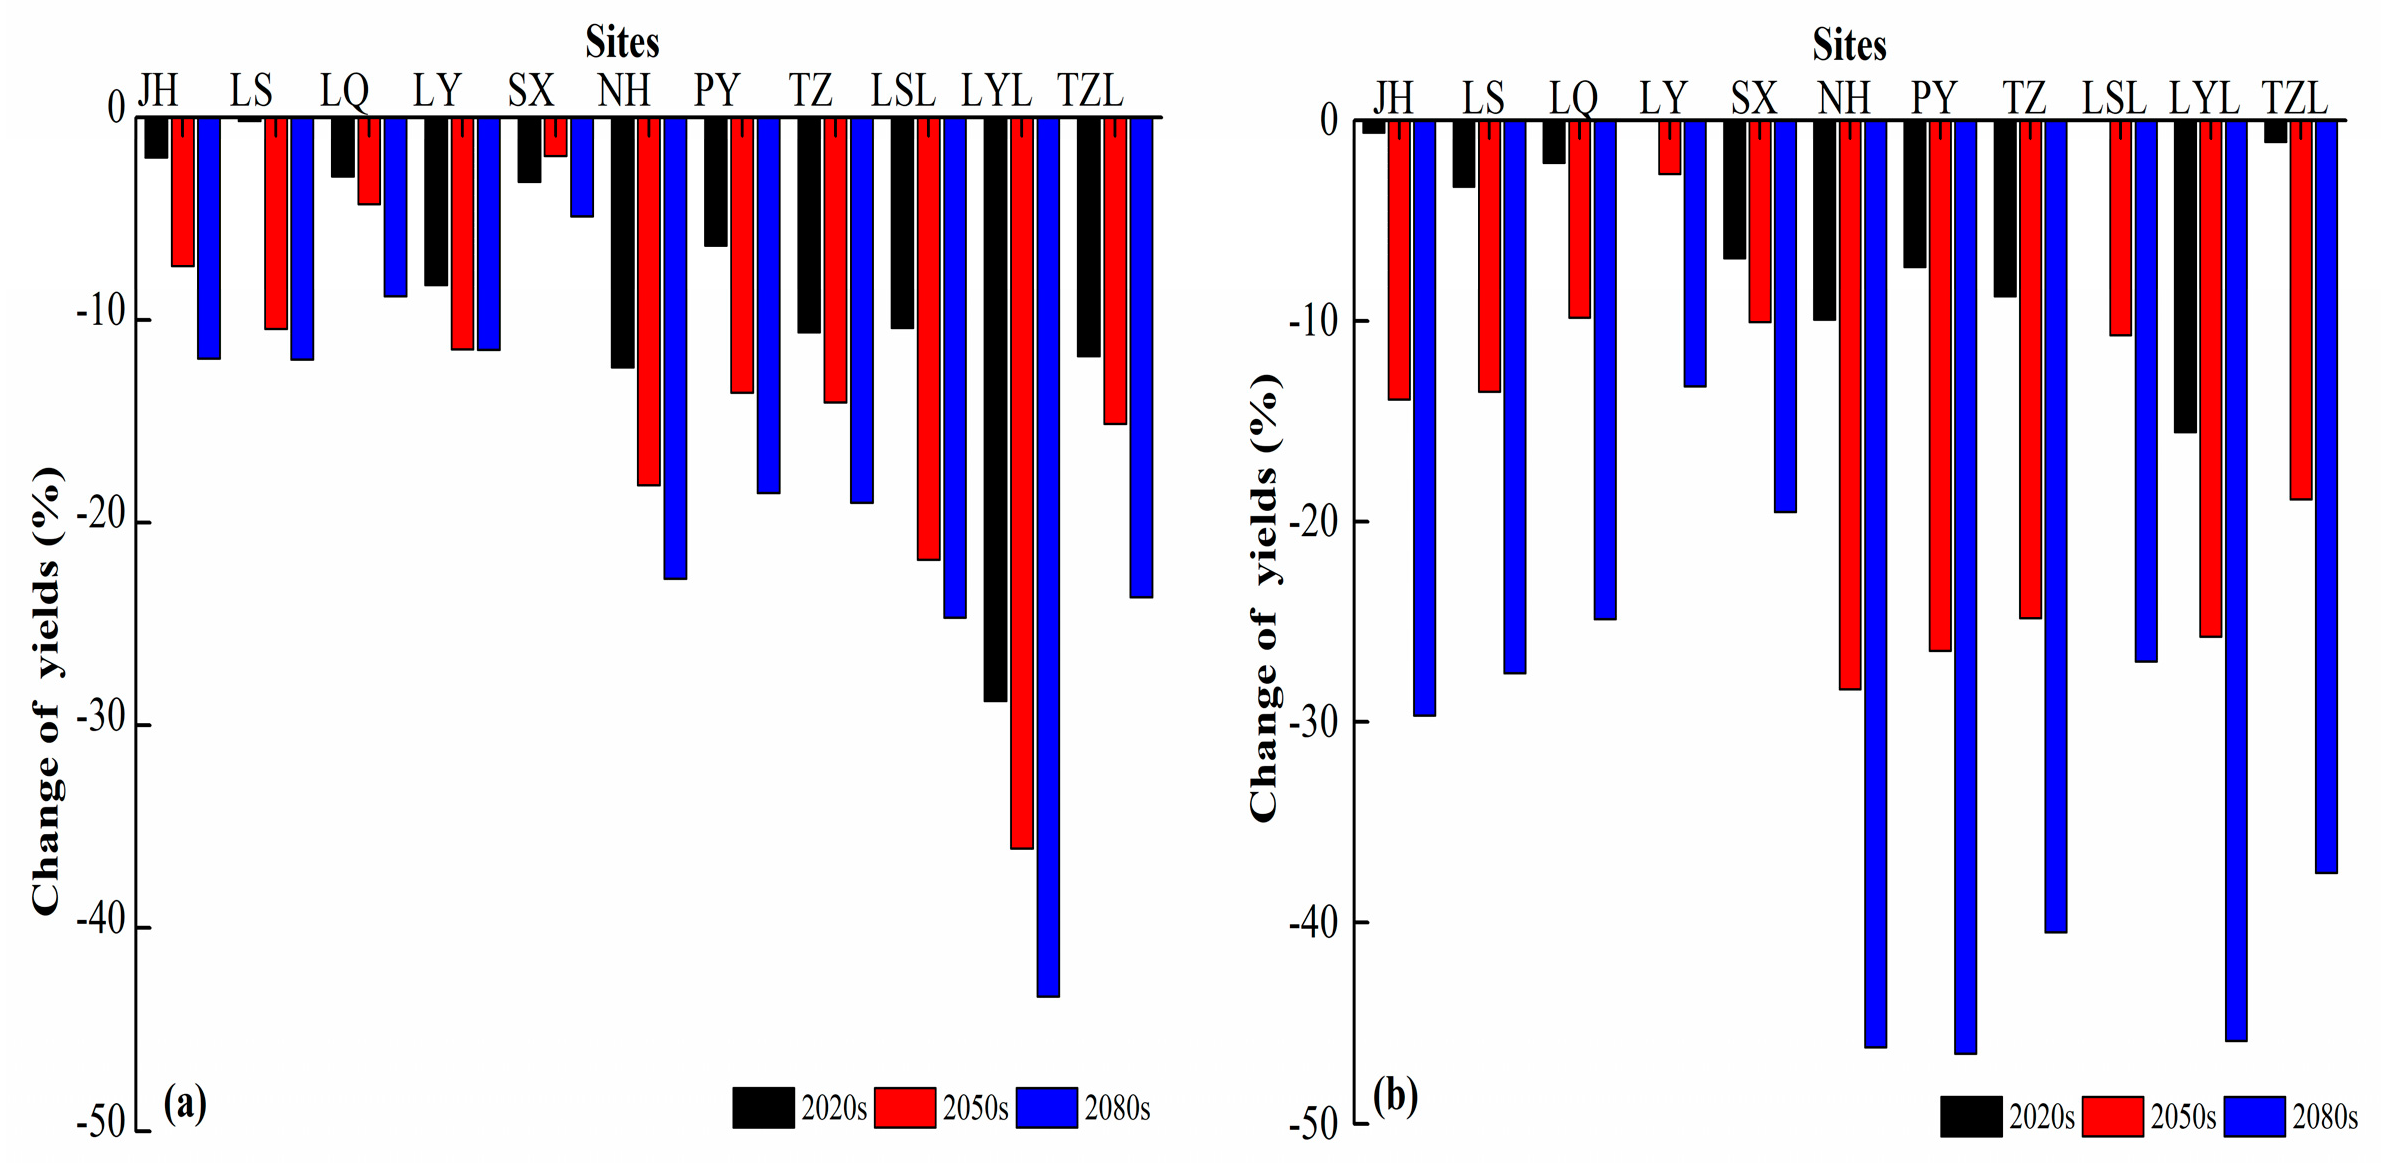
3.3.2. Impacts of Climate Change on Rice Yields without CO2 Fertilization Effects
3.3.3. Impacts of the CO2 Fertilization Effects on Rice Yields
4. Discussion
4.1. Analysis of the Impacts of Changing Climate Variables
4.2. Simulation of Adaptation Options
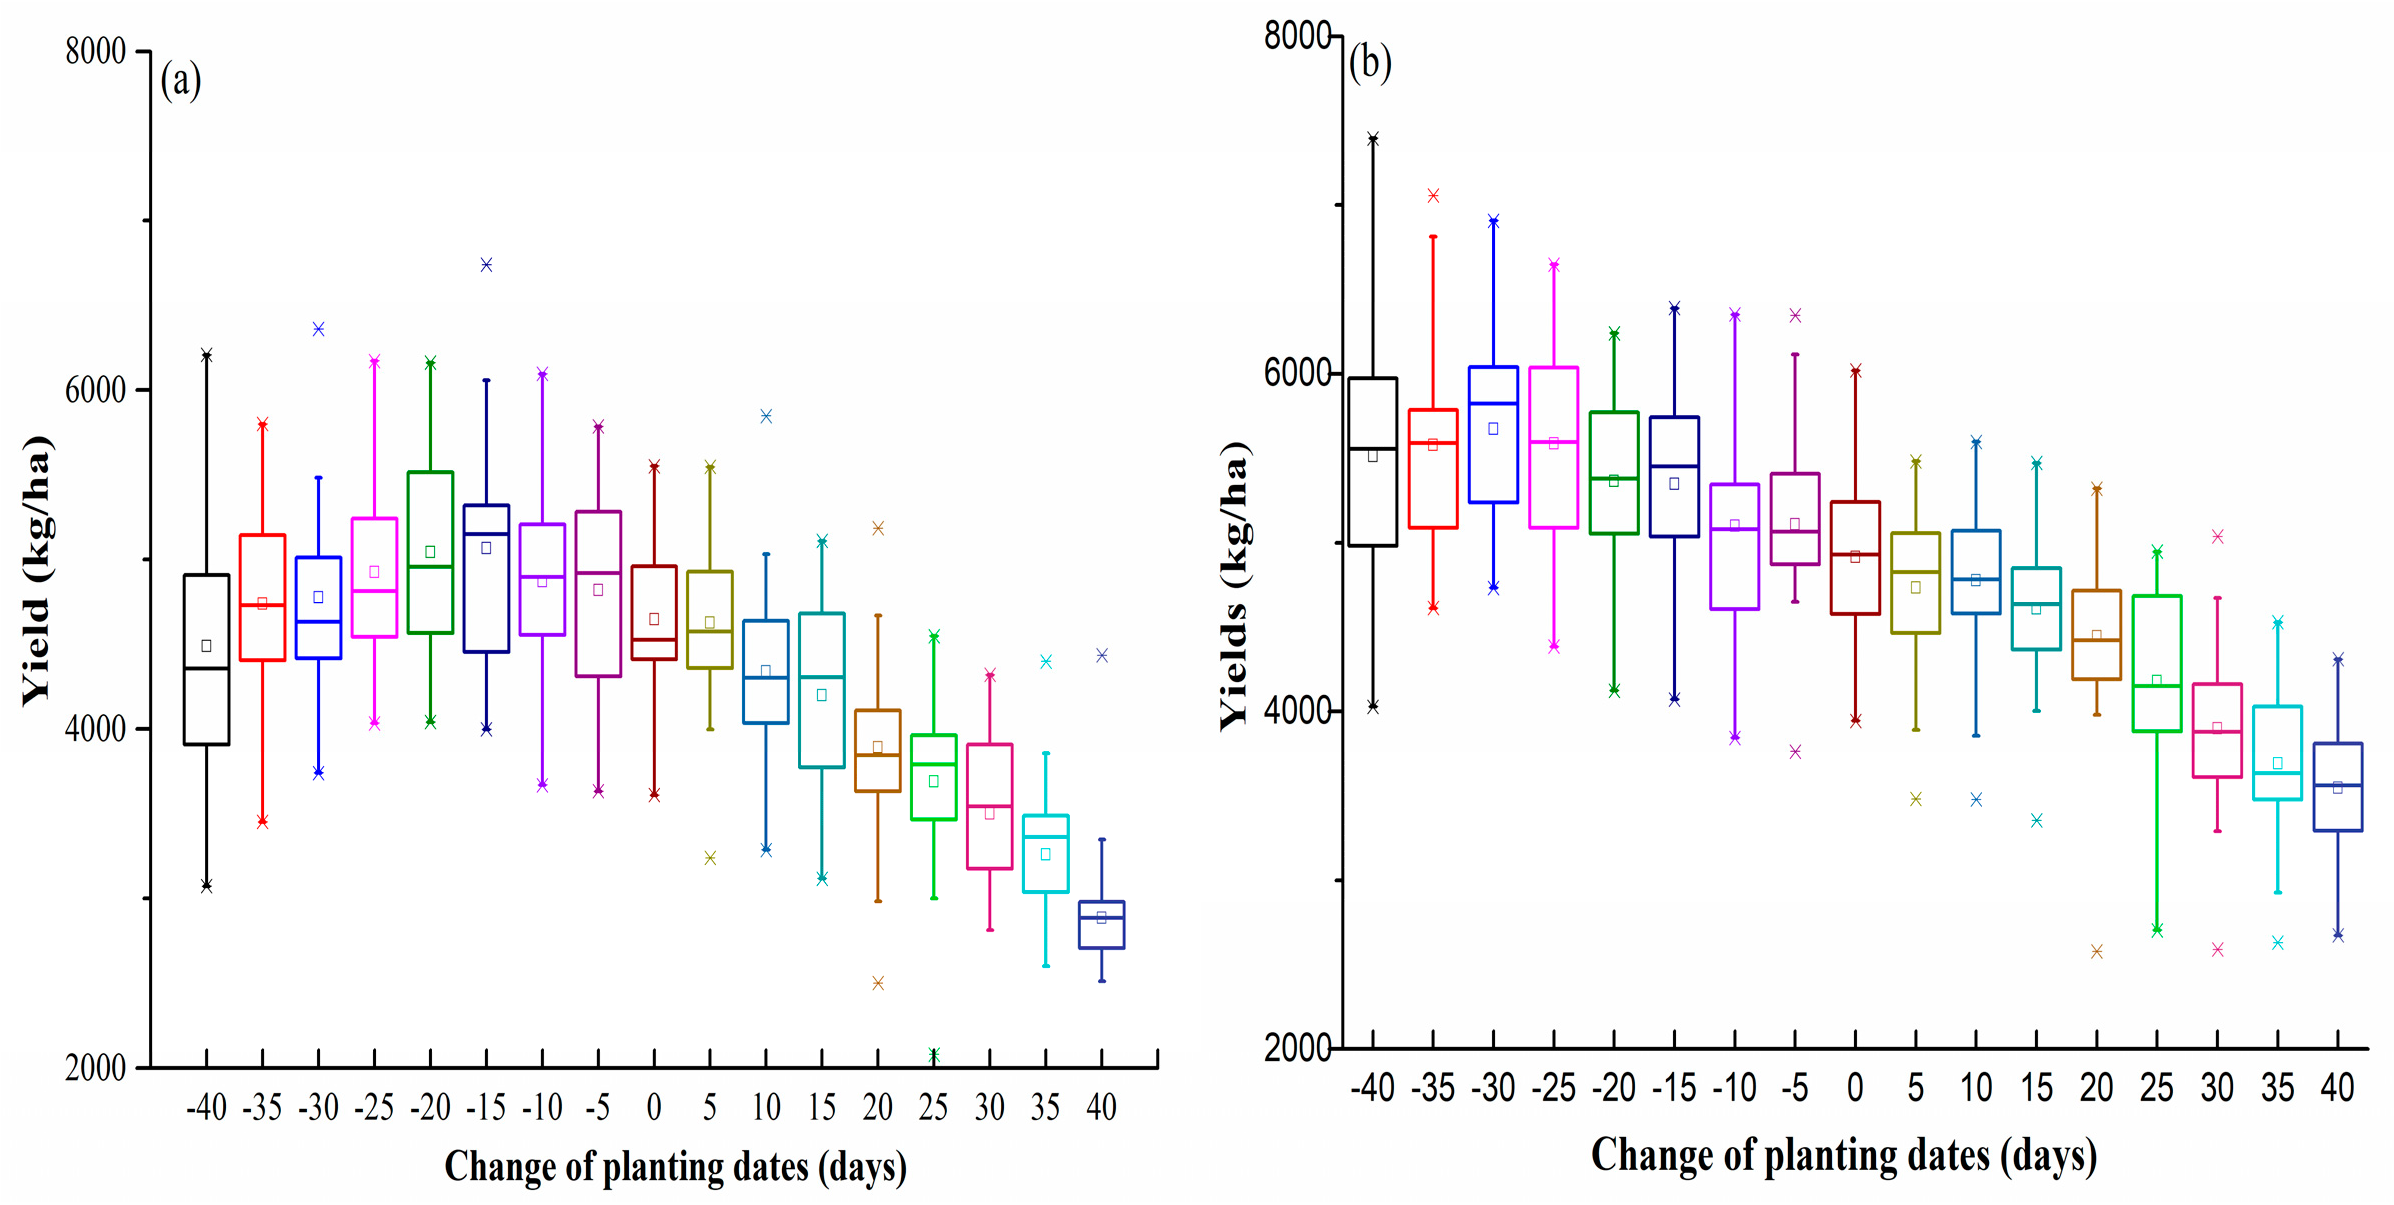
4.2.1. Adjusting the Rice Planting Dates
4.2.2. Switching to High-Temperature-Tolerant Rice Cultivars
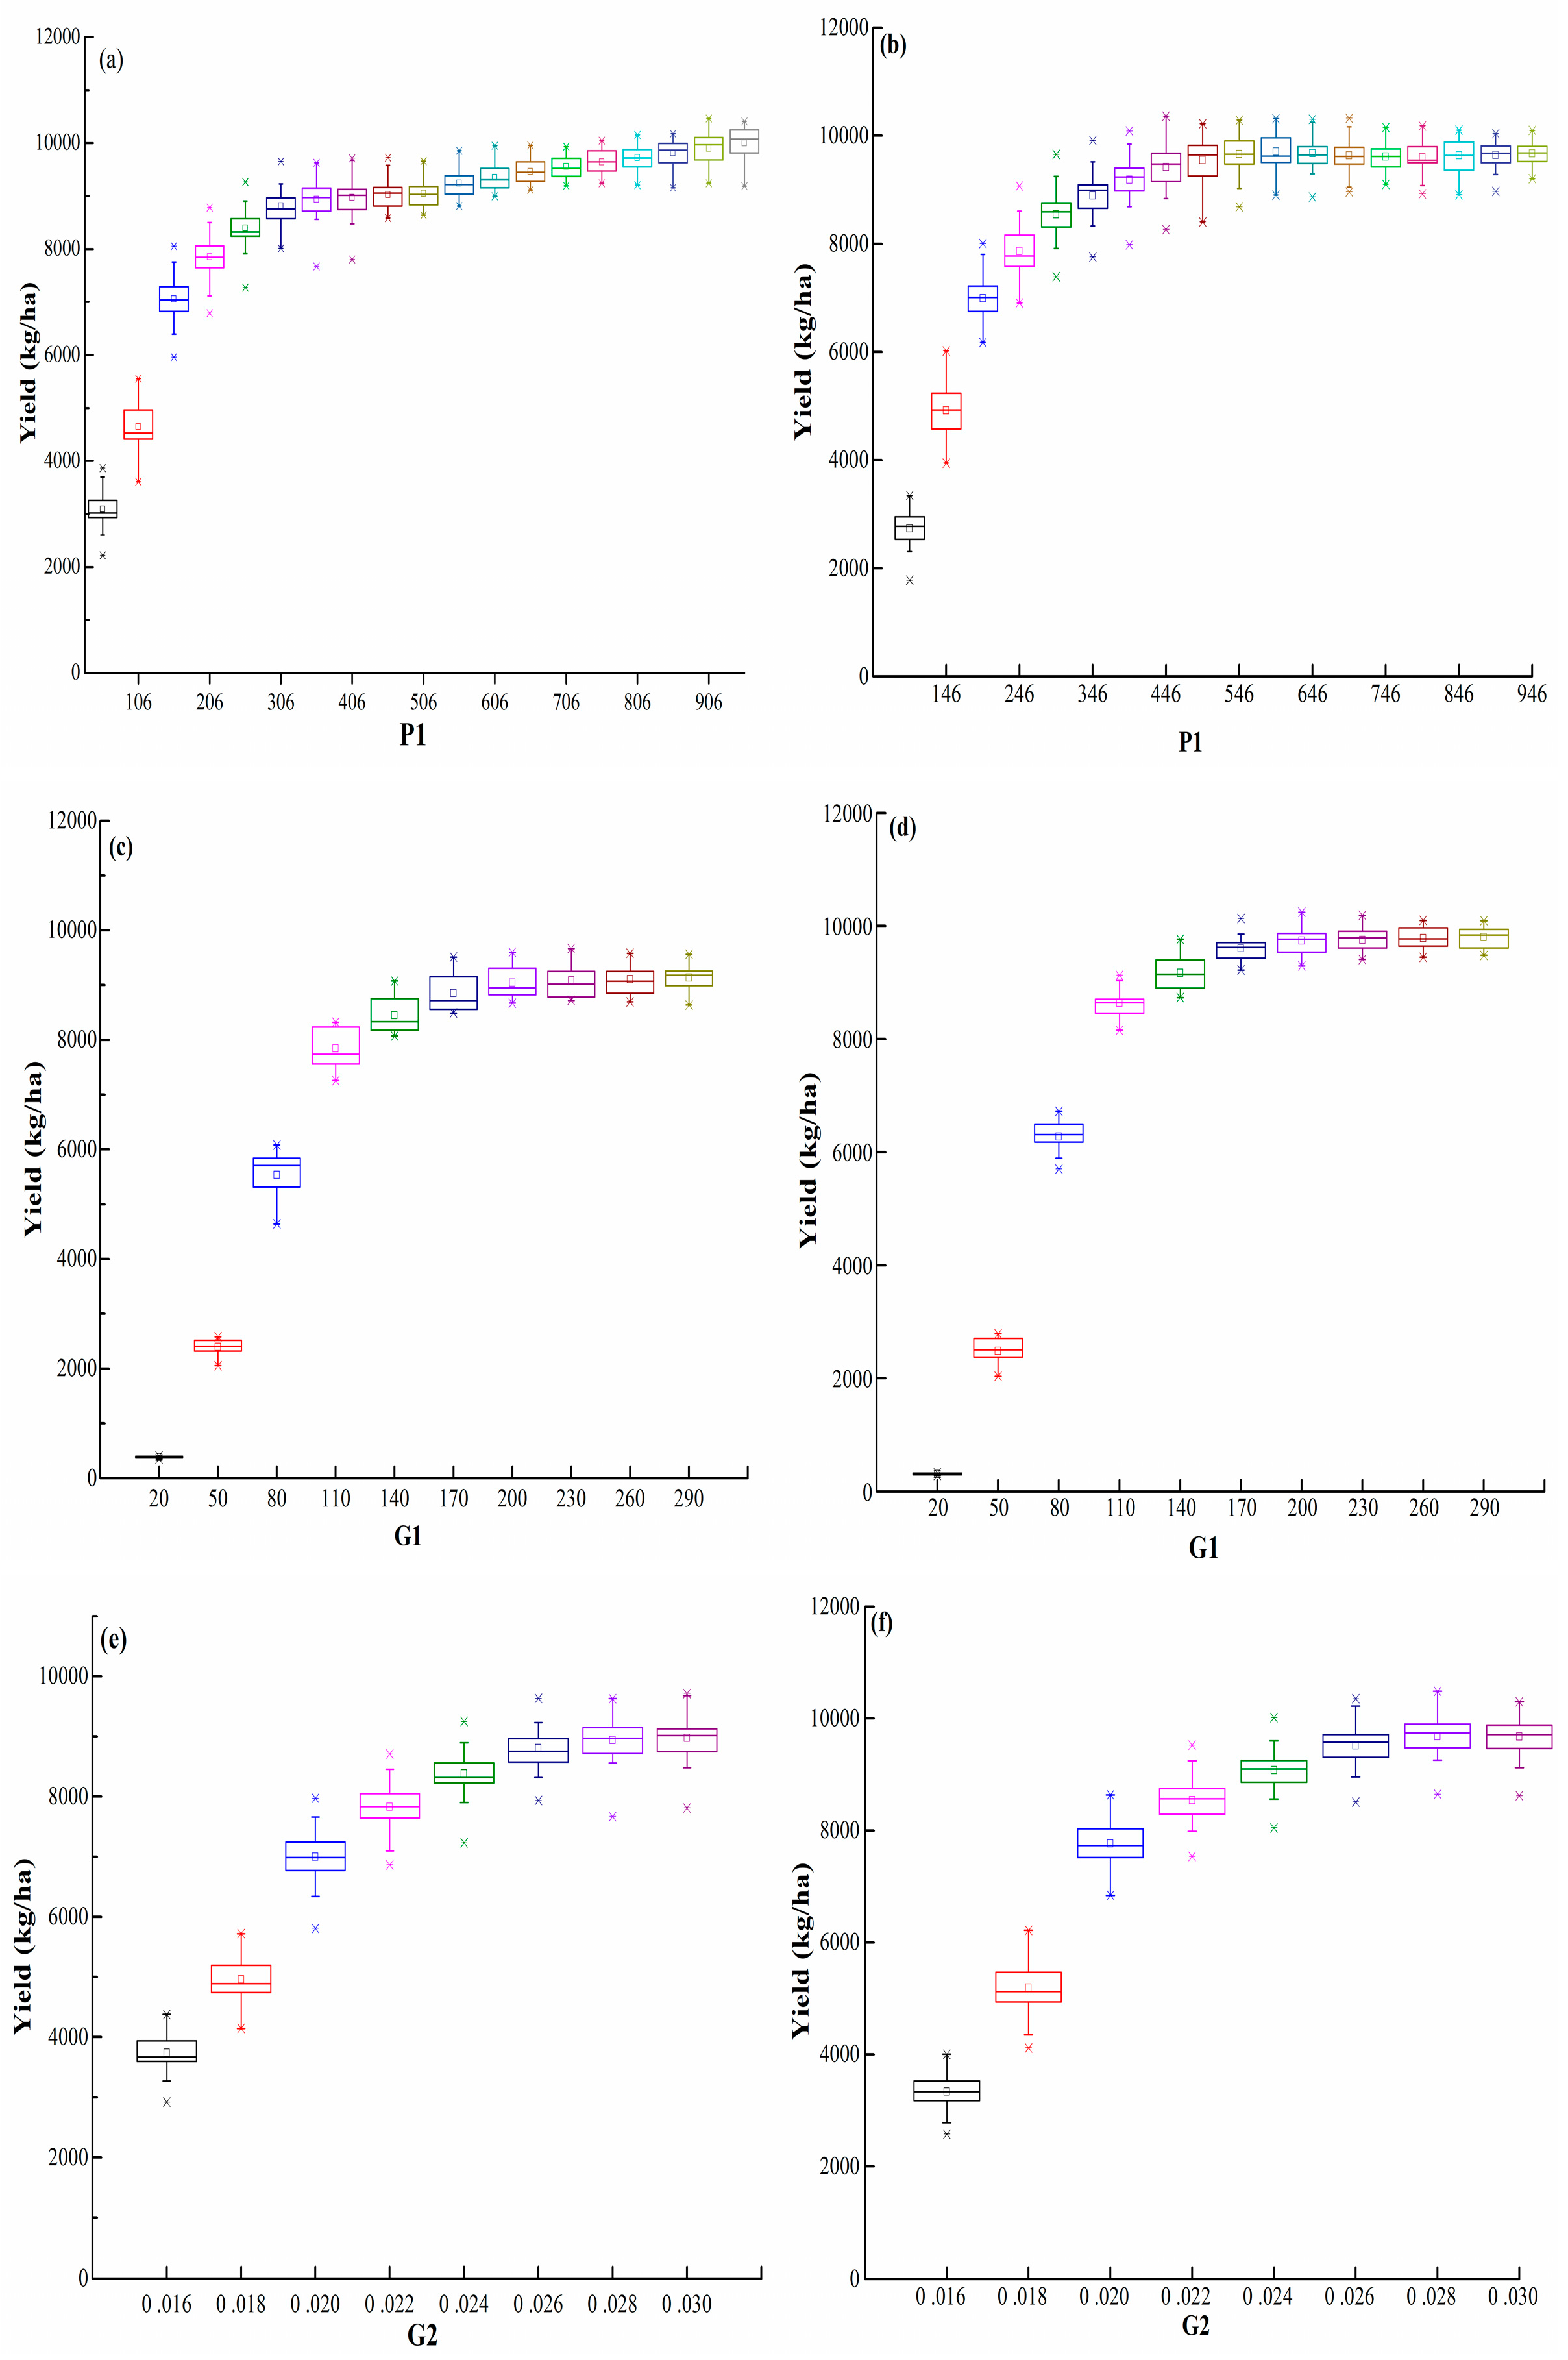
4.2.3. Breeding New Rice Cultivars
4.3. Uncertainties
5. Conclusions
Author Contributions
Funding
Conflicts of Interest
Appendix A

| Site | Drainage | Slope (%) | Layer | Bottom | pH | Cation Exchange (cmol/kg) | Nitrogen (%) |
|---|---|---|---|---|---|---|---|
| well | 3 | Layer1 | 14 | 5.5 | 4 | 1.16 | |
| Layer2 | 20 | 5.8 | 3.6 | 0.56 | |||
| Layer3 | 66 | 7 | 6.1 | 0.38 | |||
| Layer4 | 100 | 6.7 | 6.6 | 0.02 | |||
| LS | well | 3 | Layer1 | 14 | 5.5 | 4 | 1.16 |
| Layer2 | 20 | 5.8 | 3.6 | 0.56 | |||
| Layer3 | 66 | 7 | 6.1 | 0.38 | |||
| Layer4 | 100 | 6.7 | 6.6 | 0.02 | |||
| LQ | well | 3 | Layer1 | 17 | 5 | 3.9 | 0.11 |
| Layer2 | 23 | 5.6 | 5.8 | 0.03 | |||
| Layer3 | 100 | 5.5 | 5.8 | 0.06 | |||
| LY | well | 3 | Layer1 | 44 | 5.6 | 7.8 | 0.05 |
| Layer2 | 100 | 6.5 | 8.8 | 0.01 | |||
| NH | well | 8 | Layer1 | 12 | 5.8 | 5.5 | 0.14 |
| Layer2 | 19 | 5.8 | 4.3 | 0.1 | |||
| Layer3 | 100 | 6.1 | 3.3 | 0.07 | |||
| PY | well | 12 | Layer1 | 36 | 6.8 | 8.4 | 0.04 |
| Layer2 | 41 | 5.7 | 8.8 | 0.12 | |||
| Layer3 | 100 | 5.5 | 8.5 | 0.23 | |||
| SX | well | 12 | Layer1 | 12 | 6.5 | 12.3 | 0.23 |
| Layer2 | 19 | 6.5 | 13.4 | 0.27 | |||
| Layer3 | 100 | 6.9 | 11.9 | 0.11 | |||
| TZ | well | 3 | Layer1 | 13 | 6 | 8.8 | 0.26 |
| Layer2 | 20 | 6.7 | 8.9 | 0.23 | |||
| Layer3 | 34 | 7.5 | 5.6 | 0.18 | |||
| Layer4 | 100 | 8 | 3.4 | 0.11 |
Appendix B
| Solar Radiation | JH | LQ | LS | LY | NH | PY | SX | TZ |
|---|---|---|---|---|---|---|---|---|
| Jan | 11.2 | 11.2 | 11.2 | 11.3 | 11.2 | 11.2 | 11.2 | 11.1 |
| Feb | 12.1 | 11.7 | 11.7 | 12.1 | 12.7 | 11.6 | 12.5 | 12.2 |
| Mar | 11.7 | 11.4 | 11.5 | 11.7 | 12.6 | 12 | 12.4 | 12.3 |
| April | 13.3 | 12.6 | 12.7 | 13.3 | 14.3 | 12.9 | 14.4 | 13.5 |
| May | 13.9 | 13 | 13.1 | 13.9 | 15.1 | 13.2 | 15.3 | 14.1 |
| June | 13.1 | 12.6 | 12.6 | 13.1 | 14.1 | 13.2 | 14.1 | 13.4 |
| July | 17.5 | 17.5 | 17.6 | 17.3 | 19 | 18.6 | 17.6 | 18.5 |
| Aug | 14.2 | 14.2 | 14.2 | 14.3 | 15.6 | 15 | 14.6 | 15.4 |
| Sep | 13.5 | 13.9 | 13.8 | 13.8 | 14.1 | 14.4 | 13.6 | 14.2 |
| Oct | 14.2 | 14.7 | 14.6 | 14.3 | 14.2 | 14.7 | 13.7 | 14.4 |
| Nov | 11.2 | 11.9 | 11.9 | 11.2 | 11.2 | 12.3 | 10.5 | 11.7 |
| Dec | 8.9 | 9.2 | 9.2 | 8.9 | 8.8 | 9.6 | 8.6 | 9.1 |
| Maximum Air Temperatures | JH | LQ | LS | LY | NH | PY | SX | TZ |
| Jan | 10.5 | 11.5 | 12.3 | 10.7 | 9.4 | 13.2 | 9.7 | 10.9 |
| Feb | 12.2 | 12.7 | 13.4 | 12.4 | 10.7 | 13.6 | 11.5 | 11.7 |
| Mar | 16.1 | 16.4 | 17.2 | 16.2 | 14.4 | 16.9 | 15.3 | 15 |
| April | 21.9 | 21.5 | 22.4 | 22.1 | 19.6 | 21.3 | 21.4 | 19.7 |
| May | 26.9 | 25.9 | 26.9 | 27.3 | 24.3 | 25.5 | 26.6 | 24.1 |
| June | 29.3 | 28.1 | 29.1 | 29.8 | 27.2 | 28.2 | 29.4 | 27 |
| July | 35.4 | 33.4 | 34.6 | 35.6 | 32.4 | 32.6 | 35.6 | 31.5 |
| Aug | 34.3 | 32.9 | 33.9 | 34.8 | 32 | 32.8 | 34.3 | 31.8 |
| Sep | 29.7 | 29.2 | 30.1 | 30.2 | 28.1 | 29.9 | 29.6 | 28.9 |
| Oct | 24.2 | 24.3 | 25.1 | 24.7 | 23.2 | 25.5 | 24.1 | 24 |
| Nov | 18.7 | 19.2 | 20.1 | 19 | 18.1 | 21 | 18.4 | 19.2 |
| Dec | 12.7 | 13.5 | 14.5 | 12.9 | 12.2 | 16.1 | 12.1 | 13.7 |
| Minimum Air Temperatures | JH | LQ | LS | LY | NH | PY | SX | TZ |
| Jan | 1.6 | 2 | 2.8 | 2.2 | 1.9 | 6.1 | 1.7 | 4.5 |
| Feb | 3.5 | 3.9 | 4.5 | 4.1 | 3.3 | 6.9 | 3.5 | 5.6 |
| Mar | 8.1 | 8.2 | 8.9 | 8.5 | 7.3 | 10 | 7.9 | 9.1 |
| April | 13.1 | 12.8 | 13.5 | 13.6 | 11.9 | 14 | 12.9 | 13.4 |
| May | 18.5 | 17.8 | 18.7 | 19.2 | 17.4 | 19.1 | 18.4 | 18.8 |
| June | 21.9 | 20.9 | 21.9 | 22.4 | 21.3 | 22.5 | 22.1 | 22.3 |
| July | 25.6 | 23.7 | 24.8 | 26.1 | 25 | 25.1 | 26.7 | 25.4 |
| Aug | 25.9 | 24.3 | 25.3 | 26.3 | 25.2 | 25.8 | 26.6 | 26 |
| Sep | 22 | 21 | 22.1 | 22.4 | 22 | 23.5 | 22.6 | 23.4 |
| Oct | 15.6 | 15.3 | 16.2 | 16.2 | 16.1 | 18.9 | 16.2 | 18.2 |
| Nov | 9.8 | 9.9 | 10.9 | 10.4 | 10.8 | 14.2 | 10.2 | 13.4 |
| Dec | 4.2 | 4.5 | 5.4 | 4.6 | 4.7 | 9.1 | 4.4 | 7.5 |
| Daily Precipitation | JH | LQ | LS | LY | NH | PY | SX | TZ |
| Jan | 19.5 | 21.7 | 21.4 | 19.7 | 19.8 | 22 | 17.2 | 21.4 |
| Feb | 20.1 | 21.8 | 21.6 | 20.6 | 19.3 | 22.3 | 15.8 | 21 |
| Mar | 26.3 | 27.2 | 26.6 | 26.9 | 26.1 | 26.3 | 25.4 | 26.4 |
| April | 24.8 | 26.1 | 25.8 | 25.3 | 24.4 | 23.9 | 23.1 | 24.7 |
| May | 24.1 | 24.9 | 24.4 | 24.5 | 23.6 | 22.5 | 22.1 | 24 |
| June | 25 | 25.9 | 25.4 | 25.2 | 24.7 | 21.5 | 23.6 | 24.2 |
| July | 14.7 | 15 | 12.9 | 16.4 | 9.5 | 12.4 | 13.7 | 12.6 |
| Aug | 15.8 | 16.9 | 17.2 | 15 | 17.2 | 15.4 | 15 | 16.5 |
| Sep | 13.9 | 14.5 | 14.8 | 12.7 | 15.6 | 15.2 | 14.8 | 16.2 |
| Oct | 7.6 | 7.7 | 8.2 | 7.1 | 8.1 | 6.5 | 7.4 | 7.6 |
| Nov | 18.4 | 19.4 | 19.2 | 18.7 | 18.4 | 20.2 | 17.6 | 20.5 |
| Dec | 20 | 21.5 | 21.6 | 20.3 | 20.3 | 23.7 | 18.9 | 22.1 |
Appendix C
| Genetic Coefficients | Definitions |
|---|---|
| P1 | The growing degree-days in the basic vegetation phase |
| P20 | The critical photoperiod or the longest day length measured in hours, during which development occurred at a maximum rate |
| P2R | The extent of delay in panicle initiation, expressed in °C-days |
| P5 | The time period in °C-days from the beginning of grain filling to physiological with a base temperature of 9 °C in the grain filling phase |
| G1 | The potential spikelet numbers per panicle |
| G2 | The single grain weight |
| G3 | The coefficients relative to IR64 cultivars |
| G4 | The temperature tolerance coefficient |
Appendix D
| Name | Releasing Institute |
|---|---|
| HadGEM2-ES | Met Office Hadley Centre |
| IPSL-CM5A-LR | Institute Pierre-Simon Laplace |
| MIROC-ESM-CHEM | Japan Agency for Marine-Earth Science and Technology, the Atmosphere and Ocean Research Institute (the University of Tokyo), and the National Institute for Environmental Studies |
| GFDL-ESM2M | Geophysical Fluid Dynamics Laboratory |
| NorESM1-M | Norwegian Climate Centre |
References
- Solomon, S. IPCC (2007): Climate Change the Physical Science Basis. In Proceedings of the AGU Fall Meeting, San Francisco, CA, USA, 10–14 December 2007; pp. 123–124. [Google Scholar]
- Reinman, S.L. Intergovernmental Panel on Climate Change (IPCC). Encycl. Energy Nat. Resour. Environ. Econ. 2013, 26, 48–56. [Google Scholar]
- Field, C.B. Climate change 2014: Impacts, adaptation and vulnerability: Working Group II contribution to the fifth assessment report of the Intergovernmental Panel on Climate Change. Guangdong Agric. Sci. 2015, 285, 25987–25995. [Google Scholar]
- O’Neill, B.C.; Oppenheimer, M.; Warren, R.; Hallegatte, S.; Kopp, R.E.; Pörtner, H.O.; Scholes, R.; Birkmann, J.; Foden, W.; Licker, R. IPCC reasons for concern regarding climate change risks. Nat. Clim. Chang. 2017, 7, 28–37. [Google Scholar] [CrossRef]
- Giorgi, F.; Field, C.; Barros, V. IPCC Climate Change 2013: Impacts, Adaptation and Vulnerability: Key findings and lessons learned. In Proceedings of the EGU General Assembly Conference, Vienna, Austria, 27 April–2 May 2014. [Google Scholar]
- Piao, S.; Liu, Q.; Chen, A.; Janssens, I.A.; Fu, Y.; Dai, J.; Liu, L.; Lian, X.; Shen, M.; Zhu, X. Plant phenology and global climate change: Current progresses and challenges. Glob. Chang. Biol. 2019. [Google Scholar] [CrossRef]
- Vitasse, Y.; Signarbieux, C.; Fu, Y.H. Global warming leads to more uniform spring phenology across elevations. Proc. Natl. Acad. Sci. USA 2018, 115, 1004–1008. [Google Scholar] [CrossRef] [PubMed]
- Quan, S.; Li, Y.; Song, J.; Zhang, T.; Wang, M. Adaptation to Climate Change and its Impacts on Wheat Yield: Perspective of Farmers in Henan of China. Sustainability 2019, 11, 1928. [Google Scholar] [CrossRef]
- Rogelj, J.; Den Elzen, M.; Höhne, N.; Fransen, T.; Fekete, H.; Winkler, H.; Schaeffer, R.; Sha, F.; Riahi, K.; Meinshausen, M. Paris Agreement climate proposals need a boost to keep warming well below 2 C. Nature 2016, 534, 631–639. [Google Scholar] [CrossRef]
- First, P.J. Global Warming of 1.5 °C; An IPCC Special Report on the impacts of global warming of 1.5 °C above pre-industrial levels and related global greenhouse gas emission pathways, in the context of strengthening the global response to the threat of climate change, sustainable development, and efforts to eradicate poverty; IPCC: Geneva, Switzerland, 2018; 32p. [Google Scholar]
- Sheffield, J.; Wood, E.F. Projected changes in drought occurrence under future global warming from multi-model, multi-scenario, IPCC AR4 simulations. Clim. Dyn. 2008, 31, 79–105. [Google Scholar] [CrossRef]
- Parry, M.L.; Canziani, O.F.; Palutikof, J.P.; Linden, P.J.V.D.; Hanson, C.E. Summary for Policymakers. In Climate Change 2007: Impacts, Adaptation and Vulnerability; Contribution of Working Group II to the Fourth Assessment Report of the Intergovernmental Panel on Climate Change; Cambridge University Press: Cambridge, UK, 2007; Volume 37, p. 2407. [Google Scholar]
- Thornton, P.K.; Steeg, J.V.D.; Notenbaert, A.; Herrero, M. The impacts of climate change on livestock and livestock systems in developing countries: A review of what we know and what we need to know. Agric. Syst. 2009, 101, 113–127. [Google Scholar] [CrossRef]
- Countries, D. The Costs to Developing Countries of Adapting to Climate Change: New Methods and Estimates; World Bank: Washington, DC, USA, 2010. [Google Scholar]
- Qadermirza, M.M. Climate change and extreme weather events: Can developing countries adapt? Clim. Policy 2003, 3, 233–248. [Google Scholar]
- Babel, M.S.; Agarwal, A.; Swain, D.K.; Herath, S. Evaluation of climate change impacts and adaptation measures for rice cultivation in Northeast Thailand. Clim. Res. 2011, 46, 137–146. [Google Scholar] [CrossRef]
- Amiri, E.; Rezaei, M.; Rezaei, E.E.; Bannayan, M. Evaluation of Ceres-Rice, Aquacrop and Oryza 2000 Models in Simulation of Rice Yield Response to Different Irrigation and Nitrogen Management Strategies. J. Plant. Nutr. 2014, 37, 1749–1769. [Google Scholar] [CrossRef]
- Lemmer, J.A. Cleaning up Development: EIA in Two of the World’s Largest and Most Rapidly Developing Countries. Georget. Int. 2006, 19, 275. [Google Scholar]
- Andzio-Bika, H.L.W.; Wei, L.B. Agricultural productivity growth and technology progress in developing country agriculture: Case study in China. J. Zhejiang Univ. Sci. A 2005, 6, 172–176. [Google Scholar]
- Guo, Y.; Wu, W.; Bryant, C.R. Quantifying Spatio-Temporal Patterns of Rice Yield Gaps in Double-Cropping Systems: A Case Study in Pearl River Delta, China. Sustainability 2019, 11, 1394. [Google Scholar] [CrossRef]
- Zhou, Y.; Li, N.; Dong, G.; Wu, W. Impact assessment of recent climate change on rice yields in the Heilongjiang Reclamation Area of north-east China. J. Sci. Food Agric. 2013, 93, 2698–2706. [Google Scholar] [CrossRef] [PubMed]
- Xiong, W.; Holman, I.; Conway, D.; Lin, E.; Li, Y. A crop model cross calibration for use in regional climate impacts studies. Ecol. Model. 2008, 213, 365–380. [Google Scholar] [CrossRef]
- Zhang, J.; Feng, L.; Zou, H.; Liu, D.L. Using ORYZA2000 to model cold rice yield response to climate change in the Heilongjiang province, China. Crop. J. 2015, 3, 317–327. [Google Scholar] [CrossRef]
- CSY. National Bureau of Statistics of China; China Statistical Publishing House: Beijing, China, 2017.
- Singh, R.K.; Murty, H.R.; Gupta, S.K.; Dikshit, A.K. An overview of sustainability assessment methodologies. Ecol. Indic. 2009, 9, 189–212. [Google Scholar] [CrossRef]
- Jones, J.W.; Antle, J.M.; Basso, B.; Boote, K.J.; Conant, R.T.; Foster, I.; Godfray, H.C.J.; Herrero, M.; Howitt, R.E.; Janssen, S.; et al. Brief history of agricultural systems modeling. Agric. Syst. 2017, 155, 240–254. [Google Scholar] [CrossRef]
- Jones, J.W.; Antle, J.M.; Basso, B.; Boote, K.J.; Conant, R.T.; Foster, I.; Godfray, H.C.J.; Herrero, M.; Howitt, R.E.; Janssen, S.; et al. Toward a new generation of agricultural system data, models, and knowledge products: State of agricultural systems science. Agric. Syst. 2017, 155, 269–288. [Google Scholar] [CrossRef] [PubMed]
- Pezzuolo, A.; Basso, B.; Marinello, F.; Sartori, L. Using SALUS model for medium and long term simulations of energy efficiency in different tillage systems. Appl. Math. Sci. 2014, 8, 6433–6445. [Google Scholar] [CrossRef]
- Lin, E.; Xiong, W.; Ju, H.; Xu, Y.; Li, Y.; Bai, L.; Xie, L. Climate change impacts on crop yield and quality with CO2 fertilization in China. Philos. Trans. R. Soc. Lond. Ser. B Biol. Sci. 2005, 360, 2149–2154. [Google Scholar]
- Zhang, S.; Tao, F.; Zhang, Z. Uncertainty from model structure is larger than that from model parameters in simulating rice phenology in China. Eur. J. Agron. 2017, 87, 30–39. [Google Scholar] [CrossRef]
- Yao, F.; Xu, Y.; Lin, E.; Yokozawa, M.; Zhang, J. Assessing the impacts of climate change on rice yields in the main rice areas of China. Clim. Chang. 2007, 80, 395–409. [Google Scholar] [CrossRef]
- Xiong, W.; Conway, D.; Lin, E.; Holman, I. Potential impacts of climate change and climate variability on China’s rice yield and production. Clim. Res. 2009, 40, 23–35. [Google Scholar] [CrossRef]
- Yang, J.; Xiong, W.; Yang, X.; Cao, Y.; Feng, L. Geographic Variation of Rice Yield Response to Past Climate Change in China. J. Integr. Agric. 2014, 13, 1586–1598. [Google Scholar] [CrossRef]
- Skinner, M.W.; Kuhn, R.G.; Joseph, A.E. Agricultural land protection in China: A case study of local governance in Zhejiang Province. Land Use Policy 2001, 18, 329–340. [Google Scholar] [CrossRef]
- Wang, B.; Yang, X.S.; Zhang, B.; Zhang, C.Q.; Yang, Y.G.; Wei, B.; Le-Tu, G. Assessment of Ecosystem Services and Value of Coastal Wetlands in Zhejiang Province. Wetl. Sci. 2012, 10, 15–22. [Google Scholar]
- Ying, M.; Zhang, W.; Yu, H.; Lu, X.; Feng, J.; Fan, Y.; Zhu, Y.; Chen, D. An Overview of the China Meteorological Administration Tropical Cyclone Database. J. Atmos. Ocean. Technol. 2014, 31, 287–301. [Google Scholar] [CrossRef]
- Satapathy, S.S.; Swain, D.K.; Herath, S. Field experiments and simulation to evaluate rice cultivar adaptation to elevated carbon dioxide and temperature in sub-tropical India. Eur. J. Agron. 2014, 54, 21–33. [Google Scholar] [CrossRef]
- Jones, J.W.; Hoogenboom, G.; Porter, C.H.; Boote, K.J.; Batchelor, W.D.; Hunt, L.A.; Wilkens, P.W.; Singh, U.; Gijsman, A.J.; Ritchie, J.T. The DSSAT cropping system model. Eur. J. Agron. 2003, 18, 235–265. [Google Scholar] [CrossRef]
- Timsina, J.; Humphreys, E. Performance of CERES-Rice and CERES-Wheat models in rice–wheat systems: A review. Agric. Syst. 2006, 90, 5–31. [Google Scholar] [CrossRef]
- Lobell, D.B.; Ortiz-Monasterio, J.I. Regional importance of crop yield constraints: Linking simulation models and geostatistics to interpret spatial patterns. Ecol. Model. 2006, 196, 173–182. [Google Scholar] [CrossRef]
- Ahmed, M.; Akram, M.N.; Asim, M.; Aslam, M.; Hassan, F.; Higgins, S.; Stöckle, C.O.; Hoogenboom, G. Calibration and validation of APSIM-Wheat and CERES-Wheat for spring wheat under rainfed conditions: Models evaluation and application. Comput. Electron. Agric. 2016, 123, 384–401. [Google Scholar] [CrossRef]
- Yao, F.; Xu, Y.; Feng, Q.; Lin, E.; Yan, X. Simulation and validation of CERES–rice model in main rice ecological zones in China. Acta Agron. Sin. 2005, 31, 545–550. [Google Scholar]
- Lewis, S.E.; Rice, A.; Hurst, G.D.D.; Baylis, M. First detection of endosymbiotic bacteria in biting midges Culicoides pulicaris and Culicoides punctatus, important Palaearctic vectors of bluetongue virus. Med. Vet. Entomol. 2015, 28, 453–456. [Google Scholar] [CrossRef]
- Yong, X.Y.H.X.Z.; Erda, L.W.L. Statistical Analyses of Climate Change Scenarios over China in the 21st Century. Adv. Clim. Chang. Res. 2006, 2, 50–53. [Google Scholar]
- Wan, K.K.W.; Tang, H.L.; Yang, L.; Lam, J.C. An analysis of thermal and solar zone radiation models using an Angstrom–Prescott equation and artificial neural networks. Energy 2008, 33, 1115–1127. [Google Scholar] [CrossRef]
- Lewis, G. The utility of the Angstrom-type equation for the estimation of global irradiation. Sol. Energy 1989, 43, 297–299. [Google Scholar] [CrossRef]
- Esteves, M.; Román-Paoli, E.; Beaver, J.S.; Muñoz, M.A.; Armstrong, A. Genetic coefficient determination for three maize cultivars and one hybrid. J. Agric. Univ. P.R. 2012, 96, 57–75. [Google Scholar]
- Rosenzweig, C.; Elliott, J.; Deryng, D.; Ruane, A.C.; Müller, C.; Arneth, A.; Boote, K.J.; Folberth, C.; Glotter, M.; Khabarov, N. Assessing agricultural risks of climate change in the 21st century in a global gridded crop model intercomparison. Proc. Natl. Acad. Sci. USA 2014, 111, 3268–3273. [Google Scholar] [CrossRef] [PubMed]
- Van Vuuren, D.P.; Riahi, K.; Moss, R.; Edmonds, J.; Thomson, A.; Nakicenovic, N.; Kram, T.; Berkhout, F.; Swart, R.; Janetos, A.; et al. A proposal for a new scenario framework to support research and assessment in different climate research communities. Glob. Environ. Chang. 2012, 22, 21–35. [Google Scholar] [CrossRef]
- Moss, R.H.; Edmonds, J.A.; Hibbard, K.A.; Manning, M.R.; Rose, S.K.; van Vuuren, D.P.; Carter, T.R.; Emori, S.; Kainuma, M.; Kram, T.; et al. The next generation of scenarios for climate change research and assessment. Nature 2010, 463, 747–756. [Google Scholar] [CrossRef] [PubMed]
- Kadiyala, M.D.M.; Jones, J.W.; Mylavarapu, R.S.; Li, Y.C.; Reddy, M.D. Identifying irrigation and nitrogen best management practices for aerobic rice–maize cropping system for semi-arid tropics using CERES-rice and maize models. Agric. Water Manag. 2015, 149, 23–32. [Google Scholar] [CrossRef]
- He, J.; Jones, J.W.; Graham, W.D.; Dukes, M.D. Influence of likelihood function choice for estimating crop model parameters using the generalized likelihood uncertainty estimation method. Agric. Syst. 2010, 103, 256–264. [Google Scholar] [CrossRef]
- Chai, T.; Draxler, R.R. Root mean square error (RMSE) or mean absolute error (MAE)? Geosci. Model. Dev. 2014, 7, 1247–1250. [Google Scholar] [CrossRef]
- Li, Y.; Wu, W.; Ge, Q.; Zhou, Y.; Xu, C. Simulating Climate Change Impacts and Adaptive Measures for Rice Cultivation in Hunan Province, China. J. Appl. Meteorol. Climatol. 2016, 55, 1359–1376. [Google Scholar] [CrossRef]
- Birch, E.L. A Review of “Climate Change 2014: Impacts, Adaptation, and Vulnerability” and “Climate Change 2014: Mitigation of Climate Change”. J. Am. Plan. Assoc. 2014, 80, 184–185. [Google Scholar] [CrossRef]
- Morris, M.D. Factorial sampling plans for preliminary computational experiments. Technometrics 1991, 33, 161–174. [Google Scholar] [CrossRef]
- Porter, J.D. Method for Rapidly Propagating a Fast Edge of an Output Signal through a Skewed Logic Device. U.S. Patent 6972589B2, 6 December 2005. [Google Scholar]
- Ewert, F.; Rötter, R.; Brüser, K. CropM: Understanding and Modelling Impacts of Climate Change on Crop Production. FACCE MACSUR Rep. 2015, 6, 6-2. [Google Scholar]
- Kapetanaki, G.; Rosenzweig, C. Impact of climate change on maize yield in central and northern Greece: A simulation study with CERES-Maize. Mitig. Adapt. Strateg. Glob. Chang. 1997, 1, 251–271. [Google Scholar] [CrossRef]
- Lashkari, A.; Alizadeh, A.; Rezaei, E.E.; Bannayan, M. Mitigation of climate change impacts on maize productivity in northeast of Iran: A simulation study. Mitig. Adapt. Strateg. Glob. Chang. 2012, 17, 1–16. [Google Scholar] [CrossRef]
- Jamieson, P.D.; Porter, J.R.; Wilson, D.R. A test of computer simulation model ARC-WHEAT1 on wheat crops grown in New Zealand. Field Crop Res. Field Crop. Res. 1991, 27, 337–350. [Google Scholar] [CrossRef]
- Buan, R.D.; Maglinao, A.R.; Evangelista, P.P.; Pajuelas, B.G. Vulnerability of rice and corn to climate change in the Philippines. Water Air Soil Pollut. 1996, 92, 41–51. [Google Scholar]
- Zhang, S.; Tao, F. Modeling the response of rice phenology to climate change and variability in different climatic zones: Comparisons of five models. Eur. J. Agron. 2013, 45, 165–176. [Google Scholar] [CrossRef]
- Osborne, T.; Rose, G.; Wheeler, T. Variation in the global-scale impacts of climate change on crop productivity due to climate model uncertainty and adaptation. Agric. For. Meteorol. 2013, 170, 183–194. [Google Scholar] [CrossRef]
- Baker, J.T.; Boote, K.J.; Allen, L.H. Potential Climate Change Effects on Rice: Carbon Dioxide and Temperature. Clim. Chang. Agric. Anal. Potential Int. Impacts 1995. [Google Scholar] [CrossRef]
- Snyder, A.M. Effects of Elevated Carbon Dioxide and Temperature on two Cultivars of Rice. Master’s Thesis, University of Florida, Gainesville, FL, USA, 2000. [Google Scholar]
- Xu, C.C.; Wu, W.X.; Ge, Q.S.; Zhou, Y.; Lin, Y.M.; Li, Y.M. Simulating climate change impacts and potential adaptations on rice yields in the Sichuan Basin, China. Mitig. Adapt. Strateg. Glob. Chang. 2015, 22, 565–594. [Google Scholar] [CrossRef]
- Li, S.; Wang, Q.; Chun, J.A. Impact assessment of climate change on rice productivity in the Indochinese Peninsula using a regional-scale crop model. Int. J. Climatol. 2017, 37, 1147–1160. [Google Scholar] [CrossRef]
- Krishnan, P.; Swain, D.K.; Chandra Bhaskar, B.; Nayak, S.K.; Dash, R.N. Impact of elevated CO2 and temperature on rice yield and methods of adaptation as evaluated by crop simulation studies. Agric. Ecosyst. Environ. 2007, 122, 233–242. [Google Scholar] [CrossRef]
- Droogers, P.; Dam, J.V.; Hoogeveen, J.; Loeve, R.; Aerts, J.C.J.H.; Droogers, P. Adaptation strategies to climate change to sustain food security. In Climate Change Contrasting River Basins; CABI: Oxfordshire, UK, 2004; pp. 49–73. [Google Scholar]
- Aggarwal, P.K.; Mall, R. Climate change and rice yields in diverse agro-environments of India. II. Effect of uncertainties in scenarios and crop models on impact assessment. Clim. Chang. 2002, 52, 331–343. [Google Scholar] [CrossRef]


| CAES | Latitude | Longitude | Altitude | Cultivar | Cropping System | Selected Years |
|---|---|---|---|---|---|---|
| Jinhua | 29.07 | 119.39 | 63 | Jinzao47 | Early-maturation | 2001 2004 2006 |
| Lishui | 28.27 | 119.55 | 61 | Jinzao48 | Early-maturation | 2004 2005 2009 |
| Longquan | 28.05 | 119.08 | 198 | Weiyou42 | Early-maturation | 1999 2000 2005 |
| Longyou | 29.02 | 119.11 | 66 | Zhongzu1 | Early-maturation | 2000 2001 2003 |
| Ninghai | 29.19 | 121.26 | 39 | Jiayu293 | Early-maturation | 2000 2001 2002 |
| Pingyang | 27.41 | 120.34 | 5 | Zhongsi2 | Early-maturation | 2002 2003 2004 |
| Shaoxing | 30.00 | 120.38 | 7 | Jiayu296 | Early-maturation | 2003 2004 2005 |
| Taizhou | 28.40 | 121.26 | 1 | Jiazao95 | Early-maturation | 1999 2000 2001 |
| Lishuilate | 28.27 | 119.55 | 61 | Fu000092 | Late-maturation | 2000 2001 2002 |
| Taizhoulate | 28.40 | 121.26 | 1 | Xieyou94 | Late-maturation | 2000 2003 2007 |
| Longyoulate | 29.02 | 119.11 | 66 | Xieyou46 | Late-maturation | 2000 2001 2002 |
| Site | Code | Cultivar | Seasonal | P1 | P2R | P5 | P2O | G1 | G2 | G3 | G4 |
|---|---|---|---|---|---|---|---|---|---|---|---|
| Jinhua | JH | Jinzao47 | Early-mature | 226 | 49 | 596 | 11.7 | 269 | 0.028 | 0.77 | 1 |
| Lishui | LS | Jinzao48 | Early-mature | 230 | 65 | 596 | 11.7 | 320 | 0.028 | 1 | 1 |
| Longquan | LQ | Weiyou42 | Early-mature | 125 | 160 | 400 | 11.7 | 65 | 0.0275 | 1 | 1 |
| Longyou | LY | Zhongzu1 | Early-mature | 145 | 130 | 400 | 11.7 | 265 | 0.0295 | 1 | 1 |
| Shaoxing | SX | Jiayu296 | Early-mature | 106 | 68 | 696 | 11.7 | 285 | 0.028 | 0.6 | 1 |
| Ninghai | NH | Jiayu293 | Early-mature | 146 | 38 | 596 | 11.7 | 269 | 0.028 | 0.77 | 1 |
| Pingyang | PY | Zhongsi2 | Early-mature | 146 | 38 | 596 | 11.7 | 269 | 0.028 | 0.77 | 1 |
| Taizhou | TZ | Jiazao95 | Early-mature | 126 | 48 | 596 | 11.7 | 269 | 0.028 | 1 | 1 |
| Lishui | LSL | Fu000092 | Late-mature | 220 | 63 | 596 | 11.7 | 320 | 0.028 | 1 | 1 |
| Longyou | LYL | Xieyou46 | Late-mature | 145 | 130 | 400 | 11.7 | 265 | 0.0295 | 1 | 1 |
| Taizhou | TZL | Xieyou94 | Late-mature | 116 | 48 | 496 | 11.7 | 269 | 0.028 | 1 | 1 |
| Period | CO2 | |||||||
|---|---|---|---|---|---|---|---|---|
| RCP4.5 | RCP8.5 | RCP4.5 | RCP8.5 | RCP4.5 | RCP8.5 | RCP4.5 | RCP8.5 | |
| 2020s | 0.18 | 0.20 | 1.01 | 1.07 | 2.61 | 2.54 | 411.13 | 415.78 |
| 2050s | 1.18 | 1.62 | 2.33 | 3.14 | 2.13 | 2.00 | 486.54 | 540.54 |
| 2080s | 1.28 | 1.87 | 3.03 | 5.34 | 2.50 | 1.67 | 531.14 | 844.81 |
| Site | With CO2 Fertilization Effects (%) | Without CO2 Fertilization Effects (%) |
|---|---|---|
| JH | −3.99 | −34.83 |
| LS | −2.96 | −31.97 |
| LQ | −6.52 | −31.34 |
| LY | −1.75 | −9.10 |
| SX | −20.64 | −34.31 |
| NH | −13.35 | −17.17 |
| PY | −24.10 | −33.45 |
| TZ | −19.92 | −45.37 |
| LS | −0.465 | −36.86 |
| LYL | −17.94 | −46.58 |
| TZL | −10.61 | −15.74 |
| Variable | Month | PY | SX | LYL | ||||||
|---|---|---|---|---|---|---|---|---|---|---|
| 2020s | 2050s | 2080s | 2020s | 2050s | 2080s | 2020s | 2050s | 2080s | ||
| Radiation | March | 12.9 | 13.6 | 13.7 | 14.2 | 14.5 | 14.7 | 13.4 | 13.8 | 13.9 |
| April | 13.1 | 13.5 | 14.2 | 14.8 | 15.5 | 15.8 | 13.7 | 14.4 | 14.8 | |
| May | 12.4 | 12.7 | 12.9 | 13.9 | 14.3 | 14.9 | 12.8 | 13.1 | 13.6 | |
| June | 15.7 | 15.7 | 15.9 | 14.7 | 14.8 | 14.9 | 14.4 | 14.6 | 14.7 | |
| Temperature | March | 16.7 | 15.5 | 16.4 | 18.6 | 17.2 | 18.2 | 19.8 | 18.4 | 19.3 |
| April | 21.5 | 21.4 | 22.3 | 23.3 | 23.7 | 24.4 | 25 | 25.9 | 26.8 | |
| May | 25.6 | 26.7 | 27.4 | 27.4 | 28.7 | 29.2 | 29.1 | 31 | 31.5 | |
| June | 28.7 | 29.8 | 30.3 | 30.3 | 32.2 | 32.3 | 32.1 | 34.6 | 34.8 | |
| Precipitation | March | 25.5 | 24.1 | 26.3 | 24.9 | 24.8 | 26.7 | 25.3 | 24.5 | 26 |
| April | 24.2 | 23.6 | 25.5 | 23.7 | 23 | 25.3 | 22 | 21.9 | 24.6 | |
| May | 22 | 22.5 | 25.1 | 22.5 | 20.8 | 23.7 | 21.4 | 20.6 | 23.9 | |
| June | 21.3 | 24.6 | 26.2 | 22.7 | 23.1 | 25 | 22 | 22.7 | 24.2 | |
| Site | P1 | P2R | P5 | P20 | G1 | G2 | G3 | G4 |
|---|---|---|---|---|---|---|---|---|
| SX | 900 | 68 | 696 | 11.7 | 170 | 0.028 | 0.60 | 1.00 |
| PY | 546 | 38 | 596 | 11.7 | 200 | 0.028 | 0.77 | 1.00 |
© 2019 by the authors. Licensee MDPI, Basel, Switzerland. This article is an open access article distributed under the terms and conditions of the Creative Commons Attribution (CC BY) license (http://creativecommons.org/licenses/by/4.0/).
Share and Cite
Guo, Y.; Wu, W.; Du, M.; Bryant, C.R.; Li, Y.; Wang, Y.; Huang, H. Assessing Potential Climate Change Impacts and Adaptive Measures on Rice Yields: The Case of Zhejiang Province in China. Sustainability 2019, 11, 2372. https://doi.org/10.3390/su11082372
Guo Y, Wu W, Du M, Bryant CR, Li Y, Wang Y, Huang H. Assessing Potential Climate Change Impacts and Adaptive Measures on Rice Yields: The Case of Zhejiang Province in China. Sustainability. 2019; 11(8):2372. https://doi.org/10.3390/su11082372
Chicago/Turabian StyleGuo, Yahui, Wenxiang Wu, Mingzhu Du, Christopher Robin Bryant, Yong Li, Yuyi Wang, and Han Huang. 2019. "Assessing Potential Climate Change Impacts and Adaptive Measures on Rice Yields: The Case of Zhejiang Province in China" Sustainability 11, no. 8: 2372. https://doi.org/10.3390/su11082372
APA StyleGuo, Y., Wu, W., Du, M., Bryant, C. R., Li, Y., Wang, Y., & Huang, H. (2019). Assessing Potential Climate Change Impacts and Adaptive Measures on Rice Yields: The Case of Zhejiang Province in China. Sustainability, 11(8), 2372. https://doi.org/10.3390/su11082372