Article

Assessing Potential Climate Change Impacts and Adaptive Measures on Rice Yields: The Case of Zhejiang Province in China

1
Academician workstation of Zhai Mingguo, University of Sanya, Sanya 572000, China
2
CAS Center for Excellence in Tibetan Plateau Earth Sciences, Chinese Academy of Sciences (CAS), Beijing 100101, China
3
Agricultural Information Institute, Chinese Academy of Agricultural Sciences, Beijing 100081, China
4
School of Environmental Design and Rural Development, University of Guelph, Guelph, ON N1G2W5, Canada
5
Géographie, Université de Montréal, Montréal, QC H2V2B8, Canada
6
Sinopec Research Institute of Petroleum Engineering, Beijing 100101, China
7
School of Land Science and Technology, China University of Geosciences, Beijing 100083, China
*
Author to whom correspondence should be addressed.
Sustainability 2019, 11(8), 2372; https://doi.org/10.3390/su11082372
Submission received: 28 March 2019 / Revised: 15 April 2019 / Accepted: 17 April 2019 / Published: 20 April 2019
(This article belongs to the Special Issue Implications of Climate Change for Ecosystems and Society)

Abstract

:
Increasing temperatures, greater carbon dioxide concentrations, and changes in related climatic variables will continue to affect the growth and yields of agricultural crops. Rice (Oryza sativa L.) is extremely vulnerable to these climatic changes. Therefore, investigating the degree to which climate changes could influence rice yields and what effective adaptive strategies could be taken to mitigate the potential adverse impacts is of vital importance. In this article, the impacts of climate change on rice yields in Zhejiang province, China, were simulated under the Representative Concentration Pathway (RCP) 4.5 and 8.5 scenarios. The impacts of climate change, with and without CO2 fertilization effects, were evaluated and the three most effective adaptive measures were examined. Compared with the yield for the baseline time of 1981–2010, the simulated average yields of all cultivars were inevitably projected to decrease under both RCPs when the CO2 fertilization effects were not considered during the three periods of the 2020s (2011–2040), 2050s (2041–2070), and 2080s (2071–2099), respectively. Declines in rice yields were able to be alleviated when the CO2 fertilization effects were accounted for, but the yields were still lower than those of the baseline. Therefore, the three adaptive measures of advancing planting dates, switching to high-temperature-tolerant cultivars, and breeding new cultivars were simulated. The results indicated that adaptive measures could effectively mitigate the adverse effects of climate change. Although the simulation had uncertainties and limitations, the results provide useful insights into the potential impacts of climate change in Zhejiang province while also proposing adaptive measures.

1. Introduction

Climate change variables associated with atmospheric temperature, precipitation, solar radiation, and carbon dioxide are the main factors most likely to have an impact on crop variability and productivity [1,2,3,4,5]. These climatic changes are intensifying and will profoundly affect agricultural growth and development, simultaneously resulting in regional or even global food crises [6,7,8]. The recent Intergovernmental Panel on Climate Change (IPCC) special report showed that the global temperature related to human activities has increased by approximately 1.0 °C compared with preindustrial levels, and it is likely to increase to about 1.5 °C between the years 2030 and 2050 [9,10,11]. In tropical and subtropical areas, especially in developing countries, the impacts of climate change on agricultural production will be more apparent because of the tropical climate and the lack of advanced agricultural technical input [12,13,14,15]. Rice is a staple food that feeds more than half of the global population and it is sensitive to even small changes in climate, which may cause a significant reduction in yield [16,17]. Therefore, investigating the potential impacts of climate change on rice production and developing effective adaptive measures in subtropical areas, especially in developing countries, should be a high priority.
China is the world’s largest developing country and it has a long history of rice cultivation. Rice production in China accounts for almost 30% of global rice production [18,19]. Therefore, researchers in institutions and at all levels of government in China are closely observing, collecting, and documenting data on the country’s crop growth and development [20,21]. These high-quality data are collected and recorded by following standardized observation criteria established by agricultural technicians [22,23].
Zhejiang province, China, has a total rice cultivation area of 8.242 × 10⁵ km2, accounting for 27.12% of all the rice cultivated in agricultural areas of China [24], thus, the rice yield in this region is critical. Furthermore, the entire area lies in a subtropical monsoon climate zone, and research evidence has shown that the advent of rising temperatures and extreme weather events will be more likely to occur here. There is an urgent need to investigate the degree to which these factors will have an impact on rice yields and to identify potential adaptive strategies to minimize their adverse effects.
So far, various methods have been adopted to investigate the underlying mechanism by which climate change affects agricultural yields. Model-based research is preferred because simulation experiments can be performed hundreds or even thousands of times in an effort to select the optimal strategies for guiding field management. The Crop Estimation through Resource and Environment Synthesis (CERES)-Rice model is a process-based real system, designed as a natural surrogate laboratory to simulate crop growth associated with factors such as weather changes, soil properties, and management practices. The model is continuously being refined and modified for simulation to ensure that credible and convincing results are obtained [25,26]. The simulation results obtained with these models are the most effective methods of evaluating the potential impacts of climate change on rice [27]. The effect of tillage systems has not been considered because no data are available that record real management operations after the harvest of early-mature rice [28].
Several researchers have applied various models to assess the potential impacts of climate change on rice yields in China. Erda et al. [29] simulated the potential climate change impacts on agricultural yields and yield quality with CO2 fertilization under regional climate change model scenarios, using Providing Regional Climates for Impacts Studies (PRECIS) at the national scale in the CERES-Rice model, version 3.0. Zhang et al. [30] used the CERES-Rice, ORYZA2000, Regional Climate Model (RCM), Beta Model (BM), and Simulation Model For Rice-weather Relations (SIMRIW) to model climate change impacts on rice phenology in northeastern and southwestern China. Their results showed that the CERES-Rice and ORYZA2000 models performed well. Yao et al. [31] simulated the impacts of climate change on rice yields, including consideration of the CO2 fertilization effects, by using data from eight representative sites in the CERES-Rice model, however, the authors proposed that no related adaptive measures were adopted for raising future rice production. Xiong et al. [32] used the decision support system for agrotechnology transfer (DSSAT), version 4.0, to assess the impacts of climate variability on rice yields, including a consideration of spatial and temporal characteristics, then predicting the possible yield increment in the principal yield regions in China at a grid resolution of 50 × 50 km. Yang et al. [33] simulated the rice yields in China with the CERES-Rice model and found that a 1 °C warmer temperature during the growing season would reduce the rice yield by roughly 4 percentage points. Their innovative findings may provide an understanding of the process and mechanisms of the impacts of climate change. However, previous studies on the impacts of climate change on rice yields have been conducted either with climate scenarios generated from a single general circulation model (GCM) or with a limited number of representative sites on a scaled-up national 0.5 °C × 0.5 °C grid level. Some studies have even assessed the global climate change impacts on agricultural production by using only specific varieties of crops, which represents a misunderstanding of the basic cropping system. Some have assessed only the impacts of climate change without considering the dynamic change in CO2 concentration. In addition, previous studies have focused mainly on impacts, and very few have analyzed the adaptive strategies needed to deal with the potential negative effects.
In this study, the potential climate change impacts on rice yields, both with and without CO2 fertilization effects, during three periods, the 2020s (2011–2040), 2050s (2041–2070), and 2080s (2071–2099), were evaluated based on highly resolved management data within the CERES-Rice model, version 4.7, in Zhejiang province, China. Adaptive measures to reverse the negative climate effects and cope with the challenge of climate change were also simulated. In addition, the uncertainties caused by climatic models were quantified by using climate models. The objectives of the study were as follows: (1) Assess the potential climate change impacts on rice yields, with and without the effects of atmospheric CO2 fertilization; (2) to assess the uncertain impacts of climate change on rice yields by using five GCM models; and (3) to simulate adaptive measures, such as adjusting planting dates, switching to high-temperature-tolerant cultivars, and breeding new cultivars.

2. Materials and Methods

2.1. Study Area and Observation Sites

Zhejiang province (27°12′–31°31′N, 118°01′–123°10′E) belongs to the Yangtze River Basin (Figure 1) in China. It lies on the southeast coast of China and is known as “the land of fish and rice,” which means rice is the grain base in China [34,35]. About 57 million people inhabit in this region, and the main income here is mainly from agricultural production and booming industries. The entire area is a typical subtropical zone, thus, both the temperature and precipitation here are quite suitable for a double-cropping system, which means a rice cultivar can be divided into early-mature and late-mature. The growth period of early-mature rice is mainly from March to June and the period for late-mature rice is mainly from July to October, after the harvest of early-mature rice. Favorable soil conditions, abundant precipitation, and a scientific cropping system all make Zhejiang a suitable natural location for rice cultivation. Zhejiang is one of the main rice production areas in the world, so the effects of climate change are more obvious here than elsewhere. The rice produced here is more vulnerable to these changes than in other areas, thus, the importance of assessing the impacts of climate change on rice yields in this region cannot be understated.
Experimental records such as rice management practices, weather conditions, fertilization data, rice phenology, rice cultivars, and rice yields were used in this research. These data were observed and collected by well-trained agricultural technicians based on a standardized prescribed method [36]. Not all the Chinese agrometeorological experimental stations (CAES) produced data suitable for the modeling simulations, thus, the CAES were chosen according to a strict set of procedures: (1) All the operations of the rice in the CAES were recorded from the years 1980–2010; (2) the selected CAES were good harvest sites and the typical yield exceeded 4000 kg/ha, in other words, the sites presented no obvious negative effects from pests and natural disasters; and (3) the same rice cultivars were planted for at least 3 years to ensure the stabilization of the model calibration and model validation. Generally, one year was chosen for model calibration and another two years were chosen for model validation [37]. The selected CAES are shown in Figure 1 and detailed information on each site, with the corresponding cultivar, is given in Table 1.

2.2. The CERES-Rice Model

The CERES-Rice model, which has been integrated into the DSSAT, has been in use for several decades. It has constantly been redesigned to facilitate new scientific advances and applications [38,39]. The DSSAT design and approaches are used for various applications, and the model has been used in hundreds of published studies [17,40]. The model is a successful crop model that has been widely used by researchers worldwide, and it is claimed to be one of the few simulation models that can simulate crop sequences, such as crop growth, development, and yield, in relation to varying levels of weather and genetics [41]. The model is used for research across Asia, such as in the Philippines, Indonesia, and Thailand, as well as in areas of temperate climate, such as Japan, India, and Australia. Hence, the CERES-Rice model was expected to behave perfectly to fulfill the simulation and test the mitigation strategies [42]. The CERES-Rice model performs professionally when applied to decisions on uncertain issues caused by variables in rice growth simulations. Thus, the latest CERES-Rice model, version 4.7, was adopted.
In the simulation model, crop growth could be divided into three parts according to the growing degree days (GDD):
GDD = { T T base   for   T base < T < T opt T high T   for   T opt < T < T high 0 for   T < T base   or   T > T high
In the equation, T base , T high , and T opt represent the baseline, extremely high, and optimal temperatures during the rice growth period, respectively [43]. When the temperature was between the basal temperature and the optimal temperature, the rice would grow very well and reach the highest yield. However, when the temperature was between an extreme high or low, the rice could hardly survive the environment and the result would be an obvious reduction in rice yield.

2.3. Dataset for the DSSAT

The DSSAT model requires standard input data, such as soil data, weather data, cultivar genetic coefficients, and agricultural experimental data. These are the basic input data required to guarantee rigorous calibration, validation, and evaluation of the model. Detailed information on each input data type is described in the following subsections.

2.3.1. Soil Data

The basic information on soil data included the soil color, average slope, potential runoff, and a fertility factor. In addition, the organic carbon, pH, cation exchange capacity, and total nitrogen of each layer were included. Detailed information on the soil was obtained from the China Soil Scientific Database (http://vdb3.soil.csdb.cn/). The organic matter in the soil and drainage conditions are crucial to rice growth. Detailed information for each site is provided in Appendix A.

2.3.2. Historical Weather Data

The historical weather dataset from experimental stations in this study was from the China Meteorological Data Sharing Service System (http://data.cma.cn/). The dataset includes highly resolved data, such as the daily solar radiation, daily maximum and minimum air temperatures, and daily precipitation from 8:00 am to 8:00 pm [44]. The high quality of these historical weather data guaranteed reliable model calibration, validation, and evaluation.
The original weather data were converted to a standard daily solar radiation format based on the specific latitude and daily hours of sunlight at each site. Because solar radiation data were not available, the daily global solar radiation was calculated from the hours of sunlight by using the Ångström equation [45,46]:
R s = ( a + b n N ) R a .
In the equation, R s represents the solar radiation (MJ/m2/d), n and N are the actual duration and the maximum duration of sunshine, respectively. R a is the extraterrestrial radiation (MJ/m2/d). Detailed information on the weather data is shown in Appendix B.

2.3.3. Cultivar Genetic Coefficients

Cultivar genetic coefficients are parameters that control the natural development of crops. For a given rice cultivar, the coefficients mainly control the growth stage of crops, such as the duration of flowering, the duration of maturation, and the yield [47]. Generally speaking, rice cultivar coefficients represents the nature of the genetic type, and each coefficient controls some aspects within the rice growing periods. Eight genetic coefficients for rice are defined in the CERES-Rice model, and the detailed information is given as Appendix C.

2.3.4. Climate Change Scenarios

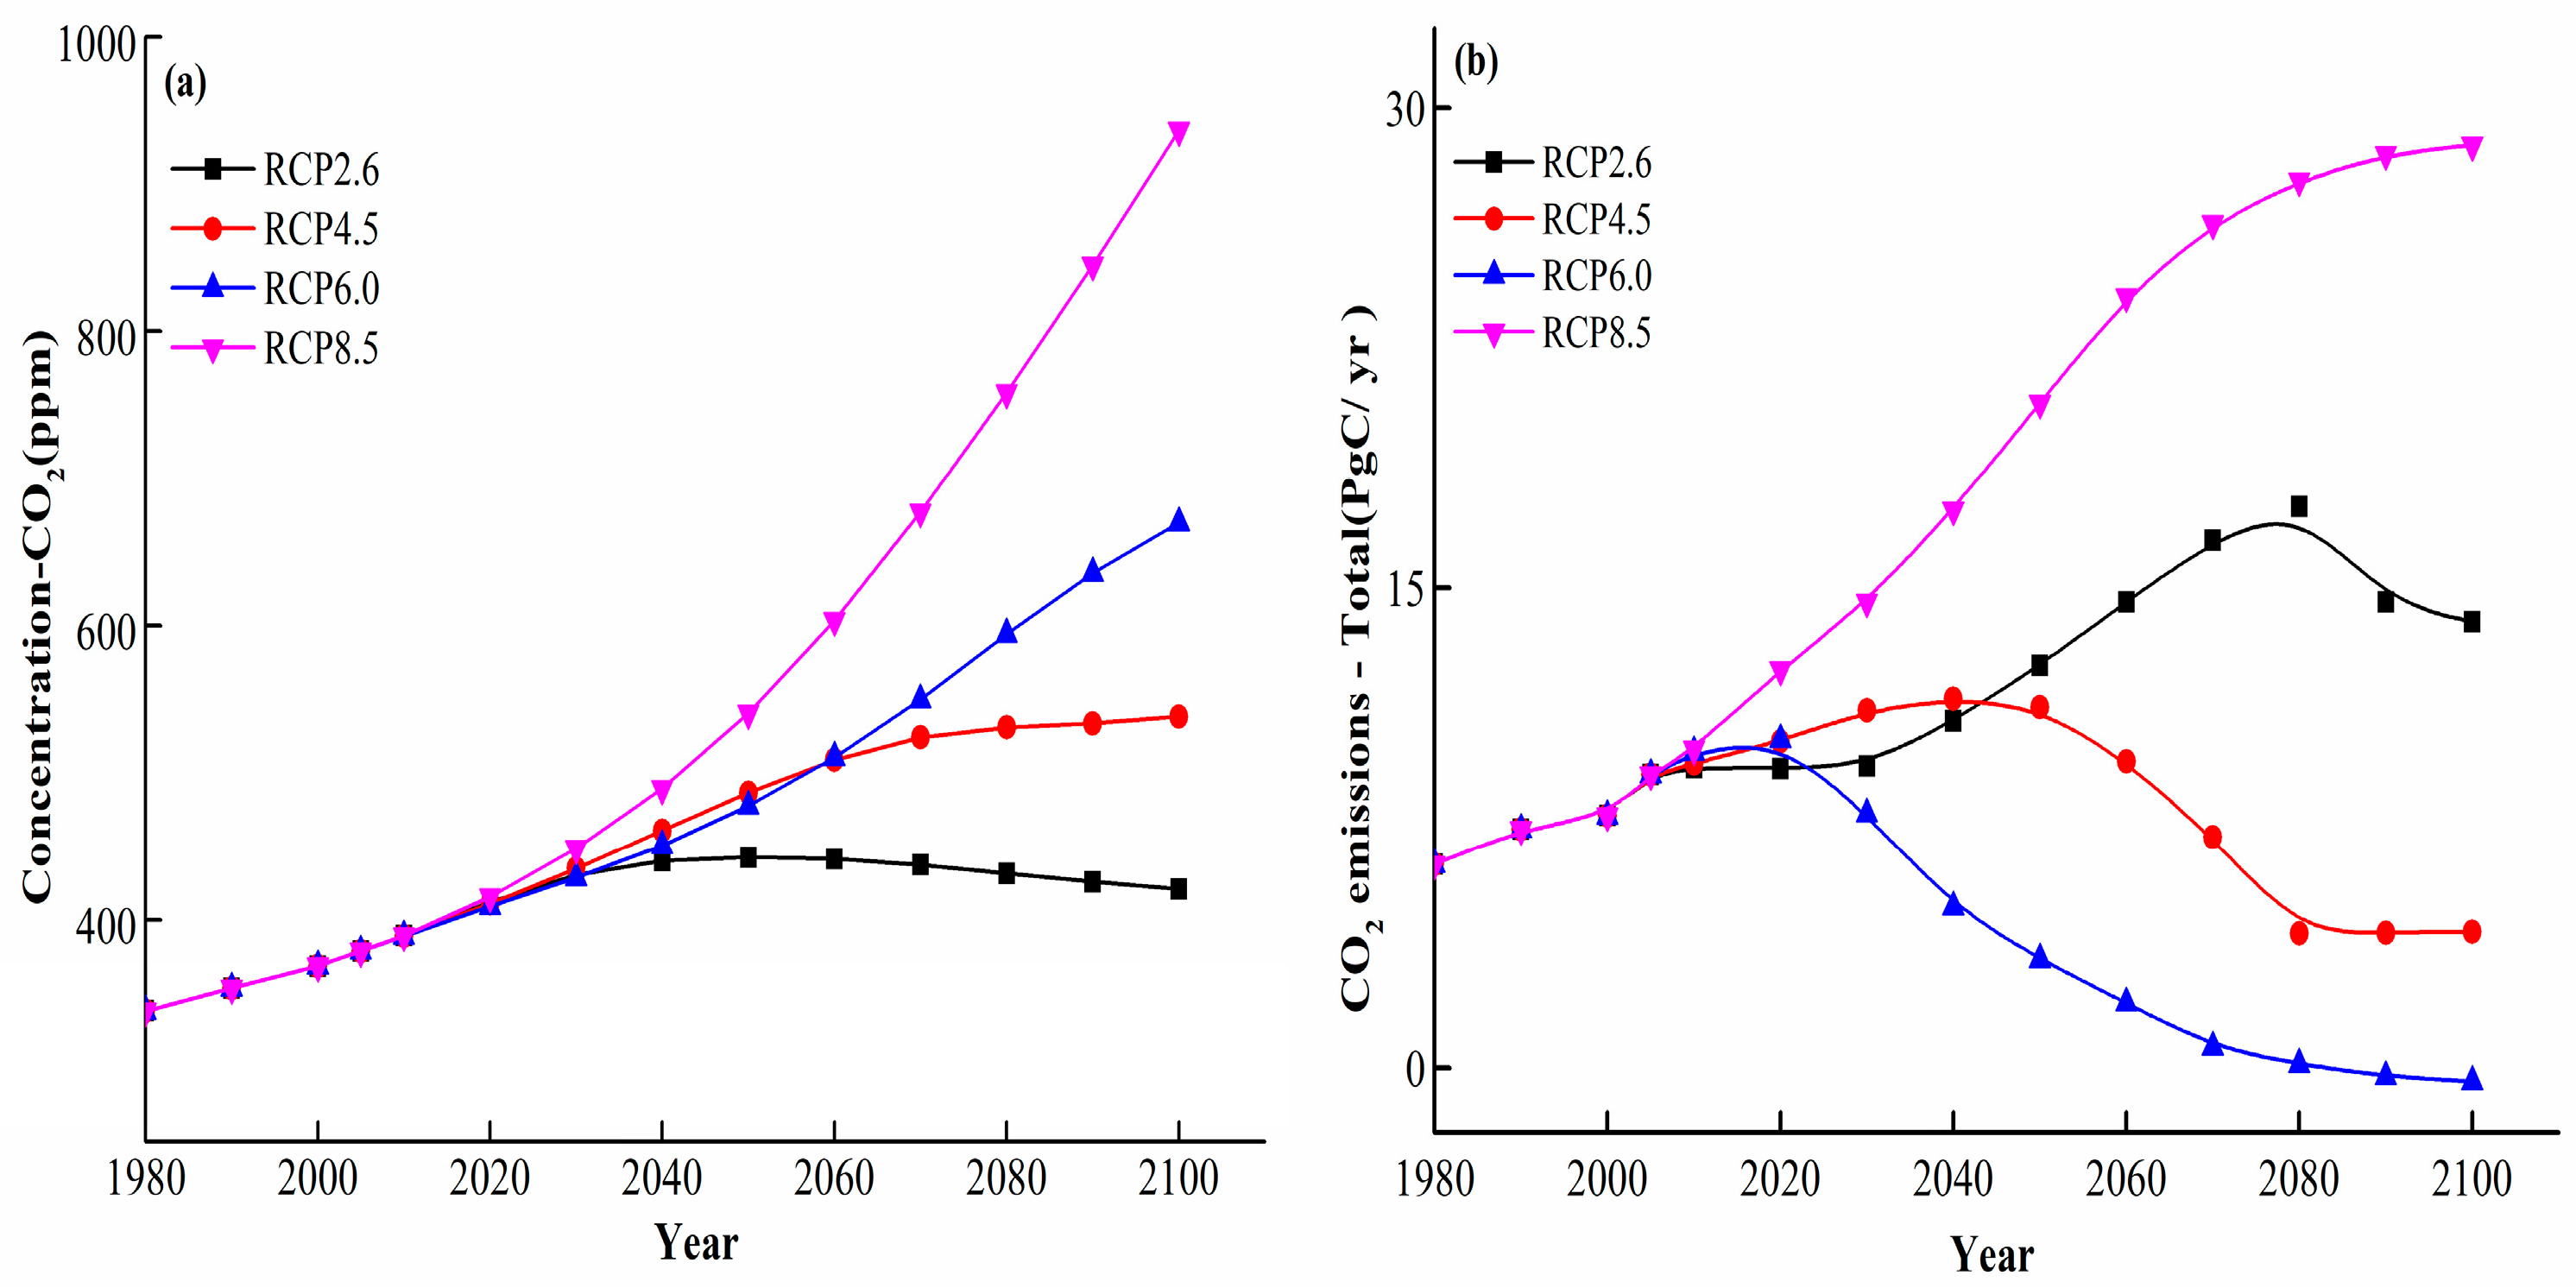
Climate scenarios consisting of temperature, precipitation, and other climatic indicators are used to summarize the Representative Concentration Pathways (RCPs) for modeling in the next stages of climatic-based research [48,49]. The climate scenarios used a fresh, new, coordinated parallel process, and the radiative forcing levels (W/m2) by the end of the 21st century were selected to name the RCPs [50]. Therefore, RCP2.6, RCP4.5, RCP6.0, and RCP8.5 were each named and used to assess potential climate change impacts. The global carbon dioxide (CO2) concentration and emission for each RCP from the years 1980 to 2100, respectively, are shown in Figure 2. Conclusions from previous studies and the present research illustrated that changes in CO2, temperature, precipitation, and solar radiation in RCP2.6 and RCP6.0 might not be suitable for the simulations, whereas scenarios RCP4.5 and RCP8.5 could cover both medium and extreme scenarios. Therefore, the well-reasoned RCP4.5 and RCP8.5 were selected to conduct potential climate change impact simulations because they covered both medium and extreme scenarios.
In this study, five GCMs named HadGEM2-ES, GFDL-ESM2M, IPSL-CM5A-LR, MIROC-ESM-CHEM, and NorESM1-M were used to generate future climate data (2011–2099) at the eight selected sites under scenarios RCP4.5 and RCP8.5. A detailed description of the selected GCMs is shown in Appendix D. In addition, the historical weather named as baseline weather data from the time scale (1980–2010) under RCP4.5 and RCP8.5 was extracted from the five GCMs to compare with weather from the future climate to prove the accuracy and stability of the model.

2.4. Calibration, Validation, and Evaluation of the CERES-Rice Model

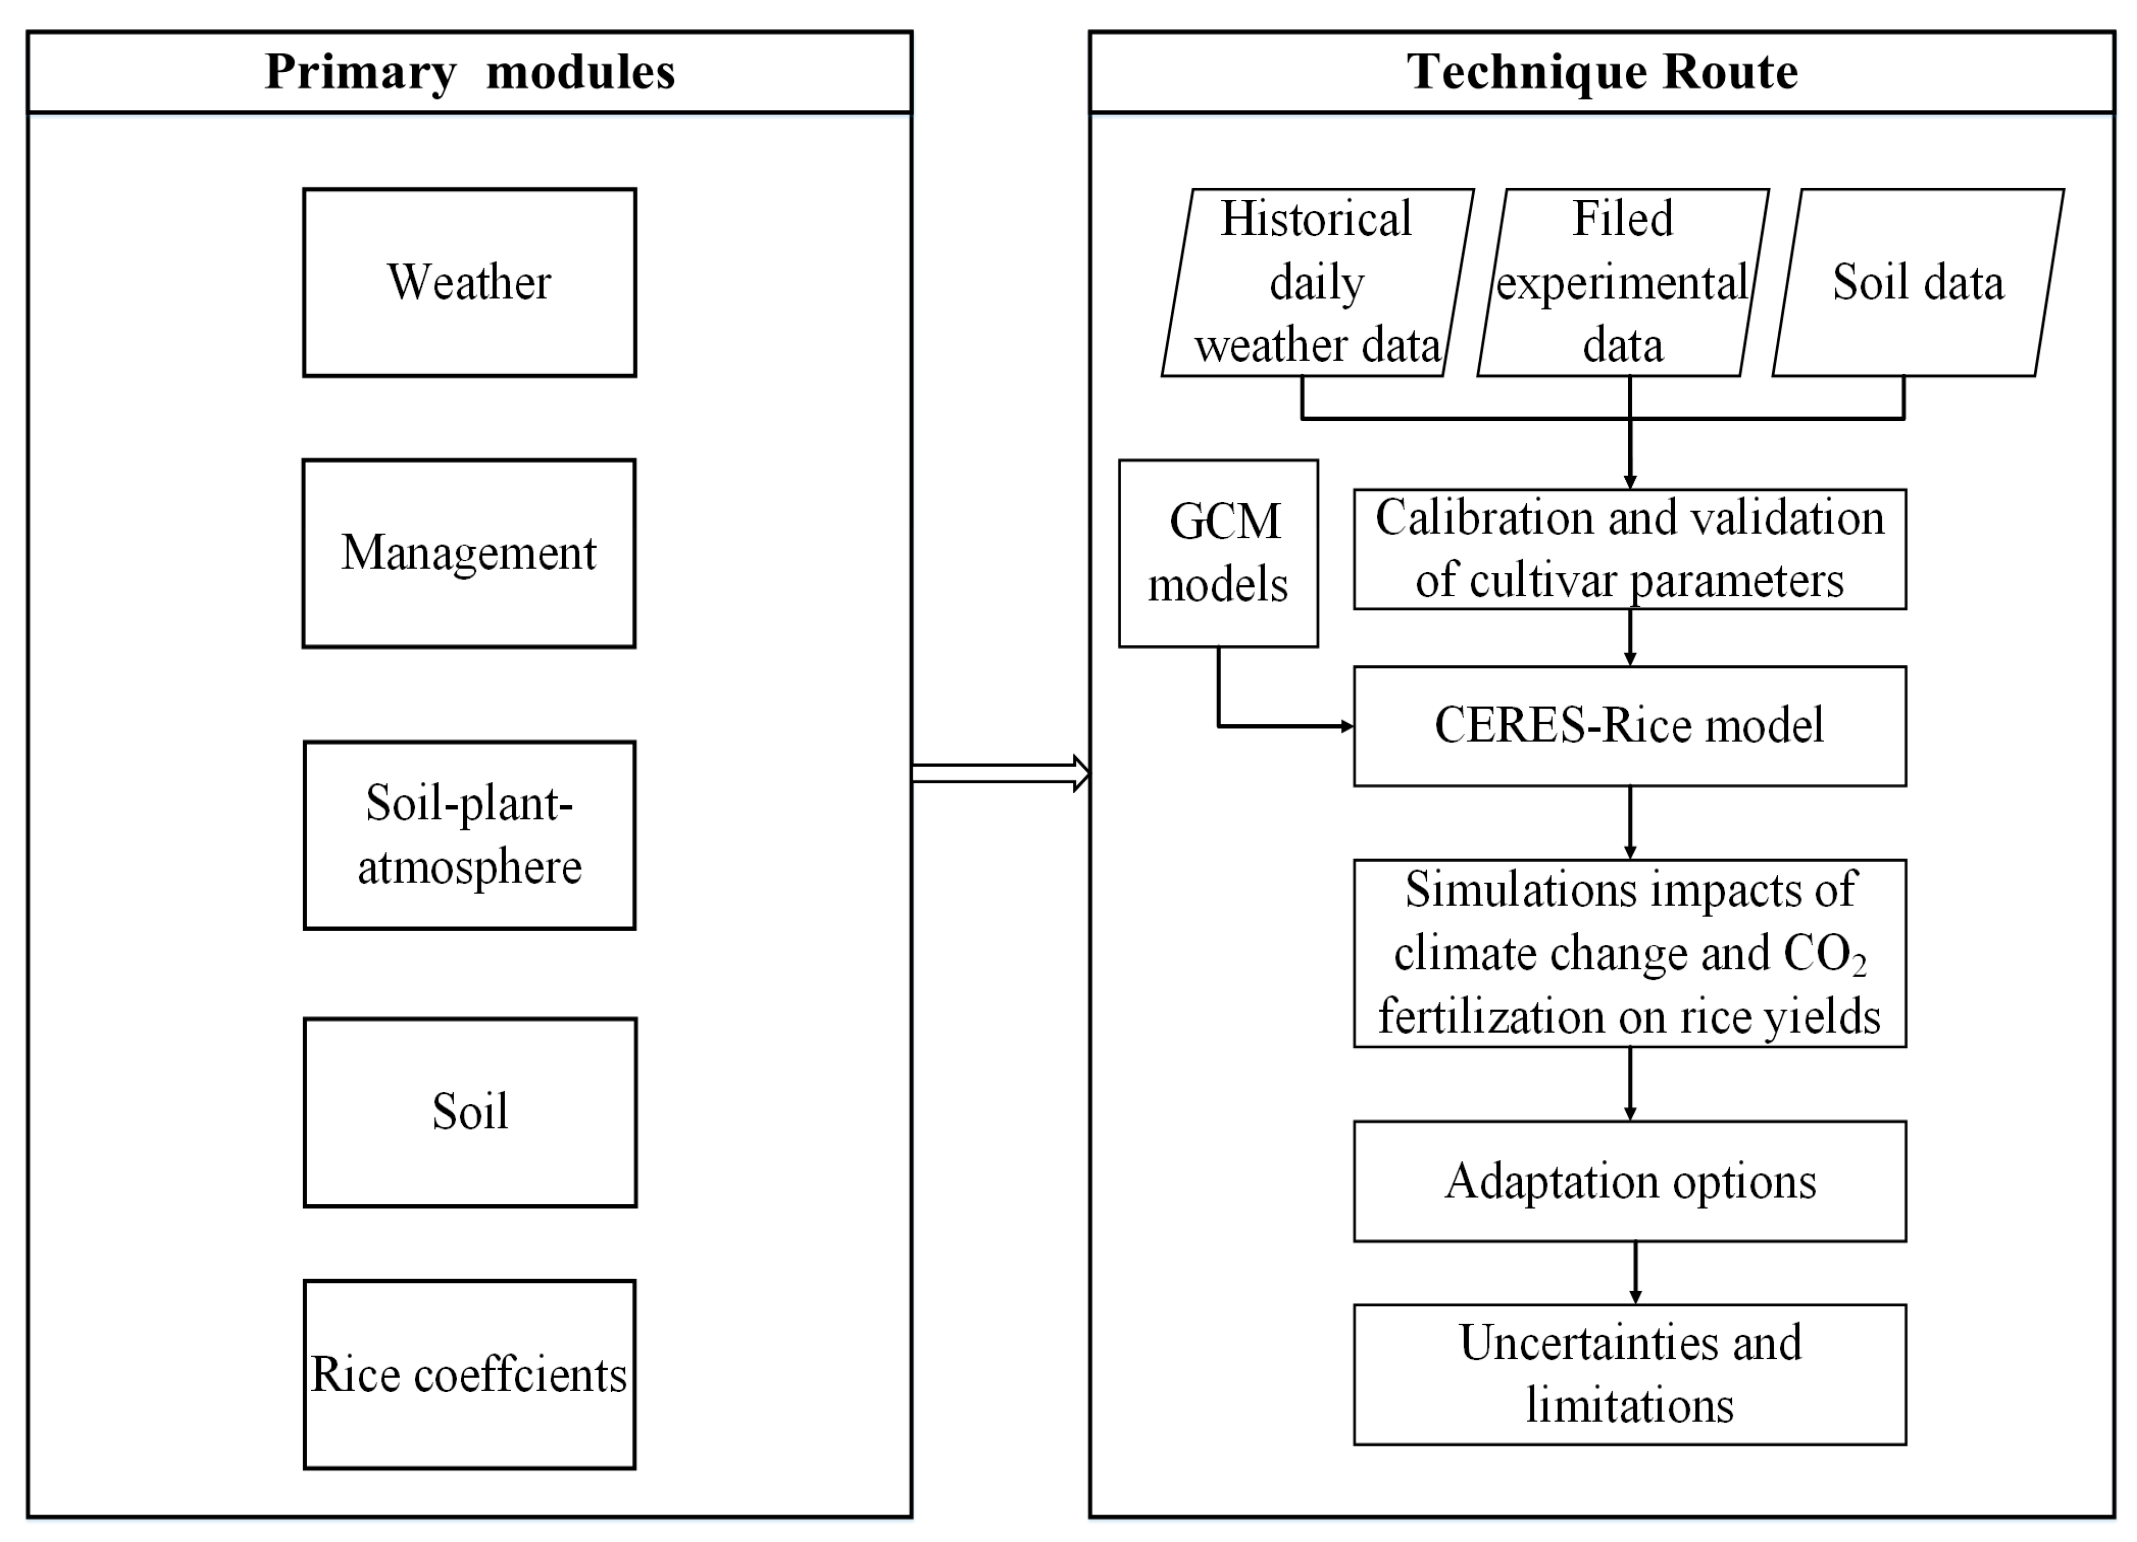
Model calibration was done to verify that the genetic coefficients of the present rice cultivars were representative of normal levels. Model validation was conducted to test whether the confirmed genetic coefficients were suitable for evaluation. The duration of flowering, the duration of maturation, and the yield are the most commonly selected factors to confirm the genetic parameters [51]. Each rice station needs to be calibrated and validated independently with a high-quality experimental record because the coefficients are cultivar specific and site specific. The generalized likelihood uncertainty estimation (GLUE) can calculate the genetic coefficients by using the observed data [52]. The calibrated and validated specific rice genetic coefficients were then extracted from the CERES-Rice model to evaluate the potential rice yield under regional climate change scenarios (Figure 3).
Indicators such as the normalized root-mean-square error (NRMSE) and the predicted deviation (PD) were selected to evaluate the precision of the simulations versus the observed data. The NRMSE and PD are each defined as follows [53]:
NRMSE = 1 O i ¯ ( i = 1 n ( S i O i ) 2 n )
PD i = | S i O i | O i
In the equations, S i represents the simulated results, O i represents the observed results, O i ¯ is the mean value of the observed data, n is the total number of comparisons, and P D i is the relative error.

2.5. Model Application

Rice grows and develops in a combination of complex, so non-countable variables should be considered for the input to perform well in the model simulation. The results were obtained with the constraint that future climate scenarios, CO2 concentrations, and adaptive measures were the only variables. The simulations were conducted to understand the impacts of climate change, the effects of CO2 as a fertilizer, and adaptive measures on rice yields in the Zhejiang province under generated weather conditions extracted from the five GCMs under RCP4.5 and RCP8.5, respectively.

2.5.1. Evaluation of the Impacts of Climate Change on Rice Yield

The impacts of climate change on rice phenology and yields were each simulated during the 2020s, 2050s, and 2080s. The simulation results were each compared with the average of the simulated results from the baseline period (1980–2010). The effects of elevated CO2 concentration on rice yields were extracted from the National Oceanic and Atmospheric Administration (Mauna Lua, Hawaii) CO2 database.
The mechanism equations for both early-mature and late-mature rice are given as follows:
  Yield E R = 395.1 Tavg + 224.8 Radi 138.9 Prec + 12 , 467.5 ( P < 0.01 ,   r = 0.765 )
Yield L R = 308.2 Tavg 261.9 Prec + 12548.5    ( P < 0.01 ,   r = 0.730 )
In the equations, T a v g , P r e c , and R a d i represent the average temperature, precipitation, and solar radiation, respectively. In addition, P refers to the significance level and r is the correlation coefficient [54].

2.5.2. Adaptive Measures

The Fifth Assessment Report of the IPCC suggests several adaptation strategies to cope with potential climate change, such as altering planting dates, switching to high-temperature-tolerant cultivars, and breeding new cultivars [55,56]. These measures are believed to be helpful, whereas the cropping systems and field management processes are held constant at the normal level in the future [57,58]. Optimizing irrigation, controlling disease, and improving crop management practices were also suggested [59,60].
To optimize the planting dates, the simulations were conducted by advancing and delaying the planting date by 40 days at intervals of 5 days while other operations were held constant. The simulated rice yields were compared with the yields of rice when the planting dates were not changed. Switching to high-temperature-tolerant rice cultivars and breeding new rice cultivars were completed by changing the parameters in the model and then selecting the parameters that were able to achieve the highest yield, providing the most optimized rice cultivar.

3. Results

3.1. Calibration and Validation of the CERES-Rice Model

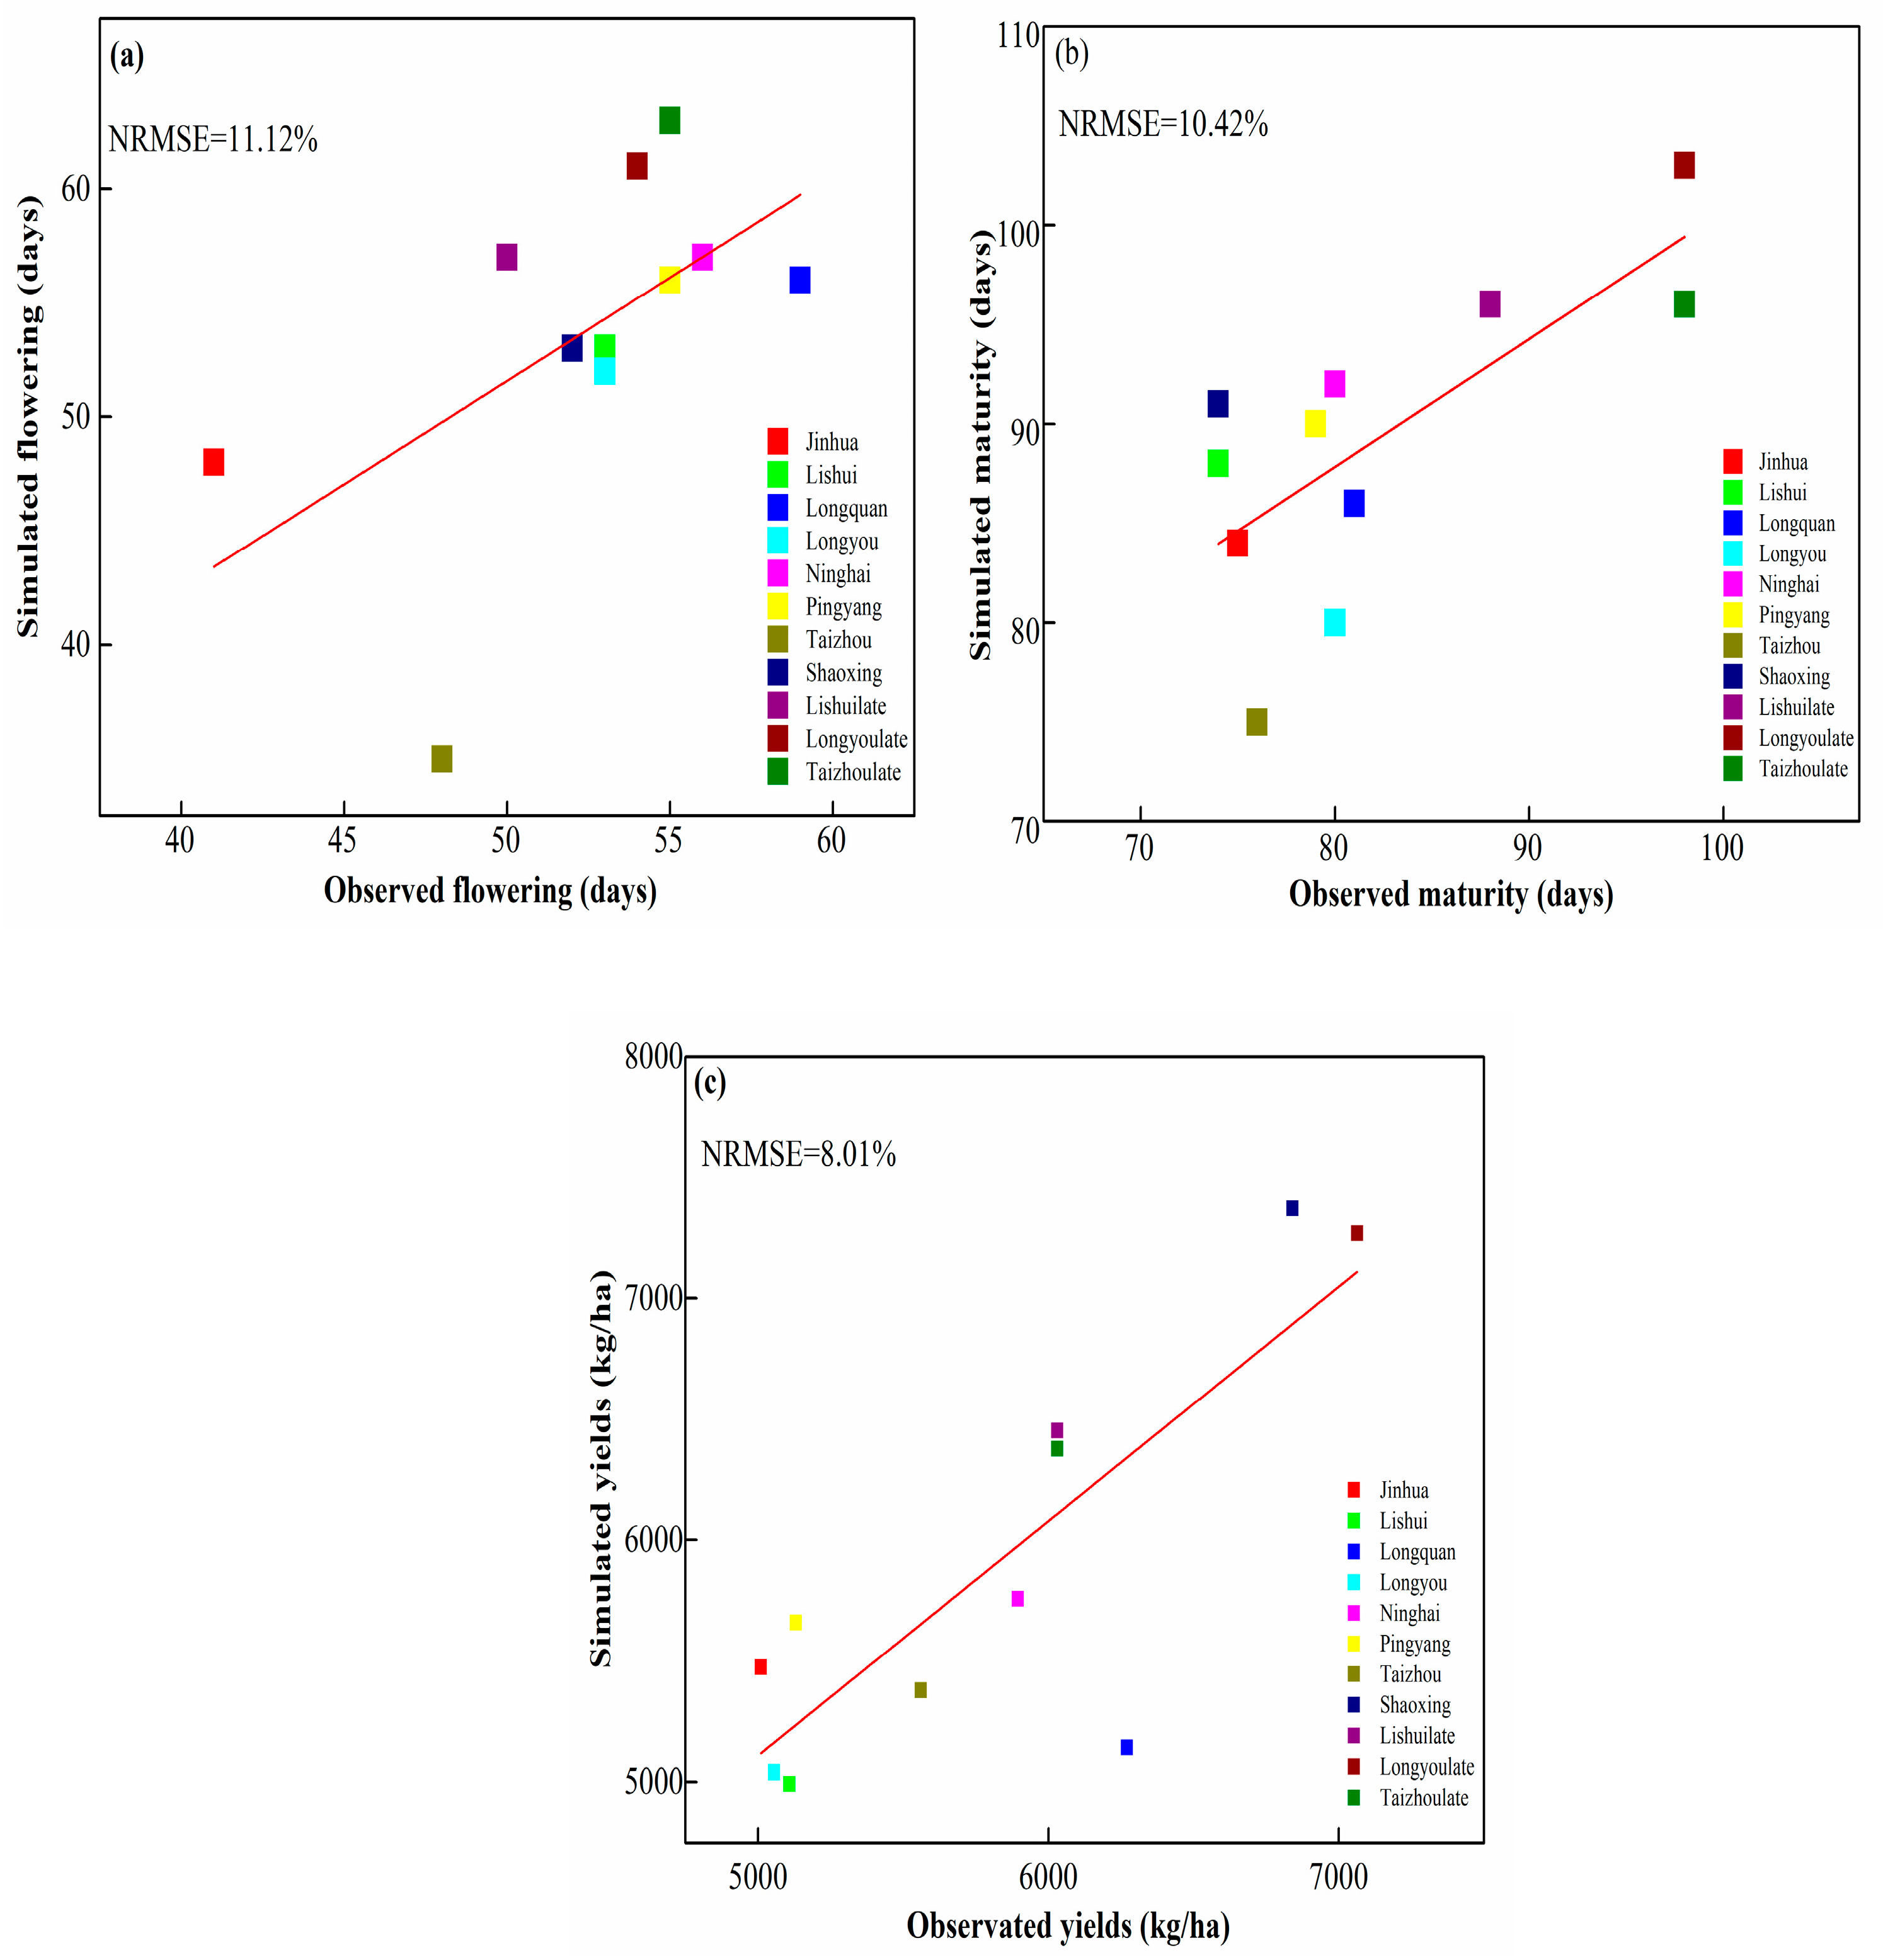
Figure 4 clearly shows the results of the model calibration and validation for the observed and simulated duration of flowering, duration of maturation, and rice yields of the 11 sites. The NRMSEs for the duration of flowering, duration of maturation, and rice yields at all the sites were 11.12%, 10.42%, and 8.01%, respectively.
The NRMSEs were all less than 15%, indicating good model performance and implying a reliable simulation [61]. Details on the cultivar parameters after calibration and validation are summarized in Table 2.

3.2. Projected Climate Change

Comparisons of temperature, precipitation, solar radiation, and projected CO2 concentration during future periods in the 2020s, 2050s, and 2080s, compared with the baseline period (1981–2010) under RCP4.5 and RCP8.5, are shown in Table 3. The mean annual average temperature relative to the baseline is expected to increase by 0.18 °C, 1.18 °C, and 1.28 °C, respectively, under RCP4.5, whereas it is projected to increase by 0.20 °C, 1.62 °C, and 1.87 °C, respectively, under RCP 8.5. The results show that the climate change variables are all in a continuously increasing trend under both RCP4.5 and RCP8.5. The results also showed that climatic variables always attained a higher level in RCP8.5 in almost all aspects. The same conclusion was reached with the projected CO2 concentration.

3.3. Impacts of Climate Change on Rice Yields

3.3.1. Impacts of Climate Change on Rice Phenology

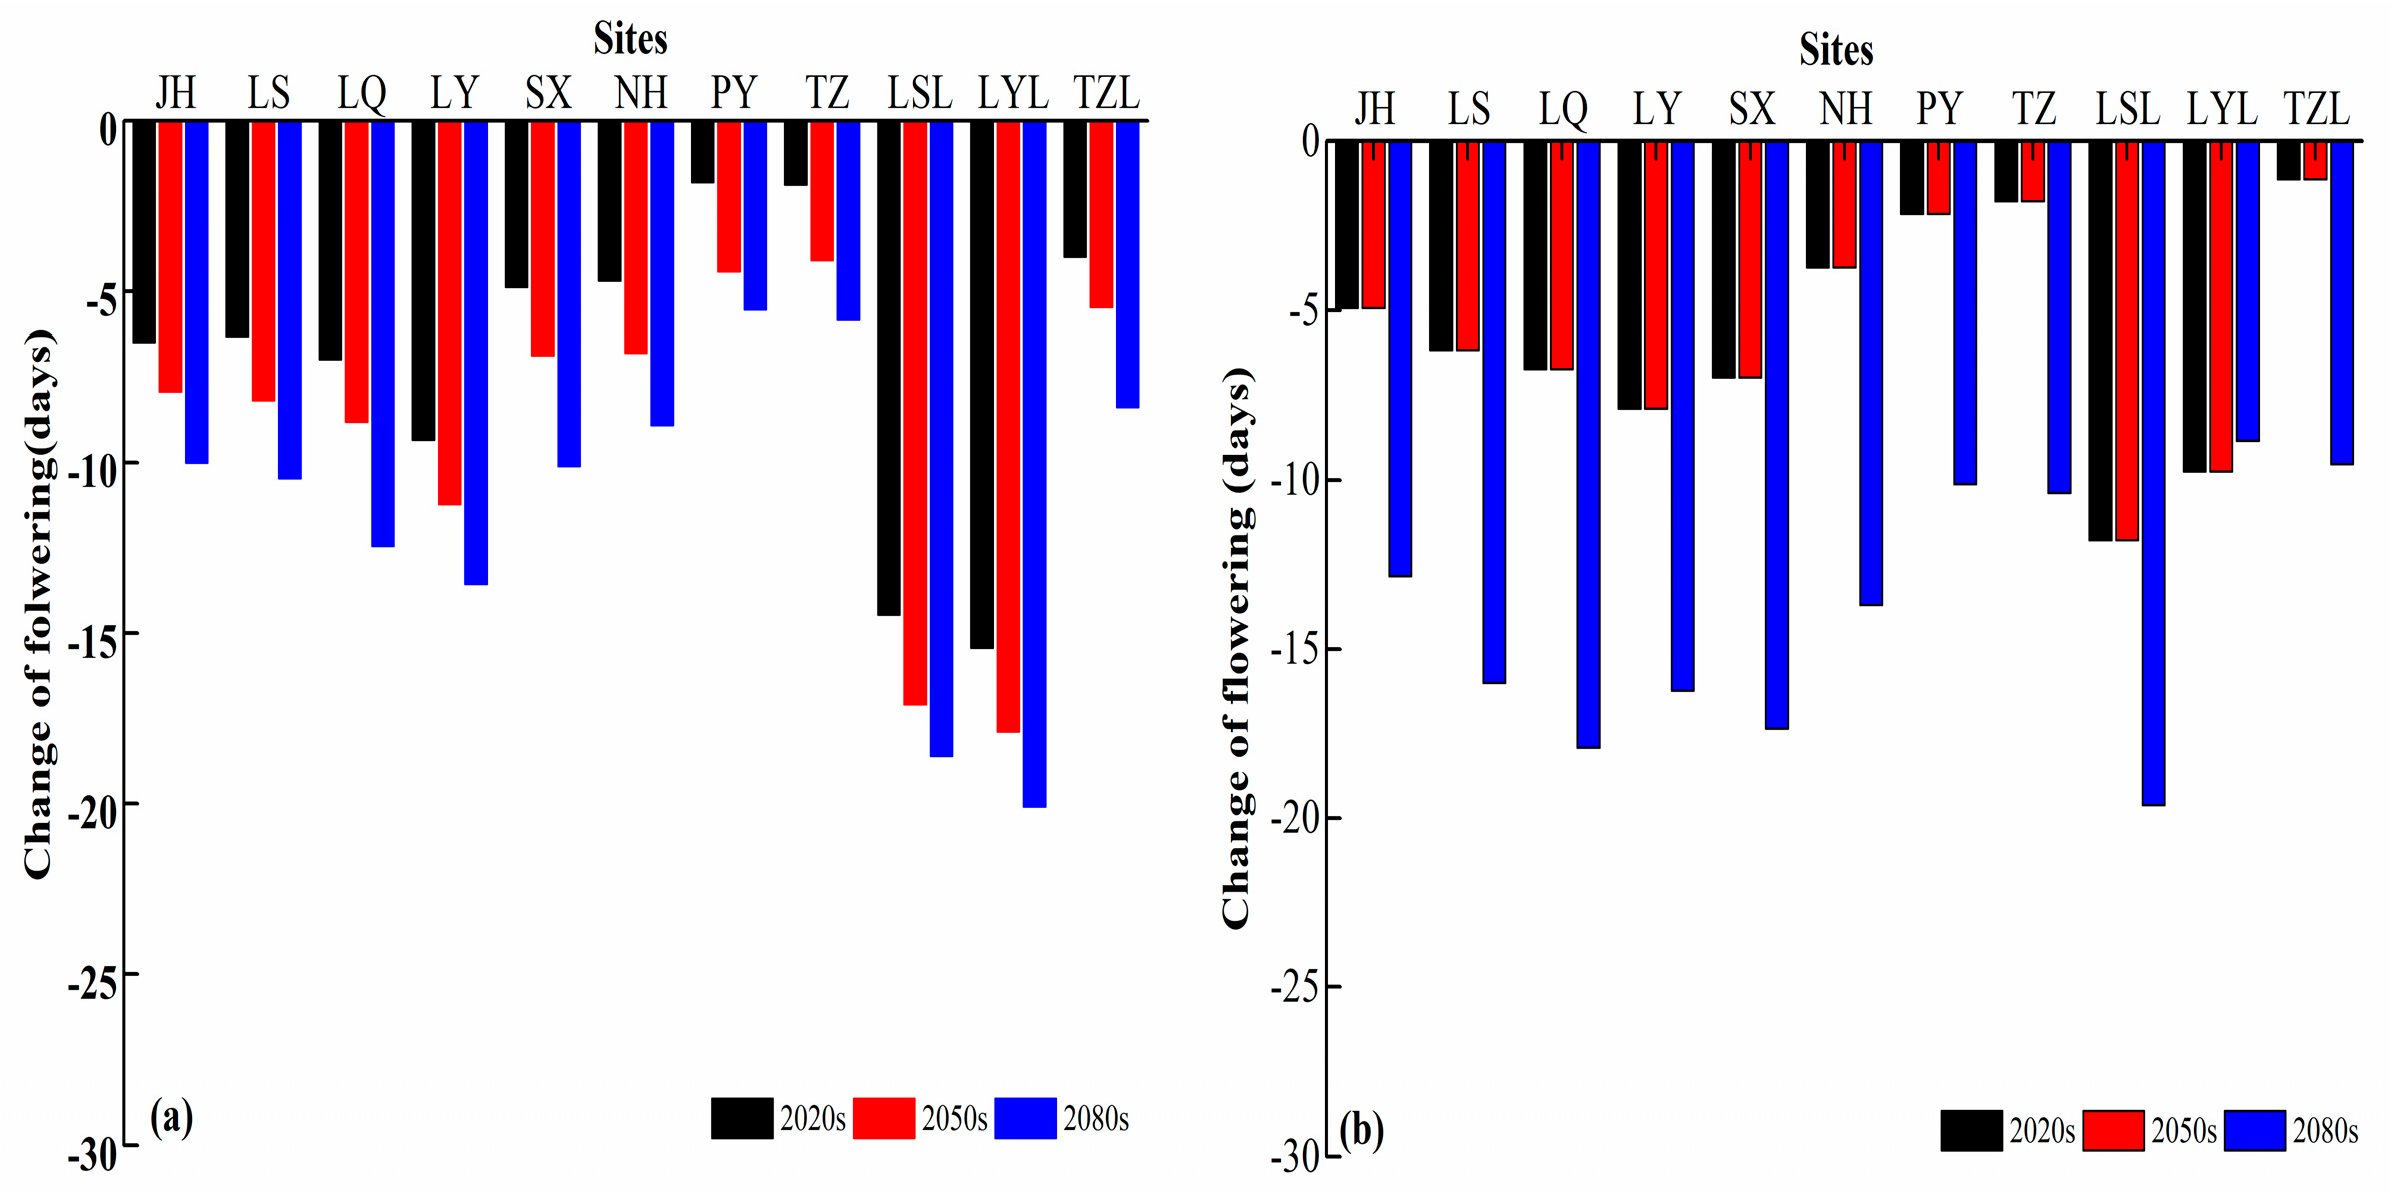
Figure 5 shows the average change in the flowering and maturation periods during future climate scenarios at all sites under RCP4.5 and RCP8.5, respectively. Almost all the simulations indicated that the climate change would inevitably advance rice phenology and shorten the duration of growth. More precisely, the rice flowering period from the year 2011 to the year 2099 would be shortened significantly by an average of 10 days and 12 days under RCP4.5 and RCP8.5, respectively. A maximum reduction of 20 days could possibly happen at site LYL under RCP4.5 and 18 days at site LSL under RCP8.5, respectively.
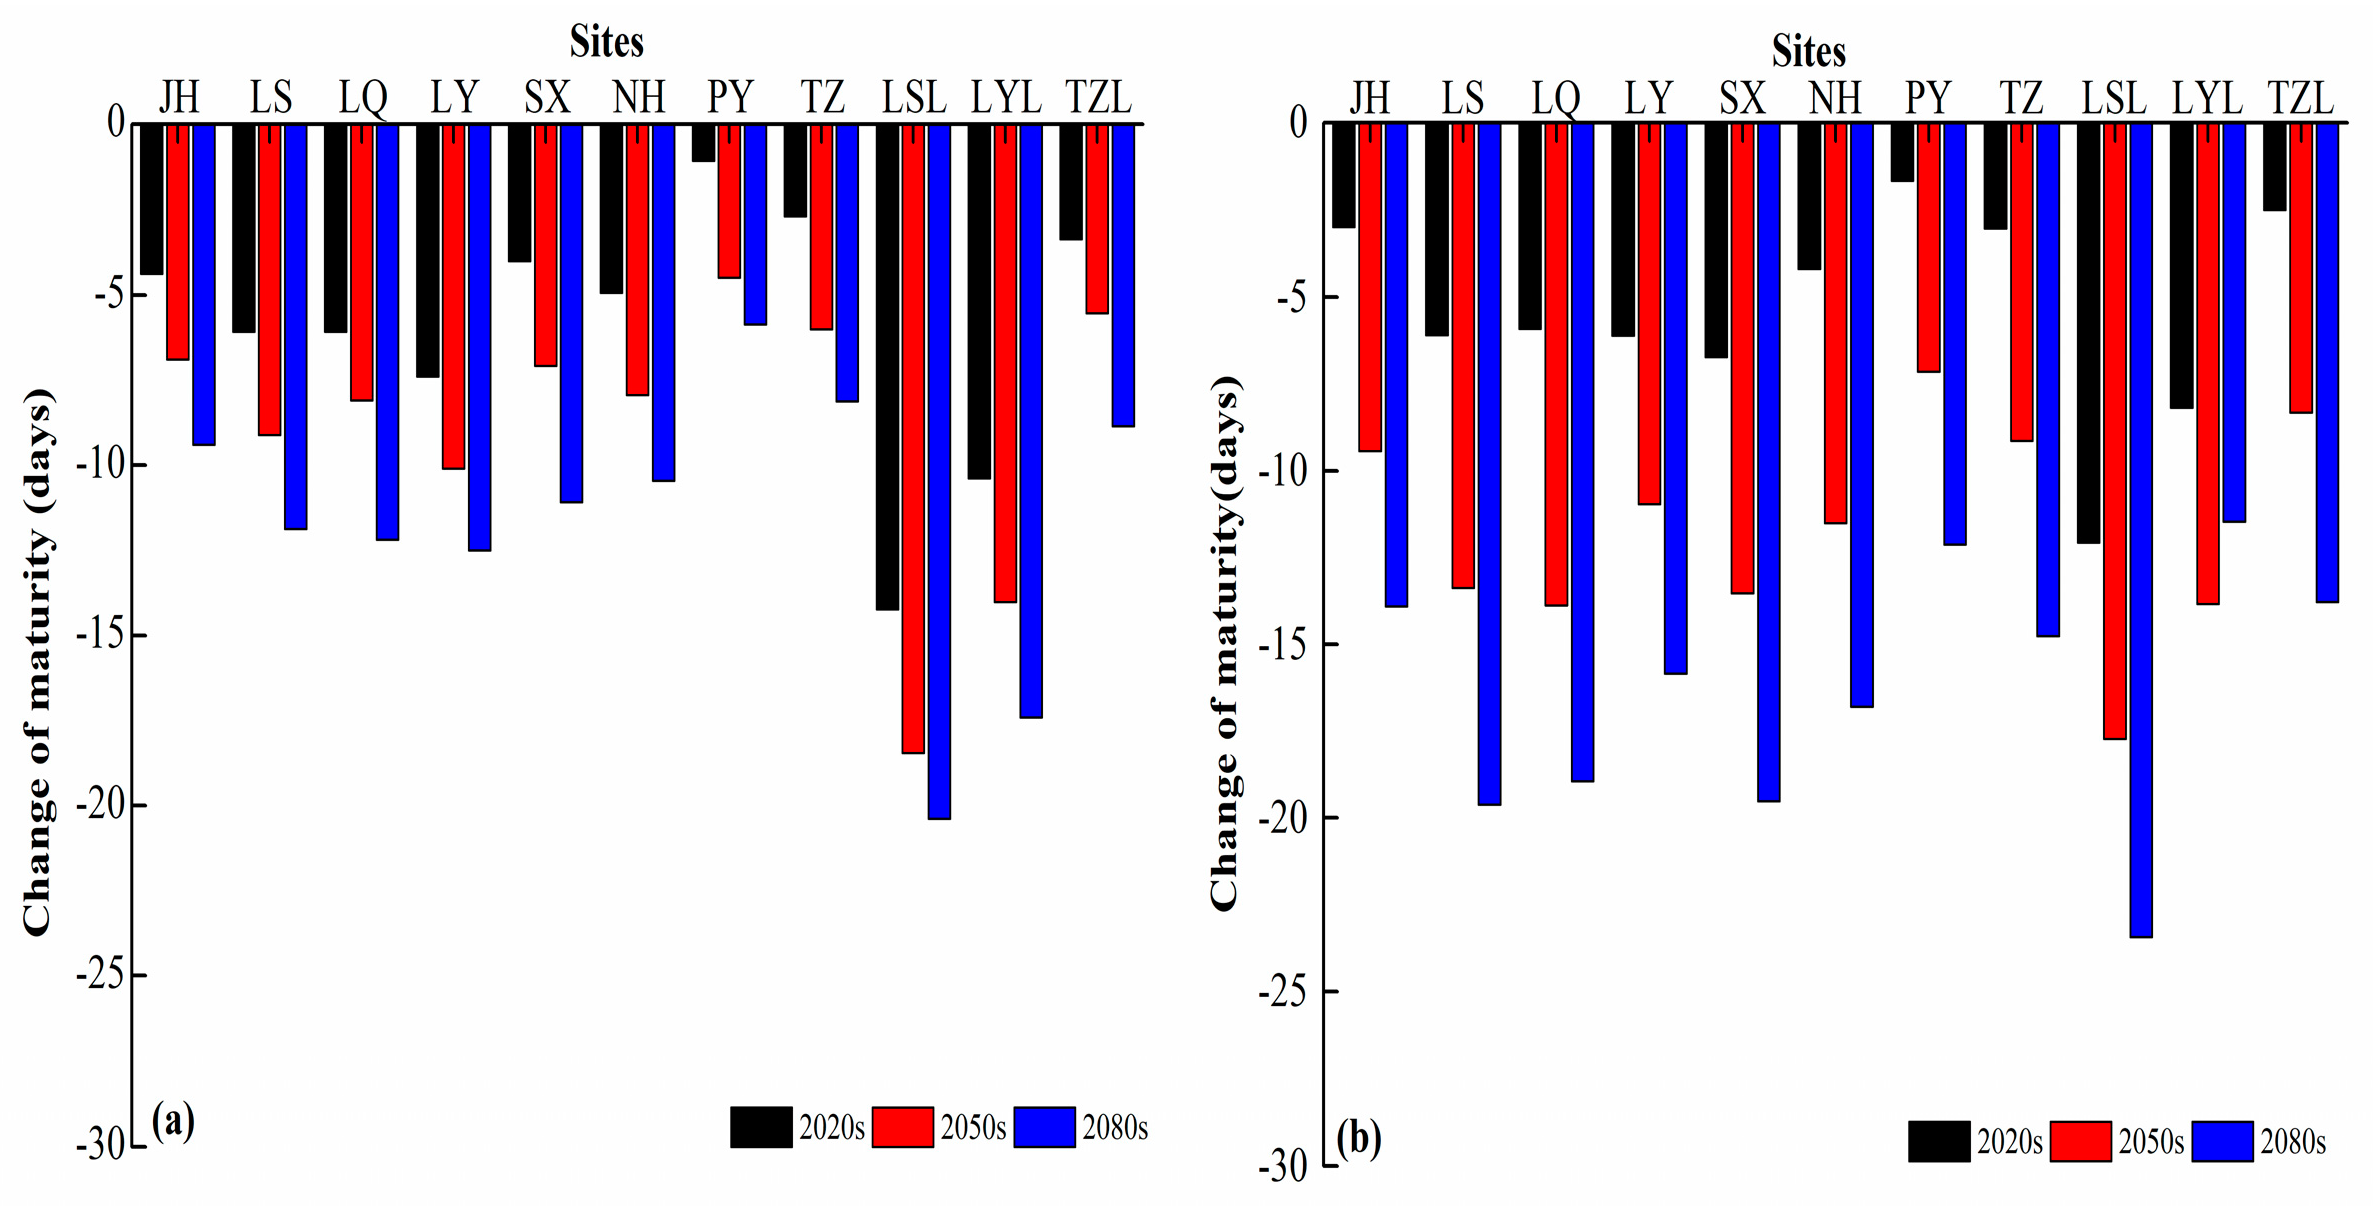
Figure 6 illustrates the maturation periods affected by projected climate change. The degree of decrease is nearly the same as that for the flowering periods. In all, the average duration of maturation would be shortened by 5.2 and 8.4 days under RCP4.5 and RCP8.5, respectively. A maximal reduction of 21 days could happen at site LSL under RCP4.5 and 24 days at site LSL under RCP8.5, indicating a decrease in the rice yield.
The impacts on rice phenology attributable to climate change under RCP8.5 are more obvious than those under RCP4.5. The reason for this was that the duration of rice growth was shortened considerably by the increase in temperature.

3.3.2. Impacts of Climate Change on Rice Yields without CO2 Fertilization Effects

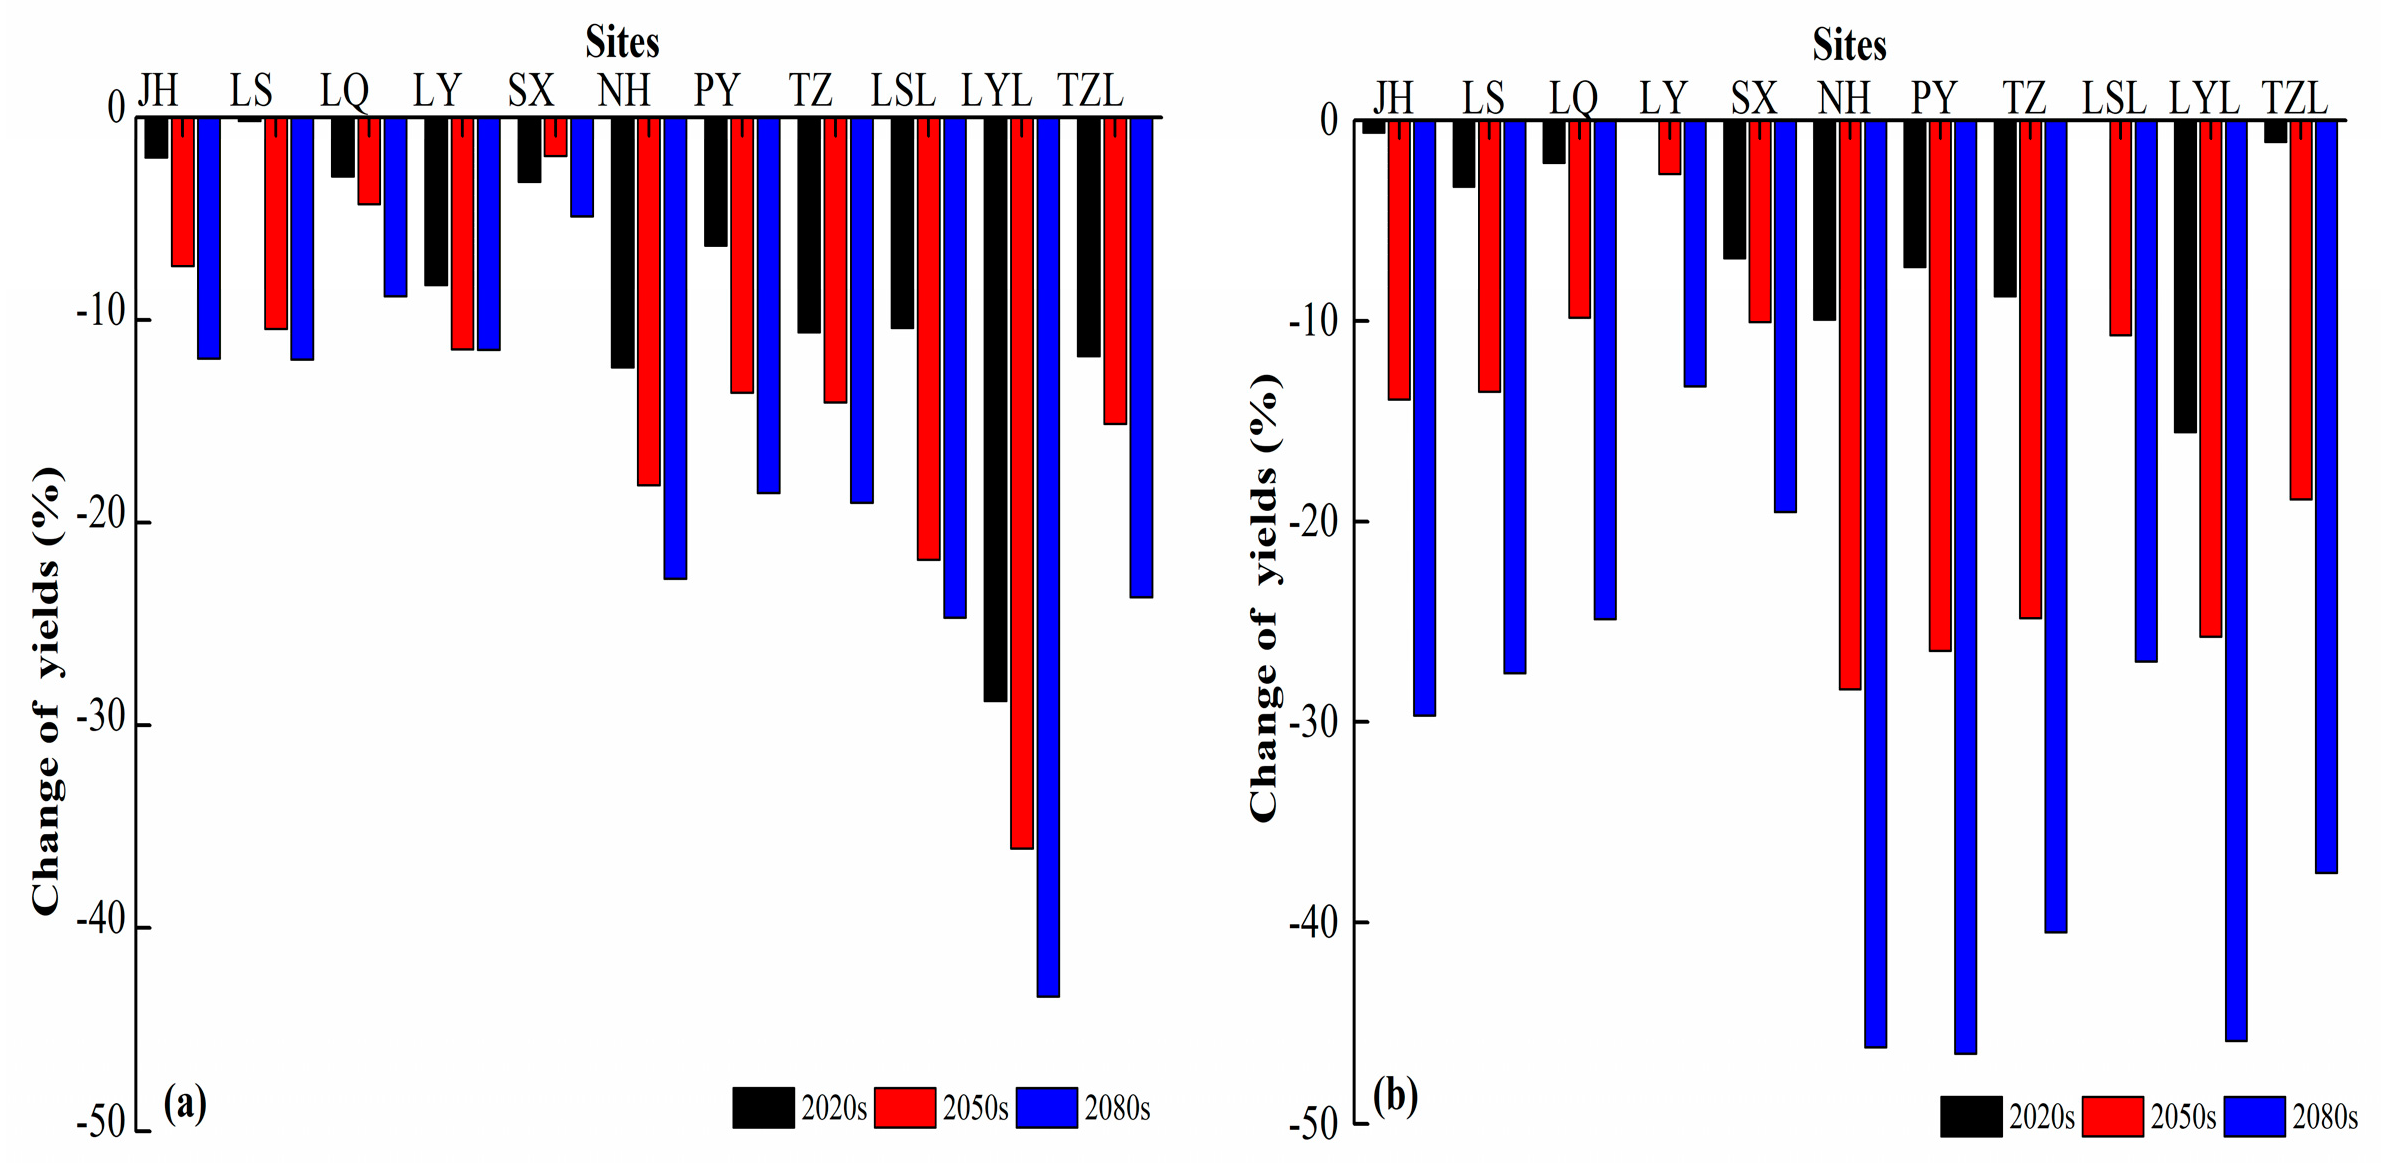
The simulated impacts of climate change on rice yields, without accounting for the CO2 fertilization effects, under RCP4.5 and RCP8.5 during the 2020s, 2050s, and 2080s are shown in Figure 7. The rice yields appear to show a continually decreasing trend during all periods under both RCP4.5 and RCP8.5 at all sites. For all cultivars, the reductions in rice yields during the three periods were projected to be 8.79%, 14.02%, and 18.28% under RCP4.5, compared with yields from the baseline period. The decline in rice yields was projected to be 4.99%, 16.81%, and 32.58% under RCP8.5, compared with yields from the baseline period. The rice reduction at sites NH, PY, TZ, LSL, and TZL exceeded 30%, however, the most serious reduction, 48%, occurred at site PY under RCP8.5 in the 2080s. Additionally, the late-mature rice cultivars seemed to be more sensitive to future climate change than the early-mature ones were, presumably because late-mature rice will inevitably suffer more heat stress than early-mature rice.
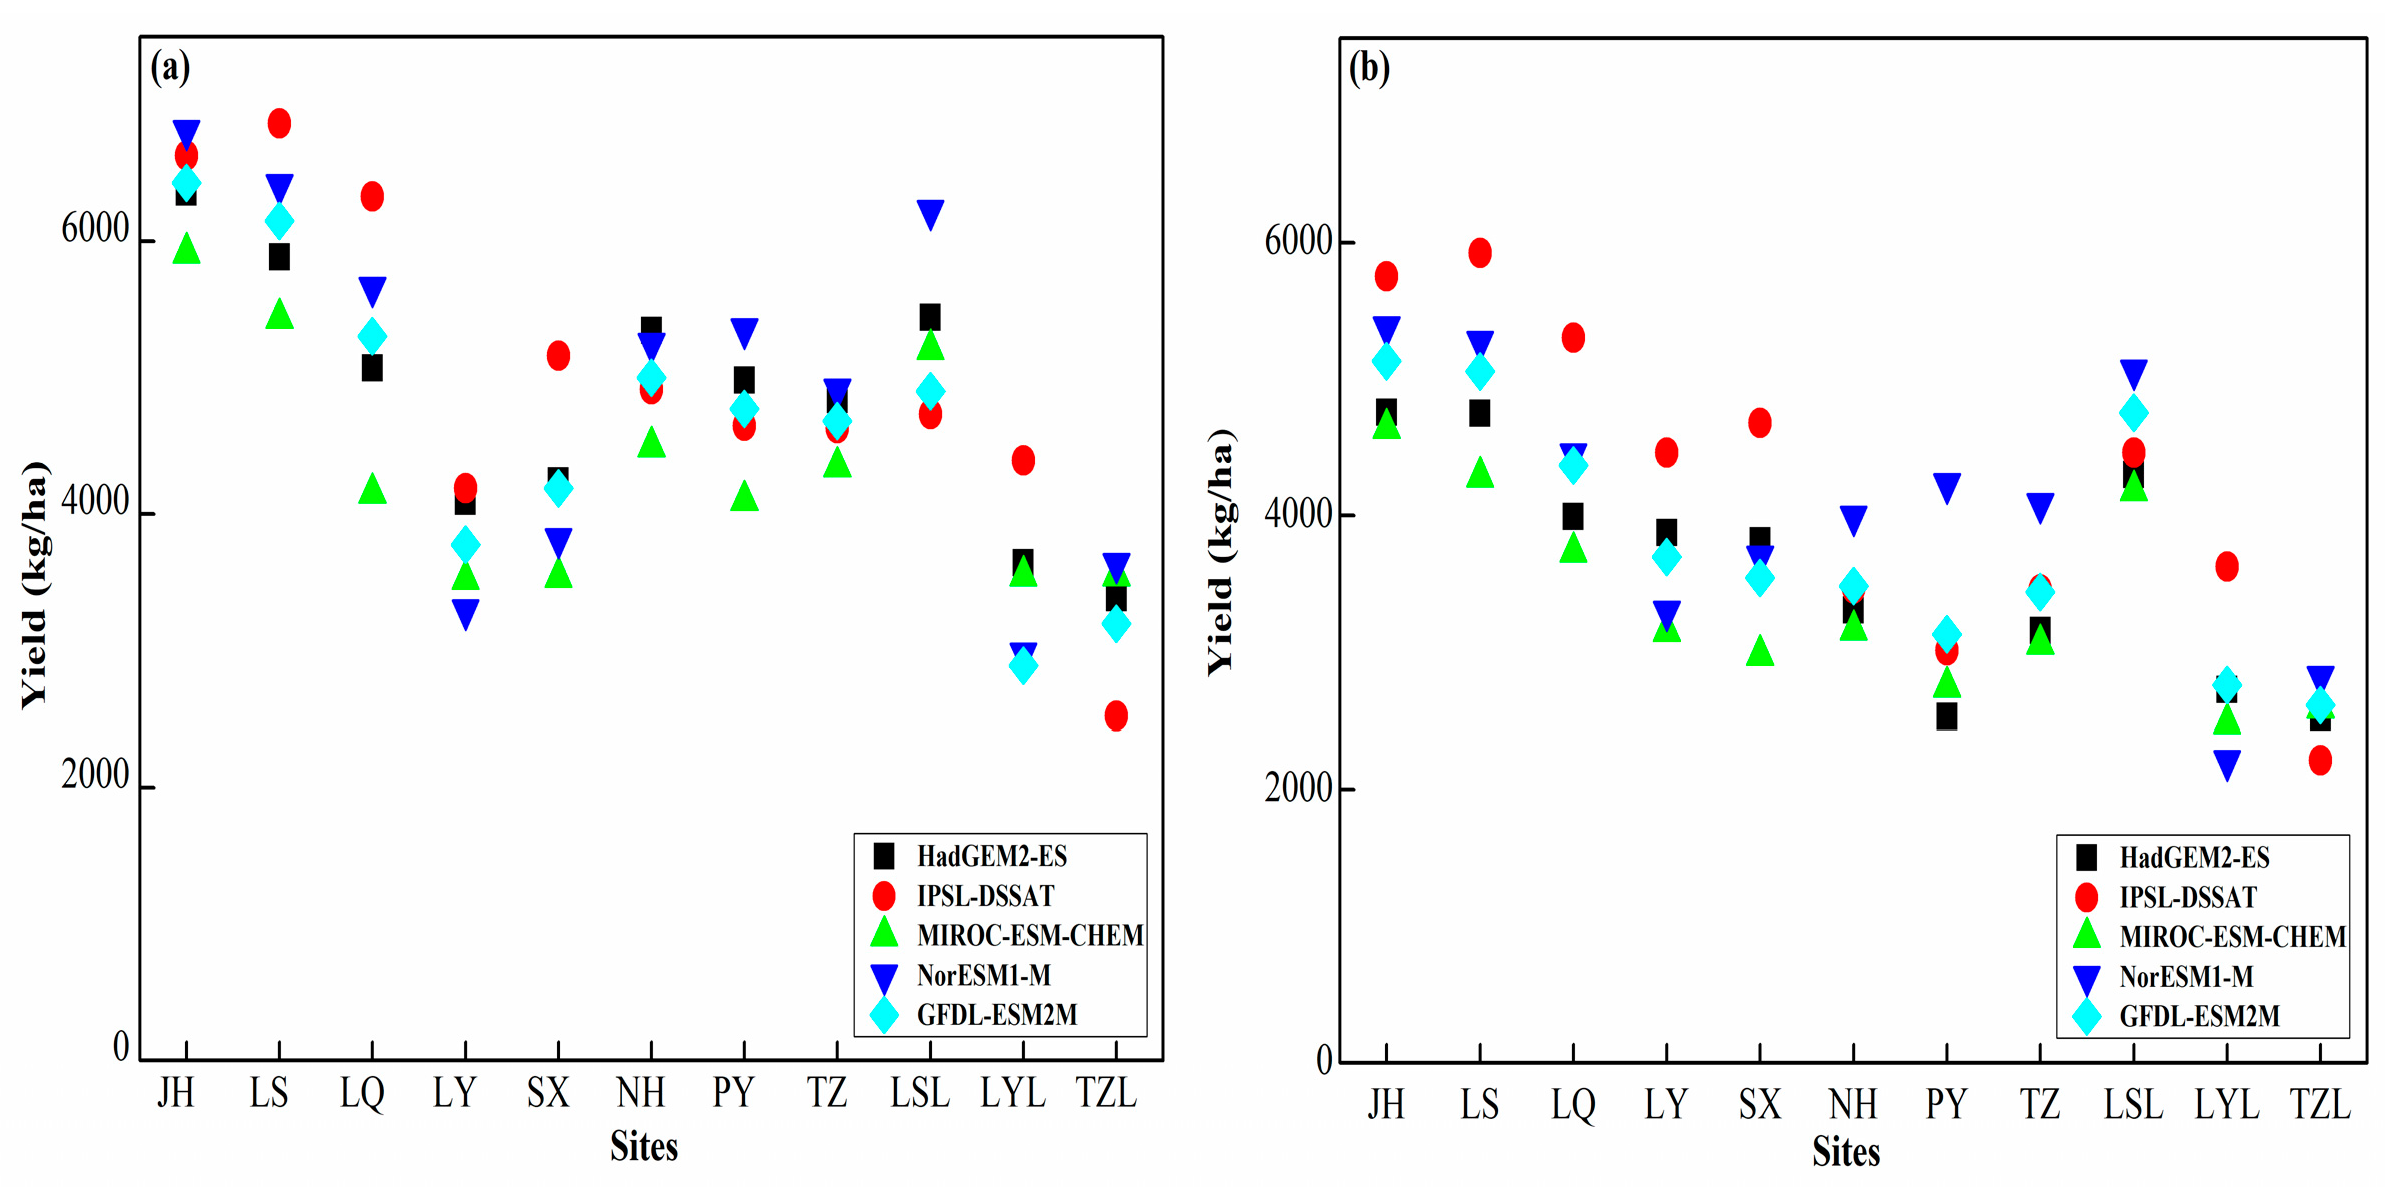
To verify in detail, the differences in rice yield caused by meteorological data generated from different GCMs, the simulated rice yields using daily weather files were generated from five GCMs and are shown in Figure 7. The results indicate that the IPSL-CM5A-LR model always attains the highest rice yields, whereas the MIROC-ESM-CHEM model always results in the lowest yields. Despite the difference in rice yields caused by different GCMs, the difference was not entirely obvious. Thus, the results of all the models were combined together to obtain more detailed information and generate a box-picture (Figure 8).

3.3.3. Impacts of the CO2 Fertilization Effects on Rice Yields

Table 4 indicates that the increase in CO2 concentration is likely to mitigate the rice yields to some extent when CO2 fertilization is accounted for. The average rice yields at all experimental sites would change from −30.27% to −5.24% compared with the baseline yields. However, at most sites, the CO2 fertilization effects were unlikely to offset the total negative impacts from climate change. The reason for this was that CO2 fertilization could enhance photosynthesis by constraining photorespiration and could increase the utilization rate of water by reducing the stomata conduction and consequent transpiration. Furthermore, rice is a C3 plant and it responds to the effects of CO2 in photosynthetic carbon assimilation, thus, CO2 could contribute to rice yields [62].
In the simulations, even when the CO2 fertilization effects were considered, the negative impacts were still −20.643% and −24.1% at sites SX and PY, respectively, which both exceed 20%. Thus, some adaptive measures must be taken to lessen the adverse the potential impacts of climate change.

4. Discussion

4.1. Analysis of the Impacts of Changing Climate Variables

Climate change will inevitably reduce rice yields at all sites, and the rice yields at sites PY, SX, and LYL in the 2080s, compared with the baseline period, were projected to decline by −24.1%, −20.64%, and −17.94%, respectively, under RCP8.5. From Equations (5) and (6), it could be observed that the mechanisms for early-mature rice and late-mature rice are totally different. The rice at sites PY and SX was early-mature rice, whereas that at site LYL was late-mature rice. The equations showed that the rice yields were closely connected with climatic variables during the growth of the rice. The average weather variables at sites PY, SX, and LYL are given in Table 5.
The entire area is located in the Yangtze River Basin, which means that the river flows and rainfall is abundant at sites PY and SX. In addition, Table 5 clearly shows that merely the precipitation had changed from March to June during the 2020s, 2050s and 2080s, which indicates that the main influencing factors are the average solar radiation and average temperature.
For early-mature rice, the yield is positively correlated with the average solar radiation and negatively correlated with the average temperature because the yields are reduced. This result indicates that the negative impacts from the average temperature were stronger than the positive impacts of the average solar radiation. For late-mature rice, the main influence was also the negative impacts related to the average temperature.
The high temperature would certainly reduce the duration of rice growth by 11 to 15 days in the 2080s under RCP8.5. Therefore, the rice yields would be reduced by 20% to 40%. These simulation results are consistent with those by Zhang and Tao [63], who assessed climate change impacts with five models and found that the simulated growth period of rice would be shortened by 0.45 to 5.78 days. The increase in temperature during the rice growth period would reduce rice yields, and the decrease in solar radiation could reduce the crop photosynthesis rate and accumulation of biomass. The findings of this study are also similar to the results by Osborne et al. [64], who found that without the effects of CO2 fertilization, the losses in total rice yields would be 9.7%, −1.5%, and −20.9% under scenario A2 in the 2020s, 2050s, and 2080s, respectively. The yields could reach a maximum at the optimal temperature of 25 °C and would be reduced by 10% for every 1 °C temperature increase above 25 °C until the temperature reached 35 to 36 °C, when no yields would be obtained [65]. When the temperature rose above 25 °C, the rice yields would decline for the shorter grain-filling duration, thus, the maximum temperature during rice growth is a good indicator of heat stress [66].

4.2. Simulation of Adaptation Options

To reverse or lessen the potential reduction of rice yields, adaptive measures such as adjusting the planting dates and switching to high-temperature-tolerant cultivars were conducted at sites SX and PY, where the most adverse reductions in rice yields could possibly happen in the 2080s.

4.2.1. Adjusting the Rice Planting Dates

The rice flowering period is so sensitive to a high temperature that even an increase of 1 °C could cause a significant reduction in rice yields. The maximum temperature would increase gradually from 15 ° to 40 °C from February to August at sites SX and PY. Because the temperature could be adjusted by switching planting dates, reasonably advancing the planting dates would probably help the late-mature rice survive the high temperature and extend the flowering period by several days, thereby stabilizing or increasing the rice yields.
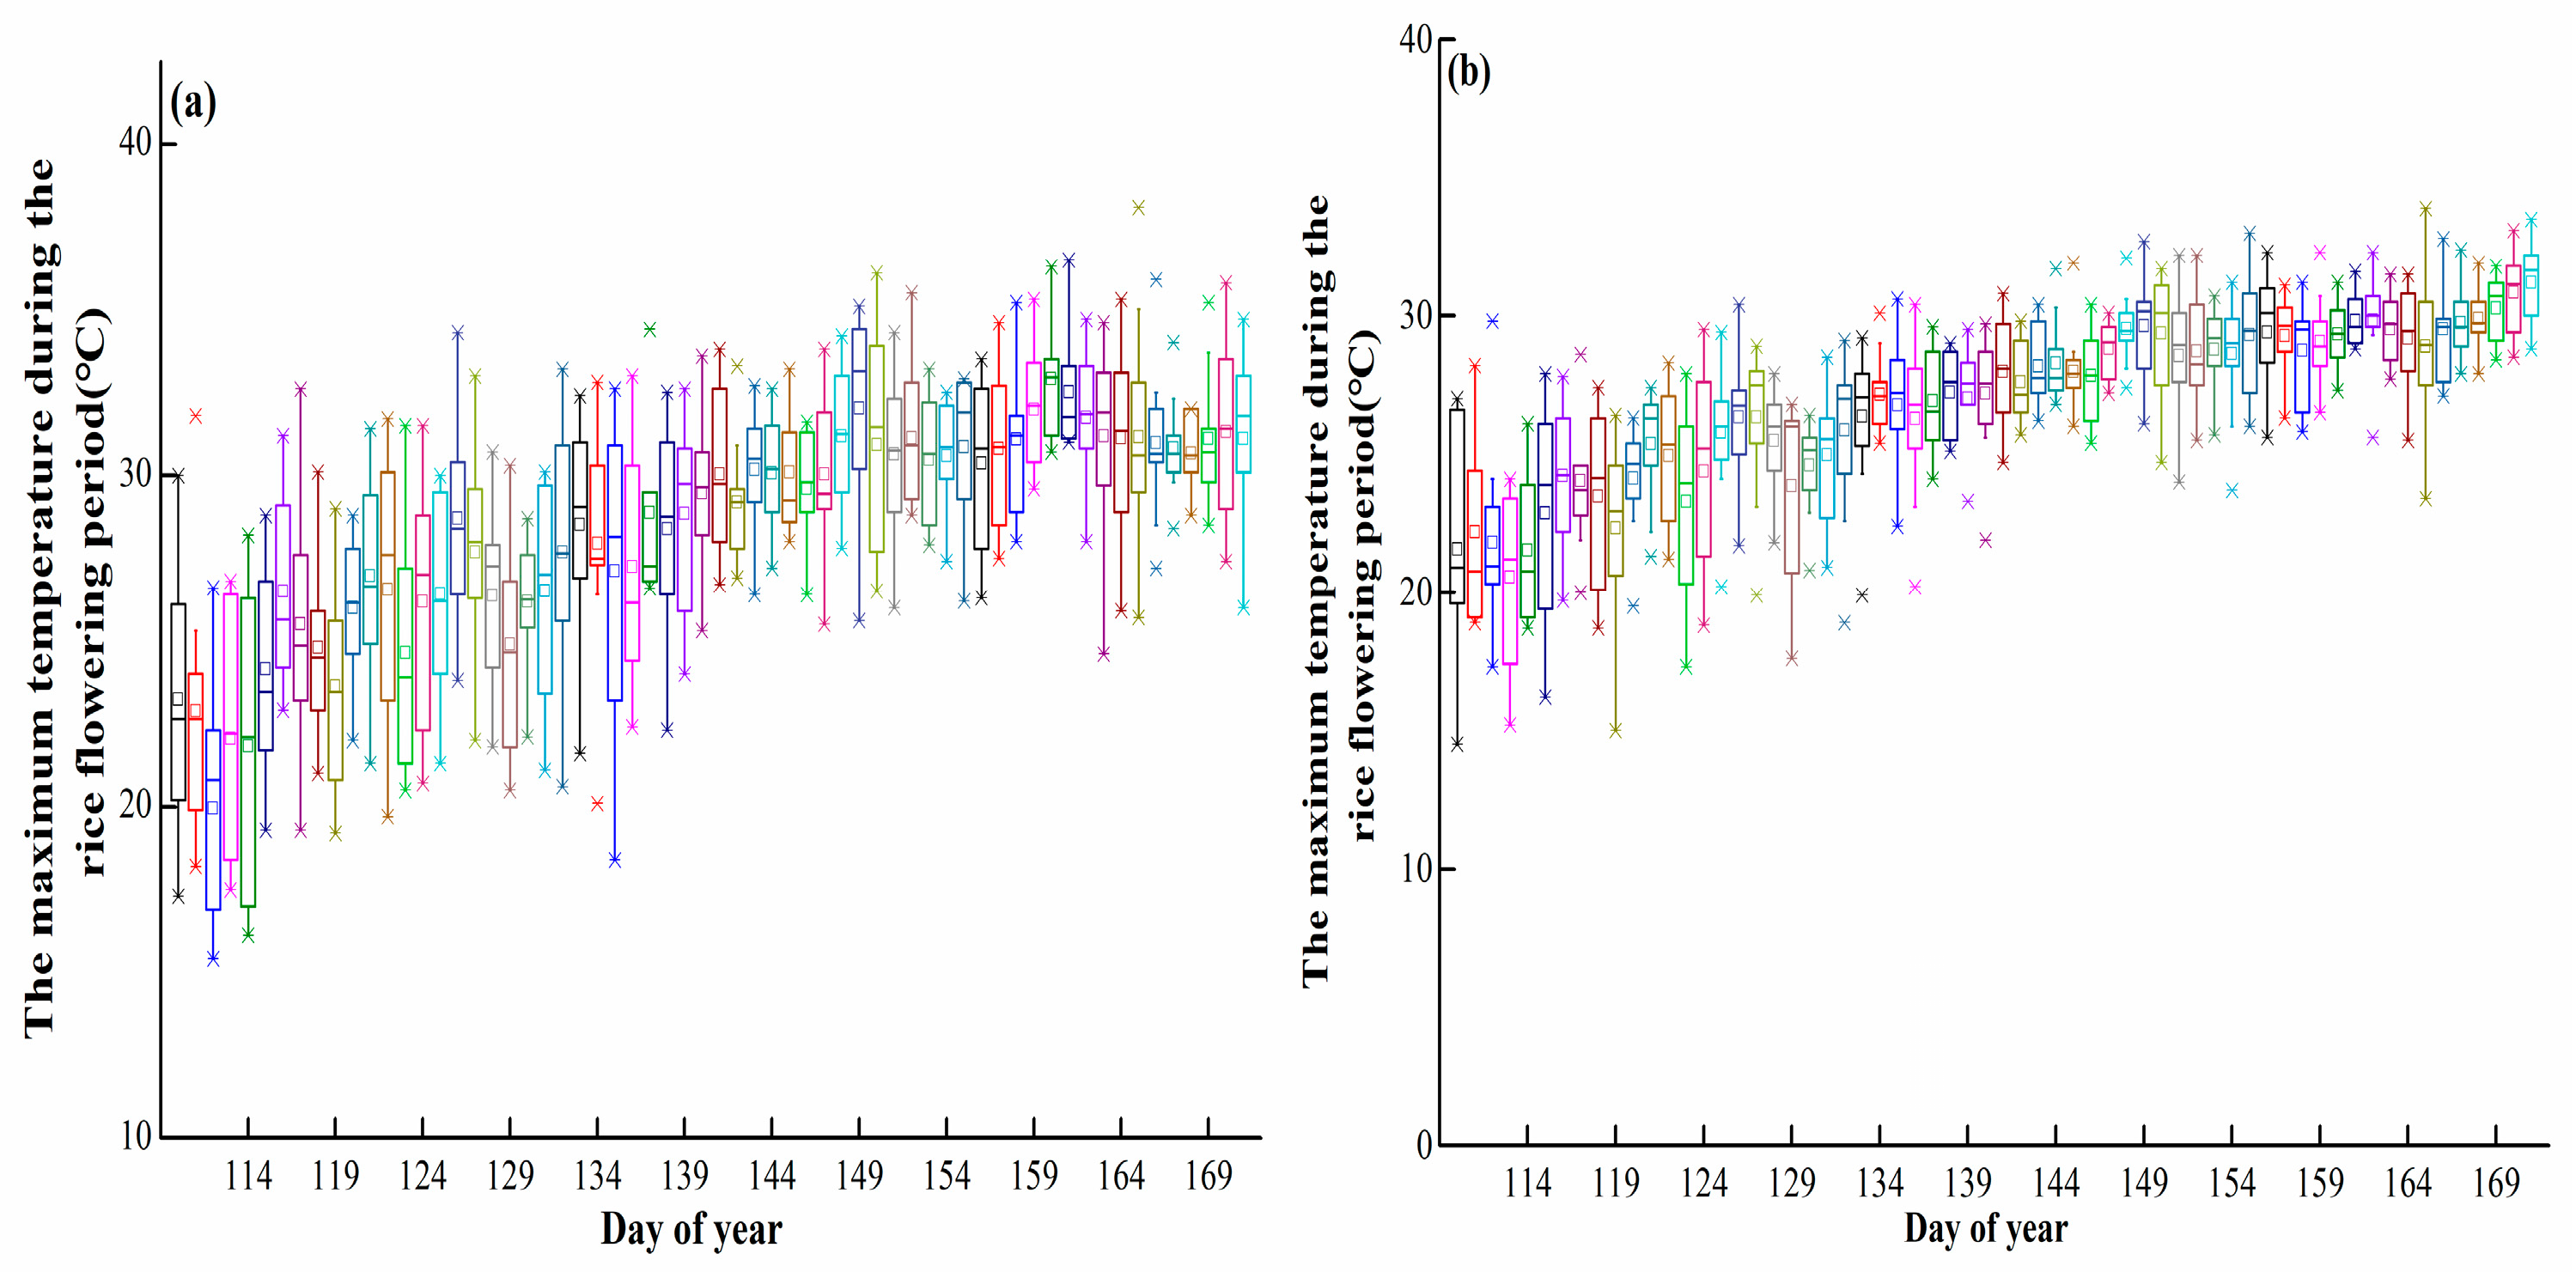
The simulation results showed that the rice yields could be improved to a very impressive degree when the planting dates were advanced. The most suitable planting days for SX and PY are, respectively, 20 and 15 days earlier than the normal planting dates. Consequently, the rice yields could each apparently be improved by 9% and 15%, respectively (Figure 9). Figure 10 clearly shows the maximum temperature in the 2080s under the RCP8.5 scenario at the SX and PY sites. The maximum temperature increased significantly during this period at both sites.

4.2.2. Switching to High-Temperature-Tolerant Rice Cultivars

Because the high temperature would inevitably reduce the rice flowering period, a useful method would be to replace the present rice cultivar with a high-temperature-tolerant cultivar. After analyzing and considering the simulation results, the rice cultivar “Jiayu293” seemed to be more likely to survive the high temperature than the other cultivars during the flowering period. The rice cultivar “Jiayu296” was replaced with “Jiayu293” at the SX site, and the same method was performed at the PY site.
The simulation yields, when using the new cultivar at sites of SX and PY sites, were 4646 and 4914 kg/ha. When compared with the original yields of 4055 and 4126 kg/ha, they both had relative improvements of 14.57% and 19.1%. The simulation results for rice yields at the two sites where the new rice cultivars were adopted gained a significant enhancement, in contrast to the simulation results, where the rice cultivars were left unchanged. These results indicate that the flowering periods at both sites were prolonged and that rice cultivar “Jiayu296” was more tolerant to the high temperature than the original cultivar was.

4.2.3. Breeding New Rice Cultivars

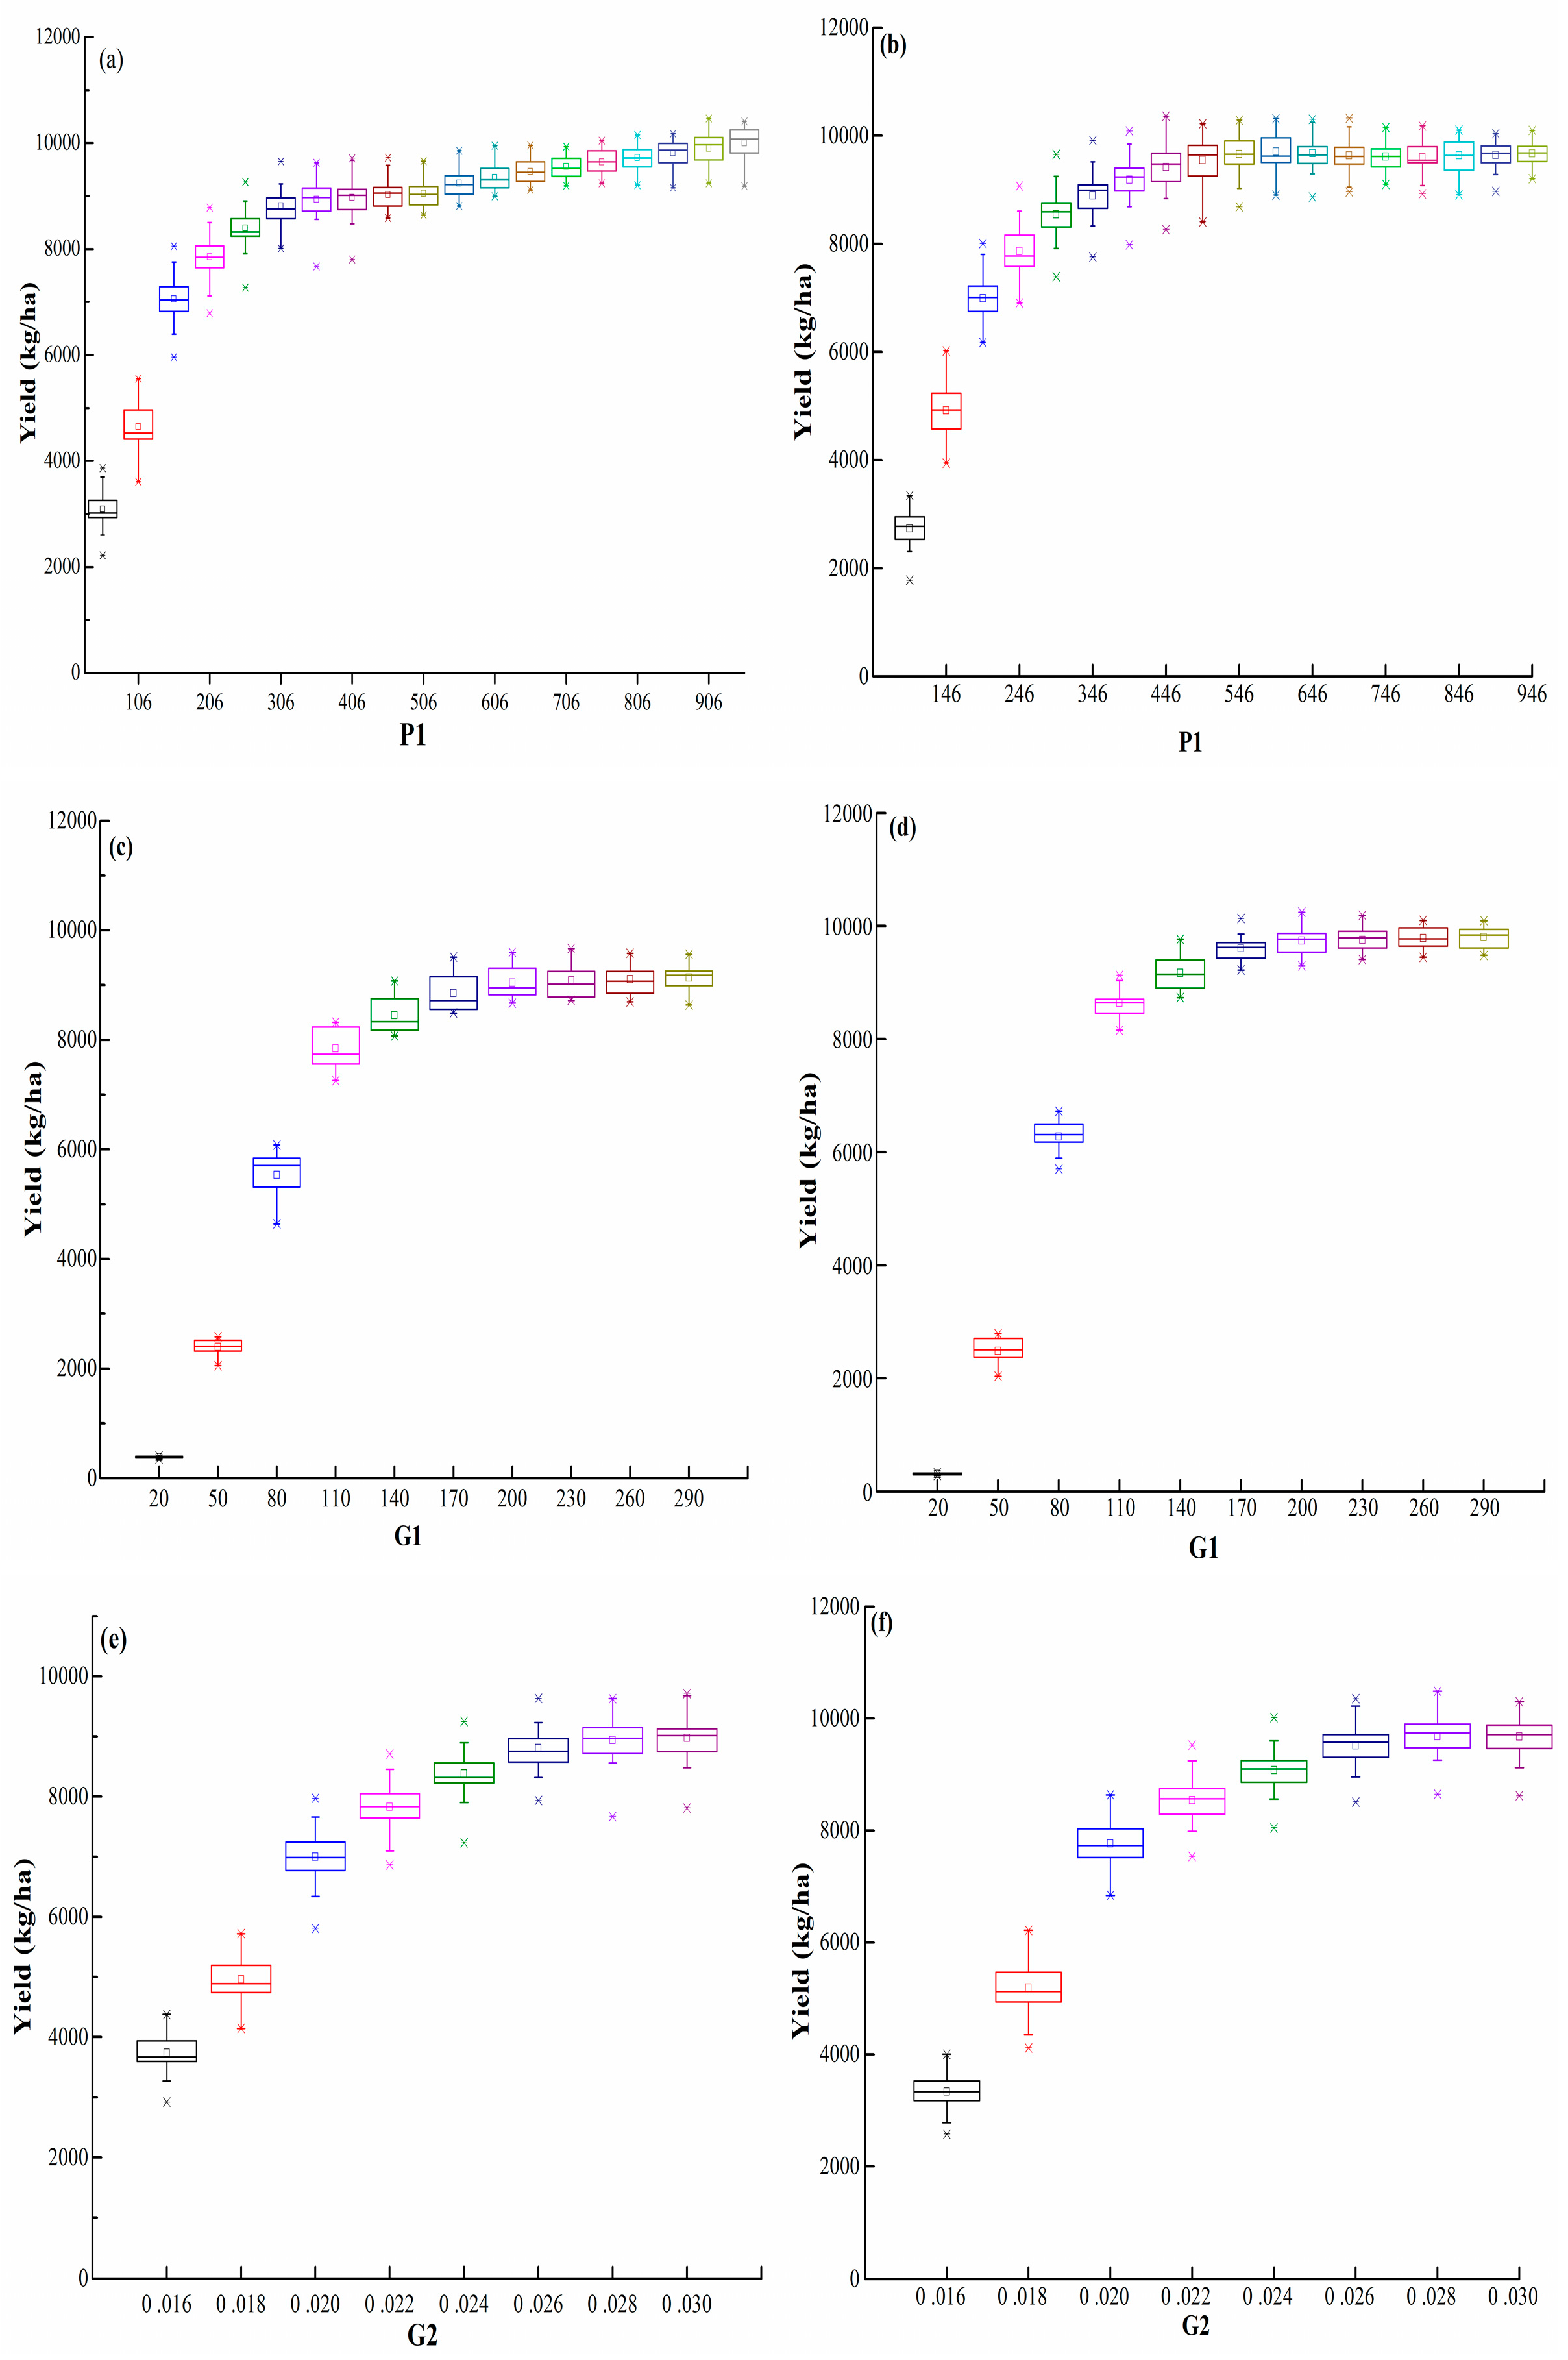
Because genotype coefficients control the growth and development of rice cultivars, breeding new cultivars may be a very useful method of reducing the adverse impacts of climate change. There have been reports that new rice cultivars have proven very effective in increasing rice yields and coping with climate change [67]. Rice coefficients are composed of several fundamental elements, such as P1, G1, and G2, and they are responsible for the GDD above 9 °C, the spikelet numbers per panicle, and the grain weight, respectively.
To determine the most suitable parameter that could raise the rice yield efficiently, the coefficients were switched within the settled range while the other conditions were held constant. Simulations of the yields were conducted with the altered genetic coefficients in the model at the SX and PY sites, where the lowest rice yield was projected to occur in the 2080s. The parameters P1, G1, and G2 were changed from the lowest to the highest within the settled range in the model: P1 was tested from 100 to 1000 at intervals of 100, G1 was tested from 20 to 290 at intervals of 30, and G2 was tested from 0.016 to 0.030 at intervals of 0.002. Each parameter was plotted with the corresponding rice yield at the SX and PY sites. Finally, the most suitable coefficients for each rice cultivar were conformed. Figure 11 clearly shows the relationships between each of the main rice coefficients and the rice yields. When parameter P1 approaches 900, the rice yield at site SX reaches the highest level, whereas for PY, the most suitable P1 value was 546. Similar conclusions were obtained with parameters G1 and G2. The best G1 parameters for both sites were 170 and 200, respectively, and those for G2 were 0.028 for both sites.
Detailed information on the rice coefficients and their yield improvements for the selected sites is shown in Table 6. The given genetic coefficients could be adopted to breed new rice cultivars.

4.3. Uncertainties

Like most simulations, this study also suffers from uncertainties and limitations, especially regarding the climate change, crop models, and agricultural techniques. Because knowing future agricultural techniques is beyond the capacity of this study, the uncertainties were mainly assessed for the climate change and crop models.
First, considering the uncertainties related to climate change, it is quite difficult to generate accurate daily weather from future climate scenarios and climate models. Comparability across climate impact studies could be compromised when little guidance is available for selecting future climate models [49]. The impacts of climate change could vary significantly, so it is recommended that researchers utilize as many GCMs as possible. Although the future climate scenarios in this study were extracted from five GCMs under RCP4.5 and RCP8.5, uncertainties still remain, such as excess precipitation and heat. The uncertainties within the climate change scenarios of each model were assessed. Figure 8 shows that the maximum rice yield differences between GCMs was nearly 30% at sites SX and PY, and the minimum could be no more than 2% at site TZ. The results of this study are supported by previous studies. Li et al. [68] found that the predicted temperature contributed to approximately 59.7% of the uncertainty in rice yield projections. Krishnan et al. [69] predicted changes of −9.02%, −11.3%, and −21.35% in rice yields with future climate projections generated from the GFDL, GISS, and UKMO scenarios, respectively. Droogers et al. [70] assessed the climate change impacts on rice yields in the Volta Basin by using the SWAP and HadCM3 climate models, and the results showed that different scenarios had different impacts.
Second, the model mechanisms are critical to the accuracy of the simulation. Even though the CERES-Rice model is commonly believed to be the most reliable, the model cannot contain all the parameters or variables of the real environment. Aggarwal and Mall [71] evaluated the climate change impacts on rice yields in India by using the CERES-Rice model and the ORYZA2000 model. They found considerable differences in their assessments of the impacts of climate change on rice yields and therefore suggested using two crop models. Amiri et al. [17] studied the CERES-Rice, aqua crop, and ORYZA2000 models to examine the differences in performance when representing grain and rice yields. The CERES-Rice model represented the highest accuracy under most applications, the aqua crop model had the most precision in biological yield, and the ORYZA2000 model showed the lowest accuracy across the study.
Third, the adoption of various GCMs under RCPs and multiple simulation models could significantly reduce the uncertainties. Because more than one GCM was adopted under RCP4.5 and RCP8.5, the uncertainties from climate change were considered to have been reduced to the lowest. Even though CERES-Rice is considered the most reliable model, the uncertainty from the simulation model in this study is still unknown. The effects of extreme climatic events, such as strong winds, are not considered in the scenarios. An innovation that includes more than one simulating model should be applied in future work.

5. Conclusions

In this study, the potential climate change impacts and adaptation measures on rice yields were simulated by using the CERES-Rice model under the RCP4.5 and RCP8.5 scenarios, respectively. The results clearly showed a decreasing trend in the duration of flowering, the duration of maturation, and rice yields at all sites. However, in previous similar model-based studies, adaptive measures have seldom been simulated. In the present study, strategies such as advancing planting dates, exchanging rice cultivars that can tolerate high temperatures, and breeding fresh new rice varieties were evaluated at sites SX and PY, respectively. These results not only contribute to the evaluation of potential climate change impacts on rice yields, but they also provide adaptive strategies according to specific conditions.
New technologies used in agricultural and ecological applications are now being adopted more frequently than ever before. Therefore, unmanned aerial vehicle remote sensing, satellite-based remote sensing, and the modeling technique can be combined for a better prediction of agricultural yields. In addition, the model cannot handle the stresses of water, pests, and extremely high temperatures. To obtain the growth conditions of a crop quickly, sun-induced fluorescence could be adopted as an important indicator. In the near future, agricultural and ecological applications will boom.

Author Contributions

Conceptualization, Y.G.; Methodology, Y.G.; Software, Y.G.; Validation, M.D., Y.W.; Formal analysis, Y.G.; Investigation, Y.G., H.H.; Resources, Y.G.; Data curation, Y.G.; Writing—original draft preparation, Y.G.; Writing—review and editing, Y.G., C.R.B. and Y.L.; Visualization, Y.G.; Supervision, W.W.; Project administration, W.W.; Funding acquisition, W.W.

Funding

This research was funded by the Strategic Priority Research Program of the Chinese Academy of Sciences (XDA19040101, XDA19040304) and the National Key Research and Development Program of China (2016YFA0602402).

Conflicts of Interest

The authors declare no conflicts of interest.

Appendix A

Table A1. Detailed information on soil characteristics for each experimental site.
SiteDrainageSlope (%)LayerBottompHCation Exchange (cmol/kg)Nitrogen (%)
well3Layer1145.541.16
Layer2205.83.60.56
Layer36676.10.38
Layer41006.76.60.02
LSwell3Layer1145.541.16
Layer2205.83.60.56
Layer36676.10.38
Layer41006.76.60.02
LQwell3Layer11753.90.11
Layer2235.65.80.03
Layer31005.55.80.06
LYwell3Layer1445.67.80.05
Layer21006.58.80.01
NHwell8Layer1125.85.50.14
Layer2195.84.30.1
Layer31006.13.30.07
PYwell12Layer1366.88.40.04
Layer2415.78.80.12
Layer31005.58.50.23
SXwell12Layer1126.512.30.23
Layer2196.513.40.27
Layer31006.911.90.11
TZwell3Layer11368.80.26
Layer2206.78.90.23
Layer3347.55.60.18
Layer410083.40.11

Appendix B

Table A2. Detailed information on weather data for each experimental site.
Solar RadiationJHLQLSLYNHPYSXTZ
Jan11.211.211.211.311.211.211.211.1
Feb12.111.711.712.112.711.612.512.2
Mar11.711.411.511.712.61212.412.3
April13.312.612.713.314.312.914.413.5
May13.91313.113.915.113.215.314.1
June13.112.612.613.114.113.214.113.4
July17.517.517.617.31918.617.618.5
Aug14.214.214.214.315.61514.615.4
Sep13.513.913.813.814.114.413.614.2
Oct14.214.714.614.314.214.713.714.4
Nov11.211.911.911.211.212.310.511.7
Dec8.99.29.28.98.89.68.69.1
Maximum Air TemperaturesJHLQLSLYNHPYSXTZ
Jan10.511.512.310.79.413.29.710.9
Feb12.212.713.412.410.713.611.511.7
Mar16.116.417.216.214.416.915.315
April21.921.522.422.119.621.321.419.7
May26.925.926.927.324.325.526.624.1
June29.328.129.129.827.228.229.427
July35.433.434.635.632.432.635.631.5
Aug34.332.933.934.83232.834.331.8
Sep29.729.230.130.228.129.929.628.9
Oct24.224.325.124.723.225.524.124
Nov18.719.220.11918.12118.419.2
Dec12.713.514.512.912.216.112.113.7
Minimum Air TemperaturesJHLQLSLYNHPYSXTZ
Jan1.622.82.21.96.11.74.5
Feb3.53.94.54.13.36.93.55.6
Mar8.18.28.98.57.3107.99.1
April13.112.813.513.611.91412.913.4
May18.517.818.719.217.419.118.418.8
June21.920.921.922.421.322.522.122.3
July25.623.724.826.12525.126.725.4
Aug25.924.325.326.325.225.826.626
Sep222122.122.42223.522.623.4
Oct15.615.316.216.216.118.916.218.2
Nov9.89.910.910.410.814.210.213.4
Dec4.24.55.44.64.79.14.47.5
Daily PrecipitationJHLQLSLYNHPYSXTZ
Jan19.521.721.419.719.82217.221.4
Feb20.121.821.620.619.322.315.821
Mar26.327.226.626.926.126.325.426.4
April24.826.125.825.324.423.923.124.7
May24.124.924.424.523.622.522.124
June2525.925.425.224.721.523.624.2
July14.71512.916.49.512.413.712.6
Aug15.816.917.21517.215.41516.5
Sep13.914.514.812.715.615.214.816.2
Oct7.67.78.27.18.16.57.47.6
Nov18.419.419.218.718.420.217.620.5
Dec2021.521.620.320.323.718.922.1

Appendix C

Table A3. The genetic coefficients and definitions for rice cultivar in the CERES-Rice model.
Genetic CoefficientsDefinitions
P1The growing degree-days in the basic vegetation phase
P20The critical photoperiod or the longest day length measured in hours, during which development occurred at a maximum rate
P2RThe extent of delay in panicle initiation, expressed in °C-days
P5The time period in °C-days from the beginning of grain filling to physiological with a base temperature of 9 °C in the grain filling phase
G1The potential spikelet numbers per panicle
G2The single grain weight
G3The coefficients relative to IR64 cultivars
G4The temperature tolerance coefficient

Appendix D

Table A4. Detailed information on the selected general circulation models (GCMs).
NameReleasing Institute
HadGEM2-ESMet Office Hadley Centre
IPSL-CM5A-LRInstitute Pierre-Simon Laplace
MIROC-ESM-CHEMJapan Agency for Marine-Earth Science and Technology, the Atmosphere and Ocean Research Institute (the University of Tokyo), and the National Institute for Environmental Studies
GFDL-ESM2MGeophysical Fluid Dynamics Laboratory
NorESM1-MNorwegian Climate Centre

References

  1. Solomon, S. IPCC (2007): Climate Change the Physical Science Basis. In Proceedings of the AGU Fall Meeting, San Francisco, CA, USA, 10–14 December 2007; pp. 123–124. [Google Scholar]
  2. Reinman, S.L. Intergovernmental Panel on Climate Change (IPCC). Encycl. Energy Nat. Resour. Environ. Econ. 2013, 26, 48–56. [Google Scholar]
  3. Field, C.B. Climate change 2014: Impacts, adaptation and vulnerability: Working Group II contribution to the fifth assessment report of the Intergovernmental Panel on Climate Change. Guangdong Agric. Sci. 2015, 285, 25987–25995. [Google Scholar]
  4. O’Neill, B.C.; Oppenheimer, M.; Warren, R.; Hallegatte, S.; Kopp, R.E.; Pörtner, H.O.; Scholes, R.; Birkmann, J.; Foden, W.; Licker, R. IPCC reasons for concern regarding climate change risks. Nat. Clim. Chang. 2017, 7, 28–37. [Google Scholar] [CrossRef]
  5. Giorgi, F.; Field, C.; Barros, V. IPCC Climate Change 2013: Impacts, Adaptation and Vulnerability: Key findings and lessons learned. In Proceedings of the EGU General Assembly Conference, Vienna, Austria, 27 April–2 May 2014. [Google Scholar]
  6. Piao, S.; Liu, Q.; Chen, A.; Janssens, I.A.; Fu, Y.; Dai, J.; Liu, L.; Lian, X.; Shen, M.; Zhu, X. Plant phenology and global climate change: Current progresses and challenges. Glob. Chang. Biol. 2019. [Google Scholar] [CrossRef]
  7. Vitasse, Y.; Signarbieux, C.; Fu, Y.H. Global warming leads to more uniform spring phenology across elevations. Proc. Natl. Acad. Sci. USA 2018, 115, 1004–1008. [Google Scholar] [CrossRef] [PubMed]
  8. Quan, S.; Li, Y.; Song, J.; Zhang, T.; Wang, M. Adaptation to Climate Change and its Impacts on Wheat Yield: Perspective of Farmers in Henan of China. Sustainability 2019, 11, 1928. [Google Scholar] [CrossRef]
  9. Rogelj, J.; Den Elzen, M.; Höhne, N.; Fransen, T.; Fekete, H.; Winkler, H.; Schaeffer, R.; Sha, F.; Riahi, K.; Meinshausen, M. Paris Agreement climate proposals need a boost to keep warming well below 2 C. Nature 2016, 534, 631–639. [Google Scholar] [CrossRef]
  10. First, P.J. Global Warming of 1.5 °C; An IPCC Special Report on the impacts of global warming of 1.5 °C above pre-industrial levels and related global greenhouse gas emission pathways, in the context of strengthening the global response to the threat of climate change, sustainable development, and efforts to eradicate poverty; IPCC: Geneva, Switzerland, 2018; 32p. [Google Scholar]
  11. Sheffield, J.; Wood, E.F. Projected changes in drought occurrence under future global warming from multi-model, multi-scenario, IPCC AR4 simulations. Clim. Dyn. 2008, 31, 79–105. [Google Scholar] [CrossRef]
  12. Parry, M.L.; Canziani, O.F.; Palutikof, J.P.; Linden, P.J.V.D.; Hanson, C.E. Summary for Policymakers. In Climate Change 2007: Impacts, Adaptation and Vulnerability; Contribution of Working Group II to the Fourth Assessment Report of the Intergovernmental Panel on Climate Change; Cambridge University Press: Cambridge, UK, 2007; Volume 37, p. 2407. [Google Scholar]
  13. Thornton, P.K.; Steeg, J.V.D.; Notenbaert, A.; Herrero, M. The impacts of climate change on livestock and livestock systems in developing countries: A review of what we know and what we need to know. Agric. Syst. 2009, 101, 113–127. [Google Scholar] [CrossRef]
  14. Countries, D. The Costs to Developing Countries of Adapting to Climate Change: New Methods and Estimates; World Bank: Washington, DC, USA, 2010. [Google Scholar]
  15. Qadermirza, M.M. Climate change and extreme weather events: Can developing countries adapt? Clim. Policy 2003, 3, 233–248. [Google Scholar]
  16. Babel, M.S.; Agarwal, A.; Swain, D.K.; Herath, S. Evaluation of climate change impacts and adaptation measures for rice cultivation in Northeast Thailand. Clim. Res. 2011, 46, 137–146. [Google Scholar] [CrossRef]
  17. Amiri, E.; Rezaei, M.; Rezaei, E.E.; Bannayan, M. Evaluation of Ceres-Rice, Aquacrop and Oryza 2000 Models in Simulation of Rice Yield Response to Different Irrigation and Nitrogen Management Strategies. J. Plant. Nutr. 2014, 37, 1749–1769. [Google Scholar] [CrossRef]
  18. Lemmer, J.A. Cleaning up Development: EIA in Two of the World’s Largest and Most Rapidly Developing Countries. Georget. Int. 2006, 19, 275. [Google Scholar]
  19. Andzio-Bika, H.L.W.; Wei, L.B. Agricultural productivity growth and technology progress in developing country agriculture: Case study in China. J. Zhejiang Univ. Sci. A 2005, 6, 172–176. [Google Scholar]
  20. Guo, Y.; Wu, W.; Bryant, C.R. Quantifying Spatio-Temporal Patterns of Rice Yield Gaps in Double-Cropping Systems: A Case Study in Pearl River Delta, China. Sustainability 2019, 11, 1394. [Google Scholar] [CrossRef]
  21. Zhou, Y.; Li, N.; Dong, G.; Wu, W. Impact assessment of recent climate change on rice yields in the Heilongjiang Reclamation Area of north-east China. J. Sci. Food Agric. 2013, 93, 2698–2706. [Google Scholar] [CrossRef] [PubMed]
  22. Xiong, W.; Holman, I.; Conway, D.; Lin, E.; Li, Y. A crop model cross calibration for use in regional climate impacts studies. Ecol. Model. 2008, 213, 365–380. [Google Scholar] [CrossRef]
  23. Zhang, J.; Feng, L.; Zou, H.; Liu, D.L. Using ORYZA2000 to model cold rice yield response to climate change in the Heilongjiang province, China. Crop. J. 2015, 3, 317–327. [Google Scholar] [CrossRef]
  24. CSY. National Bureau of Statistics of China; China Statistical Publishing House: Beijing, China, 2017.
  25. Singh, R.K.; Murty, H.R.; Gupta, S.K.; Dikshit, A.K. An overview of sustainability assessment methodologies. Ecol. Indic. 2009, 9, 189–212. [Google Scholar] [CrossRef]
  26. Jones, J.W.; Antle, J.M.; Basso, B.; Boote, K.J.; Conant, R.T.; Foster, I.; Godfray, H.C.J.; Herrero, M.; Howitt, R.E.; Janssen, S.; et al. Brief history of agricultural systems modeling. Agric. Syst. 2017, 155, 240–254. [Google Scholar] [CrossRef]
  27. Jones, J.W.; Antle, J.M.; Basso, B.; Boote, K.J.; Conant, R.T.; Foster, I.; Godfray, H.C.J.; Herrero, M.; Howitt, R.E.; Janssen, S.; et al. Toward a new generation of agricultural system data, models, and knowledge products: State of agricultural systems science. Agric. Syst. 2017, 155, 269–288. [Google Scholar] [CrossRef] [PubMed]
  28. Pezzuolo, A.; Basso, B.; Marinello, F.; Sartori, L. Using SALUS model for medium and long term simulations of energy efficiency in different tillage systems. Appl. Math. Sci. 2014, 8, 6433–6445. [Google Scholar] [CrossRef]
  29. Lin, E.; Xiong, W.; Ju, H.; Xu, Y.; Li, Y.; Bai, L.; Xie, L. Climate change impacts on crop yield and quality with CO2 fertilization in China. Philos. Trans. R. Soc. Lond. Ser. B Biol. Sci. 2005, 360, 2149–2154. [Google Scholar]
  30. Zhang, S.; Tao, F.; Zhang, Z. Uncertainty from model structure is larger than that from model parameters in simulating rice phenology in China. Eur. J. Agron. 2017, 87, 30–39. [Google Scholar] [CrossRef]
  31. Yao, F.; Xu, Y.; Lin, E.; Yokozawa, M.; Zhang, J. Assessing the impacts of climate change on rice yields in the main rice areas of China. Clim. Chang. 2007, 80, 395–409. [Google Scholar] [CrossRef]
  32. Xiong, W.; Conway, D.; Lin, E.; Holman, I. Potential impacts of climate change and climate variability on China’s rice yield and production. Clim. Res. 2009, 40, 23–35. [Google Scholar] [CrossRef]
  33. Yang, J.; Xiong, W.; Yang, X.; Cao, Y.; Feng, L. Geographic Variation of Rice Yield Response to Past Climate Change in China. J. Integr. Agric. 2014, 13, 1586–1598. [Google Scholar] [CrossRef]
  34. Skinner, M.W.; Kuhn, R.G.; Joseph, A.E. Agricultural land protection in China: A case study of local governance in Zhejiang Province. Land Use Policy 2001, 18, 329–340. [Google Scholar] [CrossRef]
  35. Wang, B.; Yang, X.S.; Zhang, B.; Zhang, C.Q.; Yang, Y.G.; Wei, B.; Le-Tu, G. Assessment of Ecosystem Services and Value of Coastal Wetlands in Zhejiang Province. Wetl. Sci. 2012, 10, 15–22. [Google Scholar]
  36. Ying, M.; Zhang, W.; Yu, H.; Lu, X.; Feng, J.; Fan, Y.; Zhu, Y.; Chen, D. An Overview of the China Meteorological Administration Tropical Cyclone Database. J. Atmos. Ocean. Technol. 2014, 31, 287–301. [Google Scholar] [CrossRef]
  37. Satapathy, S.S.; Swain, D.K.; Herath, S. Field experiments and simulation to evaluate rice cultivar adaptation to elevated carbon dioxide and temperature in sub-tropical India. Eur. J. Agron. 2014, 54, 21–33. [Google Scholar] [CrossRef]
  38. Jones, J.W.; Hoogenboom, G.; Porter, C.H.; Boote, K.J.; Batchelor, W.D.; Hunt, L.A.; Wilkens, P.W.; Singh, U.; Gijsman, A.J.; Ritchie, J.T. The DSSAT cropping system model. Eur. J. Agron. 2003, 18, 235–265. [Google Scholar] [CrossRef]
  39. Timsina, J.; Humphreys, E. Performance of CERES-Rice and CERES-Wheat models in rice–wheat systems: A review. Agric. Syst. 2006, 90, 5–31. [Google Scholar] [CrossRef]
  40. Lobell, D.B.; Ortiz-Monasterio, J.I. Regional importance of crop yield constraints: Linking simulation models and geostatistics to interpret spatial patterns. Ecol. Model. 2006, 196, 173–182. [Google Scholar] [CrossRef]
  41. Ahmed, M.; Akram, M.N.; Asim, M.; Aslam, M.; Hassan, F.; Higgins, S.; Stöckle, C.O.; Hoogenboom, G. Calibration and validation of APSIM-Wheat and CERES-Wheat for spring wheat under rainfed conditions: Models evaluation and application. Comput. Electron. Agric. 2016, 123, 384–401. [Google Scholar] [CrossRef]
  42. Yao, F.; Xu, Y.; Feng, Q.; Lin, E.; Yan, X. Simulation and validation of CERES–rice model in main rice ecological zones in China. Acta Agron. Sin. 2005, 31, 545–550. [Google Scholar]
  43. Lewis, S.E.; Rice, A.; Hurst, G.D.D.; Baylis, M. First detection of endosymbiotic bacteria in biting midges Culicoides pulicaris and Culicoides punctatus, important Palaearctic vectors of bluetongue virus. Med. Vet. Entomol. 2015, 28, 453–456. [Google Scholar] [CrossRef]
  44. Yong, X.Y.H.X.Z.; Erda, L.W.L. Statistical Analyses of Climate Change Scenarios over China in the 21st Century. Adv. Clim. Chang. Res. 2006, 2, 50–53. [Google Scholar]
  45. Wan, K.K.W.; Tang, H.L.; Yang, L.; Lam, J.C. An analysis of thermal and solar zone radiation models using an Angstrom–Prescott equation and artificial neural networks. Energy 2008, 33, 1115–1127. [Google Scholar] [CrossRef]
  46. Lewis, G. The utility of the Angstrom-type equation for the estimation of global irradiation. Sol. Energy 1989, 43, 297–299. [Google Scholar] [CrossRef]
  47. Esteves, M.; Román-Paoli, E.; Beaver, J.S.; Muñoz, M.A.; Armstrong, A. Genetic coefficient determination for three maize cultivars and one hybrid. J. Agric. Univ. P.R. 2012, 96, 57–75. [Google Scholar]
  48. Rosenzweig, C.; Elliott, J.; Deryng, D.; Ruane, A.C.; Müller, C.; Arneth, A.; Boote, K.J.; Folberth, C.; Glotter, M.; Khabarov, N. Assessing agricultural risks of climate change in the 21st century in a global gridded crop model intercomparison. Proc. Natl. Acad. Sci. USA 2014, 111, 3268–3273. [Google Scholar] [CrossRef] [PubMed]
  49. Van Vuuren, D.P.; Riahi, K.; Moss, R.; Edmonds, J.; Thomson, A.; Nakicenovic, N.; Kram, T.; Berkhout, F.; Swart, R.; Janetos, A.; et al. A proposal for a new scenario framework to support research and assessment in different climate research communities. Glob. Environ. Chang. 2012, 22, 21–35. [Google Scholar] [CrossRef]
  50. Moss, R.H.; Edmonds, J.A.; Hibbard, K.A.; Manning, M.R.; Rose, S.K.; van Vuuren, D.P.; Carter, T.R.; Emori, S.; Kainuma, M.; Kram, T.; et al. The next generation of scenarios for climate change research and assessment. Nature 2010, 463, 747–756. [Google Scholar] [CrossRef] [PubMed]
  51. Kadiyala, M.D.M.; Jones, J.W.; Mylavarapu, R.S.; Li, Y.C.; Reddy, M.D. Identifying irrigation and nitrogen best management practices for aerobic rice–maize cropping system for semi-arid tropics using CERES-rice and maize models. Agric. Water Manag. 2015, 149, 23–32. [Google Scholar] [CrossRef]
  52. He, J.; Jones, J.W.; Graham, W.D.; Dukes, M.D. Influence of likelihood function choice for estimating crop model parameters using the generalized likelihood uncertainty estimation method. Agric. Syst. 2010, 103, 256–264. [Google Scholar] [CrossRef]
  53. Chai, T.; Draxler, R.R. Root mean square error (RMSE) or mean absolute error (MAE)? Geosci. Model. Dev. 2014, 7, 1247–1250. [Google Scholar] [CrossRef]
  54. Li, Y.; Wu, W.; Ge, Q.; Zhou, Y.; Xu, C. Simulating Climate Change Impacts and Adaptive Measures for Rice Cultivation in Hunan Province, China. J. Appl. Meteorol. Climatol. 2016, 55, 1359–1376. [Google Scholar] [CrossRef]
  55. Birch, E.L. A Review of “Climate Change 2014: Impacts, Adaptation, and Vulnerability” and “Climate Change 2014: Mitigation of Climate Change”. J. Am. Plan. Assoc. 2014, 80, 184–185. [Google Scholar] [CrossRef]
  56. Morris, M.D. Factorial sampling plans for preliminary computational experiments. Technometrics 1991, 33, 161–174. [Google Scholar] [CrossRef]
  57. Porter, J.D. Method for Rapidly Propagating a Fast Edge of an Output Signal through a Skewed Logic Device. U.S. Patent 6972589B2, 6 December 2005. [Google Scholar]
  58. Ewert, F.; Rötter, R.; Brüser, K. CropM: Understanding and Modelling Impacts of Climate Change on Crop Production. FACCE MACSUR Rep. 2015, 6, 6-2. [Google Scholar]
  59. Kapetanaki, G.; Rosenzweig, C. Impact of climate change on maize yield in central and northern Greece: A simulation study with CERES-Maize. Mitig. Adapt. Strateg. Glob. Chang. 1997, 1, 251–271. [Google Scholar] [CrossRef]
  60. Lashkari, A.; Alizadeh, A.; Rezaei, E.E.; Bannayan, M. Mitigation of climate change impacts on maize productivity in northeast of Iran: A simulation study. Mitig. Adapt. Strateg. Glob. Chang. 2012, 17, 1–16. [Google Scholar] [CrossRef]
  61. Jamieson, P.D.; Porter, J.R.; Wilson, D.R. A test of computer simulation model ARC-WHEAT1 on wheat crops grown in New Zealand. Field Crop Res. Field Crop. Res. 1991, 27, 337–350. [Google Scholar] [CrossRef]
  62. Buan, R.D.; Maglinao, A.R.; Evangelista, P.P.; Pajuelas, B.G. Vulnerability of rice and corn to climate change in the Philippines. Water Air Soil Pollut. 1996, 92, 41–51. [Google Scholar]
  63. Zhang, S.; Tao, F. Modeling the response of rice phenology to climate change and variability in different climatic zones: Comparisons of five models. Eur. J. Agron. 2013, 45, 165–176. [Google Scholar] [CrossRef]
  64. Osborne, T.; Rose, G.; Wheeler, T. Variation in the global-scale impacts of climate change on crop productivity due to climate model uncertainty and adaptation. Agric. For. Meteorol. 2013, 170, 183–194. [Google Scholar] [CrossRef]
  65. Baker, J.T.; Boote, K.J.; Allen, L.H. Potential Climate Change Effects on Rice: Carbon Dioxide and Temperature. Clim. Chang. Agric. Anal. Potential Int. Impacts 1995. [Google Scholar] [CrossRef]
  66. Snyder, A.M. Effects of Elevated Carbon Dioxide and Temperature on two Cultivars of Rice. Master’s Thesis, University of Florida, Gainesville, FL, USA, 2000. [Google Scholar]
  67. Xu, C.C.; Wu, W.X.; Ge, Q.S.; Zhou, Y.; Lin, Y.M.; Li, Y.M. Simulating climate change impacts and potential adaptations on rice yields in the Sichuan Basin, China. Mitig. Adapt. Strateg. Glob. Chang. 2015, 22, 565–594. [Google Scholar] [CrossRef]
  68. Li, S.; Wang, Q.; Chun, J.A. Impact assessment of climate change on rice productivity in the Indochinese Peninsula using a regional-scale crop model. Int. J. Climatol. 2017, 37, 1147–1160. [Google Scholar] [CrossRef]
  69. Krishnan, P.; Swain, D.K.; Chandra Bhaskar, B.; Nayak, S.K.; Dash, R.N. Impact of elevated CO2 and temperature on rice yield and methods of adaptation as evaluated by crop simulation studies. Agric. Ecosyst. Environ. 2007, 122, 233–242. [Google Scholar] [CrossRef]
  70. Droogers, P.; Dam, J.V.; Hoogeveen, J.; Loeve, R.; Aerts, J.C.J.H.; Droogers, P. Adaptation strategies to climate change to sustain food security. In Climate Change Contrasting River Basins; CABI: Oxfordshire, UK, 2004; pp. 49–73. [Google Scholar]
  71. Aggarwal, P.K.; Mall, R. Climate change and rice yields in diverse agro-environments of India. II. Effect of uncertainties in scenarios and crop models on impact assessment. Clim. Chang. 2002, 52, 331–343. [Google Scholar] [CrossRef]
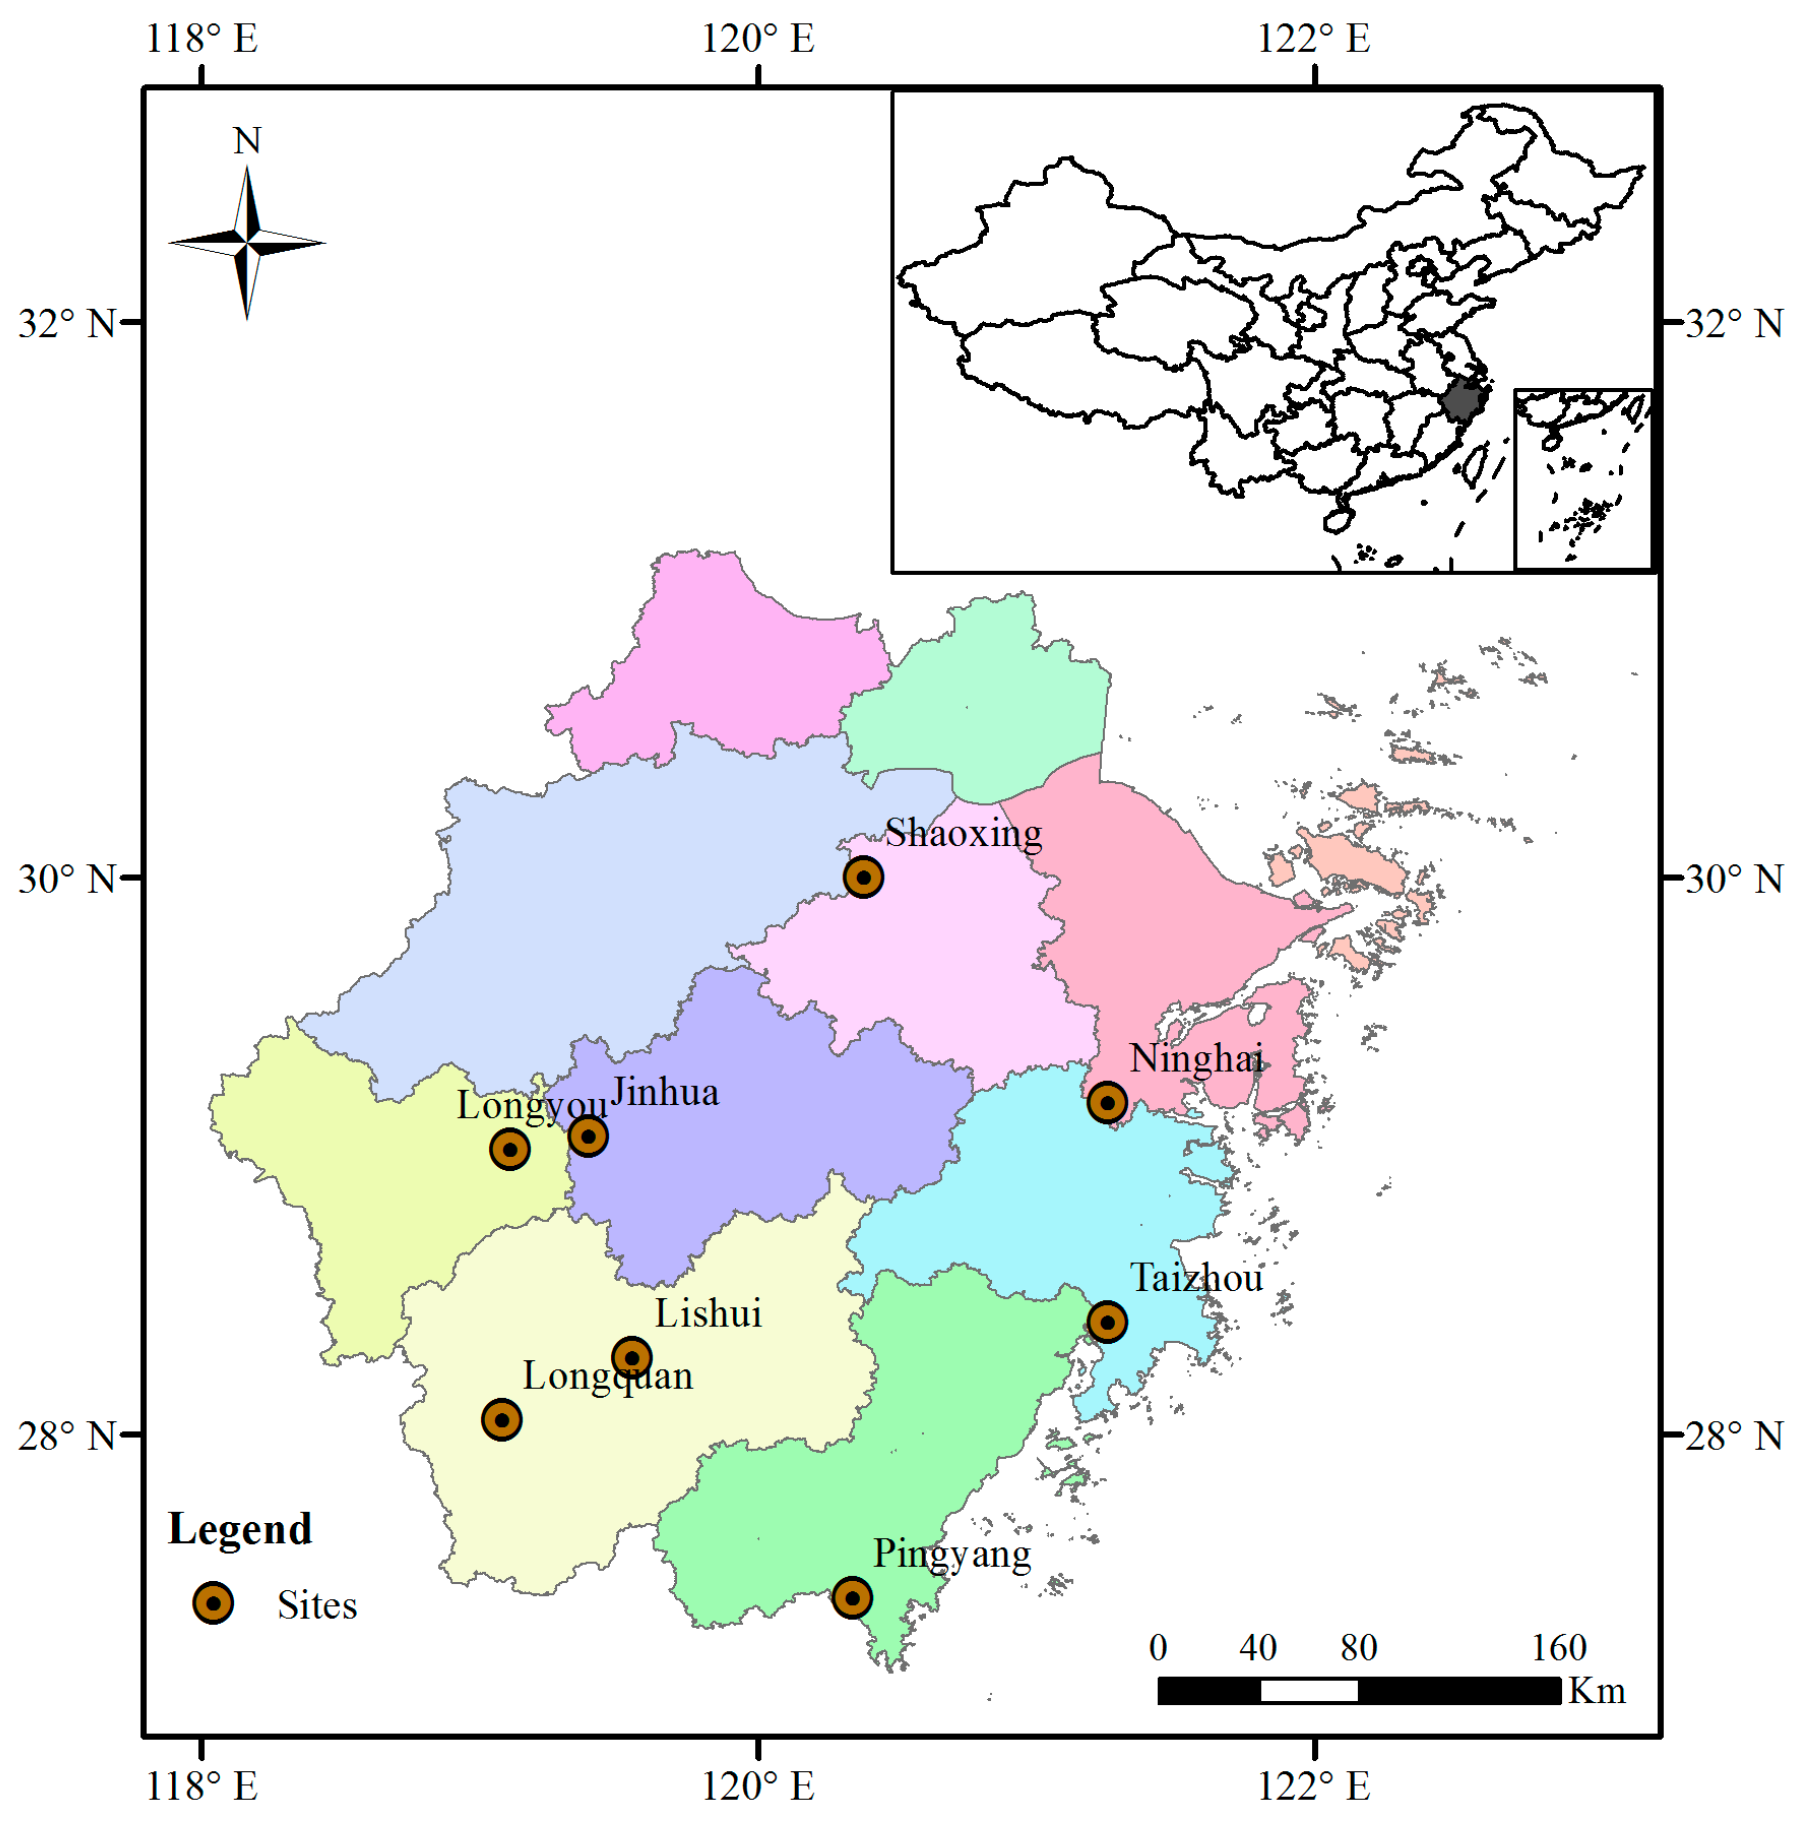
Figure 1. Locations of selected Chinese agrometeorological experimental stations in the Zhejiang province.
Sustainability 11 02372 g001
Figure 2. Global carbon dioxide (CO2) concentration and emission for each representative concentration pathway (RCP) scenario (2.6, 4.5, 6.0, and 8.5) from the years 1980 to 2100. (a) Description of changing CO2 concentrations; (b) description of changing CO2 emissions.
Sustainability 11 02372 g002
Figure 3. General framework of the simulations used to determine the impacts of climate change.
Sustainability 11 02372 g003
Figure 4. Simulated and observed flowering period, maturation period, and yields at all sites. (a) Calibration results for the flowering period; (b) calibration results for the maturation period; and (c) calibration results for the rice yields.
Sustainability 11 02372 g004
Figure 5. Comparison of the change in flowering periods between (a) RCP4.5 and (b) RCP8.5. The numbers on the x-axis represent the rice cultivars, and those on the y-axis represent the change in flowering days.
Sustainability 11 02372 g005
Figure 6. Comparison of the change in maturation periods between (a) RCP4.5 and (b) RCP8.5. The numbers on the x-axis represent the rice cultivars, and those on the y-axis represent the change in days of maturation.
Sustainability 11 02372 g006
Figure 7. Simulated rice yields compared with those for the baseline in the 2020s, 2050s, and 2080s under scenarios (a) RCP4.5 and (b) RCP8.5.
Sustainability 11 02372 g007
Figure 8. Future rice yields at each site, with future weather generated from a single general circulation model (GCM) for scenarios (a) RCP4.5 and (b) RCP8.5.
Sustainability 11 02372 g008
Figure 9. Change in rice yields in the 2080s under RCP8.5 at the (a) SX and (b) PY sites. The pluses and minuses on the horizontal ordinate represent the change in planting dates relative to the baseline date.
Sustainability 11 02372 g009
Figure 10. Maximum temperature in the 2080s under the RCP8.5 at sites (a) SX and (b) PY. The pluses and minuses on the horizontal ordinate represent the change in planting dates relative to the baseline date.
Sustainability 11 02372 g010
Figure 11. Change in rice yields when the parameters were changed: (a) P1 for SX, (b) P1 for PY, (c) G1 for SX, (d) G1 for PY, (e) G2 for SX, and (f) G2 for PY.
Sustainability 11 02372 g011
Table 1. Detailed descriptions of selected Chinese agrometeorological experimental stations (CAES) in the study area 1.
CAES LatitudeLongitudeAltitudeCultivarCropping SystemSelected Years
Jinhua29.07119.3963Jinzao47Early-maturation2001 2004 2006
Lishui28.27119.5561Jinzao48Early-maturation2004 2005 2009
Longquan28.05119.08198Weiyou42Early-maturation1999 2000 2005
Longyou29.02119.1166Zhongzu1Early-maturation2000 2001 2003
Ninghai29.19121.2639Jiayu293Early-maturation2000 2001 2002
Pingyang27.41120.345Zhongsi2Early-maturation2002 2003 2004
Shaoxing30.00120.387Jiayu296Early-maturation2003 2004 2005
Taizhou28.40121.261Jiazao95Early-maturation1999 2000 2001
Lishuilate28.27119.5561Fu000092Late-maturation2000 2001 2002
Taizhoulate28.40121.261Xieyou94Late-maturation2000 2003 2007
Longyoulate29.02119.1166Xieyou46Late-maturation2000 2001 2002
1 Years in boldface indicate the year selected for calibration, and the other years indicate the years selected for validation for each specific rice cultivar in one site.
Table 2. Estimated genetic coefficients for each rice cultivar 1.
SiteCodeCultivarSeasonalP1P2RP5P2OG1G2G3G4
JinhuaJHJinzao47Early-mature2264959611.72690.0280.771
LishuiLSJinzao48Early-mature2306559611.73200.02811
LongquanLQWeiyou42Early-mature12516040011.7650.027511
LongyouLYZhongzu1Early-mature14513040011.72650.029511
ShaoxingSXJiayu296Early-mature1066869611.72850.0280.61
NinghaiNHJiayu293Early-mature1463859611.72690.0280.771
PingyangPYZhongsi2Early-mature1463859611.72690.0280.771
TaizhouTZJiazao95Early-mature1264859611.72690.02811
LishuiLSLFu000092Late-mature2206359611.73200.02811
LongyouLYLXieyou46Late-mature14513040011.72650.029511
TaizhouTZLXieyou94Late-mature1164849611.72690.02811
1 The code is an abbreviation for the site name. The final L differentiates a late-maturation site from an early-maturation site.
Table 3. Comparison of the change in climatic variables under RCP4.5 and 8.5 respectively 1.
Period Δ T ¯ ( ) Δ P ¯ ( % ) Δ R ¯ ( % ) CO2
RCP4.5RCP8.5RCP4.5RCP8.5RCP4.5RCP8.5RCP4.5RCP8.5
2020s0.180.201.011.072.612.54411.13415.78
2050s1.181.622.333.142.132.00486.54540.54
2080s1.281.873.035.342.501.67531.14844.81
1 Δ T ¯ , Δ P ¯ , Δ R ¯ , and CO2 represent the average change in temperature, precipitation, and solar radiation, respectively.
Table 4. Future (2080s) rice yields under scenario RCP8.5, with and without the CO2 fertilization effects, at all sites compared with the baseline period.
SiteWith CO2
Fertilization Effects (%)
Without CO2
Fertilization Effects (%)
JH−3.99−34.83
LS−2.96−31.97
LQ−6.52−31.34
LY−1.75−9.10
SX−20.64−34.31
NH−13.35−17.17
PY−24.10−33.45
TZ−19.92−45.37
LS−0.465−36.86
LYL−17.94−46.58
TZL−10.61−15.74
Table 5. Averages of climate change variables (radiation, temperature, and precipitation) during the 2020s, 2050s, and 2080s under RCP8.5 at sites PY, SX, and LYL.
VariableMonthPYSXLYL
2020s2050s2080s2020s2050s2080s2020s2050s2080s
RadiationMarch12.913.613.714.214.514.713.413.813.9
April13.113.514.214.815.515.813.714.414.8
May12.412.712.913.914.314.912.813.113.6
June15.715.715.914.714.814.914.414.614.7
TemperatureMarch16.715.516.418.617.218.219.818.419.3
April21.521.422.323.323.724.42525.926.8
May25.626.727.427.428.729.229.13131.5
June28.729.830.330.332.232.332.134.634.8
PrecipitationMarch25.524.126.324.924.826.725.324.526
April24.223.625.523.72325.32221.924.6
May2222.525.122.520.823.721.420.623.9
June21.324.626.222.723.1252222.724.2
Table 6. The most suitable genetic coefficients for rice cultivars at sites SX and PY.
SiteP1P2RP5P20G1G2G3G4
SX9006869611.71700.0280.601.00
PY5463859611.72000.0280.771.00